Article

The Ecological Footprint of COVID-19 mRNA Vaccines: Estimating Greenhouse Gas Emissions in Germany

1
Department MBUT, Technical University of Applied Sciences (OTH), Kaiser-Wilhelm-Ring 23, 92224 Amberg, Germany
2
Analytic Services, Jahnstr. 34c, 80469 München, Germany
3
St. Bernward GmbH, Friedrich-Kirsten-Str. 40, 22391 Hamburg, Germany
*
Author to whom correspondence should be addressed.
Int. J. Environ. Res. Public Health 2021, 18(14), 7425; https://doi.org/10.3390/ijerph18147425
Submission received: 10 June 2021 / Revised: 8 July 2021 / Accepted: 9 July 2021 / Published: 12 July 2021
(This article belongs to the Section Environmental Science and Engineering)

Abstract

:
Compared to the medical, economic and social implications of COVID-19 vaccinations, little attention has been paid to the ecological balance to date. This study is an attempt to estimate the environmental impact of two mRNA vaccines in terms of CO2 equivalents with respect to their different freezing strategies and supply chain organization. Although it is impossible to accurately calculate the actual environmental impact of the new biochemical synthesis technology, it becomes apparent that transport accounts for up to 99% of the total carbon footprint. The emissions for air freight, road transportation and last-mile delivery are nearly as 19 times the emissions generated from ultra-deep freeze technologies, the production of dry ice, glass and medical polymers for packaging. The carbon footprint of a single mRNA vaccine dose injected into a patient is about 0.01 to 0.2 kg CO2 equivalents, depending on the cooling technology and the logistic routes to the vaccination sites in Germany.

1. Introduction

Compared to the medical and economic challenges raised by the pandemic in high-, middle and low-income countries [1], the environmental impact of vaccination programs appears to be a secondary concern. However, misinformation, misrepresentations and various rumors spread by vaccination critics have prompted us to assess the impact of COVID-19 vaccines on climate. The authors are aware that a comprehensive in-depth ecological analysis of the entire process chain from the raw materials to the end user is hardly feasible. Therefore, this analysis focuses on estimating the carbon footprint [2,3] of packaging, distribution and cold chain storage [4,5,6,7] of messenger RNA (mRNA) vaccines. The temporary recovery of global energy demands, carbon and NOx emissions during the lockdown measures [8,9,10,11] has not been considered.
The groundbreaking mRNA vaccines require multiple highly purified ingredients and complex process steps with yet unknown ecologically relevant material flows and waste streams. RNA production is based on DNA plasmids as templates on which mRNA is built. This new approach is much faster than normal vector vaccine production using infected animal cell cultures or chicken eggs, which take several weeks to incubate. Vector vaccines require living cells while RNA manufacturing is a biochemical process. The enzyme RNA polymerase synthesizes the ribonucleotides that represent the building blocks G, A, U and C of the desired mRNA strand. Co-formulation of the sensitive mRNA molecules into different lipid nanoparticles (e.g., fatty acid esters of tertiary amines, lecithins, cholesterol) facilitates their uptake into cells. Instead of applying a weakened copy of the coronavirus, mRNA strands instruct the body’s immune system cells to develop antibodies against the spike protein of SARS-CoV-2.
BioNTech BNT162b2 [12,13] is an aqueous concentrate that must be diluted with physiological saline before intramuscular injection. The other ingredients, potassium chloride, sodium chloride, phosphates and sucrose, adjust to a suitable pH and protect the vaccine during the freezing process. The preparation is free of adjuvants or preservatives. One injection vial containing 0.45 mL of concentrate is diluted with 1.8 mL of saline after thawing to obtain ready-to-use 2.25 mL of liquid for six doses of 0.3 mL each (30 µg of active ingredient). An interrupted cold chain, vigorous shaking of diluted vaccine doses and mechanically improper injection will damage the mRNA and weaken the effect of the vaccine [14]. Two injections three to six weeks apart are required to ensure full immunization. The vaccine is manufactured in the United States, Belgium (Puurs) and Germany (Marburg, Mainz, Idar-Oberstein). The frozen undiluted vaccine is required to be stored at temperatures between −80 and −60 °C for up to 6 months. The ultra-low temperature vaccine is delivered directly from BioNTech to wholesalers (−25 to −15 °C for up to 2 weeks), where it is temporarily stored, thawed and delivered to pharmacies refrigerated at 2–8 °C (up to 1 month). At general practitioner offices, the vaccine must be diluted for use within 2 to 6 h (2–25 °C).
The Moderna mRNA-1273 vaccine [15,16] is intended to be administered as two 0.5 mL doses given by intramuscular injection four to six weeks apart. The vaccine contains the modified mRNA, lipids (such as SM-102, polyethylene glycol, cholesterol, phosphocholine derivatives), pH regulators (tromethamine, sodium acetate an others) and sucrose [17]. The vaccine is manufactured at facilities in Portsmouth (GB), New Hampshire (USA) and Visp in Switzerland. Bottling and packaging of the vials takes place in the USA and Spain. Undiluted frozen vials of Moderna vaccine can be transported and stored at −25 to −15 °C for up to four months. Storage at 2–8 °C is possible for up to thirty days. At room temperature, the vaccine must be used within 6 to 12 h (8–25 °C).
Adenovirus vector vaccines have not been further analyzed in this study as they do not require deep and ultra-deep freeze technologies.

2. Methodology

The complete environmental impact of the COVID-19 pandemic is unlikely to be quantifiable in the near future. Therefore, a comparison of packaging, transport routes and cold chains for different mRNA vaccines is calculated based on generally accepted CO2 equivalent values. This might answer the question to what extent mRNA vaccines actually generate greenhouse gases and plastic waste.
Germany, the largest vaccination market in Europe, was chosen to calculate the environmental impact of the transport sector. Distances for air freight and road transportation were assumed to cover all process steps from manufacture to the end user. Details on the last-mile simulation are given in Section 3.4.

3. Results and Discussion

3.1. Production, Sterilization and Waste

Differences in the biochemical production of the various mRNA vaccines are likely, but could not be quantified in this study due to lack of publicly available data. According to BioNTech, 50,000 steps are required to produce the vaccine from the mRNA to the bulk drug substance [18], making it impossible to reliably estimate the carbon footprint. Negative environmental impacts of mRNA vaccination include the manufacturing, use and disposal of polymers and glass, the use of dry ice and freezers and the CO2 emissions from the trucks and aircraft needed to deliver the vaccines to millions of patients. Table 1 compiles the data available from the literature to estimate energy expenditures. Carbon footprints in kg CO2 equivalents per kg product are in the order of magnitude of (e.g., [19]): 0.07 (steel), 0.3… 0.4 (glass), 0.26…1 (mixed plastics), 0.6… 1.9 (beer), 2.1 (biodiesel), 0.3… 6.3 (biopolymers), 6 (milk powder), 1.8… 11 (aluminum cans), 6… 11 (coffee), 10… 100 (beef) and 52… 572 (biotechnological silk protein).

3.1.1. Pharmaceutical Residues

Waste prevention fulfills one of the twelve principles of green chemistry. Sheldon’s environmental factor (E = kg waste/kg product) [20,21] places a high value on waste elimination and the avoidance of hazardous substances in organic synthesis. While oil refining generates the highest annual tonnages of waste (E < 0.1), pharmaceutical processes have the largest mass difference between raw materials and high-quality end products (E up to 100 and more). The main challenge with E-factors is that deep knowledge of all stages of the production and product life-cycle is required. Considering the quantities used, the pharmaceutical sector produces a much lower tonnage of waste than any other industry.
Medical waste [22] is growing due to syringes, ampoules, masks, protective suits and shields used in vaccination campaigns. Typically, polypropylene is used for syringes and N-95 masks, and polyethylene for protective suits, gloves and medical face shields. Cyclic olefin polymer (COP) [23] can replace polypropylene and produces the least amount of ash after combustion. Measured against commercial and municipal waste, the additional garbage of a temporary vaccination campaign appears to be insignificant, especially since there are functioning recycling channels for used paper, glass and plastic [24]. However, only 1% of the world’s polypropylene is recycled, and most of it ends up in landfills [25]. In Wuhan (China), for example, during the time of the COVID-19 outbreak, medical waste abruptly increased by 190 t (to 240 t) per day [26]. Unfortunately, the SARS-CoV-2 virus can exist on cardboard for one day and on plastics and steel for up to three days [27], requiring additional waste sorting. Since BNT162b2 contains six doses per vial, and mRNA-1273 contains ten doses in a larger vial, the difference in the eco-balance in terms of glass and medical waste is small, especially as glass vials can be recycled.

3.1.2. Sterilization

Large energy savings result from energy-efficient equipment used to produce injection-grade water in sterile filling plants. To remove ions, chlorine, particles and endotoxins, the water is filtered, deionized and distilled in clean rooms.

3.1.3. Disinfectants

The ecological impact of disinfectants was not considered [28].

3.2. Freezing and Storage

The COVID-19 vaccine cold chain includes (1) shipping from production facilities to medical trials and drug manufacturers by truck, (2) high-volume refrigerated shipments to global distribution centers by aircraft, (3) distribution to thousands of regional healthcare facilities by truck, and (4) distribution to local healthcare facilities by courier services. Figure 1 illustrates the delivery process of the last mile in Germany (for details, see Section 3.4) The cold chain requires both freezer capacity at the storage and distribution centers and special packaging to maintain the extremely low temperatures between the storage centers.

3.2.1. Dry Ice

Vaccines that must be kept at specific temperatures, either between −20 °C and −80 °C or between 2 °C and 8 °C, from the time of filling in the factory to the end user require temperature-controlled packaging, some of which require dry ice as a refrigerant. Dry ice or ‘carbonic acid snow’ is the solid, frozen form of carbon dioxide (−78.5 °C) for shipping biologics without electrical refrigeration units. It sublimates directly from solid to vapor and leaves no residue that could damage packaging or cargo. Compressed CO2 in gas cylinders is liquid above 58 bar (20 °C, 0.766 g/cm3) and condenses as dry ice when it flows out. The energy required for production of liquid CO2 in a refrigeration plant amounts to 0.2 … 0.55 kWh/kg; dry ice from CO2 requires 0.17 … 0.32 kWh/kg [38].
Today, carbon dioxide as an industrial gas comes mainly from processed exhaust gases and natural fermentation processes in breweries. Dry ice is derived from CO2 generated during ethanol production and the refining of petroleum into gasoline and the combustion of natural gas to produce ammonia, e.g., for fertilizers. CO2 waste is generated by burning coke or natural gas (C + O2 → CO2), carbon monoxide conversion (CO + H2O → CO2), calcination of lime (CaCO3 → CaO + CO2) and gas purification with ethanolamine (CO + RNH2 + H2O → RNH3HCO3).
The capture and use of CO2 are more or less climate neutral or at least reduce the amount of waste CO2 released into the atmosphere. Dry ice accounts for about 20% of the CO2 demand in the USA, with an increasing trend from home delivery of frozen foods [39].
As a rule of thumb, 2.3 to 4.5 kg of dry ice sublime every 24 h, depending on the density of the expanded polystyrene foam container [40]. Commercial dry ice boxes have low loss rates of about 1.4 to 5 g/h per liter of volume. Payloads of up to 80 L can be safely stored below −20 °C for 100 h by passive temperature control with vacuum insulation panels.
The production and use of dry ice have a minor impact on the carbon footprint. Dry ice storage does not necessarily have to be a significant energetic disadvantage in every case. Ultra-cooling at −70 °C adds about 0.1 kg CO2 equivalents per dose to the CO2 balance (see Table 2). Inefficient freezer units and refrigerators shift the CO2 balance unfavorably. Refrigerators with poor efficiency cause more emissions than efficient central refrigeration units.

3.2.2. Refrigerators

Fluorocarbons in refrigerators, which deplete the ozone layer and have a high global warming potential, have largely been replaced by less harmful hydrocarbons in recent decades. Since the refrigeration units are hermetically sealed, the risk of additional HFC pollution from the use of COVID-19 vaccines appears to be negligible. However, cold storage and long-distance transport do not align with the EU’s Green Deal goal of becoming climate neutral by 2050.
For ultra-cold storage of vaccines (−20 °C to −80 °C), portable and stationary cryostats have been developed. Ultra-cooling units of older designs are less effective (see Table 2).

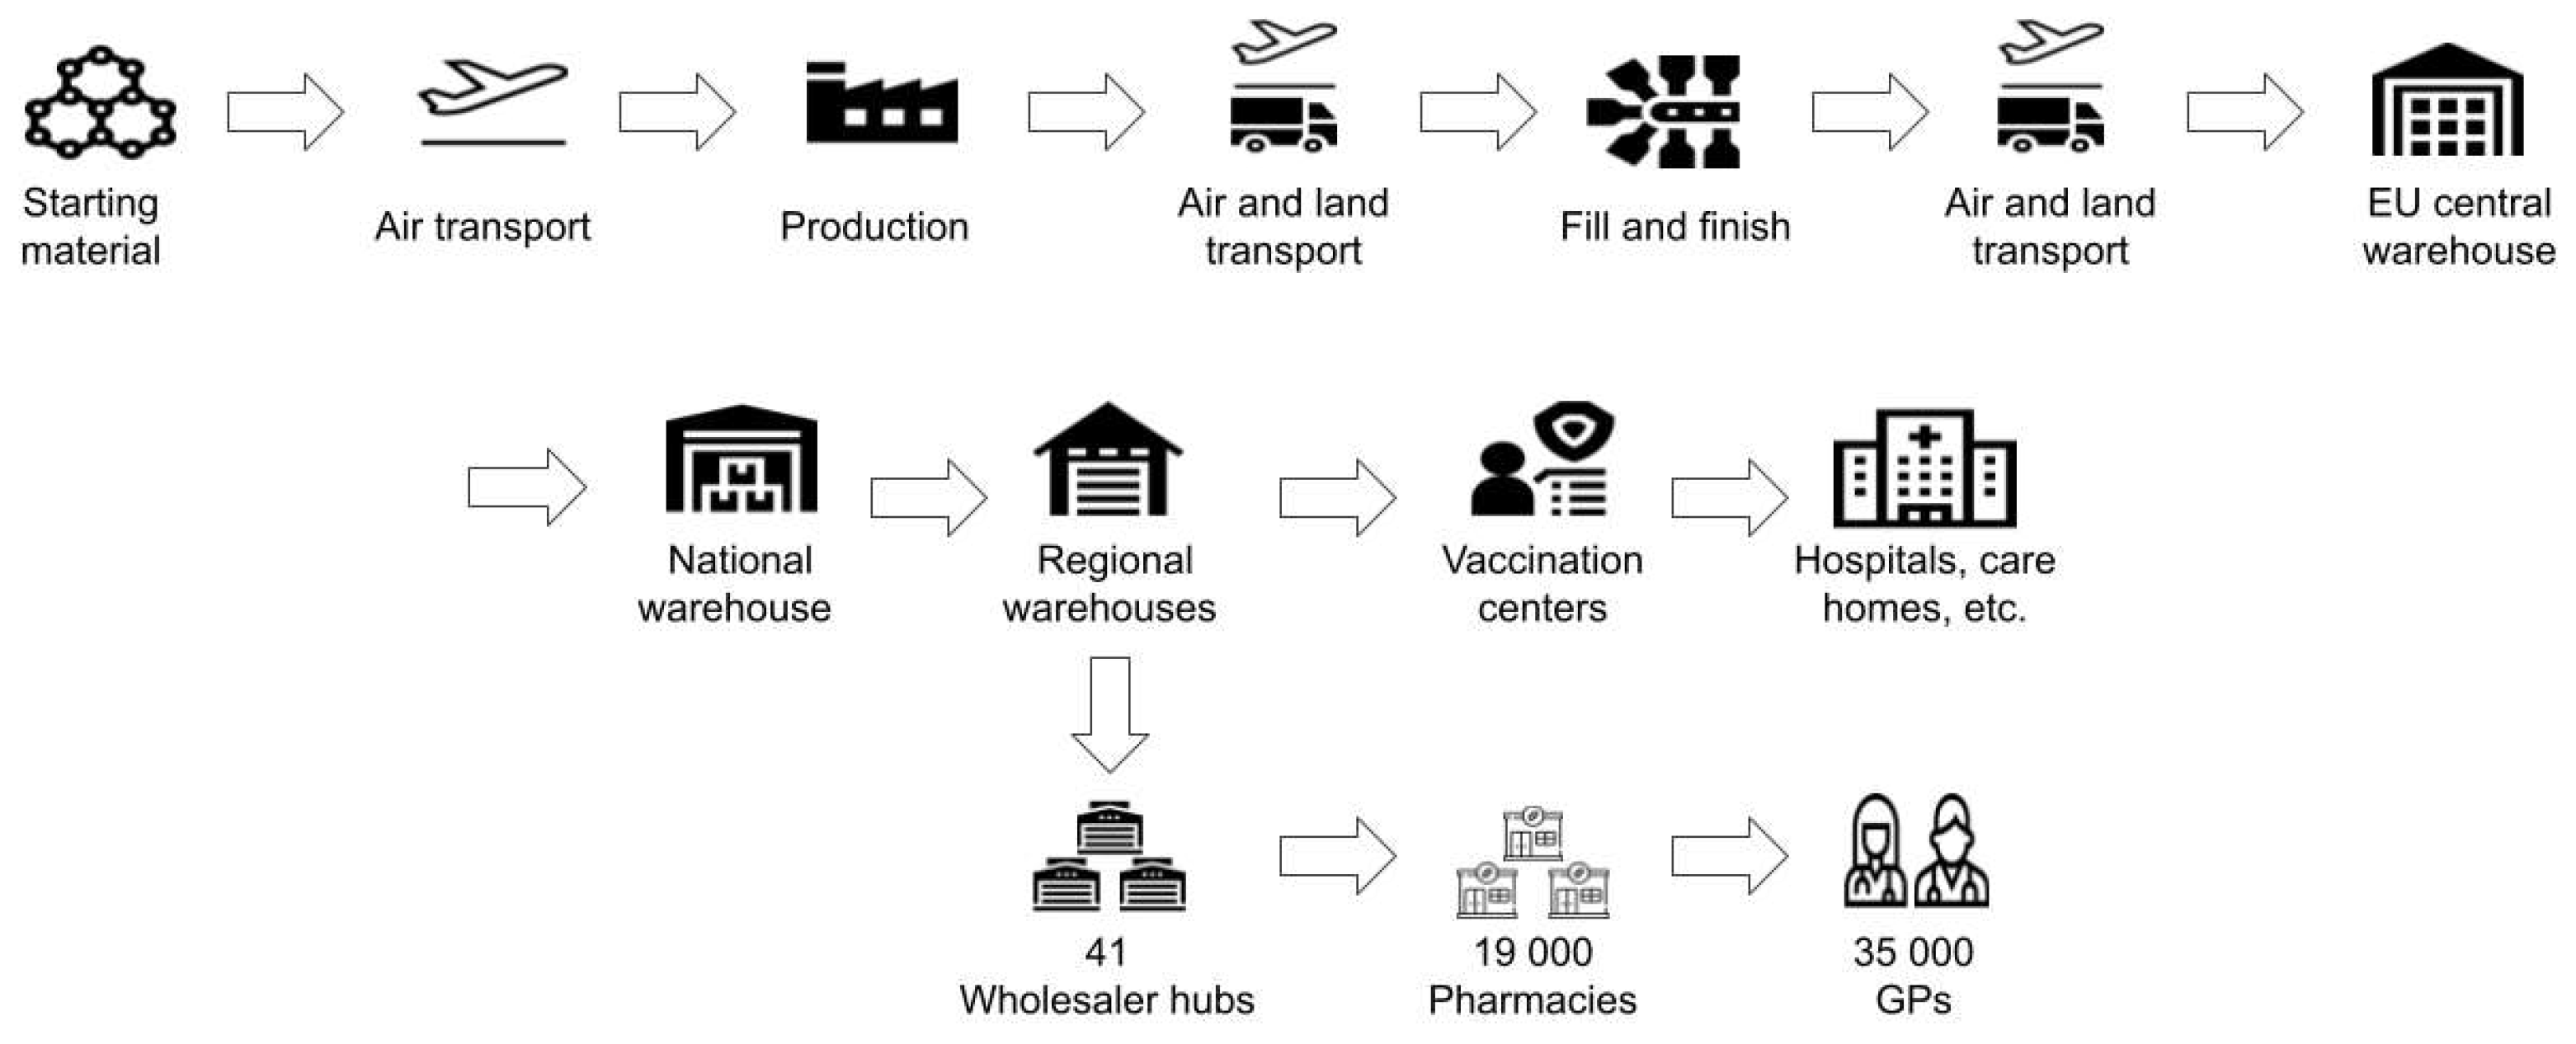
3.3. Transportation and Logistics

The International Air Transport Association (IATA) [45] estimates that more than eight thousand cargo aircraft loads are needed to deliver one single vaccine dose to 7.8 billion people worldwide. In Central Europe, however, the majority of vaccines can be transported by land. The environmental costs of transportation [46] from the CO2-emitting planes and trucks needed to distribute vaccines from factories to wholesalers, vaccination centers and doctors’ offices to millions of people appear to account for most of the COVID-19 footprint.
Based on the assumptions in Table 1 and Table 3, the immense influence of transport routes on the carbon footprint becomes evident. Combustion of 1 kg of octane produces 3.088 kg of CO2. The CO2 equivalent includes greenhouse gases, carbon monoxide, volatile hydrocarbons, nitrogen oxides and particulates. CO2 emissions of air travel are based on fuel consumption per person, depending on the distance from takeoff to landing, aircraft type, seating, load factor and cargo carried. One kilogram of kerosene generates around 3.15 kg of CO2. Climate-relevant nitrogen oxides and particulate emissions are converted to the climate impact of CO2. The radiative forcing index (RFI = 3 to 4) according to the IPCC weighs the theoretically emitted amount of CO2 to represent the combustion mixture in the engine. The increased climate impact (contrails, ozone layer) of long-haul flights of 400 km or more at altitudes above 9 km counts as a factor of 3.0 compared to short-haul flights (RFI = 1).

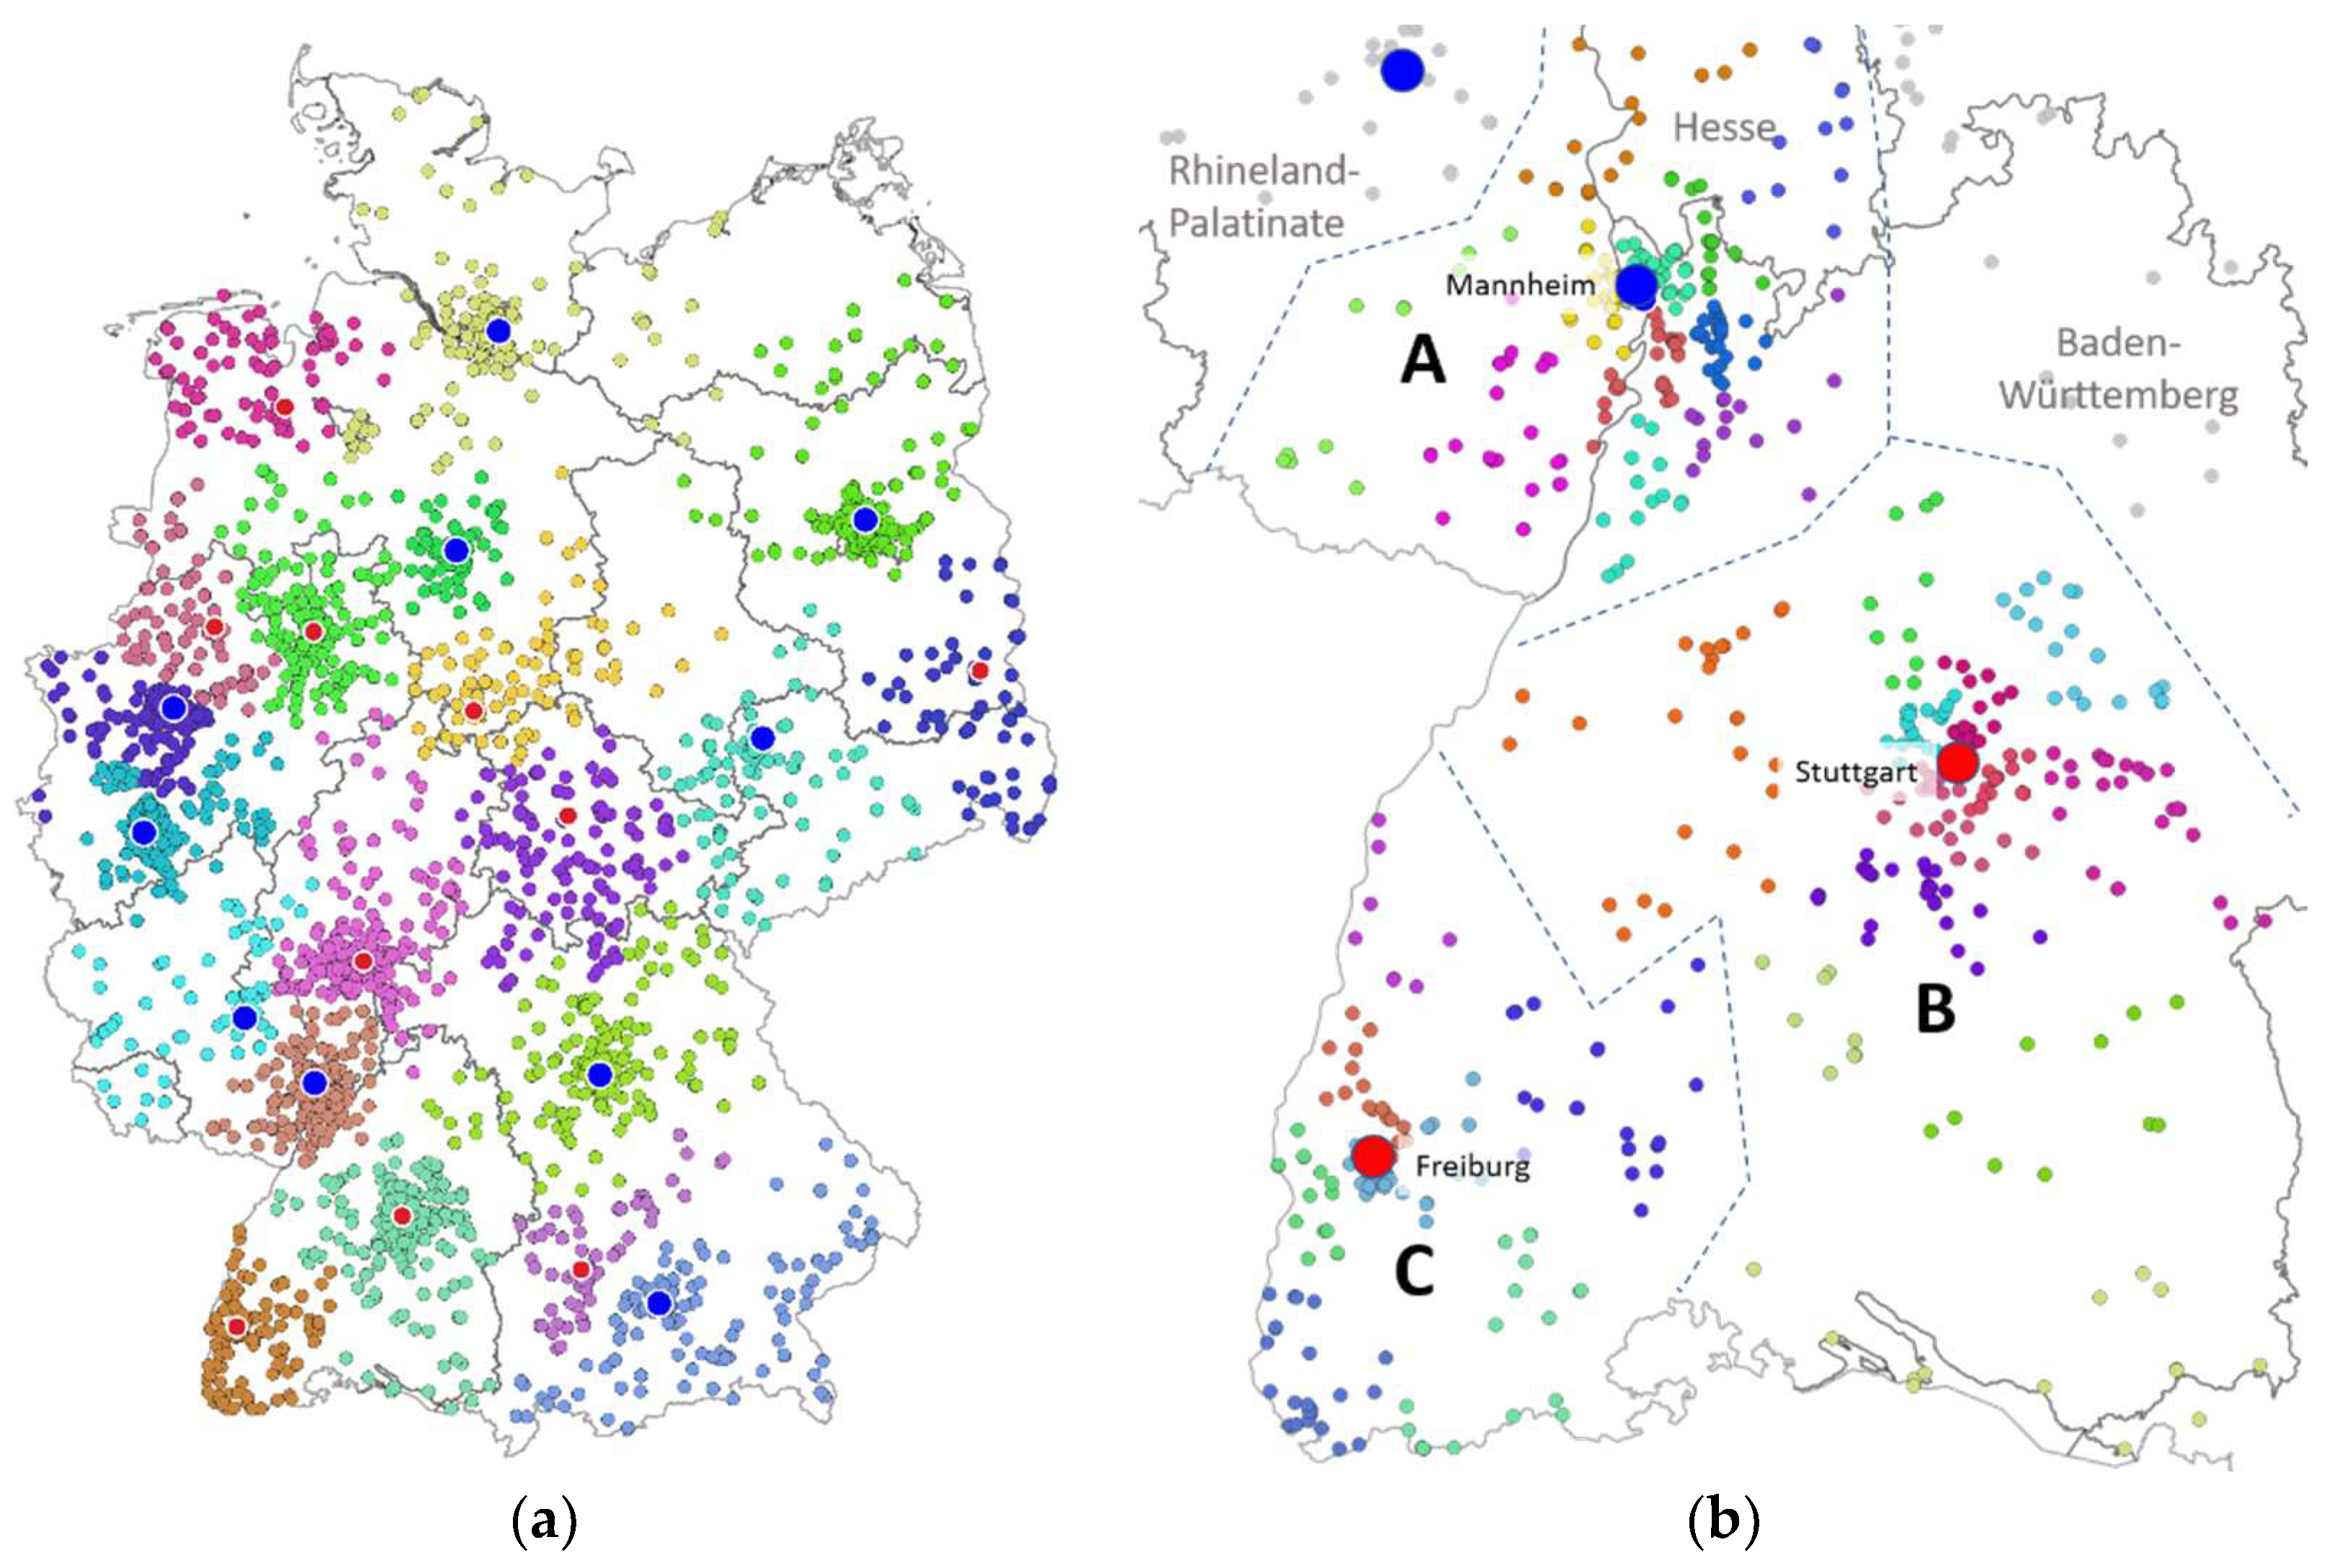
3.4. Last Mile Analysis

The last mile is currently considered the most expensive, least efficient and most polluting part of the entire logistics chain [56]. From a sustainability perspective, it is more efficient for trucks to deliver to a few centers equipped with large cold storage facilities than to a large number of small sites that have a short window of time to use the vaccine once it has thawed. Suboptimal logistics and improper refrigeration can also lead to vaccine waste and losses from unused opened vials.
In Germany, the distances between distribution centers, pharmacies and doctors’ offices are relatively short. A sufficient number of regional supply chains allows quick access to several neighboring countries and reduces the overall transport demand. COVID-19 vaccines are shipped as additional load, according to an April 2021 bulletin from the Pharmacy Wholesaler Association.
A simulation was developed to assess the total effort required to distribute about 6.3 million vaccine doses from 41 named hubs to 35,000 general practitioner (GP) practices via 15,000 pharmacies. Missing information about the relationship of physicians to pharmacies and pharmacies’ ordering habits was replaced by a number of assumptions. The distance between hub and pharmacy and between pharmacy and GP practice, respectively, proved to be the most important factor. To make the simulation as relevant as possible, market shares of the wholesalers were considered, too. Ten wholesalers (five nationwide and five regional wholesalers) participate in the distribution, with regional competition in almost all parts of Germany.
The simulation was based on three tiers: (a) the wholesaler tier with 41 hubs as vaccine receipt-points and 69 hubs serving as intermediary delivery points, (b) the pharmacy tier, organized in ‘delivery clusters’ of 15–30 neighboring pharmacies being served on tours from/to the wholesaler hubs and (c) the GP tier being served on tours from/to the pharmacies. Figure 2 illustrates the simulation results for layers (a) and (b) for one specific wholesaler.
Tours on tier levels (b) and (c) were optimized in this model by generating solutions using the ‘traveling salesperson problem’ (TSP) algorithm [57]. Touring distances between hubs and pharmacies or pharmacies and GP practices were initially calculated as a straight line. Straight-line distances were multiplied by a factor 1.3 (based on experience) to resemble road distances as a replacement for exact routing. For each pharmacy cluster, the traveling salesperson algorithm determines a path that covers all pharmacies almost optimally. A speed of 90 km/h is assumed for the distribution within the wholesalers’ hub network, 60 km/h is assumed for the tour hub – pharmacy cluster – hub and 40 km/h is assumed for the delivery route from the pharmacies to the GP practices. The simulation and the analysis of results was performed in R, version 4.0.5 [58].
Simplified time considerations take into account the separation of pallets by preparing smaller package sizes for pharmacies, loading at the hub (20 min), reloading at intermediary hubs (10 min), touring within the wholesaler network (195 km two-way plus 10 min reloading), tours to pharmacies (224 km, 112–200 min), with stops at pharmacies (10 min each, 80–150 min in total), preparation at the pharmacy (30 min) and delivery to GP practices including stops (6 km, 10 min per stop, 18–65 min in total). On average, a model tour covers 425 km with 284 to 563 min (4.5–9 h) of delivery time.
The model demonstrated 1.2 million km of driving per month required for the distribution of vaccines to GP practices in Germany. Approximately 370,000 kg CO2 equivalents per month would be generated assuming a separate distribution system for vaccines; however, additional tours for vaccine distribution are the exception. The logistics chain for vaccines is typically part of the existing delivery tours. Considering the negligible weight of vaccines as payload, the ecological impact of transportation reduces to 3600 kg CO2 equivalents/month—about 9 months of constant driving with one single car. Details are compiled in Table 4.

3.5. Carbon Footprint per Dose and Error Estimation

The individual contributions of production, transport and storage to the carbon footprint of one million doses of two mRNA COVID-19 vaccines are summarized comparatively in Table 5. The calculated results of this environmental assessment are an approximation and should not be interpreted as absolute figures. Comparative CO2 values for the production, use and disposal of goods are subject to significant uncertainties. It is generally impractical to quantify in detail all the process steps from the raw materials to the end use in order to make a reliable statement about the entire recycling chain.
The environmental burden of packaging, storage and deep freezing is less than that of air and freight transport. Key drivers of CO2 footprint differences are the emissions caused by transporting different weights per vial of vaccines. The impact of airfreight shows the most notable differences in carbon footprint between mRNA vaccines. Land transportation differences are also shown to be impacted by the additional 23 kg of dry ice required per shipment unit of BNT162b2.
Comparing one million doses of two mRNA vaccines in Germany results in a difference of about 1100 kg CO2 equivalents (without transportation) and 54,000 kg CO2 equivalents (including all modes of transport up to the last mile), respectively. The difference is based on the packaging weight and the number of doses per vial.
The large contribution of transport determines the statistical uncertainty of the total calculated carbon footprint. For Scenario A, for example, the cumulative individual errors for production, storage and disposal account for only 0.7% of the total error (Equation (1)):
Δ m ( CO 2 ) = ( 109203 ) 2 + ( 760 ) 2 ± 109206   kg   ( per   10 6   doses )
The calculation scheme in Table 5 allows the reader to easily obtain their own results for given transport distances and weights. This allows individual estimations on the same numerical basis for countries other than Germany.
For comparison of the order of magnitudes: the annual carbon footprint of health care is about 546 Mt CO2 equivalents in the USA [59], including 79 Mt CO2 equivalents for the prescription of drugs. In other words, giving ten billion doses of mRNA vaccine to the world’s population is equivalent to less than 0.4% of the annual carbon footprint of the total health care system in the United States.
Regarding medical wastes due to COVID-19 (syringes, masks, shields, disinfectants, etc.), it should be said that vaccination avoids corresponding future wastes because vaccines help to overcome the pandemic faster. Such positive effects were not considered in this study.

4. Conclusions

In terms of CO2 impact, mRNA vaccines do not impose a significant burden on the environment. Compared to the medical, economic and social implications of COVID-19 vaccinations, the ecological impact of manufacture, storage, freezing and distribution in terms of CO2 equivalents is small. Positive effects, including that vaccination avoids future medical waste, were not considered in this study.
The carbon footprint of a single mRNA vaccine dose injected into a patient is about 0.01 to 0.2 kg CO2 equivalents, depending on the cooling technology and the logistic routes to the vaccination sites in Germany.
The emissions for air freight, road transportation and last-mile delivery account for up to 99% of the total carbon footprint, which is nearly as 19 times the emissions generated from ultra-deep freeze technologies, the production of dry ice, glass and medical polymers for packaging.
In assessing the ecological impact of mRNA vaccines in the most populated European country, Germany, there is a small difference in carbon footprint in favor of mRNA-1273 in the order of magnitude of 1.1 to 54 t CO2 equivalents per 1 million doses which corresponds to a journey of 5500 to 270,000 km in a car with an internal combustion engine (0.2 kg/km).
These findings are necessarily qualitative or semi-quantitative, as the underlying variables and assumptions about CO2 equivalences are subject to large individual errors. Nevertheless, this study shows the relationships between production, supply and cold chain.

Author Contributions

Writing, review and editing: P.K., A.M. and S.W. All authors have read and agreed to the published version of the manuscript.

Funding

This study was supported by an unconditional grant by Moderna, Inc.

Institutional Review Board Statement

Not applicable. No studies involving humans or animals.

Informed Consent Statement

Not applicable. No studies involving humans.

Data Availability Statement

Additional data are available from the authors.

Conflicts of Interest

The authors declare no conflict of interest. The funders had no role in the design of the study; in the collection, analyses, or interpretation of data; in the writing of the manuscript, or in the decision to publish the results.

References

  1. Mauskopf, J.; Standaert, B.; Connolly, M.P.; Culyer, A.J.; Garrison, L.P.; Hutubessy, R.; Jit, M.; Pitman, R.; Revill, P.; Severens, J.L. Economic Analysis of Vaccination Programs: An ISPOR Good Practices for Outcomes Research Task Force Report. Value Health 2018, 21, 1133–1149. [Google Scholar] [CrossRef] [Green Version]
  2. Wiedmann, T.; Minx, J. A definition of ‘carbon footprint‘, Chap. 1. In Ecological Economics Research Trends; Pertsova, C.C., Ed.; Nova Sciences Publ.: New York, NY, USA, 2007; pp. 1–11. [Google Scholar]
  3. Zheng, J.; Suh, S. Strategies to reduce the global carbon footprint of plastics. Nat. Clim. Chang. 2019, 9, 374–378. [Google Scholar] [CrossRef]
  4. Teverson, R.; Peters, T.; Freer, M.; Radcliffe, J.; Koh, L.; Benton, T.; McLeod, D.; Uren, S.; Elliot, R.; Fryer, P.; et al. Doing Cold Smarter; Project Report; University of Birmingham: Birmingham, UK, 2015; Available online: http://www.birmingham.ac.uk/research/activity/energy/policy/cold/policy-commission-launch.aspx (accessed on 10 June 2021).
  5. Mouneer, T.; Elshaer, A.; Aly, M. Novel Cascade Refrigeration Cycle for Cold Supply Chain of COVID-19 Vaccines at Ultra-Low Temperature −80 °C Using Ethane (R170) Based Hydrocarbon Pair. World J. Eng. Technol. 2021, 9, 309–336. [Google Scholar] [CrossRef]
  6. Santos, A.F.; Gaspar, P.D.; de Souza, H.J.L. Refrigeration of COVID-19 Vaccines: Ideal Storage Characteristics, Energy Efficiency and Environmental Impacts of Various Vaccine Options. Energies 2021, 14, 1849. [Google Scholar] [CrossRef]
  7. Jiang, P.; Fan, Y.V.; Klemes, J.J. Impacts of COVID-19 on energy demand and consumption: Challenges, lessons and emerging opportunities. Appl. Energy 2021, 285, 116441. [Google Scholar] [CrossRef]
  8. Liu, Z.; Ciais, P.; Deng, Z.; Lei, R.; Davis, S.J.; Feng, S.; Zheng, B.; Cui, D.; Dou, X.; Zhu, B.; et al. Near-real-time monitoring of global CO2 emissions reveals the effects of the COVID-19 pandemic. Nat. Commun. 2021, 11, 5172. [Google Scholar] [CrossRef]
  9. Rume, T.; Didar-Ul Islam, S.M. Environmental effects of COVID-19 pandemic and potential strategies of sustainability. Heliyon 2020, 6, e04965. [Google Scholar] [CrossRef]
  10. Nundy, S.; Ghosh, A.; Mesloub, A.; Albaqawy, G.A.; Alnaim, M.M. Impact of COVID-19 pandemic on socio-economic, energy-environment and transport sector globally and sustainable development goal (SDG). J. Clean. Prod. 2021, 312, 127705. [Google Scholar] [CrossRef]
  11. Siddique, A.; Shahzad, A.; Lawler, J.; Mahmoud, K.A.; Lee, D.S.; Ali, N.; Bilal, M.; Rasool, K. Unprecedented environmental and energy impacts and challenges of COVID-19 pandemic. Environ. Res. 2021, 193, 110443. [Google Scholar] [CrossRef]
  12. FDA. Fact Sheet for Healthcare Providers Administering Vaccine (Vaccination Providers), Emergency Use Authorization (EUA) of the PFIZER-BIONTECH COVID-19 Vaccine to Prevent Corona Virus Disease 2019 (COVID-19), 12/2020. Available online: https://www.fda.gov/media/144413/download (accessed on 10 June 2021).
  13. EMA. Product Information, Pfizer-Biontech Vaccine; Comirnaty Concentrate for Dispersion for Injection COVID-19 mRNA Vaccine (Nucleoside Modified), 12/2020. Available online: https://www.ema.europa.eu/en/documents/product-information/comirnaty-epar-product-information_en.pdf (accessed on 10 June 2021).
  14. NHS. Standard Operating Procedure, Moving Pfizer-BioNTech Covid-19 Vaccines from an Ultra-Low Temperature Freezer into a Fridge to Haw. Available online: https://www.sps.nhs.uk/wp-content/uploads/2020/12/VH6-Moving-Pfizer-BioNTech-Covid-19-Vaccines-from-an-ultra-low-temperature-freezer-into-a-fridge-to-thaw-Issue-1.4-24.12.20.docx (accessed on 10 June 2021).
  15. FDA. Fact Sheet for Healthcare Providers Administering Vaccine (Vaccination Providers), Emergency Use Authorization (EUA) of MODERNA COVID-19 Vaccine to Prevent Corona Virus Disease 2019 (COVID-19), 12/2020. Available online: https://www.fda.gov/media/144637/download (accessed on 10 June 2021).
  16. EMA. Product Information, COVID-19 Vaccine Moderna Dispersion for Injection. Available online: https://www.ema.europa.eu/en/documents/product-information/covid-19-vaccine-moderna-product-information_en.pdf (accessed on 10 June 2021).
  17. DailyMed. Moderna COVID-19 Vaccine—cx-024414 Injection, Suspension. Fact Sheet for Healthcare Providers Administering Vaccine (PDF). Food and Drug Administration (Report). December 2020. Available online: https://dailymed.nlm.nih.gov/dailymed/drugInfo (accessed on 10 June 2021).
  18. BioNTech Provides Update on Vaccine Production Status at Marburg Manufacturing Site, Press Release, Mainz, 26 March 2021. Available online: https://investors.biontech.de/de/news-releases/news-release-details/biontech-gibt-update-zu-status-der-impfstoffproduktion-der (accessed on 10 June 2021).
  19. Shin, R.; Searcy, C. Evaluating the Greenhouse Gas Emissions in the Craft Beer Industry: An Assessment of Challenges and Benefits of Greenhouse Gas Accounting. Sustainability 2018, 10, 4191. [Google Scholar] [CrossRef] [Green Version]
  20. Sheldon, R.A. Catalysis and pollution prevention. Chem. Ind. 1997, 1, 12–15. [Google Scholar]
  21. Sheldon, R.A.; Arends, I.; Hanefeld, U. Green Chemistry and Catalysis; Wiley-VCH: Weinheim, Germany, 2007. [Google Scholar]
  22. Phadke, R.; dos Santos Costa, A.C.; Dapke, K.; Ghosh, S.; Ahmad, S.; Tsagkaris, C.; Raiya, S.; Maheswari, M.S.; Essar, M.Y.; Ahmad, S. Eco-friendly vaccination: Tackling an unforeseen adverse effect. J. Clim. Chang. Health 2021, 1, 100005. [Google Scholar] [CrossRef]
  23. WHO. Sustainability in Vaccine Packaging. 2011. Available online: https://www.who.int/immunization/policy/committees/Sustainability_in_Vaccine_Packaging_May11_DRAFT.pdf (accessed on 10 June 2021).
  24. Lee, B.-K.; Ellenbecker, M.J.; Moure-Erase, R. Analyses of the recycling potential of medical plastic. Waste Waster Manag. 2002, 22, 461–470. [Google Scholar] [CrossRef]
  25. Thomas, G.P. Recycling of Polypropylene (PP), Azo Cleantech 2019. Available online: https://www.azocleantech.com/amp/article.aspx?ArticleID=240 (accessed on 10 June 2021).
  26. Saadat, S.; Rawtani, D.; Mustansar, C. Hussain environmental perspective of COVID-19. Sci. Total Environ. 2020, 728, 138870. [Google Scholar] [CrossRef]
  27. Van-Doremalen, N.; Bushmaker, T.; Morris, D.H.; Holbrook, M.G.; Gamble, A.; Williamson, B.N.; Lloyd-Smith, J.O. Aerosol and surface stability of SARSCoV-2 as compared with SARS-CoV-1. N. Engl. J. Med. 2020, 382, 1564–1567. [Google Scholar] [CrossRef]
  28. Zambrano-Monserrate, M.A.; Ruanob, M.A.; Sanchez-Alcalde, L. Indirect effects of COVID-19 on the environment. Sci. Total Environ. 2020, 728, 138813. [Google Scholar] [CrossRef]
  29. Berechnen Sie Ihre Treibhausgasemissionen Mit Dem CO2-Rechner. Available online: www.umweltpakt.bayern.de/energie_klima/fachwissen/217/berechnung-co2-emissionen (accessed on 10 June 2021).
  30. Entwicklung der Spezifischen Kohlendioxid-Emissionen des Deutschen Strommix in den Jahren 1990–2019. Available online: www.umweltbundesamt.de/sites/default/files/medien/1410/publikationen/2020-04-01_climate-change_13-2020_strommix_2020_fin.pdf (accessed on 10 June 2021).
  31. Efficient Use of Compressed Air for Dry Ice Blasting. Available online: www.researchgate.net/publication/282633853_Efficient_use_of_compressed_air_for_dry_ice_blasting (accessed on 10 June 2021).
  32. Vatani, A.; Mehrpooya, M.; Palizdar, A. Advanced exergetic analysis of five natural gas liquefaction processes. Energy Convers. Manag. 2014, 78, 720–737. [Google Scholar] [CrossRef]
  33. Energiewende in der Industrie—Abschlussbericht zum Arbeitspaket 2a. Available online: www.bmwi.de/Redaktion/DE/Downloads/E/energiewende-in-der-industrie-ap2a-branchensteckbrief-glas.pdf (accessed on 10 June 2021).
  34. Papierindustrie Senkt Energieverbrauch und Emissionen. Available online: www.papierundtechnik.de/im-blickpunkt/papierindustrie-senkt-energieverbrauch-und-emissionen/ (accessed on 10 June 2021).
  35. Hillman, K.; Damgaard, A.; Eriksson, O.; Jonsson, D.; Fluck, L. Climate Benefits of Material Recycling Inventory of Average Greenhouse Gas Emissions for Denmark, Norway and Sweden. Available online: https://norden.diva-portal.org/smash/get/diva2:839864/FULLTEXT03.pdf (accessed on 10 June 2021).
  36. Dormer, A.; Finn, D.F.; Ward, P.; Cullen, J. Carbon footprint analysis in plastics manufacturing. J. Clean. Prod. 2013, 51, 133–141. [Google Scholar] [CrossRef]
  37. Life Cycle Assessment of a Commercial Refrigeration System under Different Use Configurations. Available online: summerschool-aidi.it/edition-2015/images/ancona2013/articoli/non_presentati/articolo16_np.pdf (accessed on 10 June 2021).
  38. Winnacker-Küchler: Chemische Technik; Section 6, “Carbon Dioxide“; Wiley-VCH: Weinheim, Germany, 2005; Volume 4.
  39. Bettenhausen, C. Short CO₂ supply may complicate COVID-19 vaccine rollout. Chem. Eng. News 2020, 98, 16–20. [Google Scholar]
  40. UPS. A Guide to Dry Ice Shipping, April 2019. Available online: https://www.ups.com/us/en/services/knowledge-center/article.page?kid=art16a454e6661 (accessed on 10 June 2021).
  41. Evans, J.; Foster, A.; Huet, J.-M.; Reinholdt, L.; Fikiin, K.; Zilio, C.; Houška, M.; Landfeld, A.; Bond, C.; Schreurs, M.; et al. Specific energy consumption values for various refrigerated food cold stores. In Proceedings of the 24th IIR International Congress of Refrigeration, Yokohama, Japan, 16–22 August 2015. [Google Scholar] [CrossRef]
  42. TSX Series Ultra-Low Temperature Freezers. Available online: assets.thermofisher.com/TFS-Assets/LED/Reference-Materials/txs-series-ultra-low-freezers-green-fact-sheet.pdf (accessed on 10 June 2021).
  43. Stirling Ultracold’s Innovative ULT Freezers Lead Fight to Preserve and Protect Covid-19 Vaccines. Available online: www.stirlingultracold.com/covid-19-2 (accessed on 10 June 2021).
  44. Gumpas, L.A.M.; Simons, G. Factors affecting the performance, energy consumption, and carbon footprint for ultra low temperature freezers: Case study at the National Institutes of Health. World Rev. Sci. Technol. Sust. Dev. 2013, 10, 129–141. [Google Scholar] [CrossRef]
  45. International Air Transport Association (IATA). The Time to Prepare for COVID-19 Vaccine Transport Is Now, Press Release No. 70, 9 September 2020. Available online: https://www.iata.org/en/pressroom/pr/2020-09-09-01/ (accessed on 10 June 2021).
  46. Lave, L.B.; Griffin, W.M. The economic and environmental footprints of transportation, Chap. 1. In Enviromentally Conscious Transportation; Kutz, M., Ed.; Wiley: Hoboken, NJ, USA, 2008; pp. 1–13. [Google Scholar]
  47. Transport per LKW. CO2 Belastung Beim Gütertransport per LKW National und International. Available online: www.klimanko.de/co%C2%B2-belastung-berechnen/gutertransport/# (accessed on 10 June 2021).
  48. Emissionsdaten. Available online: www.umweltbundesamt.de/themen/verkehr-laerm/emissionsdaten#tabelle (accessed on 10 June 2021).
  49. Berechnung von Treibhausgasemissionen in Spedition und Logistik. Available online: www.co2-sachverstaendiger.de/pdf/DSLV-Leitfaden%20Berechnung%20von%20THG-Emissionen%20in%20Spedition%20und%20Logistik.pdf (accessed on 10 June 2021).
  50. Nachhaltigkeit 2019 FACTSHEET. Available online: www.lufthansagroup.com/media/downloads/de/verantwortung/LH-Factsheet-Nachhaltigkeit-2019.pdf (accessed on 10 June 2021).
  51. CO2-Rechner des Umweltbundesamtes. Available online: uba.co2-rechner.de/de_DE/mobility-flight[2 (accessed on 10 June 2021).
  52. Atmosfair. Available online: www.atmosfair.de/de/kompensieren/flug/ (accessed on 10 June 2021).
  53. ICAO Carbon Emissions Calculator. Available online: www.icao.int/environmental-protection/CarbonOffset/Pages/default.aspx (accessed on 10 June 2021).
  54. Umwelt Bundesamt. Available online: www.umweltbundesamt.de/sites/default/files/medien/366/bilder/dateien/tabelle_vergleich-verkehrsmittel-personenverkehr_2019_uba.pdf (accessed on 10 June 2021).
  55. Airbus A319 A320 A321 Technische Daten/Beschreibung. Available online: aerotask.de/airbus-a319-a320-a321-technische-daten-beschreibung/# (accessed on 10 June 2021).
  56. Gevaers, R.; Van de Voorde, E.; Vanelslander, T. Cost Modelling and Simulation of Last-mile Characteristics in an Innovative B2C Supply Chain Environment with Implications on Urban Areas and Cities. Procedia Soc. Behav. Sci. 2014, 125, 398–411. [Google Scholar] [CrossRef] [Green Version]
  57. Hahsler, M.; Hornik, K. Traveling Salesperson Problem (TSP). R Package Version 1.1-10. 2020. Available online: https://CRAN.R-project.org/package=TSP (accessed on 10 June 2021).
  58. R Core Team. R, a Language and Environment for Statistical Computing; R Foundation for Statistical Computing: Vienna, Austria, 2021; Available online: https://www.R-project.org/ (accessed on 10 June 2021).
  59. Chung, J.W.; Meltzer, D.O. Estimate of the Carbon Footprint of the US Health Care Sector. JAMA 2009, 302, 1970–1972. [Google Scholar] [CrossRef] [Green Version]
  60. McGain, F.; Moore, G.; Black, J. Steam sterilisation’s energy and water footprint. Aust. Health Rev. 2017, 41, 26–32. [Google Scholar] [CrossRef] [PubMed]
  61. Eriksson, O.; Finnveden, G. Plastic waste as a fuel—CO2-neutral or not. RSC Energy Environ. Sci. 2009, 2, 907–914. [Google Scholar] [CrossRef]
Figure 1. Supply chain and last mile delivery process for mRNA vaccines in Germany.
Ijerph 18 07425 g001
Figure 2. Last-mile analysis for the distribution of mRNA vaccines in Germany in 2021. (a) Hub locations and assignments of pharmacies to wholesaler hubs in Germany (simulation result for one wholesaler). Blue: vaccine receipt-points, red: intermediary distribution hubs. (b) Pharmacies organized in delivery clusters: simulated example for three hub areas A, B, C of one wholesaler in southwest Germany (Baden-Württemberg, Rhein-Neckar area and Palatinate).
Ijerph 18 07425 g002
Table 1. Estimated CO2 equivalents for production of electricity and goods.
kg CO2 kWhRef.
Primary Energy Production:
1 kWh of electrical energy0.502 [29]
1 kWh German electricity mix (2019)0.401 [30]
Manufacture of 1 kg:
Dry ice0.150.36[31]
Gas compression: liquefaction of natural gas0.140.35[32]
Glass *0.722.73[33]
Paper0.61 [34]
Polypropylene for medical syringes1.5 [35]
PET: Cradle-to-grave without and with recycling3.71 and 1.54 [36]
Steam136
Production of a large refrigerator322 [37]
Life cycle of a refrigerator
(15 years, 5340 L, +5...−5 °C)
6100 … 12,000 [37]
* 6784 Mio. t per year. Energy consumption 18.53 TWh/a, 4.88 Mio. t CO2.
Table 2. Typical carbon footprint of freezers in CO2 equivalents.
Cold Storage DeviceWh L−1d−1kWh/dkg CO2/d
Average refrigerator per liter and day0.15 … 0.2≈0.1[41]
Average freezer, 600–700 L (−80 °C) 14 … 189.4 … 12.37 … 9[42]
Stationary: 159 L (−20 °C… −80 °C)426.72.7[43]
Portable: 11 L (−20 °C… −80 °C)2552.81.2[43]
Inefficient ultra-cold freezer: 50 L (−70 °C)400208[44]
Energy required for 1 kg water (20 °C to 0 °C)23*
Energy required for 1 kg ice (0 °C to −70 °C)40*
* Q = m   c p   Δ T , c p = 4186   J   kg 1 K 1 (water), c p = 2060   J   kg 1 K 1 (ice), c p = 703   J   kg 1 K 1 (glass).
Table 3. CO2 equivalents for the transportation of goods including climate impact.
Type of Transportationkg CO2/(1000 km kg)kg CO2/L
Average car170 … 320
Transport of payload 0.11 … 0.23[47,48,49]
Tank-to-wheel: per liter of diesel2.5[49]
Well-to-wheel: incl. losses in power plants, refineries, power lines2.94[49]
Air freight0.67[50] *
kg CO2/km per person
Flight: Geneva–Frankfurt, A320 Economy, 500 km 0.17 … 0.20 [51,52,53]
Average for one-hour flight in Germany0.0922 … 0.214 [54,55]
New York–Frankfurt, A320 Economy0.21 … 0.26 [49,51]
* Airbus A320: 2700 L kerosene/h produces 2760 kg CO2/L or 7452 kg CO2/h.
Table 4. Distribution of 1 million vials for a demand of 6,300,000 doses in the course of 1 month.
Last-Mile AnalysisMost Likely Scenario No Extra Tours, Vaccine as Additional Load OnlyWorst Case Scenario Extra Tours
Participating doctors35,000
Related pharmacies15,000
Delivery clusters846
Pharmacies per delivery cluster18
Number of deliveries4
Tours within wholesaler network (2 × 75 km)111,451
Tours within pharmacy clusters (172 km)756,662
Last-mile tour (pharmacy–GP practice)366,600
Number of vials per month1,050,000
Weight per vial (g)36.9
Weight of cryo case: 112 g/49 vials (g)40
Total loading weight per month (kg)42,000
Average distance (km)212
Total distance per month (km)8491,234,714
Freight units (t · km)35,663
CO2 emissions of transport100 g/1000 km300 g/1000 km
CO2 equivalents of 1 million vials (kg)3566370,414
kg CO2 equivalents per vial0.00340.353
Table 5. Attempted estimation: CO2 equivalents for transportation and storage of N = 1 million doses of mRNA vaccines.
Reference Data See Table 1, Table 2 and Table 3Scenario A Dry Ice Scenario B
No Dry Ice
Error
in %
Mass including packaging6154 kg2517 kg
Volume per 1 million doses without packaging375 L469 L
1Transport kg CO2
Air freight (USA–Europe)6200 km · 2.3 kg CO2/(1000 km kg) · m 87,75635,89250
Truck 1000 km · 0.2 kg CO2/(1000 km kg) · m 123140320
Last-mile analysis per dose (see Section 3.4) 566see A10
Traffic to the vaccination site: 1 km per patient (arbitrary)N · 1 km · 0.1 kg CO2/km100,000see A100
2Manufacture
mRNA biochemical process: arbitrary 30 µg · 10−3 ⋅ 500 kg CO2/kg · N15see A500
Glass (1 g/dose)0.72 kg CO2/kg · (N/1000)720see A5
Paper, cardboard, ancillary kit (1 g/dose)0.61 kg CO2/kg· (N/1000)610see A5
Syringes and sterilization [60] 2 kg · (1.5 + 0.77) kg CO2/kg · (N/1000)4540see A5
3Storage
Freezer farm: 6 months at −20… −80 °C (600 L)180 d · 8 kg CO2/d 1440 see A10
Dry ice for shipping: 2 × 5 days per cartoon2 · 23 kg · N/5850 · 0.15 kg CO2/kg11803
Freezing during transport: 10 days at −40 °C10 d · 8 kg CO2/d8010
Refrigerator in regional centers: 2… 8 °C10 d · 0.1 kg CO2/d 10see A20
4Waste disposal
Combustion of plastics [61]N · 0.002 kg · (2.41 − 0.65) kg CO2/kg3520see A20
Glass recycling [35]N · 0.001 kg · 0.4 kg CO2/kg (Credit)
Paper recyclingN · 0.02 kg · 0.064 kg CO2/kg (Credit)
Total per dose (kg CO2 equivalents)including transport 0.202 ± 0.1100.148 ± 0.10254
excluding transport (absolute error rounded up)0.012 ± 0.0010.011 ± 0.0017
Transportation units: A = BNT162B2: 1 carton (36 kg, 89 L) in thermal container (23 kg or 15 L dry ice + 3 kg packaging) = 5 trays = 975 vials (each undiluted 0.45 mL) = 5850 doses (each diluted 0.375 mL). B = mRNA-1273: 1 pallet (290 kg, 54 L) = 8 containers = 115,200 doses. 1 container (6.76 L) = 12 cartons. One carton (0.564 L) = 120 vials (each 5 mL) = 1200 doses.
Publisher’s Note: MDPI stays neutral with regard to jurisdictional claims in published maps and institutional affiliations.

