
The Effect of the COVID-19 Pandemic on the Labor Markets of the Visegrad Countries

Faculty of Economics and Management, Opole University of Technology, 45-758 Opole, Poland
Sustainability 2022, 14(12), 7386; https://doi.org/10.3390/su14127386
Submission received: 11 May 2022
/
Revised: 7 June 2022
/
Accepted: 14 June 2022
/
Published: 16 June 2022
Abstract
:The COVID-19 pandemic caused a sudden and deep recession contributing, among other things, to a sharp rise in unemployment. The article addresses changes in the labor markets of the Visegrad countries (Czechia, Hungary, Poland, and Slovakia), covering the period 2018–2021. It attempts to answer the questions: how deep a slump was caused by the pandemic in these markets, how flexible forms of employment responded to it, and whether there were discriminatory phenomena (decline in employment and increase in unemployment in the most vulnerable groups in the labor market). The analysis was based on quarterly data published by Eurostat on the size and structure of the employed and unemployed population. The results of the compilations indicate a relatively small deepening of imbalances in the labor markets of the analyzed countries, a differentiated reaction of flexible forms of employment (depending on the form of employment), which was in line with expectations (they were used as a business cycle buffer). In most of the V4 countries, women were relatively less likely to lose their jobs than men during the pandemic. In a few cases, a relatively stronger decline in employment (increase in unemployment) affected young people, people aged 55–64, and people with the lowest education.
1. Introduction
One of the essential elements of sustainable development is the full utilization of labor resources, conditioning the use of other economic resources. The COVID-19 pandemic put policymakers under pressure to balance the need to fight the disease by implementing blockades with saving jobs by maintaining economic activity [1]. The impact of the COVID-19 pandemic on the economy was decidedly negative, contributing to lower levels of both supply and demand, accompanied by loss of life [2], a sharp collapse of manufacturing and service activities, disruption of supply chains, and declining public sector revenues that limited its ability to intervene [3]. Such phenomena have been observed worldwide, and to make matters worse, the economic collapse has been sudden and large-scale.
The article refers to the response to the pandemic of labor markets of the Visegrad Group (V4) countries, namely, Czechia, Hungary, Poland, and Slovakia. It deals with changes in the level and structure of employment and unemployment. The research topic was undertaken in order to determine the impact of the COVID-19 pandemic on the labor markets of the V4 countries, from the perspective of threat to their balance. The literature review focuses on the consequences of the pandemic for the labor market and characterizes the V4 countries as the subject of research. In the next part of the article, the research assumptions and the applied method of data analysis are presented. The practical part is based mainly on the analysis of changes in the levels of the number of the employed and unemployed in time series based on quarterly data published by Eurostat. On this basis, the article analyzes the scale of job losses and rising unemployment, their structure from the perspective of forms of employment and manifestations of discrimination in the labor market of the most vulnerable groups.
The article ends with conclusions and discussion.
2. Literature Review and Method
2.1. The Effect of COVID-19 on the Labor Market
To slow the spread of COVID-19, in March 2020, many countries imposed restrictions on people and businesses, up to and including complete shutdown of economic activity [4,5]. The restrictions on economic activity led to a recession, resulting in a sudden and deep increase in unemployment by historical standards [1]. Previous recessions have built up over time, with job losses lasting for at least five months, while the recession caused by COVID-19 reached its deepest point after two months [6], with immediate consequences for the lives and livelihoods of millions of people [7]. Referring to the world’s largest economies, GDP in the US contracted by 5% in the first quarter of 2020 and by as much as 32% in the second quarter. This resulted in a loss of 22 million jobs from February to April and an increase in the unemployment rate from 3.5% to 14.7% from March to April [6,8]. The Chinese economy shrank by 6.8% in the first quarter of 2020, the first decline since 1992 [9].
The COVID-19 pandemic caused a collapse in international trade, exacerbating the slump in economies linked to the global trade network [10]. The consequences of this condition include: impediments to access to raw materials and supplies, loss of markets (including export markets due to logistical constraints), deterioration of corporate finances (due to suspension of business activity), reduced productivity throughout the supply chain, and deterioration of worker well-being (physical and mental) [11,12]. The collapse of foreign trade affected the underdeveloped countries to a greater extent [9].
The impact of the COVID-19 pandemic varied by industry, which was related to the scale of the restrictions imposed. Serious disruptions occurred in industries affiliated with the service sector, e.g., transportation, hospitality, and tourism ceased normal operations in the first months of the restrictions [13,14], and the same was true for the entertainment sector [6]. For example, in the U.S., businesses in the retail, arts and entertainment, personal services, food services, and hospitality industries reported employment declines of more than 50%. The exceptions were essential retail sales and nursing care, where employment maintained or experienced a slight decline. Employees in industries that were able to shift to remote work (finance, professional services, and real estate-related businesses) also experienced smaller employment declines [15,16,17].
There was significant economic uncertainty in 2020 due to the lack of effective therapeutic agents against the new disease, which translated into uncertainty about the future of the global economic system [18]. This uncertainty gradually faded in the following year, thanks to ongoing vaccination programs, favoring increased consumption and restored trade [19].
Viewed from the perspective of core groups of economic actors, the emergency shutdowns caused, inter alia, households to be confined to their homes. This translated into a drastic decline in consumer spending [1], income, and wealth which, under risk conditions, induced an increase in savings, weakening aggregate demand. As a consequence, spending on durable goods was reduced, which triggered a reduction in business investment expenditures on the part of entrepreneurs [20,21] and, consequently, a reduction in the level of labor demand. From the perspective of labor supply offered by households, people’s ability and willingness to work also declined as the epidemic threatened childcare services, educational opportunities, and health care availability [13].
With respect to businesses, production plant outages contributed to supply chain disruptions, sudden drops in demand, and difficulties in accessing lines of credit, amid increased uncertainty [22]. Small businesses, with lower (than large economic organizations) financial resources, were more affected by the pandemic crisis [23]. For small businesses, supply chain disruptions were less of a threat. Businesses temporarily closing operations cited reduced demand and concerns about employee health as the reasons (in addition to the lockdown implemented) [15].
The primary concern for labor market equilibrium was the long-term persistence of high unemployment levels caused by the lockdown, which could lead to a hysteresis effect [21]. The COVID-19 pandemic caused an economic shock so sudden and deep that the effectiveness of traditional macroeconomic tools to support aggregate demand or provide liquidity to firms was limited [24]. The uncertainty in the economy caused households to disbelieve in the effectiveness of the economic stimulus measures taken, and, therefore, not respond as expected [25].
During the downturn, state and local government budgets came under pressure due to declining revenues and increased spending needs. Governments at all levels were required to balance their budgets, and were forced to make significant cuts in public services, capital spending, and employment costs [26,27]. Limited ability to finance expenditures by increasing debt caused public spending to act procyclically, and a decline in employment also occurred in the public sector [28].
The magnitude of the labor market imbalances that emerged from the pandemic depended on the institutional arrangements in each economy. Milani [29] indicates that the low protection of workers from dismissal in the USA and the large share of temporary workers in the Spanish economy were the likely causes of the significant increase in unemployment in these countries. Referring to the effectiveness of counteracting rising unemployment, studies in the USA, Australia, Canada, Ireland, and the UK indicate that those countries that favored wage subsidy programs over raising unemployment benefits managed to maintain higher employment levels and experienced lower unemployment growth [30]. In practice, most often, the interventions of governments were directed to support enterprises (in the form of subsidizing salaries of employees, maintaining liquidity to avoid insolvency, and enabling the resumption of production after the crisis) and to support the spending capacity of people who lose their income [31].
The labor market does not work in an ideal way, which results in segmentation processes on both the demand and supply side [32], in different parts of the labor market unequal employment conditions are accompanied by unequal access opportunities [33]. Empirical studies confirm the discrimination of certain groups of workers, which is manifested by a higher level of unemployment and a lower level of wages. This is the case for: women [34,35], low-skilled and low-educated people [36,37,38], young and elderly people [39], immigrants, and ethnic minorities [40,41]. During the first months of the COVID-19 pandemic, the increase in unemployment primarily affected the groups listed above [13,42,43,44,45]. These same groups were also more severely impacted by the involuntary transition to part-time work [46], used as a method to reduce the scale of layoffs during the recession [6].
Studies indicating a greater decline in employment among women, point to the feminization of employment in industries hardest hit by economic blockades as a cause of this condition [46,47,48,49]. Additionally, women’s exit from the labor market or reduction in working hours was caused by caring for school-age children during the pandemic [6,50,51]. Changes in the situation on the labor market during the pandemic depend, inter alia, on the possibility of using remote work and the required degree of social interaction in provisioning of services [52].
In industries with a high degree of telecommuting, employment declines were significantly lower [13,16], with higher job losses for women (especially those belonging to ethnic minorities) also occurring [53]. It should be added that in teleworking industries, employees tended to earn more [54], which meant that the more developed economies experienced lower macroeconomic declines in household income.
Studies on the European Union have indicated financial deprivation among youth, especially young people with primary or secondary education [55]. In the United States, job loss has particularly affected low-wage earners [24]. At least temporary job loss affected more than 35% of all workers in the bottom quintile of the wage distribution, while among workers in the top quintile, job loss struck 9% [56]. Job loss among high-wage workers lasted for several weeks, while low-wage workers experienced much greater losses that persisted for several months [24].
After the infestation was reduced over the summer, employers began to replenish staff as early as in 2020, mainly by re-hiring their former employees. This was mutually beneficial because, with almost the entire economy under restriction, laid-off workers could not quickly find another job [30], and from the employer’s perspective, the re-hired worker did not have to be introduced to the duties [56]. By the end of 2020, the pre-pandemic level of employment had not been restored in most economies. The re-employment rate declined with the time since job loss, and the longest joblessness was among groups most affected by layoffs [57].
2.2. Visegrad Countries’ Labor Markets Ahead of COVID-19 Pandemic
The Visegrad Group was established in 1991 in the Hungarian town of Visegrad. Integration was based on the geographical proximity of the countries, their high degree of historical and cultural cohesion and common traditions. Similar level of economic development of the member states [58], institutional similarities and similar structure of economies [59,60] were very important factors for the survival of the V4 group (Poland, Czechia, Slovakia, and Hungary). The Visegrad countries are now considered as an example of successful transformation that raised their competitiveness in the globalized economy, thanks to the implementation of institutional reforms, significant technological changes, improvements in the quality of human capital and fiscal stabilization policies [60,61,62,63]. Services dominate the employment structure of the V4 countries, with industry still having a significant share in employment. In 2019, these sectors employed: 37.2% (industry) and 60.1% (services) in Czechia, 32.1% (industry) and 63.2% (services) in Hungary, 32.1% (industry) and 58.7% (services) in Poland, and 36.1% (industry) and 62.1% (services) in Slovakia [64].
After a period of high unemployment in the early 1990s, caused by the transformational recession, the V4 group of countries entered a period of multi-year economic growth, resulting, among other things, from the ongoing structural changes in their economies [65]. Acceleration of positive changes in labor markets occurred after the V4 countries joined the EU in 2004. V4 labor markets have been supported by foreign direct investment (FDI), which created new jobs and increased wages. The share of employment in foreign-controlled enterprises in 2018 was: 28.3% in Czechia, 26% in Hungary, 19.9% in Poland, and 28.4% in Slovakia [64]. The labor supply in the V4 countries, and, thus, the level of unemployment, was also limited due to economic emigration to Western European countries [66].
With the decline in the unemployment rate, there has been a tendency to increase the labor force participation of the population [60,67], with the Visegrad countries having lower employment rates than in Western Europe, which is offset by higher average hours worked and higher human capital (from the perspective of education level) among the employed [60]. Taking into account the total number of hours (the product of employment and average working time), the labor input in the V4 countries is no longer lower than in Western Europe [68].
Being part of the EU, the V4 countries have open economies, which results in the transfer of international (global) economic fluctuations to domestic markets, including the labor market (level of employment and unemployment). The scale of openness is evidenced by the share of exports and imports in GDP, which, in 2020, amounted to: 71% (export) and 64.2% (import) in Czechia, 79.5% (export) and 77.8% (import) in Hungary, 56.2% (export) and 49.4% (import) in Poland, and 85.4% (export) and 84.5% (import) in Slovakia (https://data.worldbank.org/indicator/access (accessed on 4 June 2022)). Despite the fact that Poland has the relatively lowest share of exports and imports in GDP, due to the size of the economy, it plays a significant role in global (European) supply chains.
One of the tools to reduce unemployment was to expand the use of flexible forms of employment [69,70]. Non-standard forms of employment are beneficial for employers because they reduce labor costs and also make it easier to terminate a contract during an economic downturn [71,72,73,74]. The willingness to work in non-standard forms (fixed-term employment, part-time employment and self-employment) on the part of employees depends on the current market situation [75] and applicable legal regulations, which determine the scale of their use in particular economies. Employees treat work in flexible forms differently, depending on whether it is their only form of employment and whether it started out of their own choice or due to the lack of standard job offers [76]. Employees who use them to obtain additional income are satisfied with flexible forms of work, as well as people whose non-professional duties make it impossible to work full-time (e.g., people caring for children or the elderly) [69].
The research covering the period of the financial crisis of 2008, concerning flexible forms in the V4 countries, indicates various changes in the level of their use in response to changes in the economic situation (GDP growth rate) in individual economies. In Czechia and Slovakia there was a statistically significant positive correlation with temporary employment and part-time employment, in Hungary a negative correlation with self-employment, and in Poland a negative correlation with self-employment and part-time employment [77]. From the perspective of non-standard forms of employment, the most flexible labor market was in Poland, with a very high correlation between the unemployment rate and all analyzed forms of non-standard employment [78]. It is noteworthy that the increase in unemployment in the V4 countries is accompanied by a higher level of self-employment (entrepreneurship out of necessity) [79], which indicates that people are forced to set up their own business and perform tasks on a self-employed basis in order to reduce the employer’s labor costs during periods of economic downturn [76]. Studies on the correlation between changes in GDP and employment levels of selected groups of workers have not indicated the occurrence of discrimination against women, young people and people in the pre-retirement age in the labor markets of the V4 countries [80].
During the pandemic, the V4 countries pursued an active fiscal and monetary policy (lowering central bank interest rates) aimed at providing liquidity to economic entities and protecting jobs. In all V4 countries, jobs were subsidized, social security contributions were abolished or reduced, the rules of paying income tax were temporarily changed, and enterprises were granted subsidies, rent subsidies, loans, and guarantees. In relation to GDP, the greatest support for economic entities was in the Czech Republic, followed by Hungary, Poland, and Slovakia. The highest percentage of entrepreneurs benefited from aid in Poland, where direct non-returnable subsidies were applied [81]
The review of issues related to the impact of the pandemic on the labor market and the characteristics of the labor markets of the V4 countries allowed us to pose five research questions, which the article tries to answer. They are formulated as follows:
- −
- Has the scale of the decline in employment/increase in unemployment in the V4 countries caused by the COVID-19 pandemic been leveled by the end of 2021?
- −
- Have flexible forms of employment been used in the V4 countries as business cycle buffers?
- −
- Did the most vulnerable on the labor market (women, youth, the elderly, and people with the lowest education) lose their jobs relatively more often/remain unemployed?
- −
- Was there a difference in the response of the V4 labor markets to the pandemic and the financial crisis (2008)?
- −
- Are the labor markets of the V4 countries at risk of the hysteresis effect?
2.3. Method
In order to answer the research questions posed, Eurostat data was used on a quarterly basis for the period 2018–2021. All the used data were concerning individuals in the age range 15–64. The analysis of labor market reactions in the four countries analyzed began by comparing quarterly data characterizing the period from Q1 2018 to Q4 2021. Going back to the beginning of 2018 was intended to verify whether trends can be observed in the two years preceding the pandemic in the labor markets under study and whether the COVID-19 pandemic disrupted those trends. Data on the unemployment rate, time in the main job, and number of the employed and unemployed since Q1 2018 is presented in tabular form.
Due to the short duration and depth of the economic collapse, as well as the obvious lack of comparative data with no pandemic at the same time, the research method adopted in this paper is observation of trends visible in time series of data regarding the labor market situation. It allows a preliminary assessment of the impact of the COVID-19 pandemic on the scale of the increase in imbalances in individual labor markets and to determine changes in the structure of employment and unemployment. In order to achieve comparability of data, rates of change of the analyzed quantities were calculated taking as a base value the fourth quarter of 2019 (before the emergence of the pandemic). Charts were used to illustrate the rate of change; detailed calculations of rates of change are included in the table attached as Appendix A.
The subsequent charts are designed to track the rate of change of employment and unemployment of selected groups of workers against total employment. They allow us to observe both the short-term reaction of labor markets to the lockdown (Q2 2020), as well as the beginning of the medium-term reaction (Q4 2021). In the first case, it is possible to determine the scale of an economic shock; in the second, whether and to what extent the problems caused by the pandemic have been resolved. Determining the state of the labor market at the end of 2021 from the perspective of the unemployment level also allows to determine whether the V4 countries are at risk of hysteresis.
With regard to flexible forms of employment, the analysis covers temporary employment, part-time employment and self-employment. The analysis of changes in the labor market situation of potentially discriminated groups concerned: women, young people (aged 15–24), the elderly (55–64) and people with the lowest educational level (level 0–2).
3. Results
Quarterly changes in the unemployment rate, which illustrate to what extent the pandemic has changed the level of labor market imbalances in the V4 countries are presented in Table 1. The data indicates that the pandemic has affected labor market imbalances relatively moderately, while it stopped the trend of falling unemployment rates observed in all V4 countries in 2018–2019.
In the analyzed period, the highest increases in the unemployment rate compared to the last quarter of 2019 occurred in: Czechia in Q1 2021 (by 1.3 pp), Hungary in Q2 2020 (by 1.3 pp), Poland in Q1 2021 (by 1.2 pp and Slovakia in Q3 2020 (by 1.8 pp). Since the peak unemployment rate readings occurred in different countries in different quarters, it is worth comparing how they changed over the two-year period by comparing data for the final quarters of 2019 and 2021. In this comparison, we note an increase in the unemployment rate of: 0.2 pp in Czechia and Hungary and by 1.1 pp in Slovakia. Poland saw a return to pre-pandemic unemployment rates in Q4 2021.
The V4 economies absorbed the economic shock of the pandemic only to a small extent by reducing weekly hours of work in main job. In Czechia, one can speak of a lack of response of working hours to the pandemic, with a decrease of 0.1 h in 2020, similar to the two previous years. Compared to the last quarter of 2019, the highest decreases in hours worked per week were recorded in Hungary in Q2 2020 (0.4 h), in Poland and in Slovakia in Q1 2021 (0.4 h and 0.5 h respectively). Table 2 provides data on the changes in the number of the employed and unemployed in the V4 countries during the analyzed period.
In Czechia, employment was increasing in 2018–2019; as a result of the pandemic, a reversal of this trend (decrease in employment) was noted. A renewed increase in employment occurred in the last two quarters analyzed. Similar trends occurred in Slovakia, which, despite five quarters of employment growth, did not regain its pre-pandemic employment level until Q4 2021. Employment levels higher than in Q4 2019 were recovered by Hungary (in Q4 2021) and Poland (already in Q4 2020). Between Q4 2019 and Q4 2021, employment fell by 3.1% in Czechia and 1.5% in Slovakia; 0.6% employment growth was recorded in Hungary, and 2.7% employment growth was recorded in Poland.
The number of unemployed people changes in the opposite direction to the number of employed people. In the V4 economies, unemployment deepened in the first two quarters of 2020 (with Czechia as an exception, where unemployment was still falling in Q1 2020). Due to a lower baseline than for the employed, the percentage changes in the number of the unemployed are correspondingly higher. Between Q4 2019 and Q4 2021, the number of the unemployed increased by 8.9% in Czechia, by 15.1% in Hungary, by 18% in Slovakia, and by 2.7% in Poland.
Using the data in Table 2, one can check the responses to the pandemic by the labor force participation treated as a sum of those employed and unemployed, especially for Q2 2020 (the quarter of the largest economic shock) and Q4 2021. The comparison of Q2 2020 and Q2 2019 shows the highest decline in labor force participation in Poland and Slovakia (by 1.5%), a slight decline in Hungary (by 0.5%), and no reaction of the number of economically active in Czechia. The case of Czechia is interesting in that the country experienced a 2.9% decline in labor force participation between Q4 2021 and Q4 2019, further indicating no impact of the pandemic on labor force participation. In the same period, Slovakia saw a 0.4% decrease in labor force participation and Hungary saw a 1% increase, while in Poland labor force participation increased by 2.7%. This shows that labor force participation depends on the opportunities offered by the labor market (increased labor force participation is characteristic of economies where there has been a simultaneous increase in employment and unemployment).
Differences in changes of the number of the employed and unemployed in particular economies were determined by changes of the economic growth rate. The increase in the number of the employed in Poland in the analyzed period was associated with a shallow recession in 2020 (GDP decline by 2.5%), which was more than offset in the following year (GDP growth of 5.7%). The other V4 countries were slightly worse off from a growth perspective, recording respectively: Hungary 7.1% growth in 2021, after −4.7% in 2020 (which helped them regain pre-pandemic employment levels); Czechia 3.3% growth in 2021, after −5.8% in 2020; and Slovakia 3.0% growth in 2021, after −4.4% in 2020. (https://ec.europa.eu/eurostat/databrowser/view/tec00115/default/table?lang=en, access on 4 April 2022).
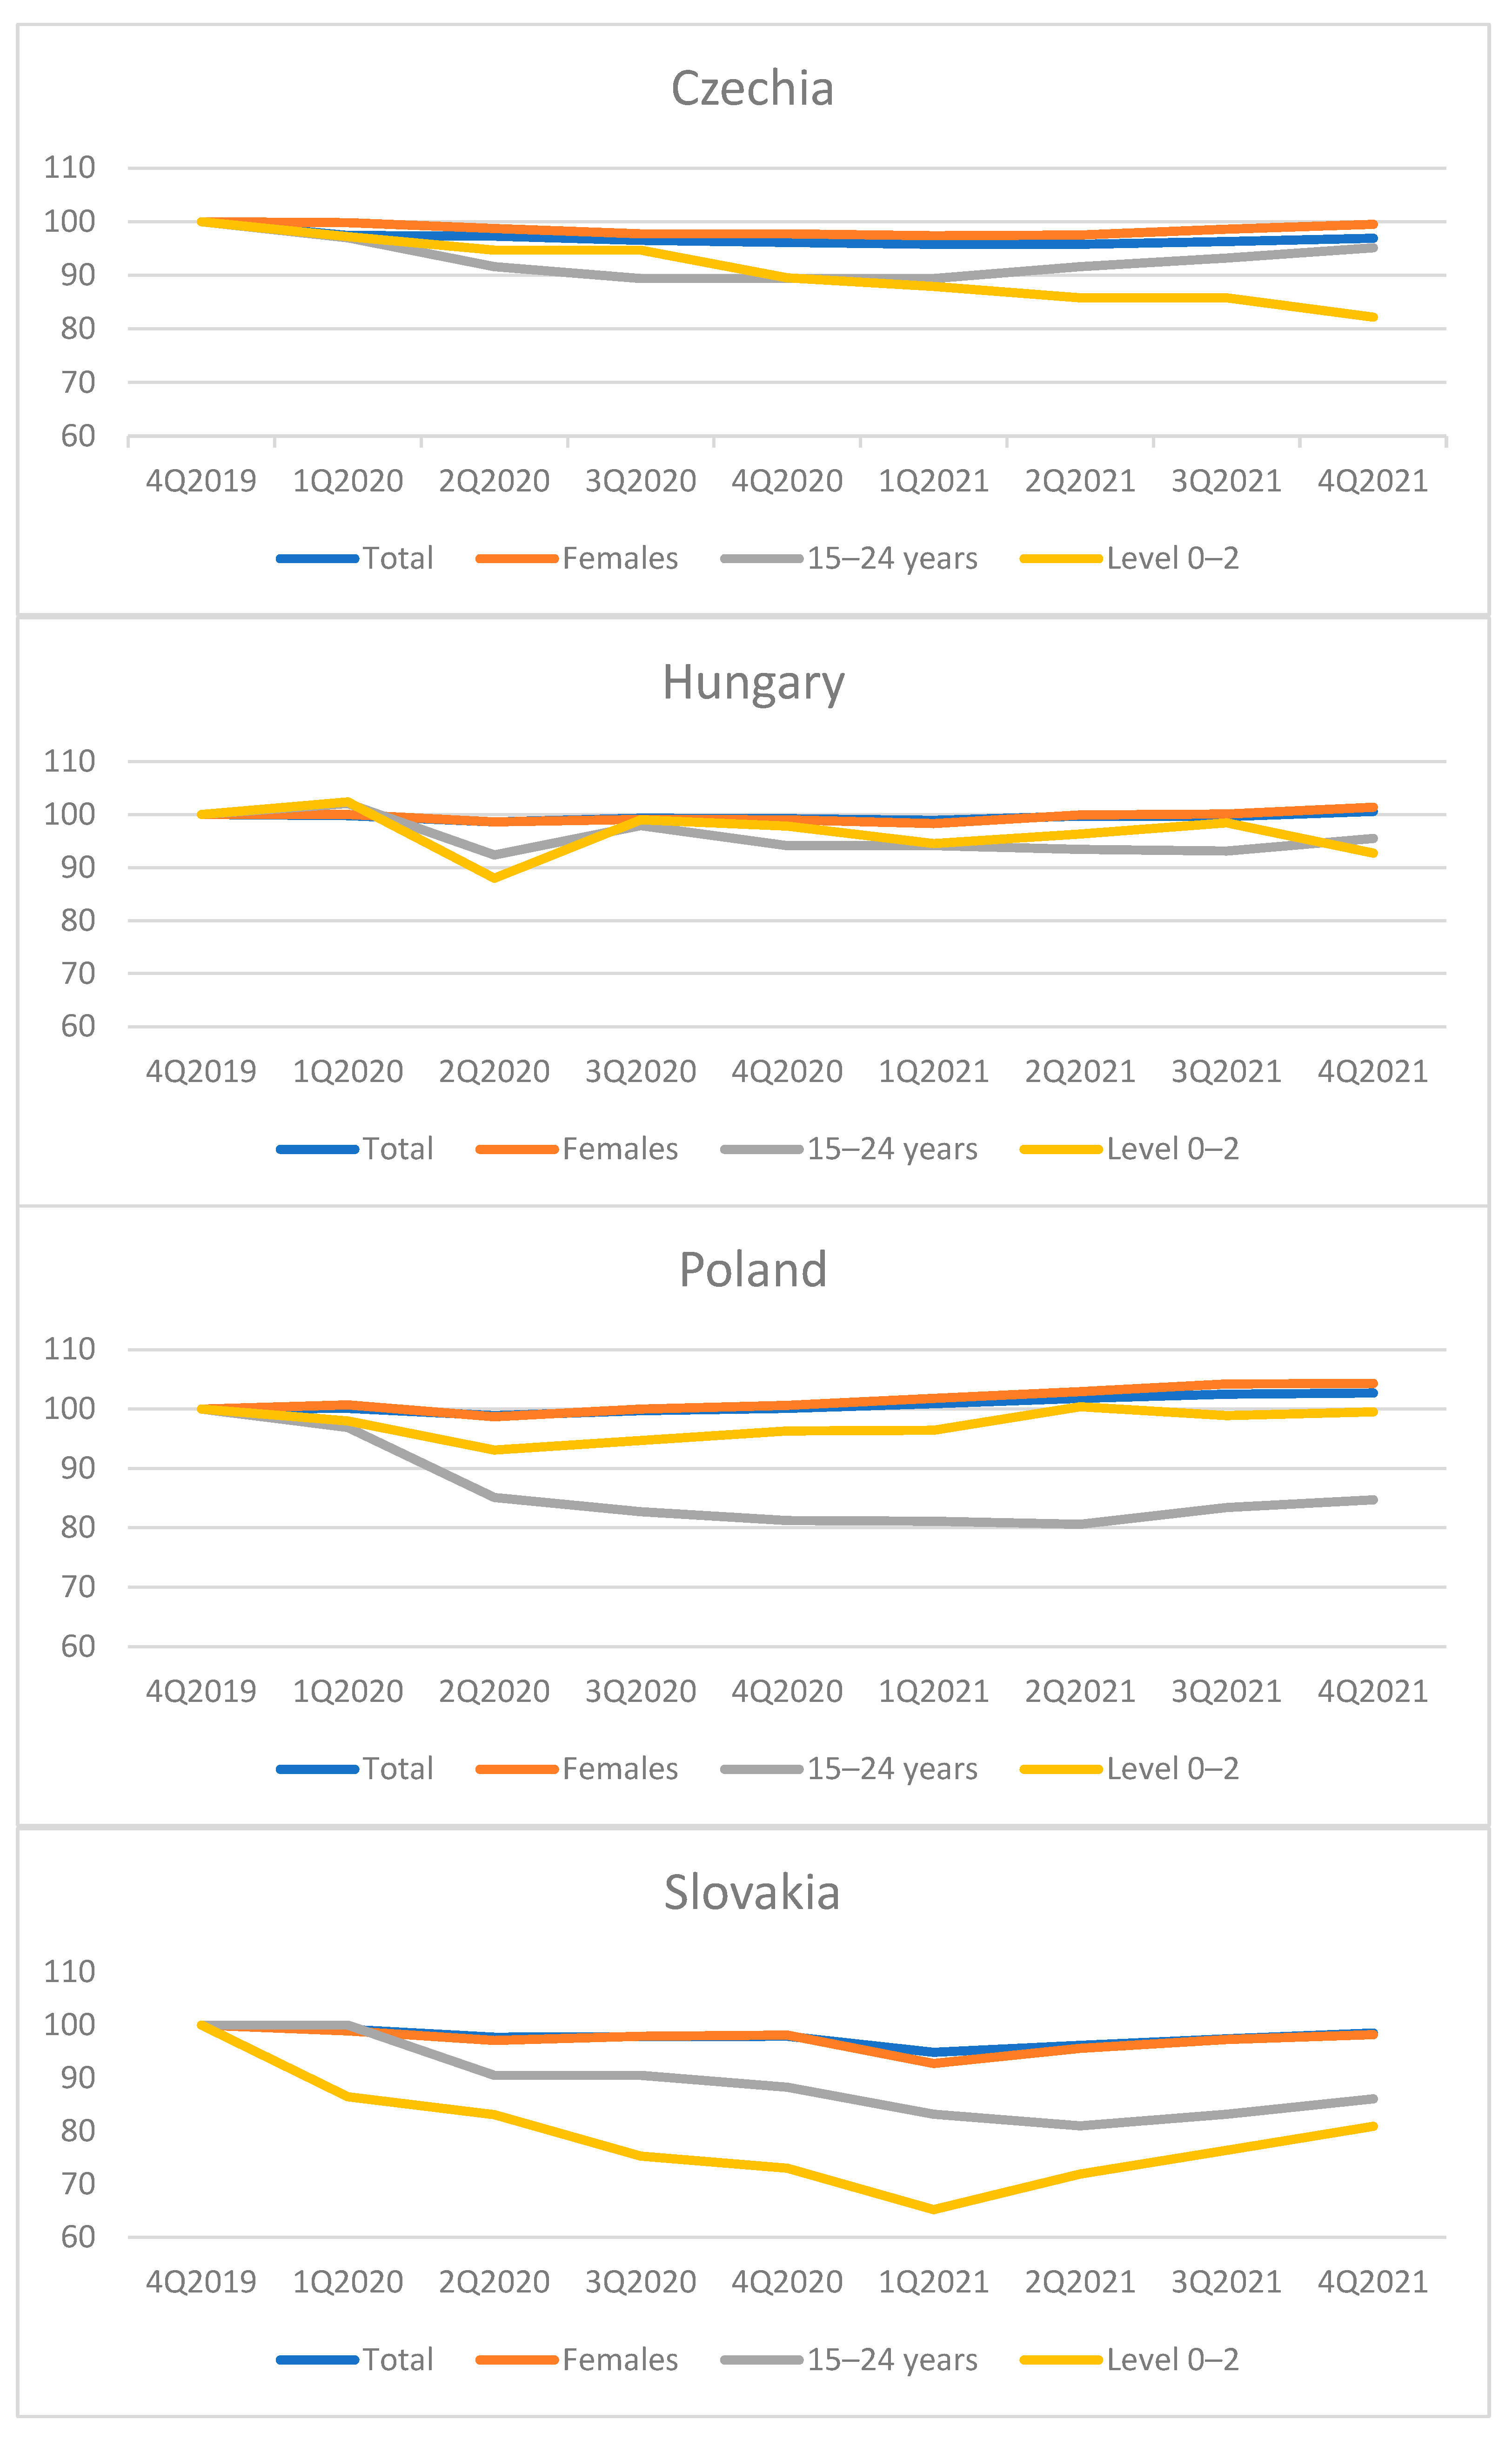
Data made available by Eurostat allow illustrating changes in employment and unemployment levels in selected cross-sections. Figure 1 shows the evolution of employment of women, young people, and people with the lowest educational attainment (level 0–2) in comparison to total employment in individual countries during the pandemic. Data for Q4 2019 were used as the baseline figure. Detailed values of indicators calculated for Figure 1, Figure 2, Figure 3 and Figure 4 are provided in the table attached as Appendix A.
All countries show similar changes in the level of female employment to total employment. Definitely, in the period of the pandemic, there was no discrimination in the labor markets of the V4 countries by gender. Female employment rates in Q4 2021 were higher than the total rates (the exception is Slovakia, where the rate was 98.2, with a rate of 98.5 for total employment).
Lower employment rates of the other two groups considered are noticeable. Their situation varied depending on the analyzed market. Young people were in a worse situation than people with the lowest education in Poland throughout the analyzed period. The opposite situation was observed in Slovakia (people with the lowest education recorded the lowest employment rate). In Czechia, in the first year of the pandemic, young people were in a worse situation, and in the second year the lowest employment rates were for people with the lowest education. In Hungary, employment rates for those with the lowest education and youth were similar.
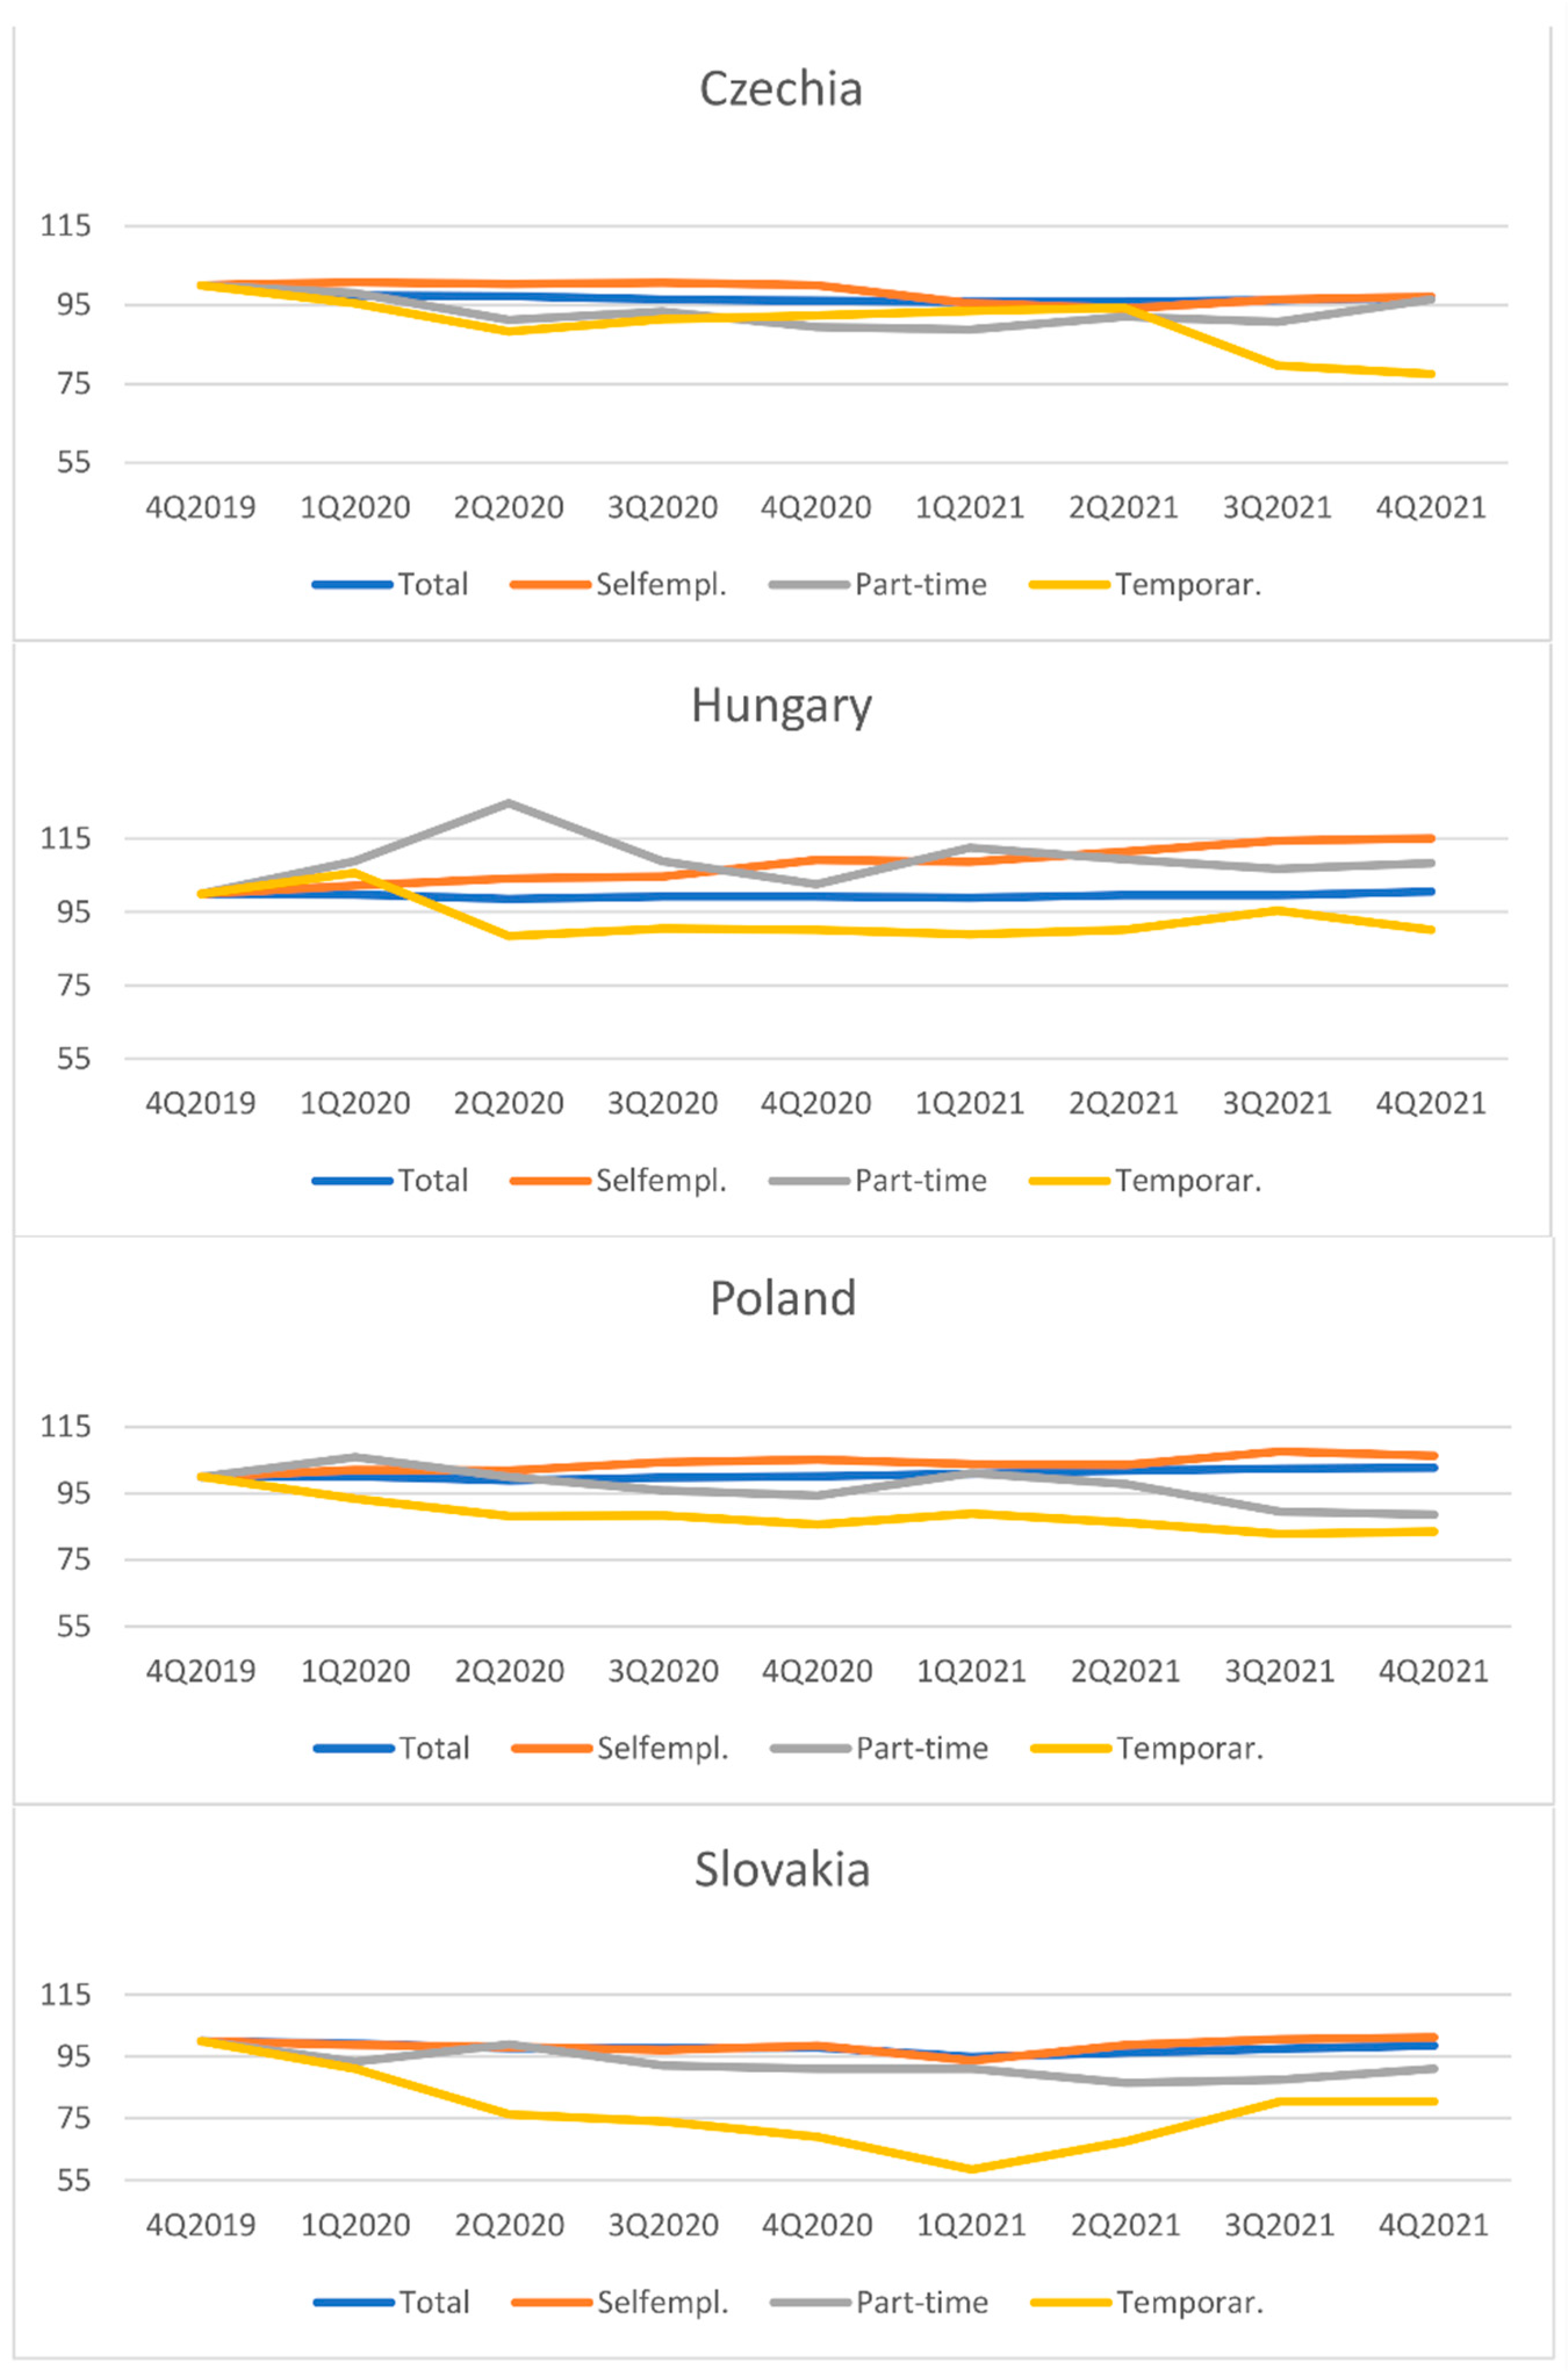
Figure 2 concerns the response to the pandemic of the scale of employment in flexible forms. It provides a summary of indicators characterizing changes in employment in basic flexible forms relative to the total employment rate.
In all markets of the V4 countries, a faster decrease in the temporary employment rate than in the total employment rate can be observed. This situation occurred in Hungary in Q2 2020, while in three other countries, in Q1 2020. The indicator fell the sharpest in Slovakia, reaching its minimum level (58.5) in Q1 2021. In all V4 countries, the temporary employment index is in Q4 2021 the lowest of all considered flexible forms of employment, with the smallest decrease in this index recorded in Hungary.
In most V4 countries, the rate of part-time employment fell faster than the total employment rate (from Q2 or Q3 2020). The exception is Hungary, where the part-time employment rate was higher than the total employment rate during the entire period under analysis, with its maximum value reaching 124.7 (Q2 2020).
The self-employment rate was higher than the total employment rate in the whole analyzed period in Poland and Hungary; in Czechia this situation occurred in the whole of 2020 and in the second half of 2021. In Slovakia, the self-employment rate was close to the total employment rate (in three out of eight quarters it was lower), remaining the highest among the indicators characterizing flexible forms of employment.
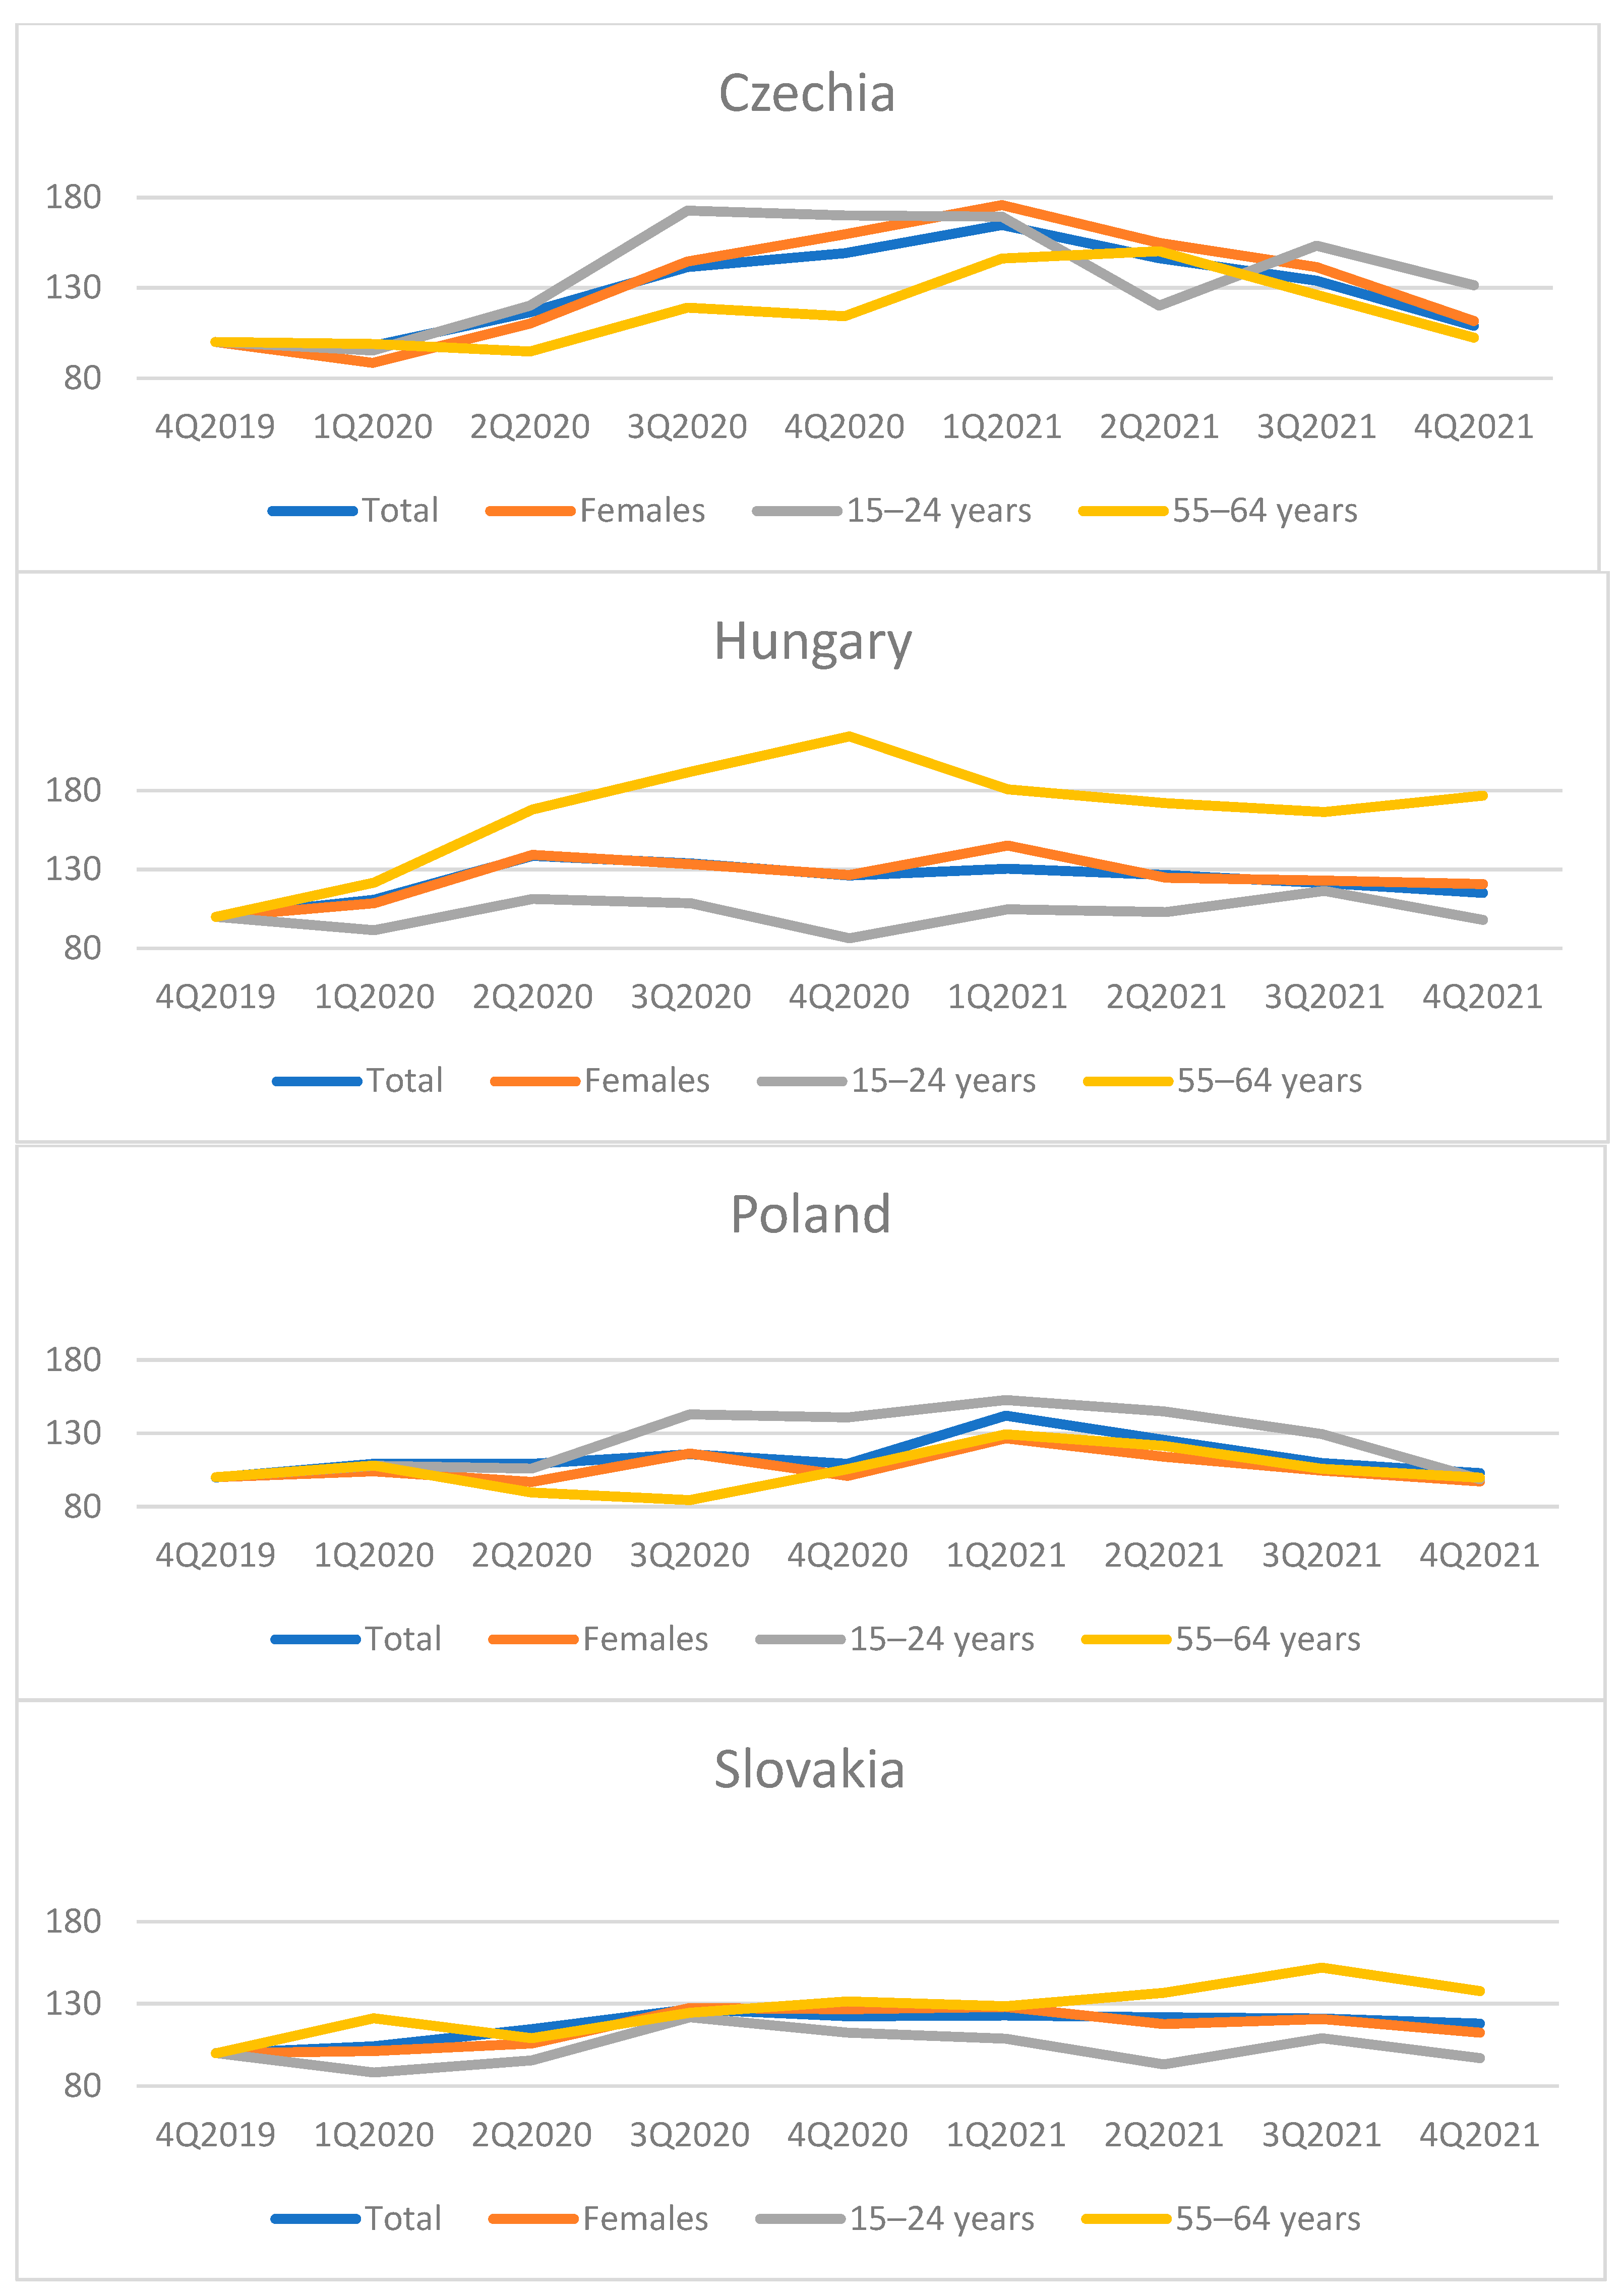
As the labor market situation depends on changes in labor force participation, to complete the picture of the labor market situation, including the group of people aged 55–64 (it was not possible to generate relevant data from Eurostat on the number of the employed in this group), changes in the indicators of the number of the unemployed were analyzed (Figure 3).
The increase in female unemployment slightly outpaced the increase in total unemployment in Czechia and Hungary. Given the lower decline in employment among women in these countries (Figure 1), this indicates the opposite trend to that observed in other labor markets, in the form of a higher decline in labor force participation among men. In Poland and Slovakia, the rate of increase in the number of unemployed women for most of the quarters considered was lower than the increase in total unemployment, which also confirms the lack of discrimination against women in the labor market during the pandemic.
V4 countries differ considerably when it comes to the response of unemployment levels among the youngest. In the case of Slovakia and Hungary, the increase in unemployment in the 15–24 age group clearly diverged downwards from the increase in total unemployment. In Poland, in the period Q3 2020–Q3 2021, unemployment in this group grew much faster than total unemployment, only to fall below the total unemployment rate in the last quarter under consideration. In Czechia, the number of unemployed persons aged 15–24 grew faster than total unemployment in six out of eight quarters. Taking into account the simultaneously lower-than-average employment and unemployment rates, it can be concluded that in three out of four V4 countries the pandemic caused a decline in youth labor force participation (the exception is Czechia, where a slightly lower—relative to the total data—employment rate was accompanied by a higher youth unemployment rate).
Significant differences also occurred for people in the oldest age group. In Czechia and Poland, unemployment of people aged 55–64 grew much slower than the total unemployment rate. The opposite situation occurred in the other two countries, with Slovakia showing two quarters in which the growth rate of unemployment in the oldest group was slightly lower than the overall rate, with an increase in unemployment at the end of Q3 2021 compared to the pre-pandemic period of 52% in this group. Unemployment in this age group grew relatively fastest in Hungary, where there was a 76.8% increase at the end of Q4 2021 (the peak increase in the number of unemployed people aged 55–64 was 114.4% (in Q4 2020)).
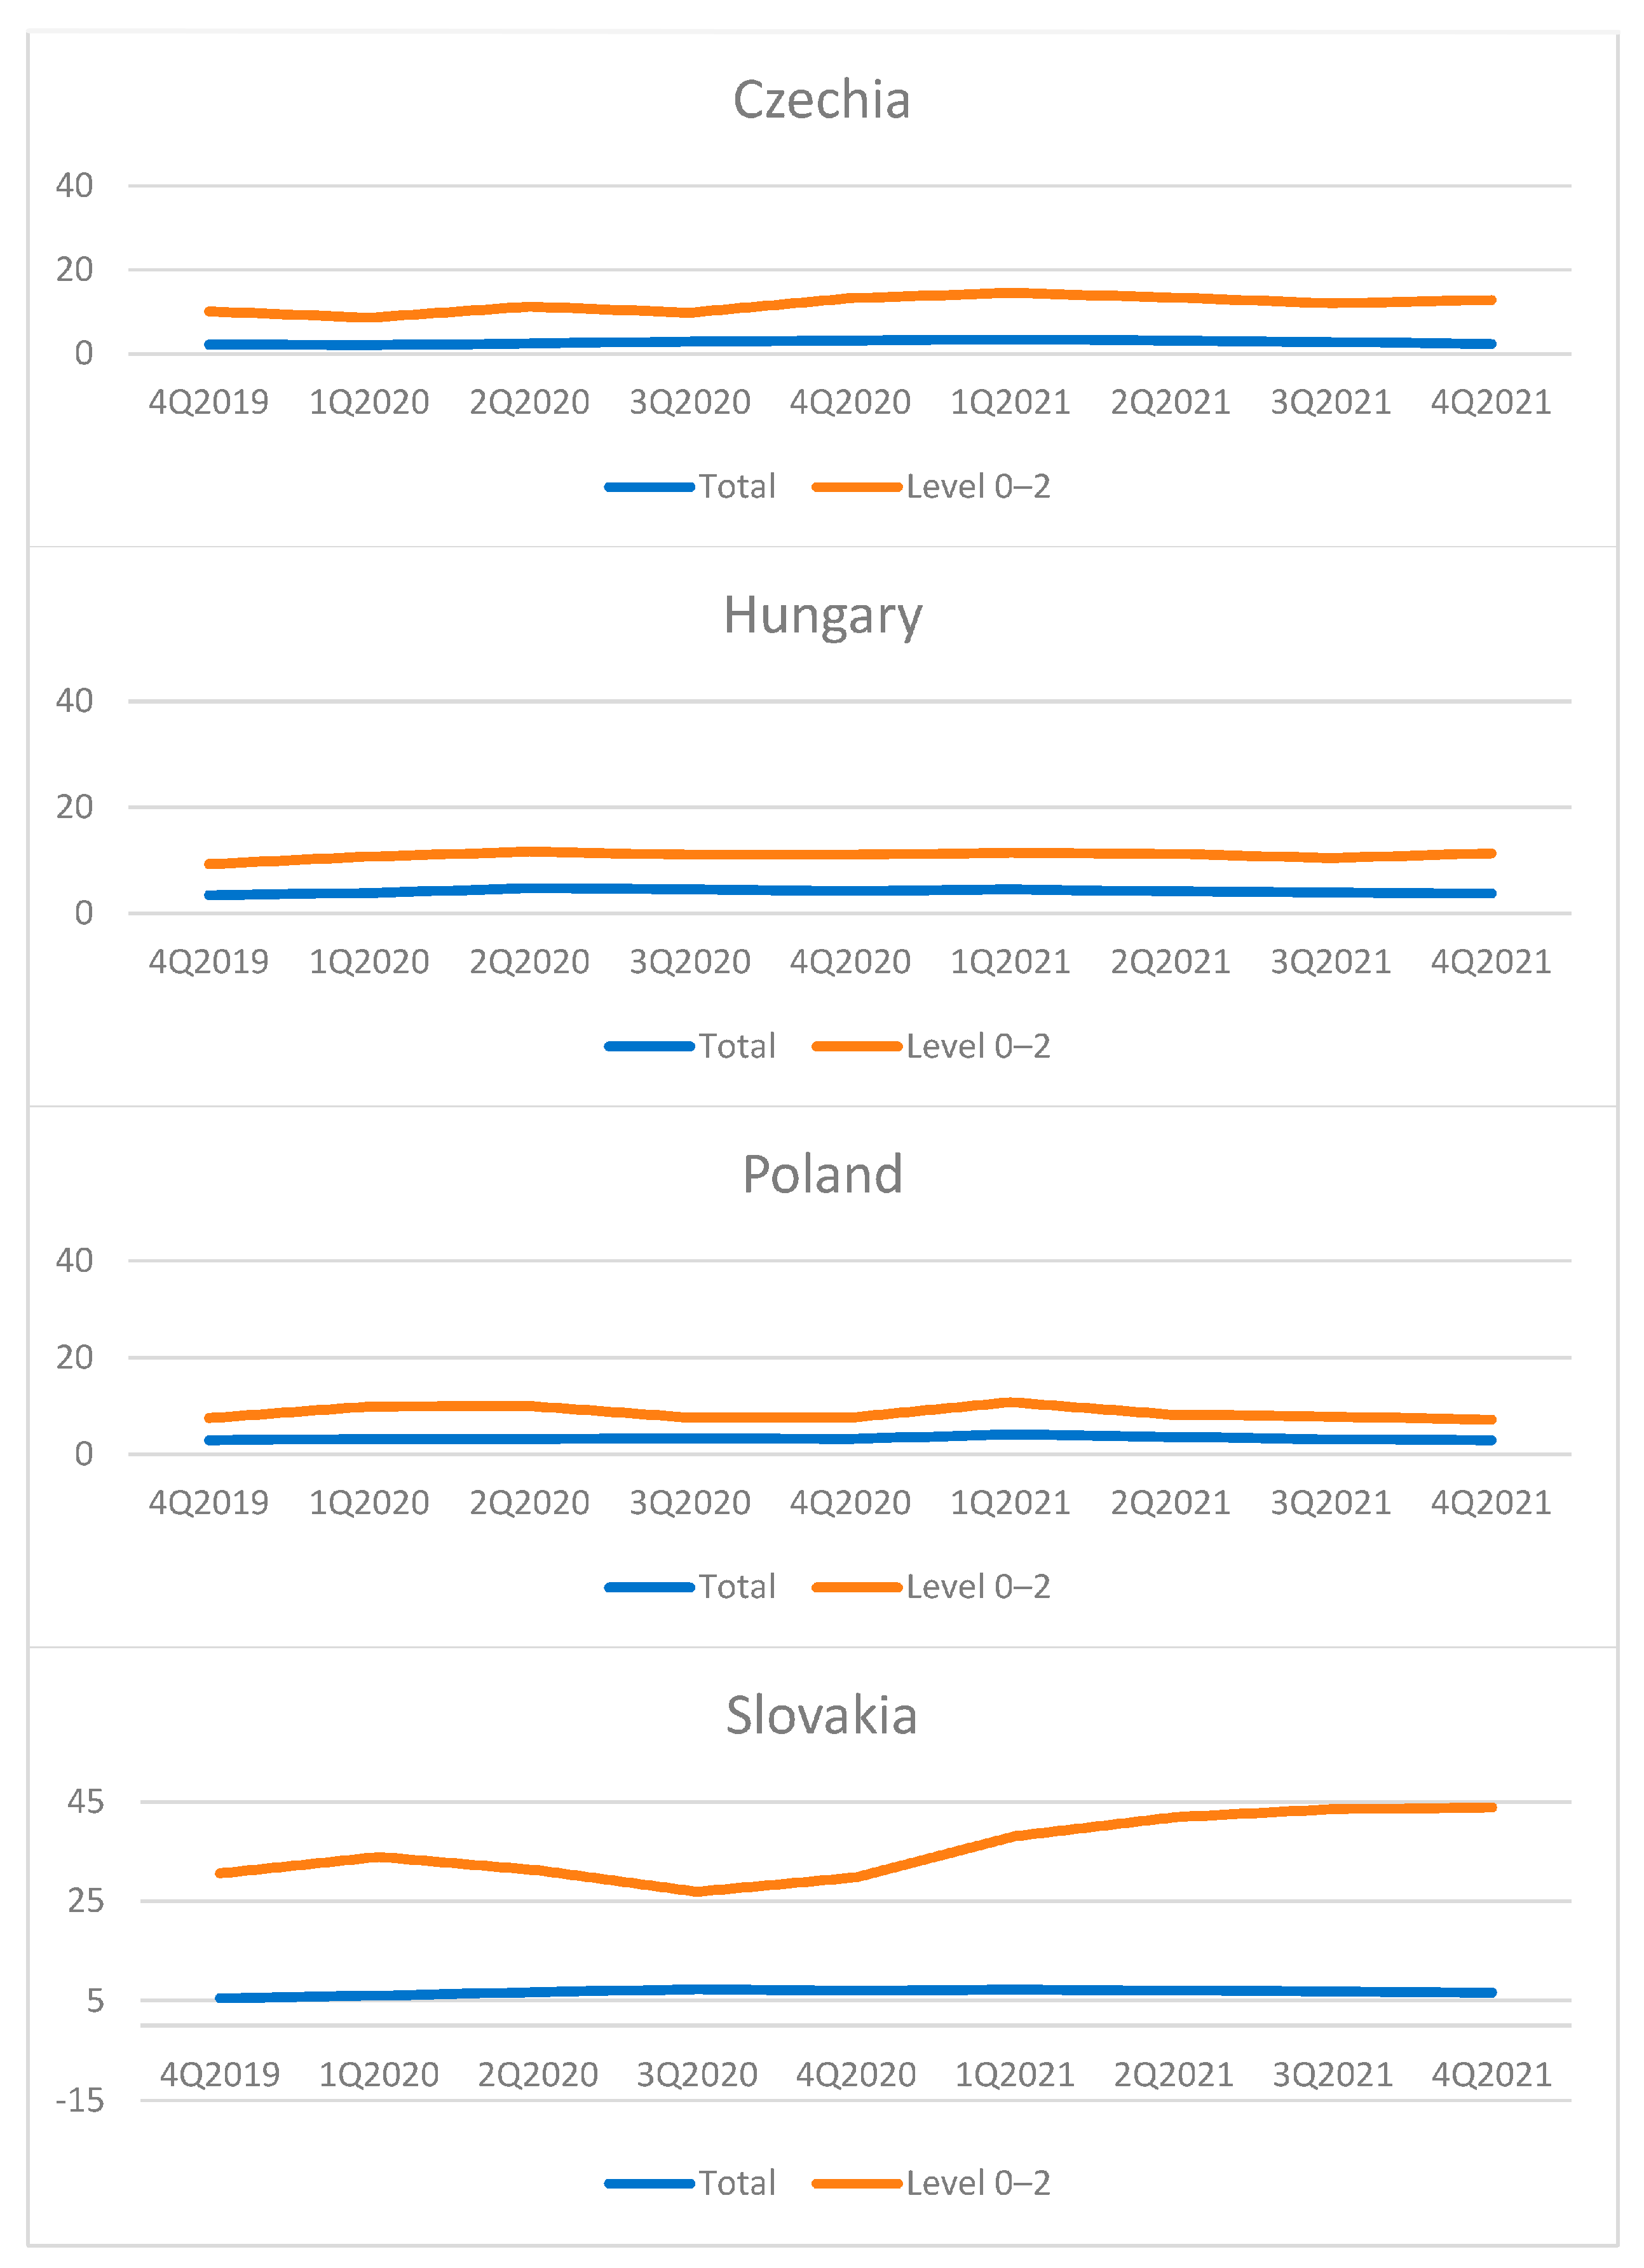
Since data on the number of unemployed people by level of education are not available, a comparison of unemployment rates in general and unemployment rates for people with the lowest level of education ((level 0–2), see Appendix A for details) was used to illustrate changes in the situation of the lowest educated in the labor market (Figure 4).
For Poland, at the end of 2021, the difference between the unemployment rate of the lowest educated persons and the total unemployment rate decreased by 0.3 pp. In Czechia and Hungary, although the difference between the unemployment rate of the least educated and the total unemployment rate increased, the gap between those figures increased only by 1.7 pp (Hungary) and 2.5 pp (Czechia). A sharp increase in the unemployment rate of people with the lowest level of education occurred in Slovakia, where the unemployment rate for this group rose from 30.6% in Q4 2019 to 43.5% in Q4 2021.
4. Discussion
Before the pandemic, the labor markets of three out of four V4 countries were characterized by unemployment rates close to frictional unemployment (ranging from 2.1 percent in Czechia to 3.4 percent in Hungary), so they remained close to equilibrium. The pandemic caused an increase in the unemployment rate in these economies of up to 1.3 pp. A more significant increase in the unemployment rate due to the pandemic occurred in Slovakia [82], which already, before the pandemic (in Q4 2019), had the highest level of unemployment rate among the V4 countries (5.5%).
Economic structures may be the reason why Poland and Hungary regained their pre-pandemic employment levels at the end of 2021 and the lack of such an effect in the Czechia and Slovakia. Poland and Hungary have a lower share of industry in employment and a lower level of employment in foreign-controlled enterprises. This may indicate a stronger employment reduction effect in industry than in services, caused by the interruption of supply chains. Verification of this assumption may be the direction of further research.
The relatively weak (compared to other economies) response of V4 countries’ labor markets to the pandemic may be explained by the low unemployment rate at the end of 2019, which may have entailed weak employer responses in the form of layoff decisions (employers may have been concerned about the difficulty of recovering laid-off workers who may have found another job). Two additional factors limiting the increase in unemployment in the V4 countries were the moderate severity of the recession in 2020 and the rebound in 2021, as well as financial support for companies affected by the lockdown from public funds, provided that employment was maintained. As a result of a moderate increase in unemployment, V4 countries do not have to fear the hysteresis effect [21] caused by COVID-19 pandemic on the macroeconomic level.
Among flexible forms of employment, according to research on the previous economic crisis [77], temporary employment fell the most. A decrease in employment (at a slightly lower level) was recorded for part-time employment in three of the V4 countries (the exception being Hungary, where the part-time employment rate was higher than the total employment rate). The “entrepreneurship out of necessity” effect was confirmed [79] in response to economic downturns. The self-employment rate was higher than the total employment rate for most of the analyzed period in all V4 countries.
It is noteworthy that in Czechia and Poland, the temporary employment rate was also falling in the second half of 2021, with a significant improvement in the labor market situation. This may be due to the return to low levels of unemployment, which influences the behavior of employers (standard employment contracts bind employees to the company more strongly and contribute to lower turnover) and employees (preferring permanent employment over flexible ones), as well as shifts between sectors (taking over employees from industries burdened with lockdown by industries which make less use of flexible forms of employment). The answer to the question of which of the above factors was decisive may provide a direction for further research.
In the case of the V4 countries, it was not confirmed that the pandemic had a more negative impact on the situation of women in the labor market, which was already indicated by an earlier study on Hungary [14]. This confirms the results of research during the previous economic crisis on the possible discrimination of women in the labor market in V4 countries [80]. To a large extent, this situation is determined by the higher level of human capital of women, if we take the level of education as its picture. The share among employed persons with higher education (level 5–8) was, in 2020: Czechia (22.6% among men, 27.7% among women), Hungary (23.9% among men, 35.6% among women), Poland (28.6% among men, 47.6% among women), and Slovakia (23.2% among men, 37.3% among women) (https://ec.europa.eu/eurostat/databrowser/view/lfsi_educ_a/default/table?lang=en (accessed on 10 April 2022)).
The results of analyses relating to the worse labor market Situation of young adults, older workers, and people with lower education observed in other economies [42,43]; in the case of V4 countries’, labor markets are inconclusive. If we assume that the more than ten points lower employment rate at the end of 2021 in relation to total employment is a picture of “crowding out” from employment, such a situation affected young people in Slovakia and Poland and people with the lowest education in Czechia and Slovakia. The smallest difference between employment rates for the analyzed groups of employees was observed in Hungary (the difference between the lowest rate of youth employment and total employment was 7.9 (in Q4 2021)).
The analysis of unemployment levels and rates also indicates discrimination against people aged 55–64 in Hungary and those with the lowest education in Slovakia. The case of the last group (at the same time a high decrease in the number of the employed and a continuous increase in the unemployment rate of people with low education in Slovakia) confirms that the groups most affected by layoffs remain unemployed the longest [57]. Thus, in contrast to the previous economic crisis, which did not cause discrimination in the labor markets of the V4 countries [80], discriminated groups have appeared in the labor markets of the V4 countries, which is probably the result of a sharper economic collapse due to the COVID-19 pandemic than during the financial crisis.
A limitation to the generalizability of the results obtained lies in the specificity of the group of countries considered, characterized by similar institutional conditions and low levels of unemployment in the period before the pandemic.
5. Conclusions
The relatively small response of the V4 labor markets is associated with a relatively shallow recession and recovery in 2021. Apart from the restoration of economic activity, the scale of the increase in the unemployment rate is determined by its initial level, as indicated by the highest scale of increase in Slovakia. The small loss of jobs in the other countries analyzed may indicate that employers, aware of the small imbalance in the labor market, tried not to reduce employment for fear of difficulties in regaining staff.
Flexible forms of employment in most economies reacted as a business cycle buffer, manifested (with few exceptions) by a decline in temporary employment, part-time jobs and an increase in self-employment.
While the pandemic did not cause a deterioration in the situation of women in the labor market, some markets saw a deterioration in the situation of young people, those aged 55–64, and those with a lower level of education. The latter group recorded the highest drops in employment and increases in unemployment among groups threatened with discrimination in the labor market (the exception is Poland, where people aged 15–24 were in the most difficult situation).
In the short term, right after the economic shock related to the pandemic, state intervention contributed to curbing the rise in unemployment [81]. Taking into account the effects of the intervention in the form of limiting the imbalance of the labor market, it is recommended to take similar actions in the event of another shock. Since state intervention entails an increase in public debt, its scale should be adjusted to the depth of the shock.
Further directions of research in relation to the issue undertaken concern changes in the structure of employment after overcoming the effects of the COVID-19 pandemic. It is advisable to conduct them when all economies of the V4 countries will return to the level of employment from the end of 2019. If it turns out that there have been changes in the structure of employment, it will be important to answer the question of what extent they are related to the shift of employees between industries of the economy. An additional direction of research may be to determine the correlation between employment/unemployment and the factors affecting them, as identified in the article.
Funding
The research was financed from Statutory research 2022 (Faculty of Economics and Management, of Opole University of Technology).
Institutional Review Board Statement
Not applicable.
Informed Consent Statement
Not applicable.
Data Availability Statement
Not applicable—Eurostat database was used.
Conflicts of Interest
The author declares no conflict of interest. The funders had no role in the design of the study; in the collection, analyses, or interpretation of data; in the writing of the manuscript; or in the decision to publish the results.
Appendix A

Table A1.
Quarterly rates of change in employment and unemployment levels in selected cross-sections (Q4 2019 = 100).
Table A1.
Quarterly rates of change in employment and unemployment levels in selected cross-sections (Q4 2019 = 100).
| Country/ Employment/ Unemployment | Q1 2020 | Q2 2020 | Q3 2020 | Q4 2020 | Q1 2021 | Q2 2021 | Q3 2021 | Q4 2021 |
|---|---|---|---|---|---|---|---|---|
| Czechia | ||||||||
| Total employment | 97.4 | 97.3 | 96.5 | 96.1 | 95.8 | 95.8 | 96.3 | 96.9 |
| Females | 99.8 | 98.7 | 97.7 | 97.7 | 97.4 | 97.5 | 98.6 | 99.5 |
| 15–24 years | 97.0 | 91.6 | 89.4 | 89.4 | 89.4 | 91.6 | 93.2 | 95.1 |
| Education level 0–2 | 97.2 | 94.7 | 94.7 | 89.5 | 87.9 | 85.8 | 85.8 | 82.2 |
| Self-employment | 100.8 | 100.3 | 100.7 | 100.1 | 95.4 | 94.1 | 96.4 | 97.1 |
| Part-time job | 98.1 | 91.3 | 93.3 | 89.4 | 88.8 | 92.0 | 90.7 | 96.5 |
| Temporary | 95.4 | 88.3 | 91.4 | 92.3 | 93.5 | 94.4 | 79.6 | 77.5 |
| Total unemployment | 97.8 | 116.5 | 141.4 | 149.0 | 164.8 | 146.3 | 133.9 | 108.9 |
| Females | 88.5 | 110.2 | 144.4 | 159.5 | 175.8 | 154.8 | 141.4 | 111.5 |
| 15–24 years | 95.3 | 120.0 | 172.7 | 170.0 | 169.3 | 120.0 | 153.3 | 131.3 |
| 55–64 years | 98.8 | 94.7 | 118.9 | 114.2 | 146.2 | 150.3 | 126.0 | 102.4 |
| Unemployment rate, education level 0–2 | 8.6 | 11.2 | 9.8 | 13.2 | 14.5 | 13.4 | 12.0 | 12.8 |
| Hungary | ||||||||
| Total employment | 99.8 | 98.6 | 99.3 | 99.2 | 98.9 | 99.7 | 99.6 | 100.6 |
| Females | 100.0 | 98.6 | 99.1 | 99.0 | 98.3 | 99.9 | 100.1 | 101.4 |
| 15–24 years | 102.1 | 92.4 | 97.9 | 94.1 | 94.1 | 93.4 | 93.1 | 95.5 |
| Education level 0–2 | 102.4 | 88.0 | 99.0 | 97.8 | 94.5 | 96.3 | 98.4 | 92.7 |
| Self-employment | 102.3 | 104.1 | 104.7 | 109.2 | 108.8 | 111.6 | 114.5 | 115.1 |
| Part-time job | 108.9 | 124.7 | 108.9 | 102.6 | 112.6 | 109.5 | 106.8 | 108.4 |
| Temporary | 105.7 | 88.5 | 90.6 | 90.2 | 88.9 | 90.2 | 95.5 | 90.2 |
| Total unemployment | 110.8 | 138.6 | 133.8 | 126.2 | 130.5 | 126.4 | 121.4 | 115.1 |
| Females | 108.6 | 139.2 | 133.3 | 126.5 | 145.2 | 124.7 | 122.9 | 120.7 |
| 15–24 years | 91.5 | 111.3 | 108.5 | 86.5 | 104.8 | 103.0 | 116.5 | 98.0 |
| 55–64 years | 121.6 | 168.0 | 192.0 | 214.4 | 180.8 | 172.0 | 166.4 | 176.8 |
| Unemployment rate, education level 0–2 | 10.7 | 11.6 | 11.0 | 11.0 | 11.4 | 11.2 | 10.4 | 11.3 |
| Poland | ||||||||
| Total employment | 100.1 | 98.9 | 99.7 | 100.1 | 100.9 | 101.8 | 102.5 | 102.7 |
| Females | 100.7 | 98.7 | 100.0 | 100.6 | 101.8 | 102.9 | 104.2 | 104.3 |
| 15–24 years | 96.9 | 85.1 | 82.7 | 81.2 | 81.1 | 80.6 | 83.4 | 84.7 |
| Education level 0–2 | 98.0 | 93.1 | 94.7 | 96.3 | 96.4 | 100.4 | 98.9 | 99.5 |
| Self-employment | 102.0 | 101.9 | 104.3 | 105.2 | 103.9 | 103.7 | 107.6 | 106.3 |
| Part-time job | 105.9 | 100.0 | 95.8 | 94.3 | 101.1 | 97.8 | 89.6 | 88.6 |
| Temporary | 93.4 | 88.2 | 88.3 | 85.7 | 88.9 | 86.2 | 82.8 | 83.6 |
| Total unemployment | 109.1 | 109.2 | 115.7 | 109.2 | 142.0 | 125.4 | 109.6 | 102.7 |
| Females | 104.0 | 96.9 | 116.1 | 100.8 | 126.6 | 113.9 | 104.5 | 97.0 |
| 15–24 years | 107.7 | 105.8 | 142.9 | 140.7 | 152.7 | 144.9 | 129.4 | 98.7 |
| 55–64 years | 107.9 | 89.6 | 84.5 | 105.5 | 129.3 | 121.4 | 105.7 | 99.6 |
| Unemployment rate, education level 0–2 | 9.9 | 10.0 | 7.6 | 7.6 | 10.8 | 8.2 | 7.8 | 7.2 |
| Slovakia | ||||||||
| Total employment | 99.2 | 97.7 | 97.8 | 97.9 | 94.9 | 96.2 | 97.4 | 98.5 |
| Females | 98.9 | 97.1 | 97.9 | 98.1 | 92.8 | 95.6 | 97.3 | 98.2 |
| 15–24 years | 100.0 | 90.5 | 90.5 | 88.3 | 83.2 | 81.0 | 83.2 | 86.1 |
| Education level 0–2 | 86.5 | 83.1 | 75.3 | 73.0 | 65.2 | 71.9 | 76.4 | 80.9 |
| Self-employment | 98.7 | 98.1 | 97.0 | 98.6 | 93.7 | 98.8 | 100.7 | 101.2 |
| Part-time job | 93.3 | 98.9 | 92.1 | 91.0 | 91.0 | 86.5 | 87.6 | 91.0 |
| Temporary | 91.1 | 76.4 | 74.0 | 69.1 | 58.5 | 67.5 | 80.5 | 80.5 |
| Total unemployment | 104.2 | 114.5 | 126.7 | 122.4 | 122.9 | 121.8 | 121.0 | 118.0 |
| Females | 101.2 | 105.9 | 127.4 | 126.7 | 128.1 | 117.6 | 120.7 | 112.4 |
| 15–24 years | 88.2 | 95.5 | 121.8 | 112.5 | 108.7 | 93.1 | 109.0 | 96.9 |
| 55–64 years | 121.1 | 109.1 | 124.6 | 131.4 | 128.6 | 136.6 | 152.0 | 137.7 |
| Unemployment rate, education level 0–2 | 33.9 | 31.2 | 26.9 | 29.8 | 38.1 | 41.9 | 43.5 | 43.9 |
Source: Own calculations based on Eurostat database.
References
- Jena, P.R.; Majhi, R.; Kalli, R.; Managi, S.; Majhi, B. Impact of COVID-19 on GDP of major economies: Application of the artificial neural network forecaster. Econ. Anal. Policy 2021, 69, 324–339. [Google Scholar] [CrossRef]
- Wang, F.; Ge, X.; Huang, D. Government Intervention, Human Mobility, and COVID-19: A Causal Pathway Analysis from 121 Countries. Sustainability 2022, 14, 3694. [Google Scholar] [CrossRef]
- Boldureanu, G.; Roman, T.C.; Bercu, A.-M.; Boldureanu, D. The influence of the COVID-19 pandemic on the economic activites. In Pandemic Challenges for European Finance, Business and Regulation; Tofan, M., Bilan, I., Cigu, E., Eds.; Universitatea “Alexandru Ioan Cuza”: Iași, Romania, 2021; pp. 519–529. [Google Scholar]
- Liu, N.; Xu, Z.; Skare, M. The research on COVID-19 and economy from 2019 to 2020: Analysis from the perspective of bibliometrics. Oeconomia Copernic. 2021, 12, 217–268. [Google Scholar] [CrossRef]
- Feitelson, E.; Plaut, P.; Salzberger, E.; Shmueli, D.; Altshuler, A.; Ben-Gal, M.; Israel, F.; Rein-Sapir, Y.; Zaychik, D. The Effects of COVID-19 on Wellbeing: Evidence from Israel. Sustainability 2022, 14, 3750. [Google Scholar] [CrossRef]
- Groshen, E.L. COVID-19’s impact on the U.S. labor market as of September 2020. Bus. Econ. 2020, 55, 213–228. [Google Scholar] [CrossRef]
- Rožman, M.; Peša, A.; Rajko, M.; Štrukelj, T. Building Organisational Sustainability during the COVID-19 Pandemic with an Inspiring Work Environment. Sustainability 2021, 13, 11747. [Google Scholar] [CrossRef]
- Gharehgozli, O.; Nayebvali, P.; Gharehgozli, A.; Zamanian, Z. Impact of COVID-19 on the Economic Output of the US Outbreak’s Epicenter. Econom. Dis. Climate Chang. 2020, 4, 561–573. [Google Scholar] [CrossRef]
- Hayakawa, K.; Mukunoki, H. Impacts of COVID-19 on International Trade: Evidence from the First Quarter of 2020. IDE Discuss. Pap. 2020, 791, 1–23. [Google Scholar] [CrossRef]
- Vidya, C.T.; Prabheesh, K.P. Implications of COVID-19 Pandemic on the Global Trade Networks. Emerg. Mark. Financ. Trade 2020, 56, 2408–2421. [Google Scholar] [CrossRef]
- Wilson, J.M.; Lee, J.; Fitzgerald, H.N.; Oosterhoff, B.; Sevi, B.; Shook, N.J. Job Insecurity and Financial Concern During the COVID-19 Pandemic Are Associated with Worse Mental Health. J. Occup. Environ. Med. 2020, 62, 686–691. [Google Scholar] [CrossRef]
- Zhou, W.; Pan, Z.; Jin, Q.; Feng, Y. Impact of Self-Perceived Employability on Sustainable Career. Development in Times of COVID-19: Two Mediating Paths. Sustainability 2022, 14, 3753. [Google Scholar] [CrossRef]
- Montenovo, L.; Jiang, X.; Rojas, F.L.; Schmutte, I.M.; Simon, K.I.; Weinberg, B.A.; Wing, C. Determinants of Disparities in COVID-19 Job Losses. NBER Work. Pap. Ser. 2020, 27132, w27132. [Google Scholar] [CrossRef]
- Karacsony, P.; Krupánszki, K.; Antalík, I. Analysis of the Impact of the COVID-19 Crisis on the Hungarian Employees. Sustainability 2022, 14, 1990. [Google Scholar] [CrossRef]
- Bartik, A.W.; Bertrand, M.; Cullen, Z.B.; Glaeser, E.L.; Luca, M.; Stanton, C. The impact of COVID-19 on small business outcomes and expectations. Proc. Natl. Acad. Sci. USA 2020, 117, 1–43. [Google Scholar] [CrossRef] [PubMed]
- Kahn, L.B.; Lange, F.; Wiczer, D.G. Labor Demand in the Time of COVID-19: Evidence from Vacancy Postings and UI Claims. NBER Work. Pap. Ser. 2020, 27061, 104238. [Google Scholar] [CrossRef]
- Raghavan, A.; Demircioglu, M.A.; Orazgaliyev, S. COVID-19 and the New Normal of Organizations and Employees: An Overview. Sustainability 2021, 13, 11942. [Google Scholar] [CrossRef]
- Nebolsina, E. The impact of the COVID-19 pandemic on the business interruption insurance demand in the United States. Heliyon 2021, 7, e08357. [Google Scholar] [CrossRef]
- The World Bank. Global Economy to Expand by 4% in 2021; Vaccine Deployment and Investment Key to Sustaining the Recovery. Press Release. 2021. Available online: https://www.worldbank.org/en/news/press-release/2021/01/05/global-economy-to-expand-by-4-percent-in-2021-vaccine-deployment-and-investment-key-to-sustaining-therecovery (accessed on 14 April 2022).
- Meyer, B.H.; Prescott, B.; Sheng, X.S. The impact of the COVID-19 pandemic on business expectations. Int. J. Forecast. 2022, 38, 529–544. [Google Scholar] [CrossRef]
- Stiglitz, J.E. The proper role of government in the market economy: The case of the post-COVID recovery. J. Gov. Econ. 2021, 1, 100004. [Google Scholar] [CrossRef]
- Hassan, T.A.; Hollander, S.; van Lent, L.; Tahoun, A. Firm-level exposure to epidemic diseases: COVID-19, SARS, and H1N1. Work. Pap. Ser. Inst. 2020, 119, 1–34. [Google Scholar] [CrossRef] [Green Version]
- Fairlie, R.W. The impact of COVID-19 on small business owners: Evidence from the first three months after widespread social-distancing restrictions. J. Econ. Manag. Strategy 2020, 29, 727–740. [Google Scholar] [CrossRef] [PubMed]
- Chetty, R.; Friedman, J.N.; Hendren, N.; Stepner, M.; the Opportunity Insights Team. How Did COVID-19 and Stabilization Policies Affect Spending and Employment? A New Real-Time Economic Tracker Based on Private Sector Data; National Bureau of Economic Research: Cambridge, MA, USA, 2020. [Google Scholar]
- Coibion, O.; Gorodnichenko, Y.; Weber, M. Does Policy Communication during COVID-19 Work? IZA Inst. Labor Econ. Discuss. Pap. Ser. 2020, 13355, 1–51. Available online: https://ftp.iza.org/dp13355.pdf (accessed on 10 April 2022). [CrossRef]
- Chernick, H.; Copeland, D.; Reschovsky, A. The Fiscal Effects of the COVID-19 Pandemic on Cities: An Initial Assessment. Natl. Tax J. 2020, 73, 699–732. [Google Scholar] [CrossRef]
- Clemens, J.; Veuger, S. Implications of the COVID-19 Pandemic for State Government Tax Revenues. Natl. Tax J. 2020, 73, 619–644. [Google Scholar] [CrossRef]
- Green, D.; Loualiche, E. State and local government employment in the COVID-19 crisis. J. Public Econ. 2021, 193, 104321. [Google Scholar] [CrossRef]
- Milani, F. COVID-19 outbreak, social response, and early economic effects: A global VAR analysis of cross-country interdependencies. J. Popul. Econ. 2021, 34, 223–252. [Google Scholar] [CrossRef]
- Tetlow, G.; Pope, T.; Dalton, G. Coronavirus and unemployment: A five nation comparison. Inst. Gov. 2020. Available online: https://www.instituteforgovernment.org.uk/sites/default/files/publications/coronavirus-unemployment-five-nation-comparison.pdf (accessed on 14 April 2022).
- Carranza, E.; Farole, T.; Gentilini, U.; Morgandi, M.; Packard, T.; Santos, I.; Weber, M. Managing the Employment Impacts of the COVID-19 Crisis: Policy Options for Relief and Restructuring; Jobs Working Paper; World Bank: Washington, DC, USA, 2020; Volume 49, pp. 1–36. [Google Scholar]
- Pissarides, C.A. Equilibrium Unemployment Theory; MIT Press: Cambridge, MA, USA, 2000. [Google Scholar]
- Holzer, H.J. Employers in the Low-Wage Labour Market: Is Their Role Important? In Job Quality and Employer Behavior; Bazen, S., Lucifora, C., Salverda, W., Eds.; Palgrave, Macmillan: Hampshire, UK, 2005; pp. 87–110. [Google Scholar] [CrossRef]
- Kraal, K.; Roosblad, J.; Wrench, J. Equal Opportunities and Ethnic Inequality in European Labour Markets, Discrimination, Gender and Policies of Diversity; Amsterdam University Press: Amsterdam, The Netherlands, 2010. [Google Scholar]
- Shortland, S. Gender diversity in expatriation: Evaluating theoretical perspectives. Gend. Manag. 2009, 24, 365–386. [Google Scholar] [CrossRef]
- Belan, P.; Carré, M.; Gregoir, S. Subsidizing low-skilled jobs in a dual labor market. Labour Econ. 2010, 17, 776–788. [Google Scholar] [CrossRef] [Green Version]
- Tomé, E.L. Employability, skills and training in Portugal (1988–2000): Evidence from official data. J. Eur. Ind. Train. 2007, 31, 336–357. [Google Scholar] [CrossRef] [Green Version]
- Charlot, O.; Malherbet, F. Education and employment protection. Labour Econ. 2013, 20, 3–23. [Google Scholar] [CrossRef]
- Golsch, K. Labour market insecurity and its impact on labour market entry and early career. A Comparison of Germany, Britain and Spain. In Proceedings of the 2nd Annual Research Conference of the European Panel Users’ Network, Berlin, Germany, 24–26 June 2004; Available online: http://epunet.essex.ac.uk/papers/golsch_pap.pdf (accessed on 14 April 2022).
- Sá, F. Does Employment Protection Help Immigrants? Evidence from European Labor Markets. IZA Inst. Labor Econ. Discuss. Pap. Ser. 2008, 3414, 1–43. Available online: https://www.econstor.eu/handle/10419/34804 (accessed on 11 April 2022). [CrossRef] [Green Version]
- Pereira, S. Immigrant workers’ (im)mobilities and their re-emigration strategies. Empl. Relat. 2012, 34, 642–657. [Google Scholar] [CrossRef]
- Kim, A.T.; Kim, C.H.; Tuttle, S.E.; Zhang, Y. COVID-19 and the decline in Asian American employment. Res. Soc. Stratif. Mobil. 2021, 71, 100563. [Google Scholar] [CrossRef]
- Moen, P.; Pedtke, J.H.; Flood, S. Disparate Disruptions: Intersectional COVID-19 Employment Effects by Age, Gender, Education, and Race/Ethnicity. Work. Aging Retire 2020, 6, 207–228. [Google Scholar] [CrossRef]
- Fairlie, R.W.; Couch, K.; Xu, H. The Impacts of COVID-19 on Minority Unemployment: First Evidence from April 2020 CPS Microdata; NBER Working Paper Series; National Bureau of Economic Research: Cambridge, MA, USA, 2020; Volume 27246, pp. 1–41. Available online: http://www.nber.org/papers/w27246.pdf (accessed on 11 April 2022).
- Kucharski, L. Pandemia a pozycja grup osób na rynku pracy. Grupy zwiększonego ryzyka bezrobocia (Pandemic and the position of groups of people in the labor market. Groups of increased risk of unemployment). In Pandemia COVID-19 a Zmiany na Rynku Pracy. Polska na tle Innych Krajów Grupy Wyszehradzkiej (The COVID-19 Pandemic and Changes in the Labor Market. Poland Compared to Other Countries of the Visegrad Group); Kwiatkowski, E., Ed.; Oficyna Wydawnicza Politechniki Warszawskiej: Warszawa, Poland, 2022; pp. 124–143. [Google Scholar]
- Cowan, B.W. Short-Run Effects of COVID-19 on U.S. Worker Transitions; NBER Working Paper; National Bureau of Economic Research: Cambridge, MA, USA, 2020; Volume 27315, pp. 1–18. Available online: http://www.nber.org/papers/w27315.pdf (accessed on 11 April 2022).
- Kristal, T.; Yaish, M. Does the coronavirus pandemic level the gender inequality curve? (It doesn’t). Res. Soc. Stratif. Mobil. 2020, 68, 100520. [Google Scholar] [CrossRef]
- Cook, R.; Grimshaw, D. A gendered lens on COVID-19 employment and social policies in Europe. Eur. Soc. 2021, 23, 215–227. [Google Scholar] [CrossRef]
- Churchill, B. COVID-19 and the immediate impact on young people and employment in Australia: A gendered analysis. Gend. Work. Organ. 2021, 28, 783–794. [Google Scholar] [CrossRef]
- Landivar, L.C.; Ruppanner, L.; Scarborough, W.J.; Collins, C. Early Signs Indicate That COVID-19 Is Exacerbating Gender Inequality in the Labor Force. Socius 2020, 6, 1–3. [Google Scholar] [CrossRef]
- Krywult-Albańska, M.; Albański, Ł. Gender and Educational Inequalities during the COVID-19 Pandemic: Preliminary Insights from Poland. Sustainability 2021, 13, 12403. [Google Scholar] [CrossRef]
- Kwiatkowski, E. Instytucje i polityka rynku pracy w krajach Grupy Wyszehradzkiej (Institutions and labor market policy in the countries of the Visegrad Group). In Pandemia COVID-19 a Zmiany na Rynku Pracy. Polska na tle Innych Krajów Grupy Wyszehradzkiej (The COVID-19 Pandemic and Changes in the Labor Market. Poland Compared to Other Countries of the Visegrad Group); Kwiatkowski, E., Ed.; Oficyna Wydawnicza Politechniki Warszawskiej: Warszawa, Poland, 2022; pp. 29–48. [Google Scholar]
- Gezici, A.; Ozay, O. An Intersectional Analysis of COVID-19 Unemployment. J. Econ. Race Policy 2020, 3, 270–281. [Google Scholar] [CrossRef] [PubMed]
- Dingel, J.; Neiman, B. How Many Jobs Can be Done at Home? NBER Working Paper Series; National Bureau of Economic Research: Cambridge, MA, USA, 2020; Volume 26948, pp. 1–13. [Google Scholar] [CrossRef]
- Gavriluţă, N.; Grecu, S.-P.; Chiriac, H.C. Sustainability and Employability in the Time of COVID-19. Youth, Education and Entrepreneurship in EU Countries. Sustainability 2022, 14, 1589. [Google Scholar] [CrossRef]
- Cajner, T.; Crane, L.D.; Decker, R.A.; Grigsby, J.; Hamins-Puertolas, A.; Hurst, E.; Kurz, C.; Yildirmaz, A. The US Labor Market during the Beginning of the Pandemic Recession; NBER Working Paper Series; National Bureau of Economic Research: Cambridge, MA, USA, 2020; Volume 27159, pp. 1–49. Available online: http://www.nber.org/papers/w27159.pdf (accessed on 11 April 2022).
- Cheng, W.; Carlin, P.; Carroll, J.; Gupta, S.; Rojas, F.L.; Montenovo, L.; Nguyen, T.D.; Schmutte, I.M.; Scrivner, O.; Simon, K.I.; et al. Back to Business and (Re)employing Workers? Labor Market. Activity during State COVID-19 Reopenings; NBER Working Paper Series; National Bureau of Economic Research: Cambridge, MA, USA, 2020; Volume 27419, pp. 1–53. Available online: https://hdl.handle.net/1805/23524 (accessed on 10 April 2022).
- Miljković, B.I. Economic cooperation between the Republic of Serbia and the member states of the Visegrad Group. Ekon. Časopis 2021, 69, 158–179. [Google Scholar] [CrossRef]
- Dmytrów, K.; Bieszk-Stolorz, B. Mutual relationships between the unemployment rate and the unemployment duration in the Visegrad Group countries in years 2001–2017. Equilibrium. Q. J. Econ. Econ. Policy 2019, 14, 129–148. [Google Scholar] [CrossRef] [Green Version]
- Bieszk-Stolorz, B.; Dmytrów, K. Influence of Accession of the Visegrad Group Countries to the EU on the Situation in Their Labour Markets. Sustainability 2020, 12, 6694. [Google Scholar] [CrossRef]
- Hadaś-Dyduch, M.; Balcerzak, A.P.; Pietrzak, M.B. Wavelet Analysis of Unemployment Rate in Visegrad Countries. Inst. Econ. Res. Work. Pap. 2016, 37. Available online: https://EconPapers.repec.org/RePEc:pes:wpaper:2016:no37 (accessed on 11 April 2022).
- Balcerzak, A.P.; Pietrzak, M.B. Quality of Institutions for Knowledge-based Economy within New Institutional Economics Framework. Multiple Criteria Decision Analysis for European Countries in the Years 2000–2013. Econ. Sociol. 2016, 9, 66–81. [Google Scholar] [CrossRef]
- Dmytrów, K.; Bieszk-Stolorz, B. Comparison of changes in the labour markets of post-communist countries with other EU member states. Equilib. Q. J. Econ. Econ. Policy 2021, 16, 741–764. [Google Scholar] [CrossRef]
- Poland: Distribution of Employment by Economic Sector from 2009 to 2019. Available online: https://www.statista.com/statistics/376395/employment-by-economic-sector-in-czechrepublik/hungary/poland/slovakia (accessed on 2 June 2022).
- Tvrdon, M. Unemployment as the Macroeconomic Problem: The Case of Visegrad Group Countries. Int. J. Syst. Appl. Eng. Dev. 2011, 5, 187–197. [Google Scholar]
- Lemos, S.; Portes, J. New Labour? The Impact of Migration from Central and Eastern European Countries on the UK Labour Market. IZA Inst. Labor Econ. Discuss. Pap. Ser. 2008, 3756, 1–55. [Google Scholar] [CrossRef]
- Sulich, A. Active labour market policy as a source of legitimacy for governments of Central Europe countries—Comparative analysis. World Sci. News 2016, 60, 78–91. [Google Scholar]
- Kónya, I. Labor Input and Labor Income. In Economic Growth in Small Open Economies. Lessons from the Visegrad Countries; Kónya, I., Ed.; Palgrave Macmillan: Cham, Switzerland, 2018; pp. 29–45. [Google Scholar]
- Amuedo-Dorantes, C.; Serrano-Padial, R. Labor market flexibility and poverty dynamics. Labour Econ. 2010, 17, 632–642. [Google Scholar] [CrossRef]
- Mura, L.; Zsigmond, T.; Kovács, A.; Baloghová, É. Unemployment and GDP relationship analysis in the Visegrad four countries. Online J. Model. New Eur. 2020, 34, 118–134. [Google Scholar] [CrossRef]
- Kalleberg, A.L.; Reynolds, J.; Marsden, P.V. Externalizing employment: Flexible staffing arrangements in US organizations. Soc. Sci. Res. 2003, 32, 525–552. [Google Scholar] [CrossRef]
- Debels, A. The Structuring of Labour Market Dynamic Along the Permanent-Temporary Distinction: A Comparison of Denmark, France, Spain and United Kingdom. 2005. Available online: www.iser.essex.ac.uk/files/conferences/epunet/2005/docs/pdf/papers/debels.pdf (accessed on 14 April 2022).
- Gaston, N.; Kishi, T. Part-time workers doing full-time work in Japan. J. Jpn. Int. Econ. 2007, 21, 435–454. [Google Scholar] [CrossRef]
- Mikołajczak, P. What affects employment by NGOs? Counteraction to precarious employment in the Polish non-profit sector in the perspective of COVID-19 pandemic crises. Oeconomia Copernic. 2021, 12, 761–788. [Google Scholar] [CrossRef]
- Eamets, R.; Jaakson, K. Labour market flexibility and spatial mobility. Int. J. Manpow. 2014, 35, 746–752. [Google Scholar] [CrossRef]
- Blundell, R.; Crawford, C.; Jin, W. What Can Wages and Employment Tell Us About the UK’s Productivity Puzzle. Econ. J. 2014, 124, 377–407. [Google Scholar] [CrossRef] [Green Version]
- Zieliński, M. Impact of the employment and unemployment level on the use of flexible forms of employment in the EU countries. Proc. Nauk. UE Wrocławiu 2019, 63, 127–136. [Google Scholar] [CrossRef]
- Zieliński, M. The impact of the unemployment level on non-standard employment forms in the Visegrad Group countries. Ekon. I Prawo 2020, 19, 393–404. [Google Scholar] [CrossRef]
- Dvouletý, O. What is the Relationship between Entrepreneurship and Unemployment in Visegrad Countries? Cent. Eur. Bus. Rev. 2017, 6, 42–53. [Google Scholar] [CrossRef] [Green Version]
- Zieliński, M. Effect of economic situation on employment and its structure in the Central and Eastern European countries. Ekon. I Prawo 2018, 7, 329–337. [Google Scholar] [CrossRef]
- Kapela, M. Rządowe wsparcie gospodarki i ochrony miejsc pracy w krajach Grupy Wyszehradzkiej (Government support for the economy and job protection in the Visegrad Group countries). In Pandemia COVID-19 a Zmiany na Rynku Pracy. Polska na tle Innych Krajów Grupy Wyszehradzkiej (The COVID-19 Pandemic and Changes in the Labor Market. Poland Compared to Other Countries of the Visegrad Group); Kwiatkowski, E., Ed.; Oficyna Wydawnicza Politechniki Warszawskiej: Warszawa, Poland, 2022; pp. 49–66. [Google Scholar]
- Svabova, L.; Tesarova, E.N.; Durica, M.; Strakova, L. Evaluation of the impacts of the COVID-19 pandemic on the development of the unemployment rate in Slovakia: Counterfactual before-after comparison. Equilib. Q. J. Econ. Econ. Policy 2021, 16, 261–284. [Google Scholar] [CrossRef]
Figure 1.
Change rates of employment of women, young people, and people with the lowest education level compared to total employment (4Q2019 = 100). Source: Own calculations based on Eurostat database.
Figure 1.
Change rates of employment of women, young people, and people with the lowest education level compared to total employment (4Q2019 = 100). Source: Own calculations based on Eurostat database.

Figure 2.
Rates of change in part-time, temporary and self-employment compared to total employment (Q4 2019 = 100). Source: Own calculations based on Eurostat database.
Figure 2.
Rates of change in part-time, temporary and self-employment compared to total employment (Q4 2019 = 100). Source: Own calculations based on Eurostat database.

Figure 3.
Rates of change in the number of unemployed women, young people, and people aged 55–64 compared to the total number of the unemployed (4Q2019 = 100). Source: Own calculations based on Eurostat database.
Figure 3.
Rates of change in the number of unemployed women, young people, and people aged 55–64 compared to the total number of the unemployed (4Q2019 = 100). Source: Own calculations based on Eurostat database.

Figure 4.
Unemployment rates of the least educated compared to the total unemployment rate. Source: Eurostat database.
Figure 4.
Unemployment rates of the least educated compared to the total unemployment rate. Source: Eurostat database.

Table 1.
Unemployment rate and average number of usual weekly hours of work in main job, in the V4 countries (quarterly breakdown).
Table 1.
Unemployment rate and average number of usual weekly hours of work in main job, in the V4 countries (quarterly breakdown).
| Quart./ Year | Czechia | Hungary | Poland | Slovakia | ||||
|---|---|---|---|---|---|---|---|---|
| Unempl. Rate | Hours of Work | Unempl. Rate | Hours of Work | Unempl. Rate | Hours of Work | Unempl. Rate | Hours of Work | |
| 1/2018 | 2.4 | 40.5 | 3.9 | 39.8 | 4.2 | 40.4 | 7.2 | 39.9 |
| 2/2018 | 2.2 | 40.5 | 3.6 | 39.8 | 3.6 | 40.5 | 6.7 | 40.0 |
| 3/2018 | 2.4 | 40.4 | 3.9 | 39.7 | 3.9 | 40.7 | 6.4 | 40.1 |
| 4/2018 | 2.1 | 40.4 | 3.6 | 39.7 | 3.9 | 40.6 | 6.1 | 40.2 |
| 1/2019 | 2.1 | 40.4 | 3.6 | 39.7 | 4.0 | 40.4 | 5.9 | 40.2 |
| 2/2019 | 1.9 | 40.3 | 3.4 | 39.7 | 3.3 | 40.6 | 5.8 | 40.2 |
| 3/2019 | 2.2 | 40.4 | 3.5 | 39.7 | 3.2 | 40.6 | 5.9 | 40.2 |
| 4/2019 | 2.1 | 40.3 | 3.4 | 39.7 | 2.9 | 40.5 | 5.5 | 40.1 |
| 1/2020 | 2.0 | 40.3 | 3.8 | 39.5 | 3.2 | 40.3 | 6.0 | 40.1 |
| 2/2020 | 2.4 | 40.3 | 4.7 | 39.3 | 3.2 | 40.2 | 6.7 | 40.0 |
| 3/2020 | 2.9 | 40.2 | 4.5 | 39.5 | 3.3 | 40.4 | 7.3 | 40.0 |
| 4/2020 | 3.1 | 40.2 | 4.2 | 39.5 | 3.2 | 40.3 | 7.0 | 39.9 |
| 1/2021 | 3.4 | 39.6 | 4.5 | 39.5 | 4.1 | 40.1 | 7.2 | 39.6 |
| 2/2021 | 3.1 | 39.6 | 4.1 | 39.5 | 3.6 | 40.3 | 7.0 | 39.6 |
| 3/2021 | 2.8 | 39.8 | 3.9 | 39.6 | 3.1 | 40.6 | 6.8 | 39.7 |
| 4/2021 | 2.3 | 39.6 | 3.7 | 39.5 | 2.9 | 40.4 | 6.6 | 36.6 |
Source: Eurostat database.
Table 2.
Changes in the level of employment and unemployment in V4 countries on a quarterly basis (in thousands).
Table 2.
Changes in the level of employment and unemployment in V4 countries on a quarterly basis (in thousands).
| Quarter/ Year | Czechia | Hungary | Poland | Slovakia | ||||
|---|---|---|---|---|---|---|---|---|
| Eploy. | Unemp. | Eploy. | Unemp. | Eploy. | Unemp. | Eploy. | Unemp. | |
| 1/2018 | 5128 | 128.3 | 4530 | 177.6 | 15,942 | 703.6 | 2591 | 193.8 |
| 2/2018 | 5151 | 117.1 | 4551 | 164.9 | 15,982 | 614.6 | 2592 | 181.4 |
| 3/2018 | 5148 | 126.0 | 4556 | 177.7 | 15,950 | 659.8 | 2615 | 175.1 |
| 4/2018 | 5162 | 109.7 | 4559 | 166.8 | 15,920 | 648.1 | 2624 | 166.8 |
| 1/2019 | 5163 | 108.9 | 4570 | 164.9 | 15,895 | 663.5 | 2628 | 159.8 |
| 2/2019 | 5156 | 102.1 | 4572 | 154.8 | 15,954 | 546.7 | 2614 | 155.0 |
| 3/2019 | 5144 | 114.1 | 4559 | 160.7 | 15,962 | 530.2 | 2615 | 161.0 |
| 4/2019 | 5274 | 108.4 | 4554 | 154.3 | 15,917 | 481.5 | 2611 | 154.8 |
| 1/2020 | 5139 | 106.0 | 4543 | 171.0 | 15,940 | 525.5 | 2590 | 161.3 |
| 2/2020 | 5134 | 126.3 | 4491 | 213.8 | 15,734 | 525.9 | 2550 | 177.3 |
| 3/2020 | 5087 | 153.3 | 4522 | 206.4 | 15,868 | 557.3 | 2554 | 196.2 |
| 4/2020 | 5067 | 161.5 | 4518 | 194.7 | 15,928 | 525.6 | 2557 | 189.5 |
| 1/2021 | 5054 | 178.6 | 4503 | 201.4 | 16,066 | 683.5 | 2477 | 190.3 |
| 2/2021 | 5051 | 158.6 | 4539 | 195.1 | 16,197 | 603.8 | 2512 | 188.6 |
| 3/2021 | 5078 | 145.1 | 4536 | 187.3 | 16,317 | 527.6 | 2542 | 187.3 |
| 4/2021 | 5111 | 118.0 | 4580 | 177.6 | 16,340 | 494.5 | 2571 | 182.7 |
Source: Eurostat database.
Publisher’s Note: MDPI stays neutral with regard to jurisdictional claims in published maps and institutional affiliations. |
© 2022 by the author. Licensee MDPI, Basel, Switzerland. This article is an open access article distributed under the terms and conditions of the Creative Commons Attribution (CC BY) license (https://creativecommons.org/licenses/by/4.0/).
Share and Cite
MDPI and ACS Style
Zieliński, M. The Effect of the COVID-19 Pandemic on the Labor Markets of the Visegrad Countries. Sustainability 2022, 14, 7386. https://doi.org/10.3390/su14127386
AMA Style
Zieliński M. The Effect of the COVID-19 Pandemic on the Labor Markets of the Visegrad Countries. Sustainability. 2022; 14(12):7386. https://doi.org/10.3390/su14127386
Chicago/Turabian StyleZieliński, Mariusz. 2022. "The Effect of the COVID-19 Pandemic on the Labor Markets of the Visegrad Countries" Sustainability 14, no. 12: 7386. https://doi.org/10.3390/su14127386
Note that from the first issue of 2016, this journal uses article numbers instead of page numbers. See further details here.