Article

Comparison of Detecting and Quantitating SARS-CoV-2 in Wastewater Using Moderate-Speed Centrifuged Solids versus an Ultrafiltration Method

1
Department of Laboratory Medicine and Pathology, University of Alberta, Edmonton, AB T6G 2B7, Canada
2
EPCOR Water Services Inc., Edmonton, AB T5H 0E8, Canada
3
Department of Pediatrics, University of Alberta, Edmonton, AB T6G 1C9, Canada
4
Public Health Laboratory, Alberta Precision Laboratories, Edmonton, AB T6G 2J2, Canada
*
Author to whom correspondence should be addressed.
Water 2021, 13(16), 2166; https://doi.org/10.3390/w13162166
Submission received: 14 July 2021 / Revised: 1 August 2021 / Accepted: 3 August 2021 / Published: 6 August 2021
(This article belongs to the Special Issue Pathogen Detection and Identification in Wastewater)

Abstract

:
Mounting evidence suggests that solids are a reliable matrix for SARS-CoV-2 detection in wastewater, yet studies comparing solids-based methods and common concentration methods using the liquid fraction remain limited. In this study, we developed and optimized a method for SARS-CoV-2 detection in wastewater using moderate-speed centrifuged solids and evaluated it against an ultrafiltration reference method. SARS-CoV-2 was quantified in samples from 12 wastewater treatment plants from Alberta, Canada, using RT-qPCR targeting the N2 and E genes. PCR inhibition was examined by spiking salmon DNA. The effects of using different amounts of solids, adjusting the sample pH to 9.6–10, and modifying the elution volume at the final step of RNA extraction were evaluated. SARS-CoV-2 detection rate in solids from 20 mL of wastewater showed no statistically significant difference compared to the ultrafiltration method (97/139 versus 90/139, p = 0.26, McNemar’s mid-p test). The optimized wastewater solids-based method had a significantly lower rate of samples with PCR inhibition versus ultrafiltration (3% versus 9.5%, p = 0.014, Chi-square test). Our optimized moderate-speed centrifuged solids-based method had similar sensitivity when compared to the ultrafiltration reference method but had the added advantages of lower costs, fewer processing steps, and a shorter turnaround time.

1. Introduction

The current COVID-19 pandemic has prompted a global surge in monitoring SARS-CoV-2 in wastewater as an additional and supplementary surveillance tool to inform public health authorities on disease burden. An important advantage of wastewater-based surveillance (WBS) over indicators such as clinical cases and hospitalization rates is that it provides a comprehensive snapshot of SARS-CoV-2 presence that includes symptomatic, asymptomatic, and pre-symptomatic carriers with the analysis of a single sample. SARS-CoV-2 WBS also has the potential to allow early detection of changes in disease burden in advance to clinical testing data and hospitalization rates [1,2]. Moreover, SARS-CoV-2 WBS is not affected by policies and delivery of clinical diagnostics provision, which can be limited by resource allocation and availability. For these characteristics, SARS-CoV-2 WBS represents a valuable tool particularly in locations where clinical testing has reached maximum capacity and test reports are lagging or not representative of actual disease burden. WBS has gained increasing importance since the start of the COVID-19 pandemic and as of the time of writing this manuscript, at least 55 countries have set up over 2300 sites for monitoring SARS-CoV-2 in wastewater [3].
While WBS historically has proven to be a valuable tool for monitoring the re-emergence of polio [4,5] and multiple other human viruses [6,7], wastewater is a complex and challenging matrix especially for molecular detection and quantification of pathogens. Wastewater composition includes a high content of organic matter, a wide range of PCR inhibitors [8,9], and it can vary significantly within hours [10,11]. In addition, most methods for virus detection from wastewater were developed and optimized for non-enveloped viruses which are more stable in aqueous environments than enveloped viruses like coronaviruses [12,13,14].
Most extraction methods use the liquid fraction of wastewater samples and, since viruses are typically found at low levels in wastewater, they frequently require virus concentration steps. There are multiple methods for virus concentration including but not limited to electropositive filtration, electronegative filtration, polyethylene glycol (PEG) precipitation, and ultrafiltration [15,16,17,18]. Even if these time-consuming, laborious, and costly virus concentration steps are used, virus recovery rates are frequently low. We have identified median recovery rates of 3% to 50% for different enteric viruses using ultrafiltration [14]. An interlaboratory reproducibility study by Pecson et al. [19], involving 32 laboratories and 36 different methods for quantification of SARS-CoV-2 in wastewater, reported recoveries for betacoronavirus OC43 with interlaboratory median values of 10%, 5.8%, 3.3%, and 3.6%, respectively, for methods using either no concentration steps, electronegative filtration, PEG precipitation, or ultrafiltration.
For virus detection purposes, it is not uncommon for some methods to remove wastewater solids prior to virus nucleic acids extraction to avoid filter clogging issues [16,20]. However, the partitioning and stability of viruses in solid or liquid fractions of wastewater samples can vary significantly by virus type. Growing evidence suggests that a considerable proportion of coronaviruses in wastewater are adsorbed on the solids fraction. Methods that include solids as well as liquid fractions reportedly perform better than those that exclude solids [16] and up to 26% of enveloped viruses versus 6% of nonenveloped viruses have been found to adsorb onto wastewater solids [21]. Based on analysis of primary sludge collected at a period of high COVID-19 activity, Peccia et al. [22] reported concentrations 1000 times higher than previously reported by others analyzing influent wastewater. At the time of manuscript preparation, several other groups have described the use of solids for the detection of SARS-CoV-2 in wastewater [17,18,23,24,25,26]. However, only a few studies provide first-hand data on the performance of solids-based methods compared to more conventional methods [17,25]. In this study, we present method optimization data toward improving the sensitivity of SARS-CoV-2 detection in moderate-speed centrifuged solids from post-grit influent wastewater. We also compared our solids-based method with a previously validated ultrafiltration reference method to assess detection rate, costs, simplicity, and turnaround times.

2. Materials and Methods

2.1. Wastewater Samples

Post-grit influent wastewater samples (400 mL, 24-h composite samples) were collected from 12 different wastewater treatment plants (WWTP) across 10 cities of Alberta, Canada: Edmonton, Calgary, Canmore, Red Deer, Banff, Fort Saskatchewan, Lethbridge, Grande Prairie, Medicine Hat and High River. Samples from each WWTP were collected between 16 October 2020, and 20 December 2020, at a frequency of three samples per week. Samples were stored at −20 °C in 500 mL bottles upon collection until weekly shipment and were immediately processed once received by the laboratory. Storage at −20 °C might have reduced detectable virus loads [27] but given that samples were run in parallel using both solids-based and ultrafiltration methods, it would have no impact on our comparative analyses. Prior to testing, samples were thoroughly mixed and quickly poured to assure that aliquots represented a homogeneous suspension for both, solids-based and ultrafiltration methods.

2.2. Ultrafiltration Method

Virus potentially present in wastewater samples was extracted and concentrated as previously described [14] with modifications as follows. Briefly, 100 mL of wastewater sample were spiked with 100 µL of a suspension of human coronavirus (HCoV) strain 229E (105 IU/mL titrated by TCID50) for monitoring virus recovery. The spiked samples were adjusted to pH 9.6–10 with 5N NaOH and mixed vigorously for 30 s. Samples were then centrifuged at 4500× g for 10 min to pellet solids; the liquid fraction was transferred into a new container and adjusted to pH 7–7.5 with 1.2N HCl. The viral particles present in the liquid fraction were concentrated by ultrafiltration using a Centricon Plus-70™ filter with a pore size or Nominal Molecular Weight Limit (NMWL) of 30 KDa (Merck Millipore, Carrigtwohill, Ireland) according to the manufacturer’s instructions, except the pre-rinse step which was eliminated. Filters were loaded with 70 mL of sample and centrifuged at 3000× g for 10 min at room temperature. The filtrate was discarded, and the same procedure was repeated for the rest of the sample for a total volume of 100 mL. The filtrate collection cup was removed, and the concentration cup was placed on top of the sample filter cup. The Centricon™ filter was then inverted carefully and centrifuged at 800× g for 2 min. The sample was collected from the concentration cup and adjusted to a final volume of 1 mL by adding phosphate-buffered saline (PBS). The concentrated samples were stored at −70 °C until RNA extraction.

2.3. Moderate-Speed Centrifuged Solids Method

A total of 100 mL of wastewater was spiked with 100 µL of a suspension of HCoV 229E (105 IU/mL titrated by TCID50) and centrifuged at 4500× g for 10 min at 4 °C. The supernatant was discarded, and the weight of the remaining wet solids fraction was recorded to calculate the number of viral genome copies present in 100 mL of wastewater. Different wet weights of solids (50 mg, 100 mg, 200 mg, 300 mg, or 400 mg) were aliquoted for RNA extraction; when required, an additional 100 mL aliquot of wastewater was spiked and centrifuged to supply sufficient solids for testing. For tests involving the effect of pH adjustment, the same solids obtained under Ultrafiltration method were used for analysis. For tests using solids from 20 mL of wastewater, a 20 mL aliquot of sample was centrifuged at 4500× g for 10 min at 4 °C. The supernatant was discarded, the weight of the resulting wet solids fraction was recorded, and the entire solids fraction was used for RNA extraction.

2.4. RNA Extraction

Viral RNA was extracted from ultrafiltration wastewater concentrates and solids fractions using the MagMAX™-96 Viral RNA isolation kit (Thermo Fisher Scientific Baltics UAB, Vilnius, Lithuania) and the King Fisher™ Flex Purification System (Thermo Fisher Scientific, Vantaa, Finland). The extraction process was performed according to the MagMAX manufacturer’s instructions with the following modifications. Input sample was either A) 400 µL of wastewater concentrate prepared as described under Ultrafiltration method mixed with 502 µL of Lysis/Binding Solution or B) wet solids (50 mg, 100 mg, 200 mg, 300 mg, 400 mg, or all solids obtained from 20 mL of wastewater, as described under Moderate-speed centrifuged solids method) were mixed with 200 µL of PBS and 502 µL of Lysis/Binding Solution (250 µL of Lysis/Binding Solution Concentrate, 2 µL of carrier RNA and 250 µL of 100% isopropanol); the resulting solids-PBS-Lysis/Binding Solution mixture was vortexed for 20 s and centrifuged at 14,000× g for 2 min and the entire supernatant (approximately 670 µL) was used for RNA extraction. The extraction process was set up in the King Fisher™ Flex system loading input sample (either A or B described above), 20 µL of Bead Mix and 5 µL of salmon testes DNA (0.5 μg/mL) in the sample plate, two washes of 300 µL each of Wash Solution 1 and two washes of 450 µL each of Wash Solution 2. In the final step, nucleic acids from solids were eluted either in 50 µL or 100 µL of elution buffer; all extracts from the ultrafiltration method were eluted with 100 µL of elution buffer.

2.5. RT-qPCR

SARS-CoV-2 detection and quantification was performed by RT-qPCR with primers and probes targeting genes E and N2 previously described by others [28,29] and summarized in Table S1. One-step RT-qPCR was carried out for both targets with a final reaction volume of 10 µL, containing 2.5 µL of 4× TaqMan™ Fast Virus 1-Step RT-PCR Master Mix (Thermo Fisher Scientific Baltics UAB, Vilnius, Lithuania), 0.4 µL of 20 µM each forward and reverse primers, 0.2 µL of 10 µM TaqMan probe (Applied Biosystems, Foster City, CA, USA), 1.5 µL PCR grade H2O, and 5 µL of RNA extract. Thermocycler conditions consisted of 5 min at 50 °C for reverse transcription reaction, followed by 20 s at 95 °C for retrotranscriptase inactivation, and then 45 PCR amplification cycles of 3 s at 95 °C and 30 s at 60 °C. Amplification data were collected and analyzed with the 7500 Software version 2.0.5 (Applied Biosystems, Foster City, CA, USA). SARS-CoV-2 RNA levels were quantified from a standard curve included in each PCR run, prepared with a 10-fold dilution series ranging from 166 copies to 1.66 × 10⁶ copies per PCR reaction of a SARS-CoV-2 RNA fragment enclosing the RT-qPCR gene E target, and were expressed as viral genome copies per 100 mL of wastewater. The same E fragment was used to create a standard curve for gene N2 using the same primers and probe sequences except that the probe had FAM as reporter dye and BHQ1 as a quencher. Samples were tested in duplicate for each gene. A sample was considered positive if at least two out of the total four RT-qPCR reactions tested positive. If salmon DNA tested positive or had a delayed Ct, SARS-CoV-2 quantification was attempted again on a 1:10 or 1:5 dilution of RNA extract. The limit of detection (95% LOD) of this RT-qPCR assay is two copies per reaction for the E gene [28].

2.6. Quality Control Processes

Virus recovery rates were evaluated by RT-qPCR quantification of spiked HCoV 229E in samples vs. a baseline control consisting of a mixture of 100 µL of 105 IU of 229E/mL and 900 µL of water. The reaction and thermocycler conditions were set up similarly as described above for SARS-CoV-2 but with primers and probes (Applied Biosystems, Foster City, CA, USA) by Vijgen et al. [30] (Table S1), which target the membrane protein M of HCoV 229E. A standard curve of 10-fold serial dilutions starting from 166 genome copies per PCR reaction of the E gene was included in each PCR run for virus quantification.
The detection of salmon testes DNA as a control for PCR inhibition was carried out as previously described [31], using a final reaction volume of 10 µL containing 5 µL of 2× Taqman™ Fast Universal PCR Master Mix, 0.5 µL of primer/probe mix (18 µM of each primer and 5 µM probe listed in Table S1), 2 µL of PCR grade water, and 2.5 µL of RNA extract. Thermocycler conditions were initial denaturation for 20 s at 95 °C, followed by 45 PCR amplification cycles of 3 s at 95 °C and 30 s at 60 °C. The presence of an inhibitory effect was defined as a delay by at least three cycles as compared to a distilled water control spiked with the same concentration of salmon DNA.
A negative control in the form of distilled water was included in each RNA extraction and RT-qPCR runs.

2.7. PMMoV Quantification

Pepper Mild Mottle Virus (PMMoV) levels in wastewater were determined to characterize it as a potential internal fecal biomarker for the normalization of wastewater dilution. The RT-qPCR reactions were set up with the primers and probes by Zhang et al. [32] (Table S1) and using 2.5 µL of 4× Taqman™ Fast Virus 1-Step RT-PCR Master Mix (Thermo Fisher Scientific Baltics UAB, Vilnius, Lithuania), 0.5 µL of 10 µM each forward and reverse primers, 0.2 µL of 10 µM TaqMan probe (Applied Biosystems, Foster City, CA, USA), 1.3 µL PCR grade H2O, and 5 µL of RNA extract. Thermocycler conditions were the same as described above for SARS-CoV-2. For PMMoV quantification, a standard curve from a SARS-CoV-2 RNA fragment enclosing the E gene target was generated, as a substitute for a PMMoV target, using the primers and probe specified on Table S1, except that the probe had FAM as reporter dye and BHQ1 as a quencher.

2.8. Statistical Analysis

All statistical analyses were performed using R software (version 4.0.3). The association between solids weight and SARS-CoV-2 qPCR Ct values was evaluated using linear regression. The statistical significance in differences in detection rate between wastewater matrices and pH treatments were calculated as previously described [33], using McNemar’s mid-p test when discordant cases were <25 and the McNemar’s test without correction in other instances. The difference in proportions of samples with delayed or negative salmon DNA Ct values was calculated using the Chi-square test with Yates’ continuity correction and the alternative hypothesis that PCR inhibition rate is greater in solids versus ultrafiltration, except for solids from 20 mL, where the alternative hypothesis was that the proportion of samples with PCR inhibition is less in solids from 20 mL versus ultrafiltration. Comparisons of SARS-CoV-2 quantification between solids-based and ultrafiltration methods were evaluated by Spearman’s correlation analysis. Differences in yield of wet solid in terms of mg per 100 mL of wastewater across WWTP and differences in log genome copies of PMMoV per 100 mL of wastewater were analyzed using ANOVA and Tukey HSD for post hoc tests. In all tests, a p-value below 0.05 was considered statistically significant.

3. Results

3.1. Optimization of the Weight of Moderate-Speed Centrifuged Wastewater Solids Used as Input and Effect of pH Adjustment

To determine the weight of wet solids that can allow SARS-CoV-2 detection with minimum or no PCR inhibition, we first carried out an exploratory evaluation with 100 mg, 200 mg, 300 mg, and 400 mg of wet solids for three samples (Figure S1). Ct values for SARS-CoV-2 did not change as solids weight increased (p = 0.57 for gene E and p = 0.94 for gene N2, linear regression slope), however, Ct values for spiked salmon DNA indicated a high level of PCR inhibition, therefore, we continued further testing using no more than 100 mg of wet solids.
Our ultrafiltration reference method includes a step of pH adjustment to 9.6–10 prior virus concentration to release some of the viruses adsorbed on wastewater solids into the surrounding liquid fraction. While this pH adjustment increases the number of viral genomic targets when the liquid fraction is used for analysis, we hypothesized that it may negatively impact SARS-CoV-2 detection when analyzing the remaining solids fraction. Thus, we compared the performance of using 50 mg and 100 mg of solids as well as the effect of not adjusting versus adjusting the pH of the wastewater. In terms of detection rate, none of the four tested weight-pH adjustment combinations were statistically superior to the ultrafiltration method (Table 1). All wastewater samples included in this study had original pH values with a median of 7.6 (interquartile range 7.3–7.8). Adjusting the pH resulted in a lower detection rate compared to not adjusting the pH for 100 mg of solids (p = 0.04, McNemar’s p-mid test) but not for 50 mg solids (p = 0.13, McNemar’s test). The proportions of samples with delayed Ct values for salmon DNA, with each of the four solids treatments ranging from 37% to 56%, were significantly higher compared to that observed with the ultrafiltration method which had 10% (p < 0.001, Chi-square test) (Table 2).

3.2. Effect of Increasing Nucleic Acid Elution Volume

With the intention to further dilute the PCR inhibitors present in the nucleic acid extracts from wastewater solids, we explored the effect of doubling the volume of buffer used at the final elution step of nucleic acid extraction, from 50 µL to 100 µL. The SARS-CoV-2 detection rate from nucleic acid extracts prepared from 100 mg of solids and eluted in 100 µL of elution buffer was similar to that of extracts prepared by the ultrafiltration method (p = 0.12, McNemar’s test, Table 1). The percentage of samples with qPCR inhibition was also similar for both 100 mg of solids and the ultrafiltration method (10.4% and 9.5%, respectively, Table 2).

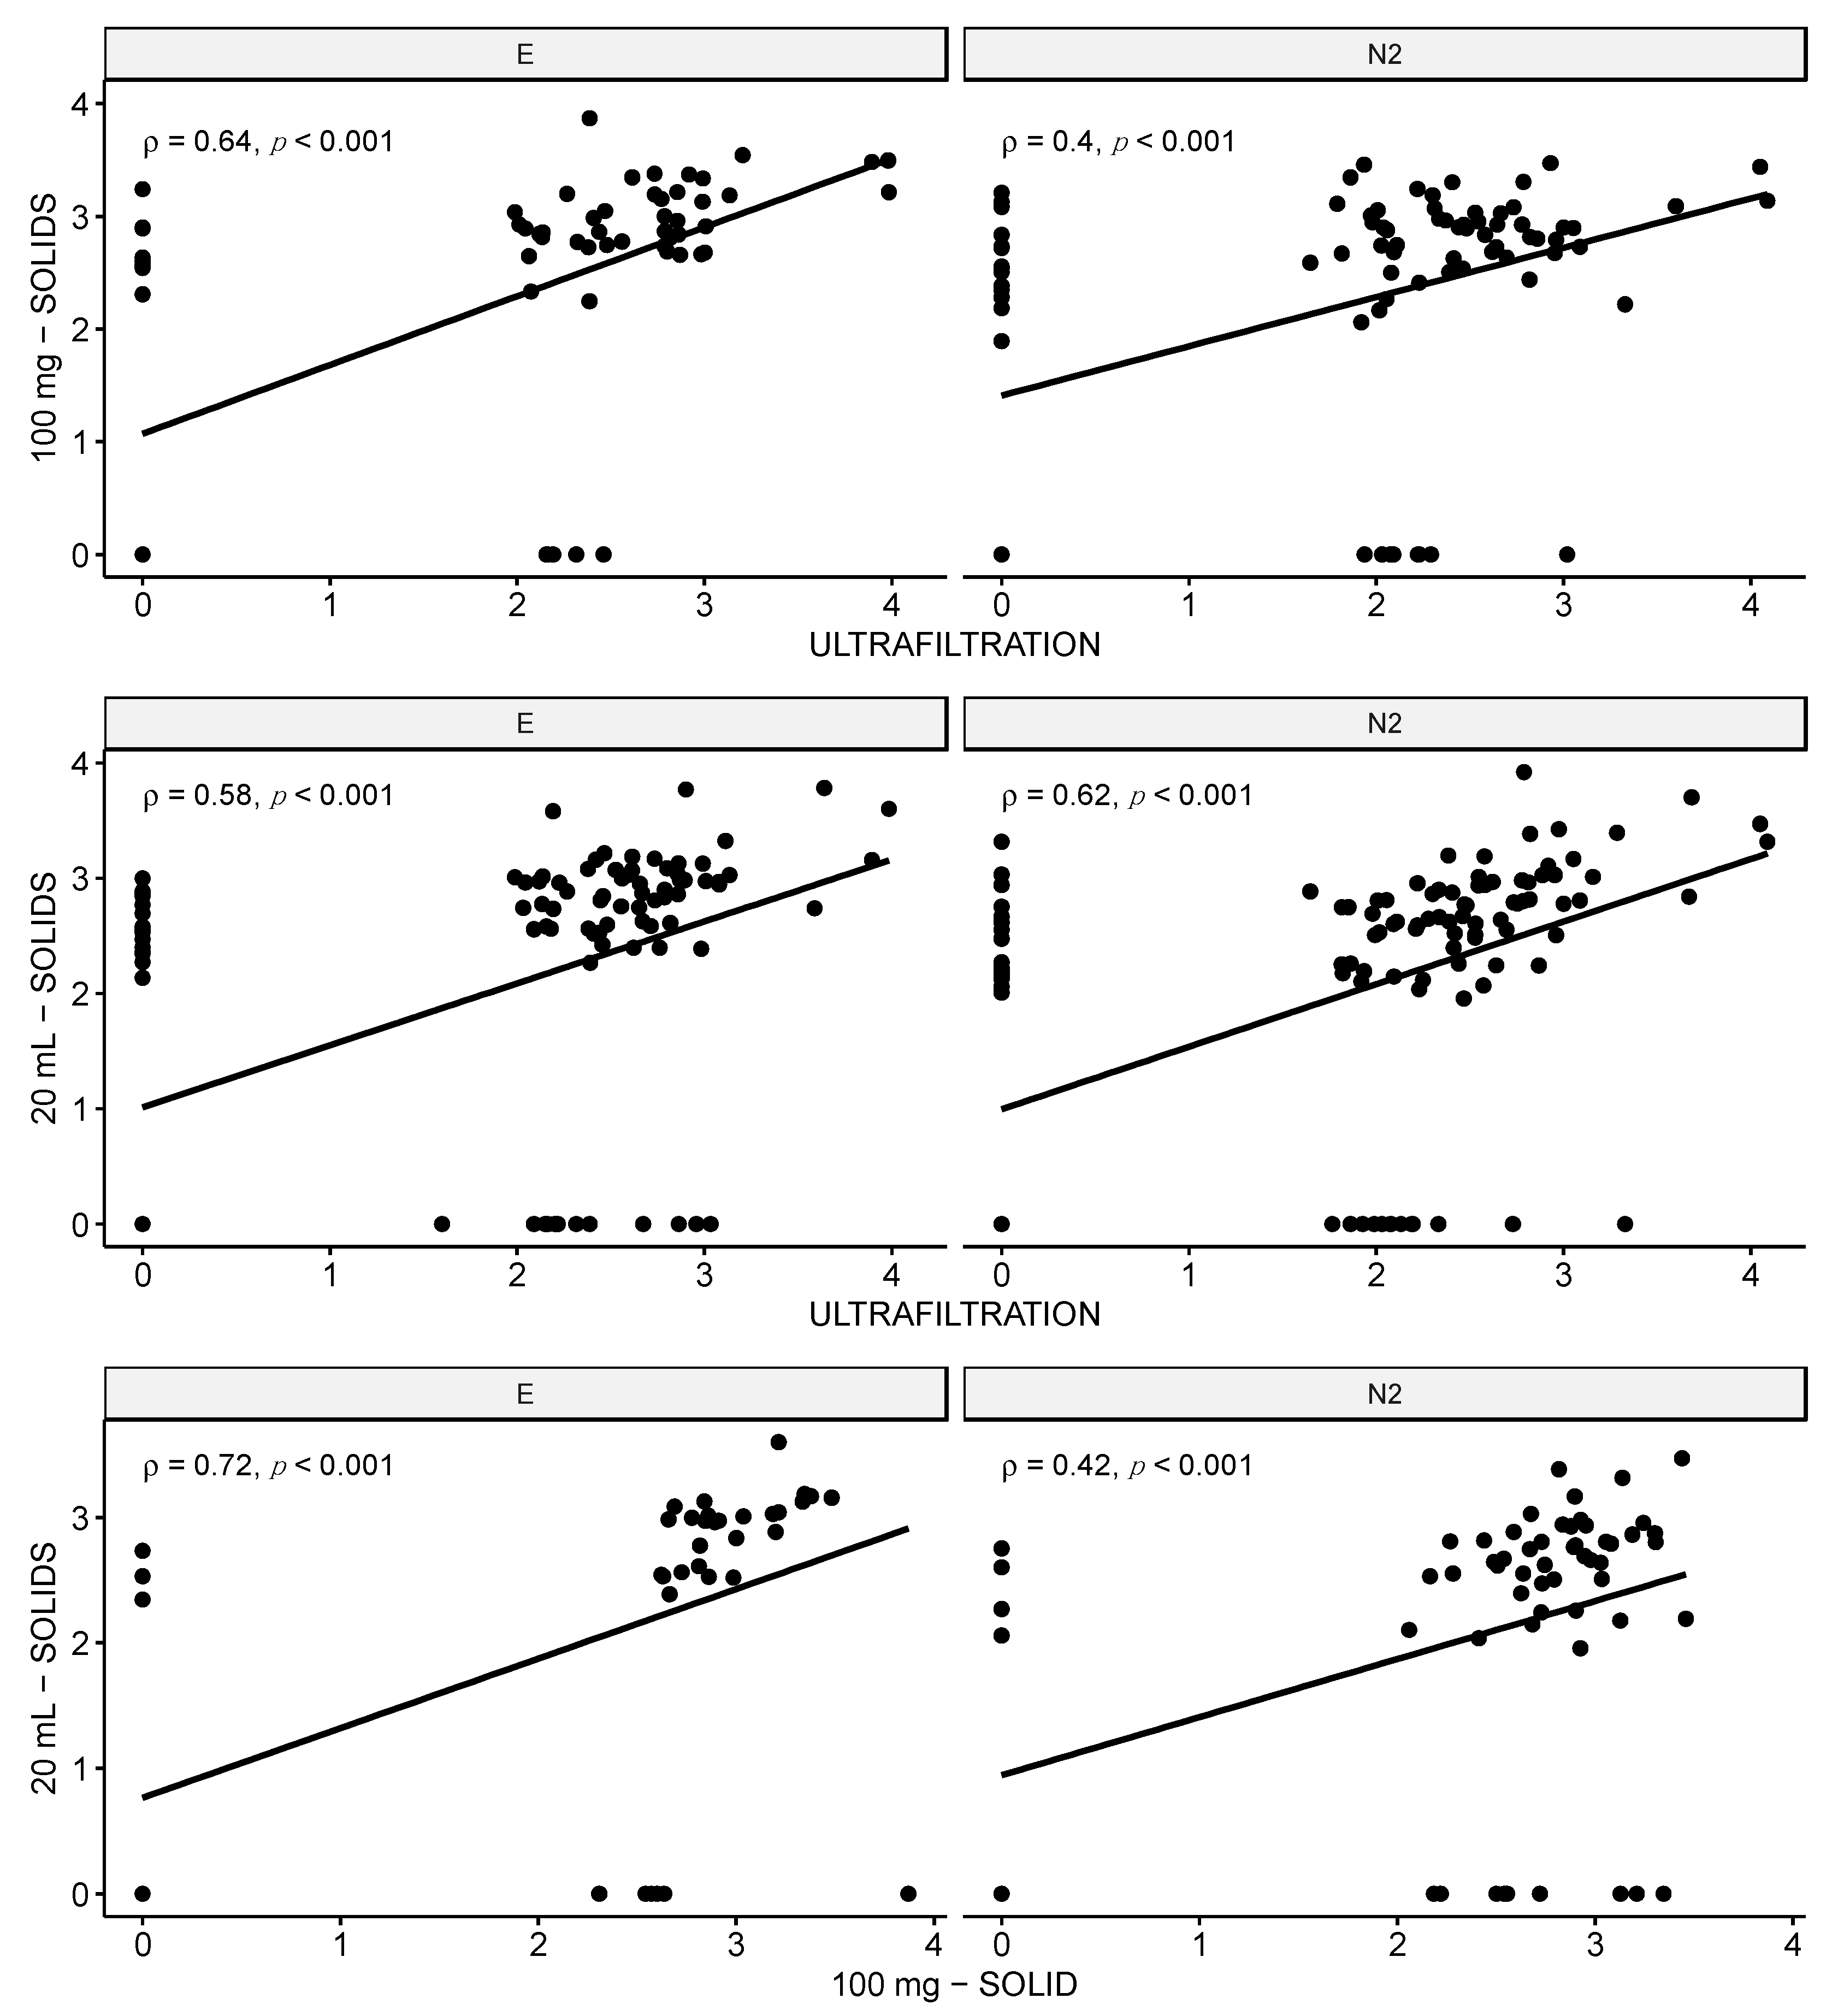
3.3. Input Sample Units of Measure: Weight versus Volume

To further simplify the solids-based method, we explored the alternative of using a fixed volume of wastewater for analysis instead of a fixed weight of solids. The median of wet solids yield (n = 176) was 492 (interquartile range, 69–1376) mg per 100 mL of post-grit wastewater with differences across WWTPs (p < 0.001, ANOVA) (Figure S2). Given that 100 mg represents about a fifth of the average weight present in 100 mL of wastewater, we performed comparison tests between 100 mg of solids and solids from 20 mL of wastewater. The yield of wet solids from 20 mL of wastewater (n = 143) had a median of 97 (interquartile range, 66–140) mg. Comparison in terms of SARS-CoV-2 detection rate showed no statistical differences between 100 mg of solids versus solids from 20 mL (p = 0.12, McNemar’s p-mid test) (Table 1). Among the discordant 20 mL-positive-100 mg-negative and 20 mL-negative-100 mg-positive samples, there was no significant difference in the proportion of samples yielding less than 100 mg of solids from 20 mL (69% versus 65%, respectively, Chi-square, p = 0.5).
Compared to the ultrafiltration reference method, analysis of solids from 20 mL showed no differences in terms of SARS-CoV-2 detection rates (p = 0.26, McNemar’s test) (Table 1). The rate of samples with PCR inhibition was significantly lower in solids from 20 mL (3%) versus the ultrafiltration method (9.5%) (p = 0.014, Chi-square) (Table 2).

3.4. 229 E Virus Recovery Data

Our ultrafiltration reference method for SARS-CoV-2 detection includes spiking of HCoV 229E to control for virus recovery. The rates of 229E recovery in wastewater solids were considerably lower compared to the ultrafiltration method, with a median of 0.07% (interquartile range, 0.03–0.16%) for 50 mg solids and a median of 0.09% (interquartile range, 0.05–0.17%) for 100 mg solids, whereas the ultrafiltration method had a median of 4.65% (interquartile range, 2.31–7.50%). Because SARS-CoV-2 is secreted in stools, a significant proportion of the virus is expected to be embedded in wastewater solids. This contrasts with the spiked HCoV 229E, which was added to the sample as a liquid suspension and could freely disperse into the liquid phase. Given that is likely that the partition of HCoV 229E was highly biased toward the liquid phase, HCoV 229E recovery rates were considered not to be representative of SARS-CoV-2 recovery and therefore, not measured in wastewater solids in subsequent tests. None of the data presented in this manuscript (solids or ultrafiltration methods) were corrected for HCoV 229E recovery rates.

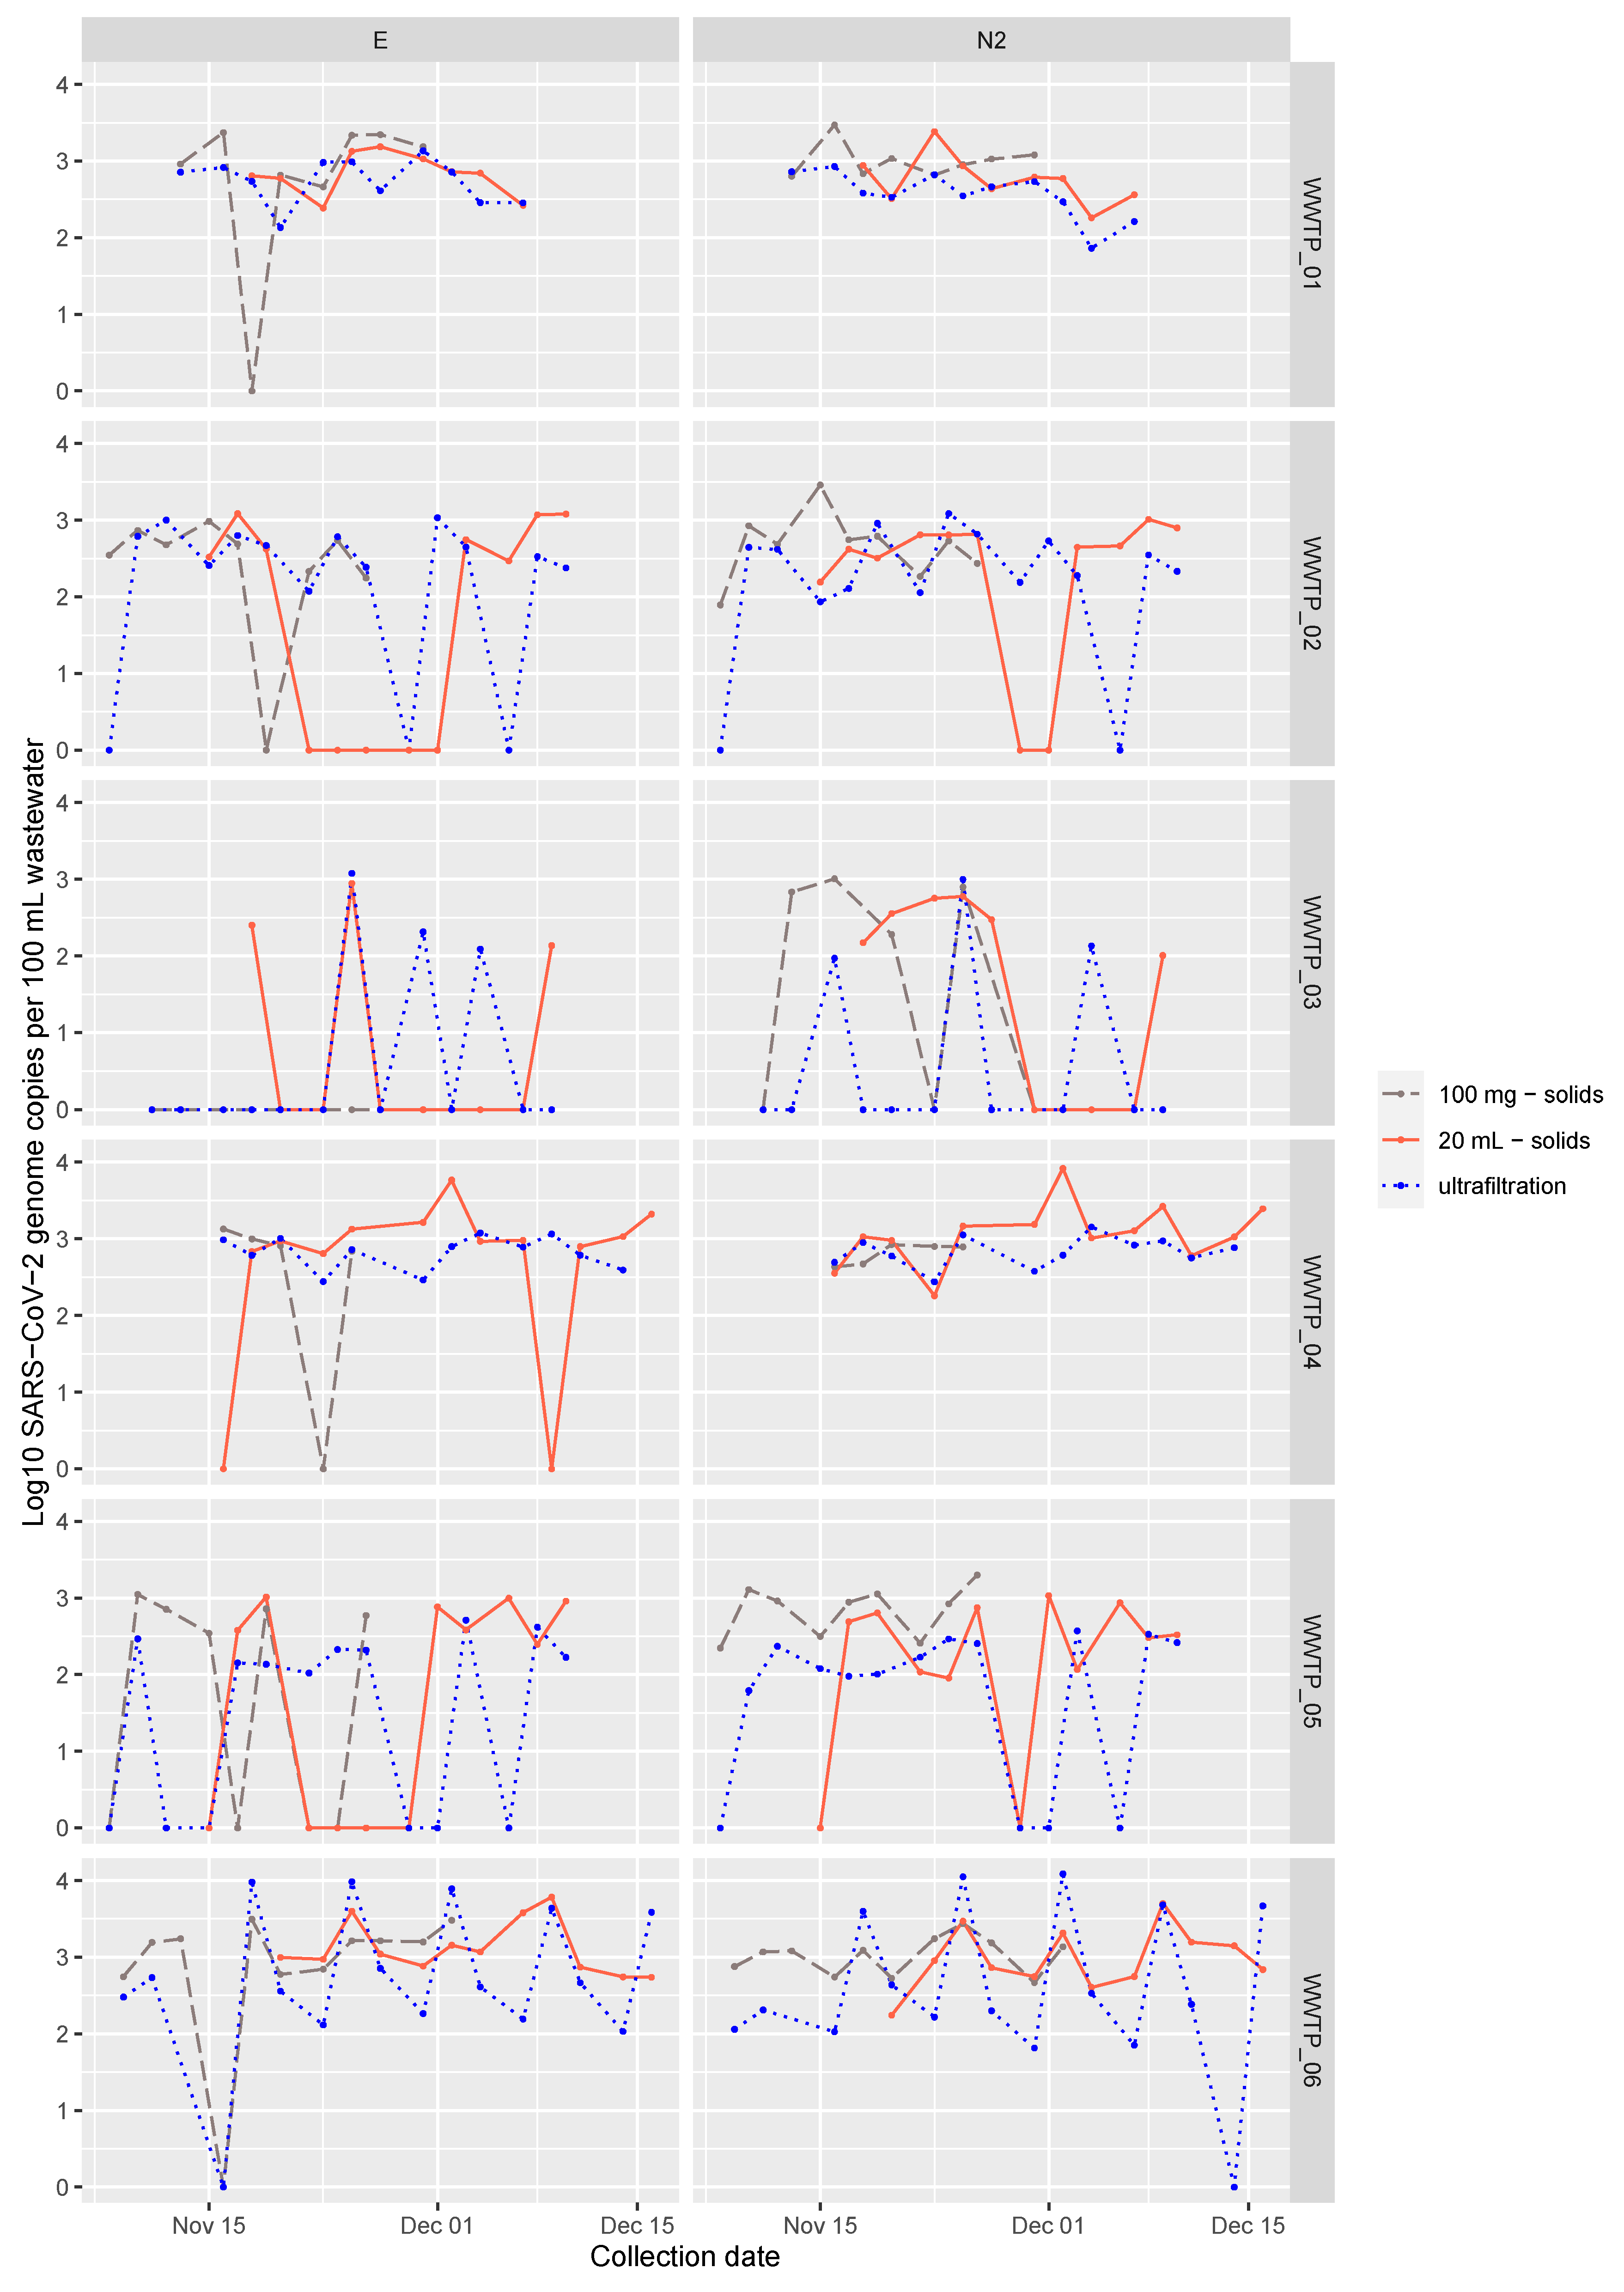
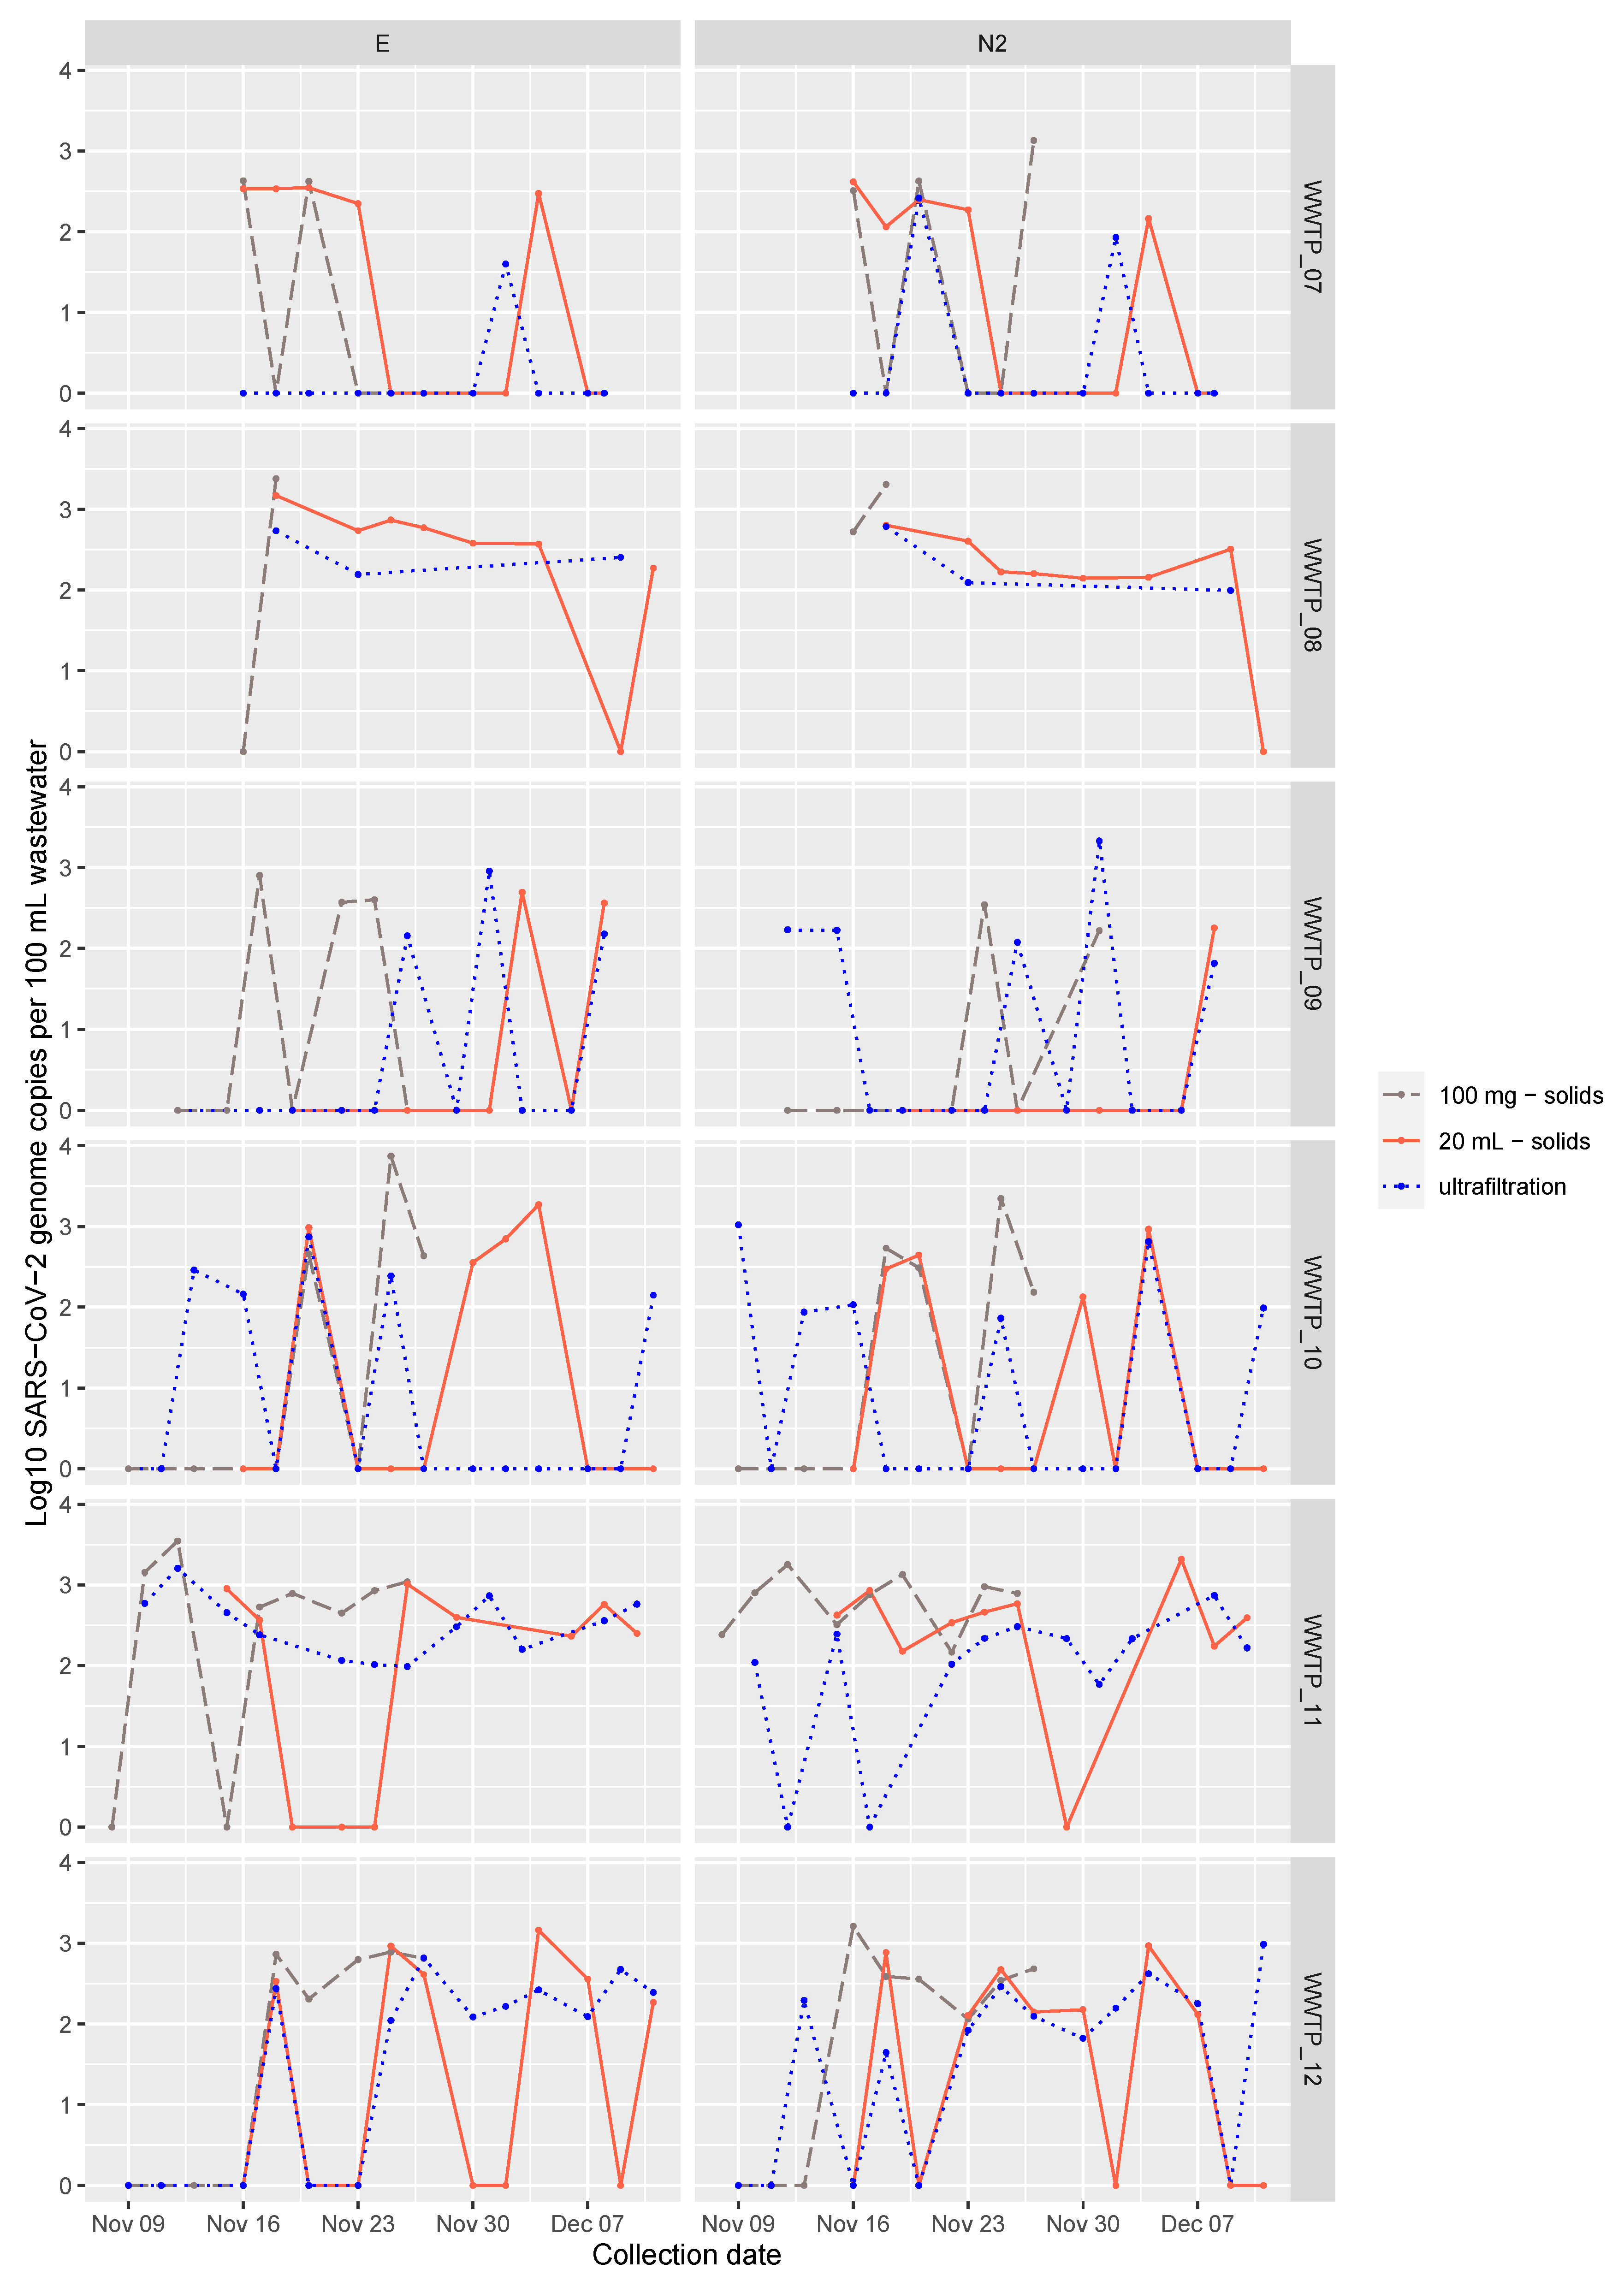
3.5. Evaluation of Wastewater Moderate-Speed Centrifuged Solids for Quantification of SARS-CoV-2 Levels

Next, we examined how different concentrations of SARS-CoV-2 quantified using solids correlate with those quantified using ultrafiltration. SARS-CoV-2 log 10 copies per 100 mL of wastewater quantified using 100 mg solids, as well as solids from 20 mL of wastewater, correlated with those quantified using the ultrafiltration method with significant (p < 0.001) Spearman’s correlation coefficients ranging from 0.4 to 0.6. The coefficients were indicative of a moderate positive relationship for both genes, E and N2, meaning that as levels detected using solids increase, levels detected by ultrafiltration also tend to increase, although not in all instances (Figure 1).
As evidenced in all comparison plots, the distribution of discordant results ranged from 2 to above 3 logs, suggesting that these were not associated with low virus levels. Visual inspection of timeline plots of SARS-CoV-2 levels by WWTP did not show any trends or difference in performance between 100 mg of solids, solids from 20 mL of wastewater, and the liquid fraction (Figure 2).

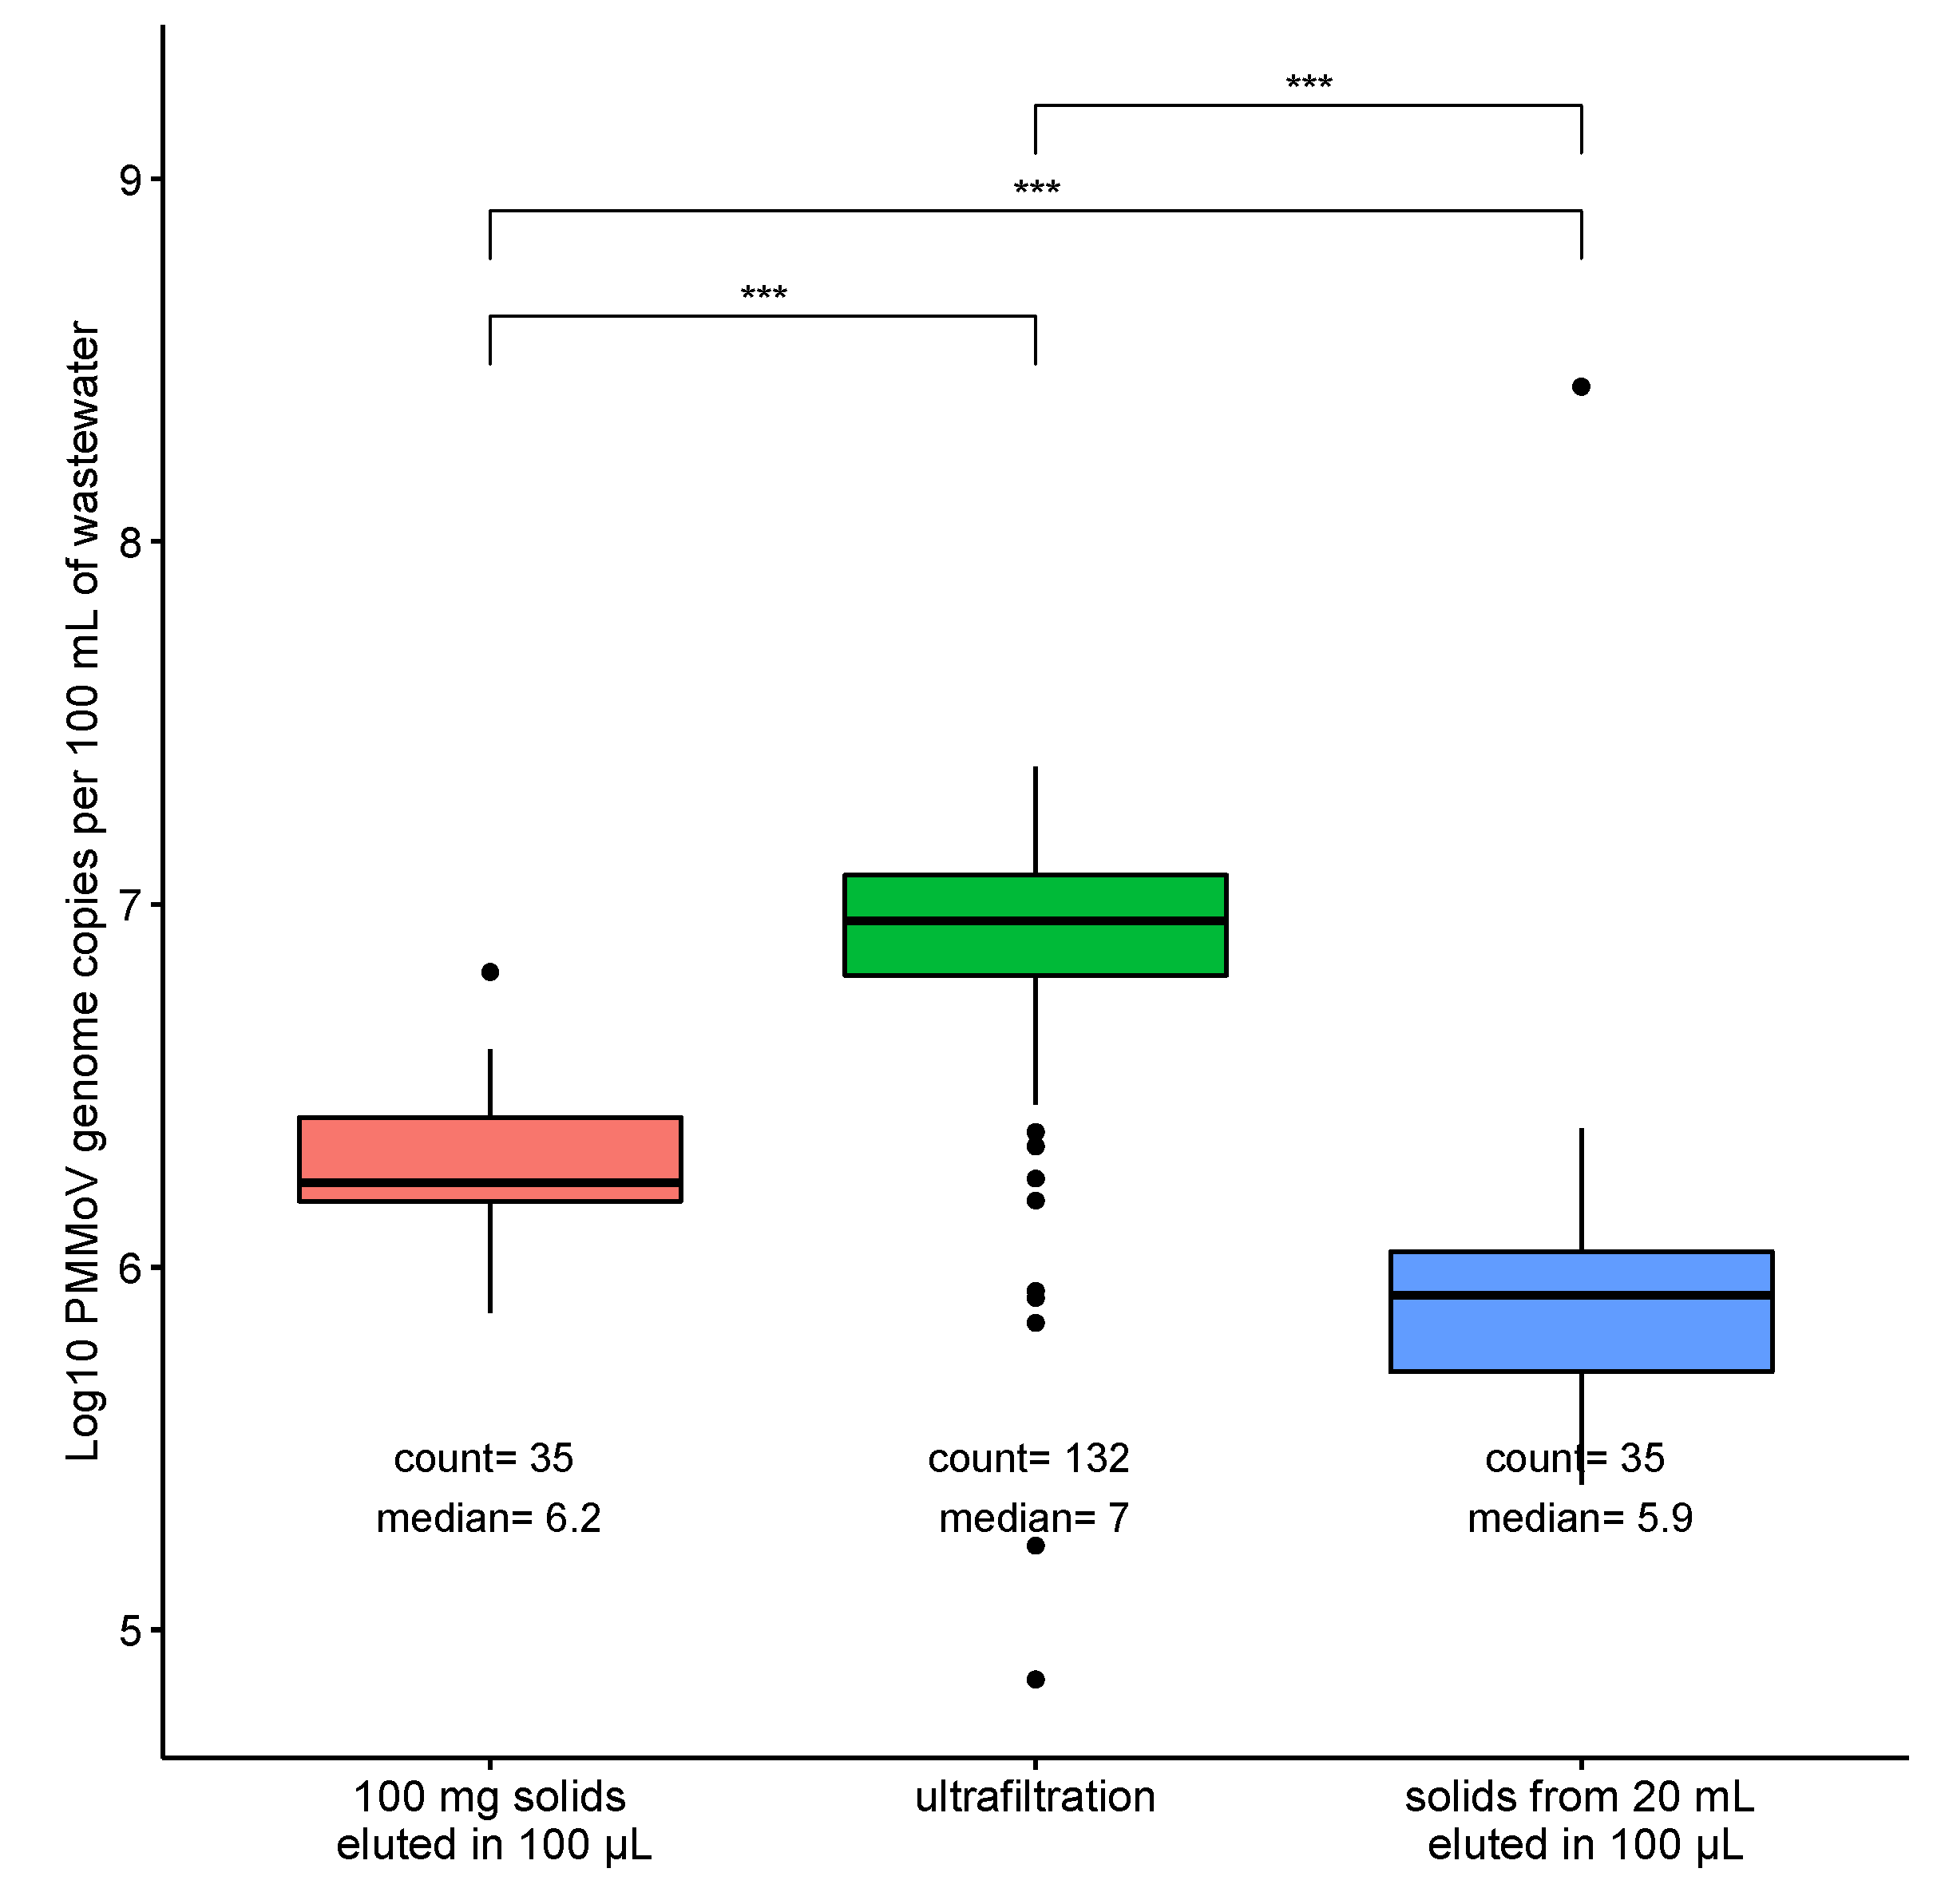
3.6. Comparison of PMMoV Levels

PMMoV in wastewater solids was also quantified to assess its potential use as a biomarker for data normalization. PMMoV levels differed significantly when quantified in wastewater solids compared to the ultrafiltration method (p < 0.001, ANOVA), with median values of 8.98 × 10⁶ (interquartile range, 6.38 × 10⁶ –1.20 × 10⁷) copies per 100 mL when using the ultrafiltration method, 1.71 × 10⁶ (interquartile range, 1.52 × 10⁶ –2.58 × 10⁶) copies per 100 mL when using 100 mg solids and 8.34 × 10⁵ (interquartile range, 5.14 × 10⁵–1.10 × 10⁶) copies per 100 mL when using solids from 20 mL (Figure 3). PMMoV levels quantified using ultrafiltration were significantly higher compared to those quantified using solids (p < 0.001 in all pairwise comparisons with solids, Tukey HSD). Quantification of PMMoV using 100 mg of solids also resulted in significantly higher virus load versus using solids from 20 mL of wastewater (p < 0.001, Tukey HSD).

3.7. Cost and Turnaround Time Comparison between Moderate-Speed Centrifuged Solids-Based Method and Ultrafiltration

A comparison of reagent costs and turnaround times associated with our solids-based method using 20 mL of wastewater versus the ultrafiltration reference method is presented in Table 3. The average cost per sample is 90 CAD for the ultrafiltration method and 45 CAD for the solids-based method. The cost of the solids-based method represents about 50% of the costs of the ultrafiltration method and the difference is largely attributed to the cost of the Centricon™ filter alone.
Besides an initial centrifugation step to separate wastewater solids, the solids-based method does not require additional steps prior to RNA extraction. In contrast, the ultrafiltration method entails a set of extra steps: adjusting the pH of the sample to 9.6–10 prior to solids separation, then adjusting sample pH back to 7–7.5 after solids separation, and lastly, a virus concentration step using the Centricon™ filter. The extra steps also result in an increased turnaround time. The solids method is faster, taking 2 h 30 min to complete, whereas the ultrafiltration method requires no less than 4 h 20 min (Table 3).

4. Discussion

While solid-based assays for detection of SARS-CoV-2 in wastewater have been previously developed and generally claimed to outperform influent-based methods, only a few studies [17,23,26] provide first-hand data in terms of detection rate and PCR inhibition. In addition, a majority of solids-based methods are coupled with PEG precipitation (Table 4) and thus require ultracentrifugation, which might not be readily available in most laboratories. In this study, we successfully optimized a method for SARS-CoV-2 detection and quantification in post-grit influent wastewater solids that does not require special consumables or equipment. Our data indicate that, compared to a reference ultrafiltration method, the performance of our solids-based method was equivalent in terms of detection rate and with significantly lower rates of PCR inhibition. Lower PCR inhibition rates should translate to more accurate quantification of SARS-CoV-2 levels and higher virus detection rates. Accordingly, with negative controls in all RT-qPCR showing no false-positive results, we identified more positive samples using solids from 20 mL compared to ultrafiltration, even though the difference was not statistically significant. A limitation of our study is that the probability of type II errors cannot be calculated since the assay sensitivity, a key factor in sample size calculation for McNemar’s test, for wastewater samples is not known and cannot be extrapolated from sensitivity determined by assay validation in clinical diagnostics [34,35,36]. On the other hand, the sample size in our study is considerably larger (median = 72, ranges from 65 to 139) than previous studies (median = 42, range 32 to 89) [17,23,25,26] and we included more wastewater treatment plants for sample variations.
Several factors might be facilitating SARS-CoV-2 detection in wastewater solids. SARS-CoV-2 is secreted in feces with reported concentrations ranging between 5 × 10³ to 107.6 copies/mL [38] thus, wastewater solids represent a significant source or start point matrix where the virus would distribute to the aqueous fraction. In addition, coronaviruses appear to have an intrinsic preference to bind the wastewater solids. Based on experiments using spiked viruses, Ye et al. reported that about 26% of murine hepatitis virus (MHV, a member of the Coronavirus genus), and 22% of cystovirus ϕ6 (another enveloped virus), adsorbed to the solids fraction of wastewater compared to only 6% of non-enveloped bacteriophage MS2 (Levivirus) [21]. It has been hypothesized that the hydrophobic nature of the coronavirus envelope may be responsible for a reduced solubility of the virus in water, promoting virus adsorption to solids [39]. In support of this hypothesis, a study comparing seven different methods for SARS-CoV-2 detection in wastewater, reported that the only two methods that included the solids fraction outperformed those that used the liquid fraction [16].
The trade-off between sensitivity and PCR inhibition was a major hurdle in optimizing the adequate weight of the input sample for the solids-based method as procuring a higher number of viral RNA genome copies in the sample also leads to an increased content of PCR inhibitors. Sample dilution is a widely known strategy to decrease the effects of PCR inhibitors [8]. In our case, a concomitant modification of both, the amount of input sample as well as the RNA extract elution volume, allowed us to reduce the effect of PCR inhibitors present in wastewater to a level below that observed with the ultrafiltration reference method without compromising sensitivity. The LOD of the RT-qPCR assay used for virus quantification is two copies per reaction, which would be equivalent to 100 and 200 copies of SARS-CoV-2 per 100 mL of wastewater for the ultrafiltration reference method and our solids-20mL method, respectively.
The present study involved 12 different WWTPs and a total of 176 samples were used for the validation of our method for SARS-CoV-2 detection. This aspect provides robustness to our solids-based approach given that wastewater composition and solids content may vary drastically between WWTPs. Still, different WWTPs may present larger variations in solids content thus, the volume of input sample used for the solids-based method is a variable that may need to be adjusted on a case-by-case basis. Importantly, the performance of our method reported in this study is applicable to post-grit wastewater, and we strongly recommend further validation when implementing it for different wastewater matrices. We have identified that our method had lower performance when testing raw wastewater samples collected directly from manholes from long-term care facilities (data not shown), resulting in lower detection rates compared to our ultrafiltration reference method.
Our data support previous observations that the distribution of coronaviruses added for “spike-and-recovery” measurements to adjust for losses occurring throughout sample processing can be significantly lower in the solids-associated versus the aqueous fraction [20]. In our experiments, the human coronavirus strain 229E was recovered at a considerably lower rate when quantified in solids compared to the ultrafiltration method which includes the liquid fraction. The reasons for such a difference were unknown and beyond the focus of this study. It is possible that the relatively short period of time between spiking and removal of the aqueous fraction was not sufficient to allow 229E to penetrate, adsorb, and reach equilibrium in the solids phase to the same extent as SARS-CoV-2. In contrast to spiked HCoV 229E, a considerable fraction of SARS-CoV-2 is expected to remain associated with solids because the virus is secreted in stools from where it can progressively disperse into the liquid fraction of wastewater.
Interestingly, PMMoV was found at significantly lower levels of about one log difference when quantified using our solids-based method compared to the ultrafiltration reference method, providing further evidence that a majority of conventional methods for virus detection in wastewater are more efficient for non-enveloped viruses. The 100 mg solids matrix also had significantly more PMMoV genome copies compared to solids from 20 mL. This finding is compatible with our results for SARS-CoV-2 showing that 100 mg solids had a higher, although not statistically significant, detection rate than solids from 20 mL.
Lastly, we identified highly significant correlations between the quantitative levels of SARS-CoV-2 determined using moderate-speed centrifuged solids versus the ultrafiltration reference method. Our data, however, did not encompass a time frame long enough to allow comparison against indicators of COVID-case data (e.g., active cases, percentage of positive tests, hospitalization rates). SAR-CoV-2 levels in primary-clarified sludge have been reportedly used successfully by others to model disease dynamics at the community level [1,2], thus our post-grit influent solids-based method may also find application in tracking and predicting disease progression in populations.

5. Conclusions

Our study identified moderate-speed centrifuged solids of post-grit influent as a reliable sample matrix for the detection of SARS-CoV-2 in wastewater. In terms of detection rate, our optimized solids-based method performed comparably to the ultrafiltration reference method and has fewer processing steps, lower costs, and a shorter turnaround time. Our work contributes to the development of improved detection methods for enveloped viruses in wastewater and provides an optimal alternative in settings with limited resources and equipment. Future studies should be focused on studying the feasibility of using the data from this solids-based method to model and predict disease dynamics.

Supplementary Materials

The following are available online at https://www.mdpi.com/article/10.3390/w13162166/s1, Figure S1: Ct values of SARS-CoV-2 RT-qPCR detection by wet weight of wastewater solids, Figure S2: Yield of wet solids per 100 mL of post-grit influent by wastewater treatment plant, Table S1: Primers used in this study, Table S2: qPCR and solids (wet) weight data.

Author Contributions

Conceptualization, X.P.; methodology, J.Y., M.H., Y.Q., S.B., X.P.; validation, J.Y., M.H., S.B.; formal analysis, M.H.; investigation, J.Y., M.H., S.B.; resources, X.P.; data curation, M.H.; writing—original draft preparation, M.H.; writing—review and editing, M.H., R.M.-B., J.Y., S.H., B.L., X.P.; visualization, M.H., X.P.; supervision, X.P.; project administration, X.P.; funding acquisition, X.P., B.L. All authors have read and agreed to the published version of the manuscript.

Funding

This research was funded by research grants from the Canadian Institutes of Health Research, Alberta Innovates and Alberta Health [RES0051047].

Institutional Review Board Statement

Not applicable.

Informed Consent Statement

Not applicable.

Data Availability Statement

Data from qPCR tests and solids (wet) weight are available under Table S2.

Acknowledgments

We thank Emma Zwaigenbaum and Melissa Wilson for their technical support. We would also like to thank the Public Health Laboratory, Alberta Precision Laboratory for their assistance with samples transportation. We thank Nicholas Ashbolt (Faculty of Science and Engineering, Southern Cross University, Lismore, New South Wales, Australia) for his support in conceiving the project. We would also like to thank Norma Ruecker and staff from the City of Calgary, Jeff Charrois and Stephen Craik from EPCOR Water Services Inc., and all other participating wastewater treatment plants for the collection of sewage samples in this study.

Conflicts of Interest

The authors declare no conflict of interest.

References

  1. Peccia, J.; Zulli, A.; Brackney, D.E.; Grubaugh, N.D.; Kaplan, E.H.; Casanovas-Massana, A.; Ko, A.I.; Malik, A.A.; Wang, D.; Wang, M.; et al. Measurement of SARS-CoV-2 RNA in Wastewater Tracks Community Infection Dynamics. Nat. Biotechnol. 2020, 38, 1164–1167. [Google Scholar] [CrossRef] [PubMed]
  2. D’Aoust, P.M.; Graber, T.E.; Mercier, E.; Montpetit, D.; Alexandrov, I.; Neault, N.; Baig, A.T.; Mayne, J.; Zhang, X.; Alain, T.; et al. Catching a Resurgence: Increase in SARS-CoV-2 Viral RNA Identified in Wastewater 48 h before COVID-19 Clinical Tests and 96 h before Hospitalizations. Sci. Total Environ. 2021, 770, 145319. [Google Scholar] [CrossRef] [PubMed]
  3. Naughton, C.; Roman, F.; Alvarado, A.; Tariqi, A.; Deeming, M.; Bibby, K.; Bivins, A.; Rose, J.; Medema, G.; Ahmed, W.; et al. COVID19 Poops Dashboard. Available online: https://www.covid19wbec.org/covidpoops19 (accessed on 27 July 2021).
  4. Manor, Y.; Shulman, L.M.; Kaliner, E.; Hindiyeh, M.; Ram, D.; Sofer, D.; Moran-Gilad, J.; Lev, B.; Grotto, I.; Gamzu, R.; et al. Intensified Environmental Surveillance Supporting the Response to Wild Poliovirus Type 1 Silent Circulation in Israel, 2013. Eurosurveillance 2014, 19, 20708. [Google Scholar] [CrossRef]
  5. Poyry, T.; Stenvik, M.; Hovi, T. Viruses in Sewage Waters during and after a Poliomyelitis Outbreak and Subsequent Nationwide Oral Poliovirus Vaccination Campaign in Finland. Appl. Environ. Microbiol. 1988, 54, 371–374. [Google Scholar] [CrossRef] [Green Version]
  6. Fumian, T.M.; Fioretti, J.M.; Lun, J.H.; dos Santos, I.A.L.; White, P.A.; Miagostovich, M.P. Detection of Norovirus Epidemic Genotypes in Raw Sewage Using next Generation Sequencing. Environ. Int. 2019, 123, 282–291. [Google Scholar] [CrossRef] [PubMed]
  7. Aw, T.G.; Gin, K.Y.H. Environmental Surveillance and Molecular Characterization of Human Enteric Viruses in Tropical Urban Wastewaters. J. Appl. Microbiol. 2010, 109, 716–730. [Google Scholar] [CrossRef]
  8. Schrader, C.; Schielke, A.; Ellerbroek, L.; Johne, R. PCR Inhibitors—Occurrence, Properties and Removal. J. Appl. Microbiol. 2012, 113, 1014–1026. [Google Scholar] [CrossRef]
  9. Sims, N.; Kasprzyk-Hordern, B. Future Perspectives of Wastewater-Based Epidemiology: Monitoring Infectious Disease Spread and Resistance to the Community Level. Environ. Int. 2020, 139, 105689. [Google Scholar] [CrossRef]
  10. Ahmed, W.; Bivins, A.; Bertsch, P.M.; Bibby, K.; Gyawali, P.; Sherchan, S.P.; Simpson, S.L.; Thomas, K.V.; Verhagen, R.; Kitajima, M.; et al. Intraday Variability of Indicator and Pathogenic Viruses in 1-h and 24-h Composite Wastewater Samples: Implications for Wastewater-Based Epidemiology. Environ. Res. 2021, 193, 110531. [Google Scholar] [CrossRef] [PubMed]
  11. Friedler, E.; Butler, D.; Alfiya, Y. Wastewater composition. In Source Separation and Decentralization for Wastewater Management; Larse, T., Udert, K., Lienert, J., Eds.; IWA Publishing: London, UK, 2013; ISBN 9781780401072. [Google Scholar]
  12. La Rosa, G.; Bonadonna, L.; Lucentini, L.; Kenmoe, S.; Suffredini, E. Coronavirus in Water Environments: Occurrence, Persistence and Concentration Methods—A Scoping Review. Water Res. 2020, 179, 115899. [Google Scholar] [CrossRef] [PubMed]
  13. Haramoto, E.; Katayama, H.; Ohgaki, S. Detection of Noroviruses in Tap Water in Japan by Means of a New Method for Concentrating Enteric Viruses in Large Volumes of Freshwater. Appl. Environ. Microbiol. 2004, 70, 2154–2160. [Google Scholar] [CrossRef] [Green Version]
  14. Qiu, Y.; Lee, B.E.; Ruecker, N.J.; Neumann, N.; Ashbolt, N.; Pang, X. A One-Step Centrifugal Ultrafiltration Method to Concentrate Enteric Viruses from Wastewater. J. Virol. Methods 2016, 237, 150–153. [Google Scholar] [CrossRef] [PubMed]
  15. Alygizakis, N.; Markou, A.N.; Rousis, N.I.; Galani, A.; Avgeris, M.; Adamopoulos, P.G.; Scorilas, A.; Lianidou, E.S.; Paraskevis, D.; Tsiodras, S.; et al. Analytical Methodologies for the Detection of SARS-CoV-2 in Wastewater: Protocols and Future Perspectives. TrAC Trends Anal. Chem. 2021, 134, 116125. [Google Scholar] [CrossRef]
  16. Ahmed, W.; Bertsch, P.M.; Bivins, A.; Bibby, K.; Farkas, K.; Gathercole, A.; Haramoto, E.; Gyawali, P.; Korajkic, A.; McMinn, B.R.; et al. Comparison of Virus Concentration Methods for the RT-QPCR-Based Recovery of Murine Hepatitis Virus, a Surrogate for SARS-CoV-2 from Untreated Wastewater. Sci. Total Environ. 2020, 739, 139960. [Google Scholar] [CrossRef] [PubMed]
  17. Kitamura, K.; Sadamasu, K.; Muramatsu, M.; Yoshida, H. Efficient Detection of SARS-CoV-2 RNA in the Solid Fraction of Wastewater. Sci. Total Environ. 2021, 763, 144587. [Google Scholar] [CrossRef]
  18. D’Aoust, P.M.; Mercier, E.; Montpetit, D.; Jia, J.-J.; Alexandrov, I.; Neault, N.; Baig, A.T.; Mayne, J.; Zhang, X.; Alain, T.; et al. Quantitative Analysis of SARS-CoV-2 RNA from Wastewater Solids in Communities with Low COVID-19 Incidence and Prevalence. Water Res. 2021, 188, 116560. [Google Scholar] [CrossRef] [PubMed]
  19. Pecson, B.M.; Darby, E.; Haas, C.N.; Amha, Y.M.; Bartolo, M.; Danielson, R.; Dearborn, Y.; di Giovanni, G.; Ferguson, C.; Fevig, S.; et al. Reproducibility and Sensitivity of 36 Methods to Quantify the SARS-CoV-2 Genetic Signal in Raw Wastewater: Findings from an Interlaboratory Methods Evaluation in the U.S. Environ. Sci. Water Res. Technol. 2021, 7, 504–520. [Google Scholar] [CrossRef]
  20. Chik, A.H.S.; Glier, M.B.; Servos, M.; Mangat, C.S.; Pang, X.-L.; Qiu, Y.; D’Aoust, P.M.; Burnet, J.-B.; Delatolla, R.; Dorner, S.; et al. Comparison of Approaches to Quantify SARS-CoV-2 in Wastewater Using RT-QPCR: Results and Implications from a Collaborative Inter-Laboratory Study in Canada. J. Environ. Sci. 2021, 107, 218–229. [Google Scholar] [CrossRef]
  21. Ye, Y.; Ellenberg, R.M.; Graham, K.E.; Wigginton, K.R. Survivability, Partitioning, and Recovery of Enveloped Viruses in Untreated Municipal Wastewater. Environ. Sci. Technol. 2016, 50, 5077–5085. [Google Scholar] [CrossRef]
  22. Peccia, J.; Zulli, A.; Brackney, D.E.; Grubaugh, N.D.; Kaplan, E.H.; Casanovas-Massana, A.; Ko, A.I.; Malik, A.A.; Wang, D.; Wang, M.; et al. SARS-CoV-2 RNA Concentrations in Primary Municipal Sewage Sludge as a Leading Indicator of COVID-19 Outbreak Dynamics. medRxiv 2020. [Google Scholar] [CrossRef]
  23. Graham, K.E.; Loeb, S.K.; Wolfe, M.K.; Catoe, D.; Sinnott-Armstrong, N.; Kim, S.; Yamahara, K.M.; Sassoubre, L.M.; Mendoza Grijalva, L.M.; Roldan-Hernandez, L.; et al. SARS-CoV-2 RNA in Wastewater Settled Solids Is Associated with COVID-19 Cases in a Large Urban Sewershed. Environ. Sci. Technol. 2021, 55, 488–498. [Google Scholar] [CrossRef]
  24. Kocamemi, B.A.; Kurt, H.; Sait, A.; Sarac, F.; Saatci, A.M.; Pakdemirli, B. SARS-CoV-2 Detection in Istanbul Wastewater Treatment Plant Sludges. medRxiv 2020. [Google Scholar] [CrossRef]
  25. Tomasino, M.P.; Semedo, M.; Vieira e Moreira, P.; Ferraz, E.; Rocha, A.; Carvalho, M.F.; Magalhães, C.; Mucha, A.P. SARS-CoV-2 RNA Detected in Urban Wastewater from Porto, Portugal: Method Optimization and Continuous 25-Week Monitoring. Sci. Total Environ. 2021, 792, 148467. [Google Scholar] [CrossRef]
  26. Balboa, S.; Mauricio-Iglesias, M.; Rodriguez, S.; Martínez-Lamas, L.; Vasallo, F.J.; Regueiro, B.; Lema, J.M. The Fate of SARS-COV-2 in WWTPS Points out the Sludge Line as a Suitable Spot for Detection of COVID-19. Sci. Total Environ. 2021, 772, 145268. [Google Scholar] [CrossRef] [PubMed]
  27. Markt, R.; Mayr, M.; Peer, E.; Wagner, A.O.; Lackner, N.; Insam, H. Detection and Stability of SARS-CoV-2 Fragments in Wastewater: Impact of Storage Temperature. medRxiv 2021. [Google Scholar] [CrossRef]
  28. Pabbaraju, K.; Wong, A.A.; Douesnard, M.; Ma, R.; Gill, K.; Dieu, P.; Fonseca, K.; Zelyas, N.; Tipples, G.A. Development and Validation of Reverse Transcriptase-PCR Assays for the Testing of SARS-CoV-2. Off. J. Assoc. Med. Microbiol. Infect. Dis. Can. 2021, 6, 16–22. [Google Scholar] [CrossRef]
  29. Lu, X.; Wang, L.; Sakthivel, S.K.; Whitaker, B.; Murray, J.; Kamili, S.; Lynch, B.; Malapati, L.; Burke, S.A.; Harcourt, J.; et al. US CDC Real-Time Reverse Transcription PCR Panel for Detection of Severe Acute Respiratory Syndrome Coronavirus 2. Emerg. Infect. Dis. 2020, 26, 8. [Google Scholar] [CrossRef] [PubMed]
  30. Vijgen, L.; Keyaerts, E.; Moës, E.; Maes, P.; Duson, G.; van Ranst, M. Development of One-Step, Real-Time, Quantitative Reverse Transcriptase PCR Assays for Absolute Quantitation of Human Coronaviruses OC43 and 229E. J. Clin. Microbiol. 2005, 43, 5452–5456. [Google Scholar] [CrossRef] [Green Version]
  31. Haugland, R.A.; Siefring, S.C.; Wymer, L.J.; Brenner, K.P.; Dufour, A.P. Comparison of Enterococcus Measurements in Freshwater at Two Recreational Beaches by Quantitative Polymerase Chain Reaction and Membrane Filter Culture Analysis. Water Res. 2005, 39, 559–568. [Google Scholar] [CrossRef]
  32. Zhang, T.; Breitbart, M.; Lee, W.H.; Run, J.Q.; Wei, C.L.; Soh, S.W.; Hibberd, M.L.; Liu, E.T.; Rohwer, F.; Ruan, Y. RNA Viral Community in Human Feces: Prevalence of Plant Pathogenic Viruses. PLoS Biol. 2006, 4, e3. [Google Scholar] [CrossRef] [Green Version]
  33. Pembury Smith, M.Q.R.; Ruxton, G.D. Effective Use of the McNemar Test. Behav. Ecol. Sociobiol. 2020, 74, 133. [Google Scholar] [CrossRef]
  34. Lachenbruch, P.A. On the Sample Size for Studies Based upon Mcnemar’s Test. Stat. Med. 1992, 11, 1521–1525. [Google Scholar] [CrossRef]
  35. Vuolo, M.; Uggen, C.; Lageson, S. Statistical Power in Experimental Audit Studies: Cautions and Calculations for Matched Tests With Nominal Outcomes. Sociol. Methods Res. 2015, 45, 260–303. [Google Scholar] [CrossRef]
  36. Lu, Y.; Bean, J.A. On the Sample Size for One-Sided Equivalence of Sensitivities Based upon McNemar’s Test. Stat. Med. 1995, 14, 1831–1839. [Google Scholar] [CrossRef] [PubMed]
  37. Wolfe, M.K.; Archana, A.; Catoe, D.; Coffman, M.M.; Dorevich, S.; Graham, K.E.; Kim, S.; Grijalva, L.M.; Roldan-Hernandez, L.; Silverman, A.I.; et al. Scaling of SARS-CoV-2 RNA in Settled Solids from Multiple Wastewater Treatment Plants to Compare Incidence Rates of Laboratory-Confirmed COVID-19 in Their Sewersheds. Environ. Sci. Technol. Lett. 2021, 8, 398–404. [Google Scholar] [CrossRef]
  38. Foladori, P.; Cutrupi, F.; Segata, N.; Manara, S.; Pinto, F.; Malpei, F.; Bruni, L.; la Rosa, G. SARS-CoV-2 from Faeces to Wastewater Treatment: What Do We Know? A Review. Sci. Total Environ. 2020, 743, 140444. [Google Scholar] [CrossRef] [PubMed]
  39. Gundy, P.M.; Gerba, C.P.; Pepper, I.L. Survival of Coronaviruses in Water and Wastewater. Food Environ. Virol. 2008, 1, 10. [Google Scholar] [CrossRef] [Green Version]
Figure 1. Correlation of SARS-CoV-2 levels in wastewater quantified using moderate-speed centrifuged solids versus an ultrafiltration reference method. The x- and y-axis scales represent the logarithm (log 10) of SARS-CoV-2 genome copies per 100 mL of wastewater. Spearman’s correlation coefficients (ρ) and the corresponding p-values are shown for all pairwise comparisons (gene E and N2 data) between 100 mg of solids, solids from 20 mL, and the ultrafiltration reference method.
Water 13 02166 g001
Figure 2. Timeline trends of SARS-CoV-2 levels in post-grit influent wastewater as quantified using moderate-speed centrifuged solids and an ultrafiltration reference method. Only a subset of samples was tested using 100 mg solids because weighting wet solids is labor-intensive, time-consuming, and not practical for routine analysis.
Water 13 02166 g002aWater 13 02166 g002b
Figure 3. PMMoV levels in wastewater quantified by different methods. Differences in PMMoV Log 10 copies per 100 mL of wastewater were identified (ANOVA, p < 0.001). Results from Tukey HSD post hoc test are shown with horizontal bars and significance code: p < 0.001 ‘***’.
Water 13 02166 g003
Table 1. Effect of different amounts of wastewater solids and pH adjustment on SARS-CoV-2 detection compared to an ultrafiltration-based method.
Method aMethod bConcordant
Positive
Concordant
Negative
Discordant
a + b −
Discordant
a − b +
np-Value 1
50 mg solids,
pH not adjusted,
50µL elution
Ultrafiltration14371012730.68
50 mg solids,
pH 9.6–10,
50 µL elution
Ultrafiltration939717720.04
100 mg solids,
pH not adjusted,
50 µL elution
Ultrafiltration15281411680.55
100 mg solids,
pH 9.6–10,
50 µL elution
Ultrafiltration1337713700.19
100 mg solids,
pH not adjusted
100 µL elution
Ultrafiltration5713179960.12
Solids from 20 mL,
pH not adjusted
100 µL elution
100 mg solid,
pH not adjusted
100 µL elution
456410650.12
Solids from 20 mL,
pH not adjusted 100 µL elution
Ultrafiltration742623161390.26
1 The statistical significance of differences between methods a and b were calculated using McNemar’s mid-p test if discordant cases were < 25 or the McNemar’s test without correction if discordant cases were ≥ 25.
Table 2. Comparison of PCR inhibition rates.
MethodFraction of Samples with Negative or Delayed (≥34) Salmon DNA Ct Values%Chi-Square Statisticp-Value
50 mg solids,
pH not adjusted,
50 µL elution
32/7343.843.77<0.001
50 mg solids,
pH 9.5–10,
50 µL elution
28/7238.933.303<0.001
100 mg solids,
pH not adjusted,
50 µL elution
38/6855.969.691<0.001
100 mg solids,
pH 9.5–10,
50 µL elution
26/7037.129.468<0.001
100 mg solids,
pH not adjusted,
100 µL elution
10/9610.40.00400.47
Solids from 20 mL, pH not adjusted,
100 µL elution
4/1393.04.88150.014
Ultrafiltration23/2439.5--
Table 3. Comparison of consumables costs and turnaround times.
StepUltrafiltrationModerate-Speed Centrifuged Solids 1
Costs per sample (CAD):
   Virus extraction and plastic ware (pipette tips, microfuge tubes, etc.)54
   Virus concentration (Centricon™ filter)440
   RNA extraction reagents66
   RT-PCR and PCR reagents 23535
   Total cost of consumables9045
Minimum turnaround time 3:
   Separation of solids/liquid fractions15 min15 min
   Virus extraction and concentration:
   pH adjustments and filtration through Centricon™ column
1 h 50 minNot applicable
   RNA extraction1 h1 h
   RT-PCR1 h 15 min1 h 15 min
   Total minimum turnaround time4 h 20 min2 h 30 min
1 Using 20 mL of wastewater as input sample. 2 Includes five targets: SARS-CoV-2 genes E and N2, HuCoV 229E, PMMoV, salmon DNA. 3 Estimated time for running one sample and controls; times might increase depending on the number of samples.
Table 4. Previous studies describing solids-based methods for SARS-CoV-2 detection in wastewater.
Research GroupSolids TypeMethod for Separation of Solids 1PEG
Addition
PCR Inhibition Test
Peccia et al. [1]Primary sludgeNone, sludge used directly for RNA extractionNoSamples (n = 5) were spiked with a target RNA and tested undiluted and diluted (5× and 25×). No significant differences in Ct values were identified between diluting versus no diluting samples
Balboa et al. [26]Primary sludge,
biological sludge,
thickened sludge,
digested sludge
None, sludge used directly for PEG precipitationYesUsed RT-qPCR Allplex™ internal control. Inhibition was identified in 2 out of 50 samples
Kitamura et al. [17]Raw influent solids1840× g
for 30 min
NoUsed PMMoV as indicator of RT-PCR inhibition. PMMoV levels were similar between WWTPs but were lower in solids compared to those in the supernatant/liquid fraction
D’Aoust et al. [2,18]Influent post grit solids,
primary clarified sludge
Gravity settled for 1h at 4 °CYesInhibition identified by comparing RT-qPCR and RT-ddPCR results and after testing diluted samples (2× and 5×)
Graham et al. [23]
Wolfe et al. [37]
Primary settled solids24,000× g
for 30 min at 4 °C
YesIdentified at high frequency after testing undiluted and diluted (10× and 50×) samples.
Kocamemi et al. [24]Primary sludge,
waste activated sludge
7471× g
for 30 min at 4 °C
YesDid not report inhibition tests
Tomasino et al. [25]Raw influent solids4700× g
for 30 min at 4 °C
NoDid not report inhibition tests
1 Prior PEG, if PEG was added.
Publisher’s Note: MDPI stays neutral with regard to jurisdictional claims in published maps and institutional affiliations.

