
COVID-19 Specific Immune Markers Revealed by Single Cell Phenotypic Profiling

 , ,
, ,  , , and
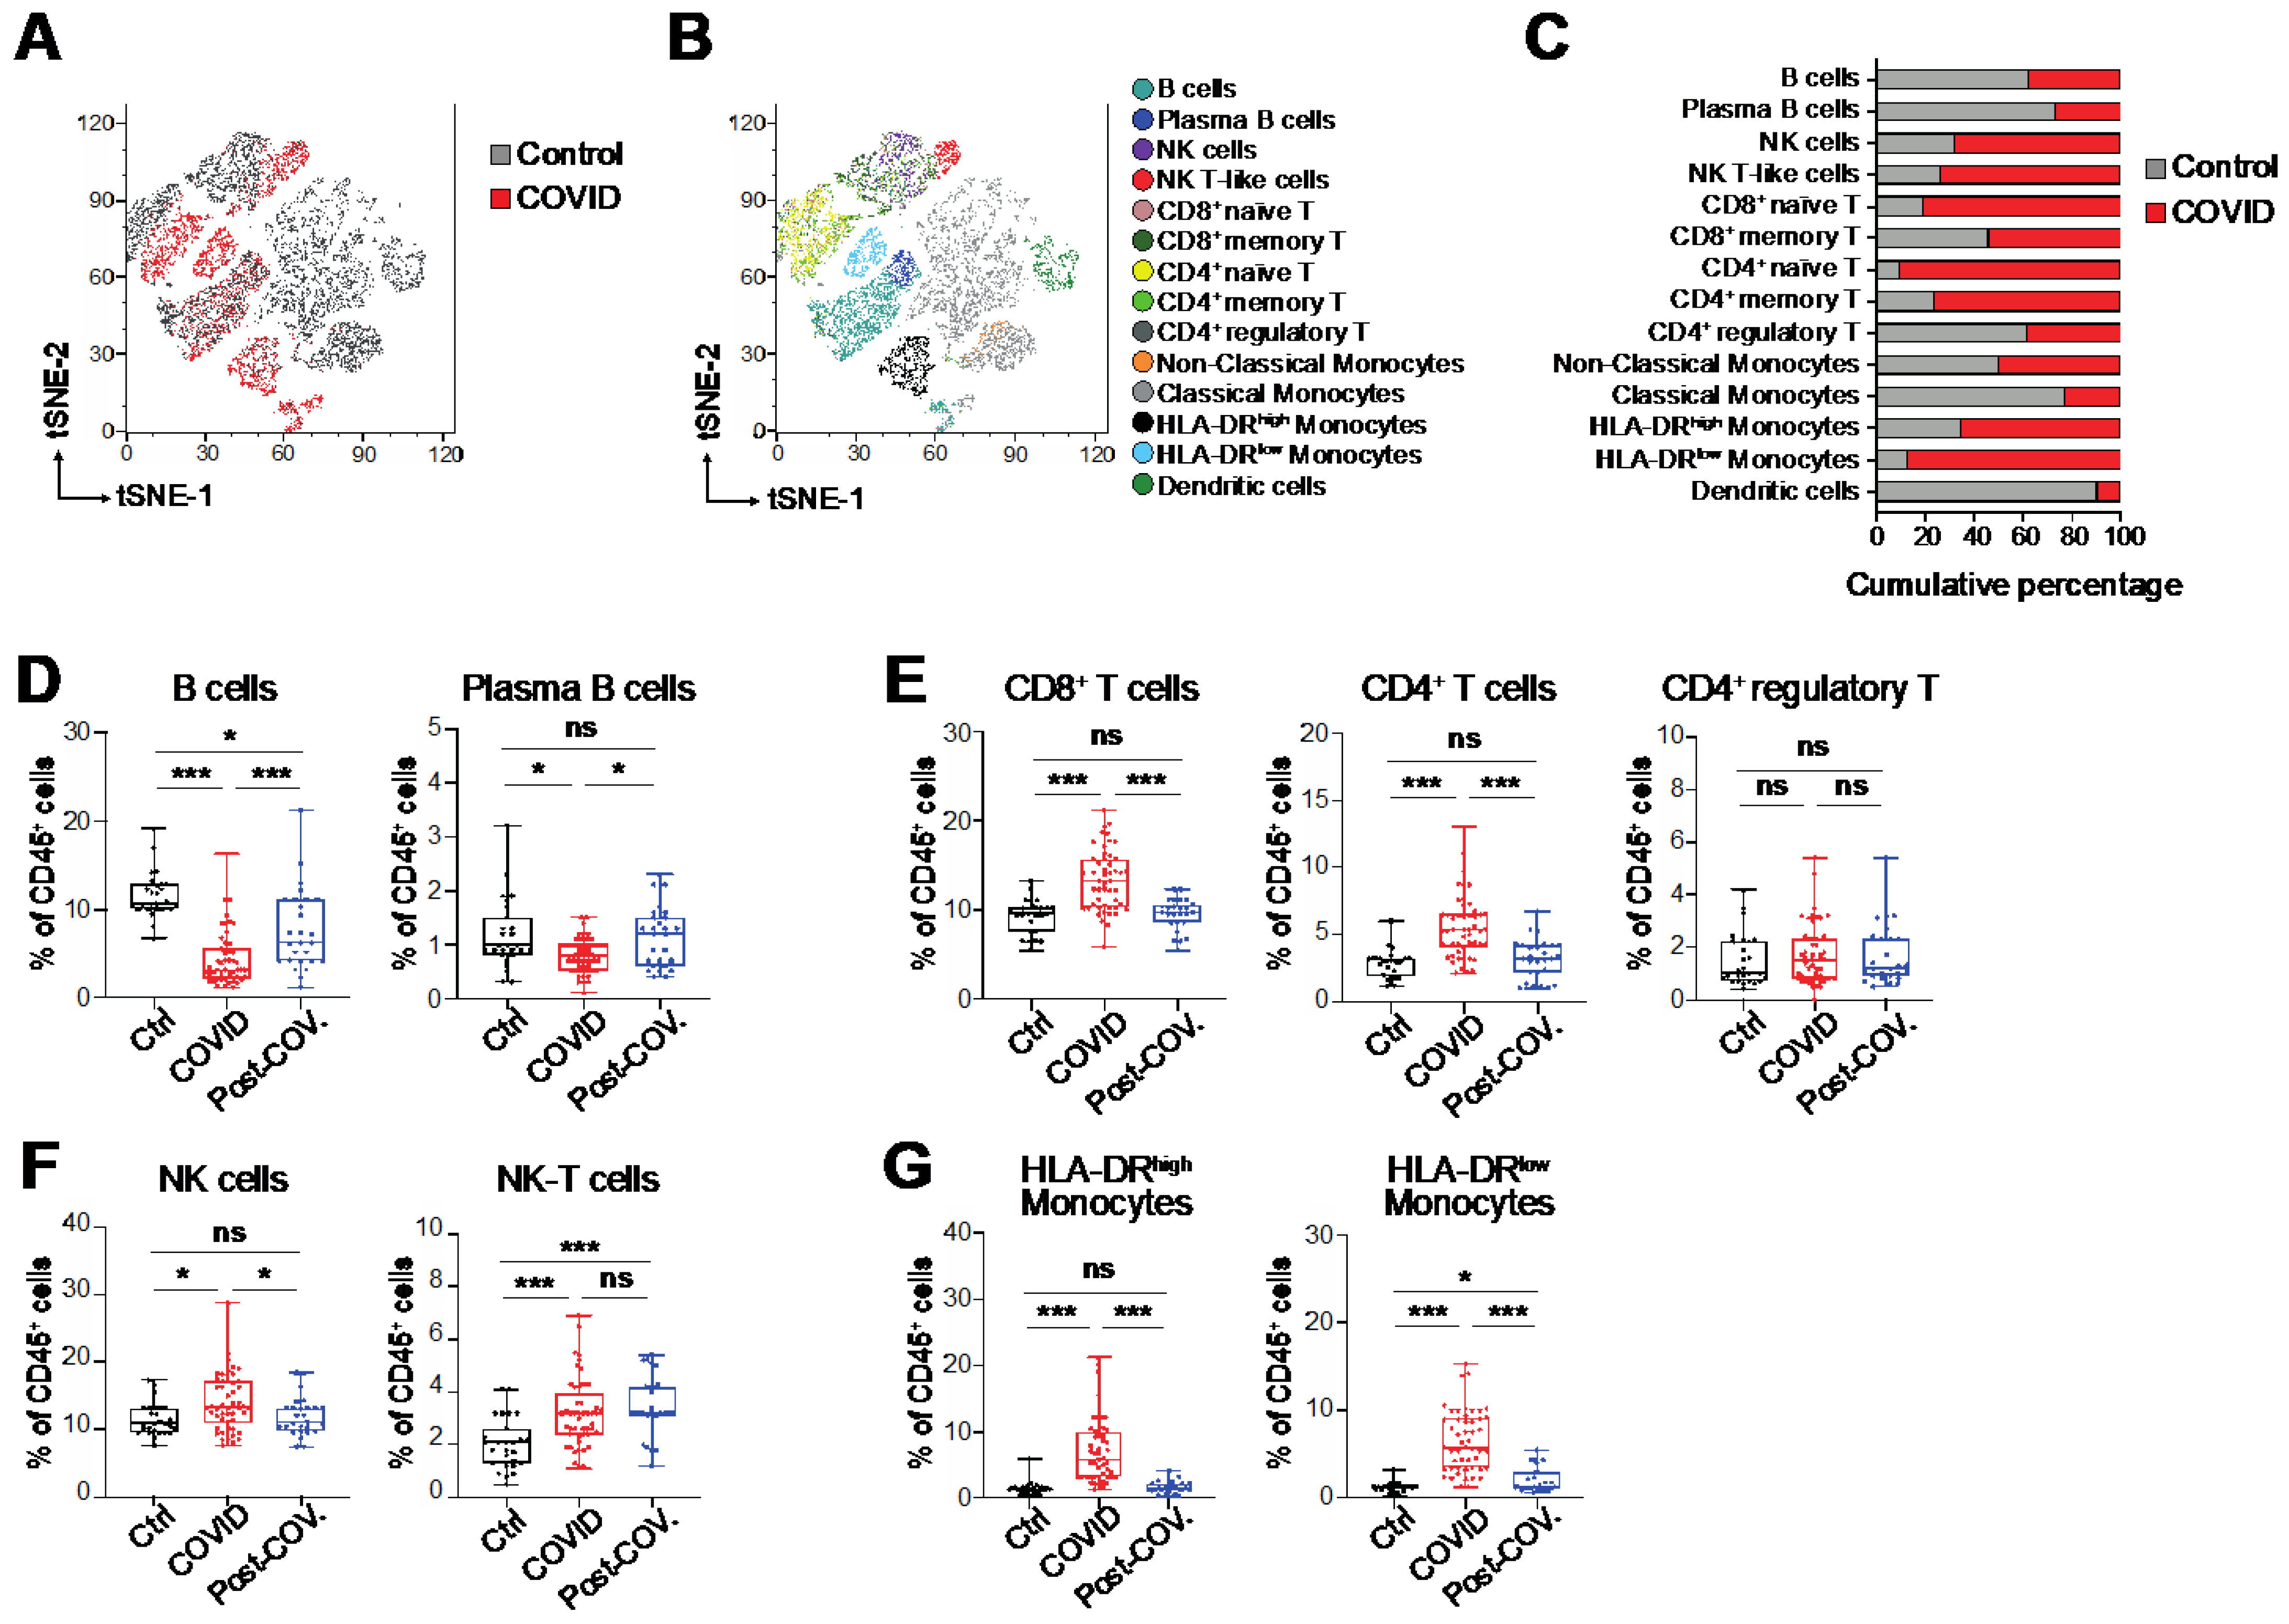
Abstract
:1. Introduction
2. Materials and Methods
2.1. Human Samples and Count Blood Cells
2.2. Isolation of Peripheral Blood Mononuclear Cells (PBMCs)
2.3. Targeted RNA Sequencing at Single-Cell Level (ScRNA-Seq)
2.4. ScRNA-Seq Data Analysis
2.5. Cell Culture and Transfection
2.6. Protein Extraction and Western Blot Assay
2.7. Flow Cytometry Assays
2.8. Assessment of Cytokines and Chemokines Levels
3. Results
3.1. Immunological Alterations in Peripheral Blood of COVID-19 Patients
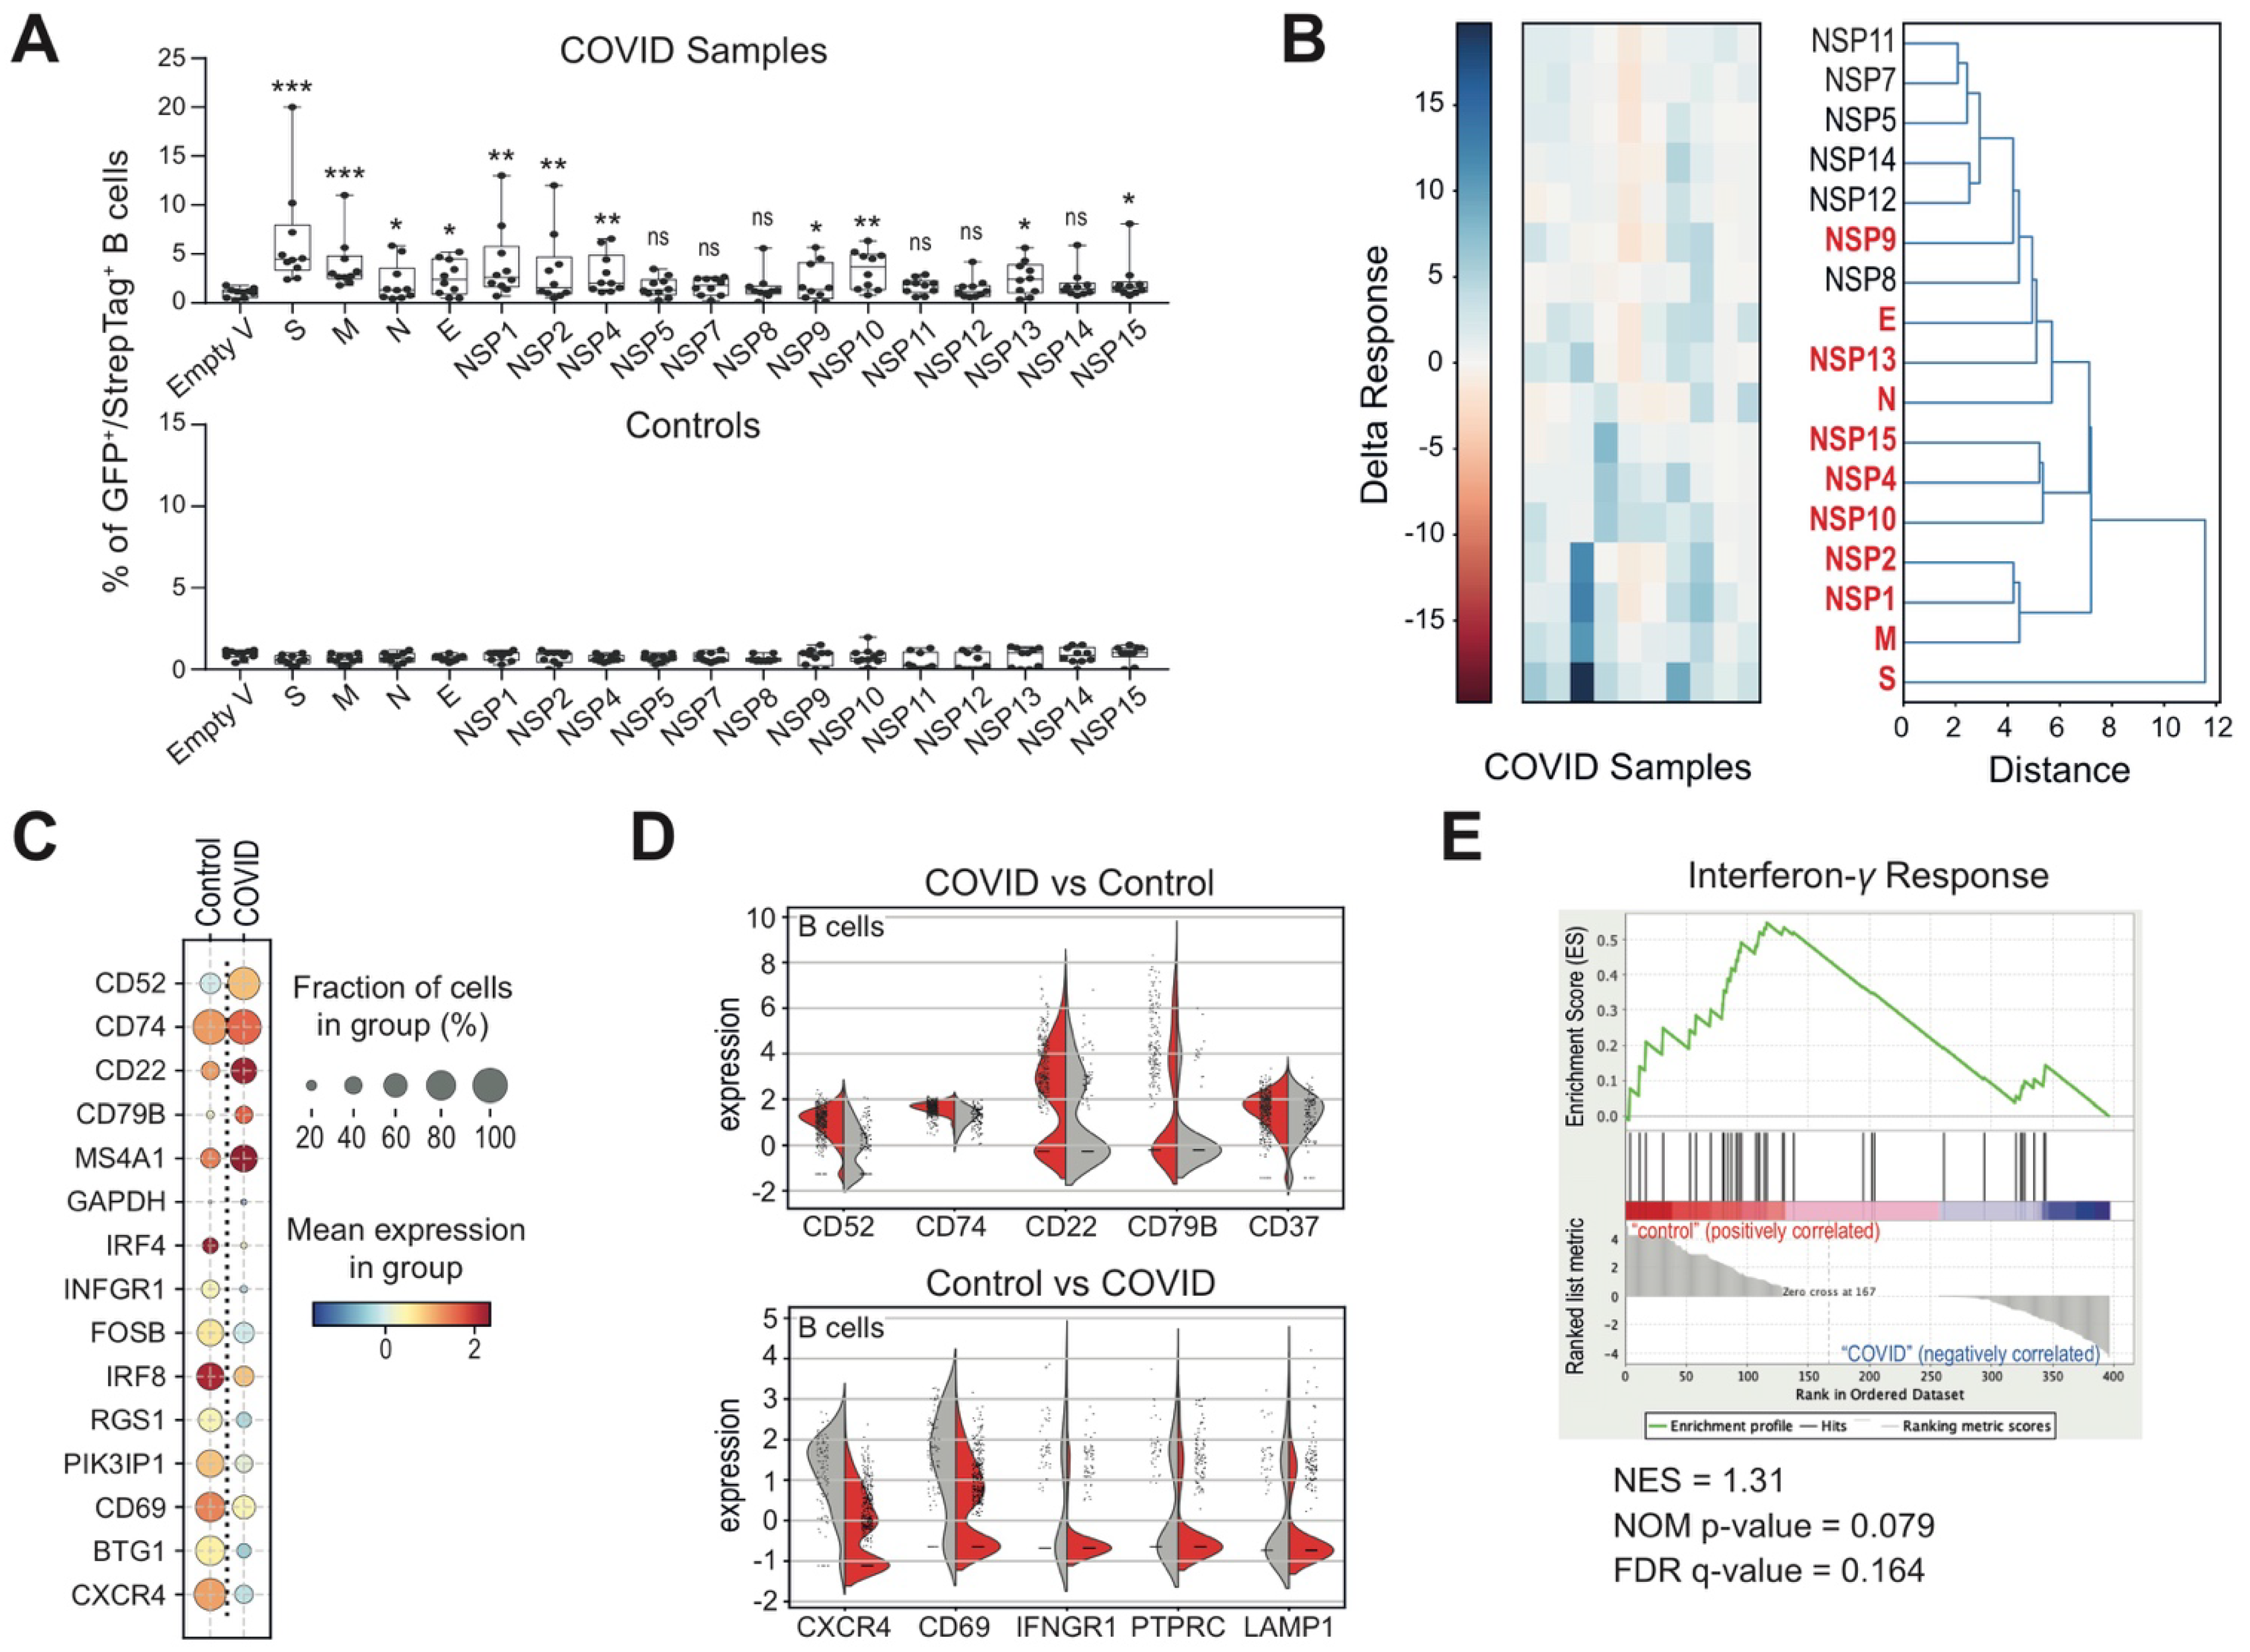
3.2. Altered B Cell Signature and Activation States in COVID-19 Patients
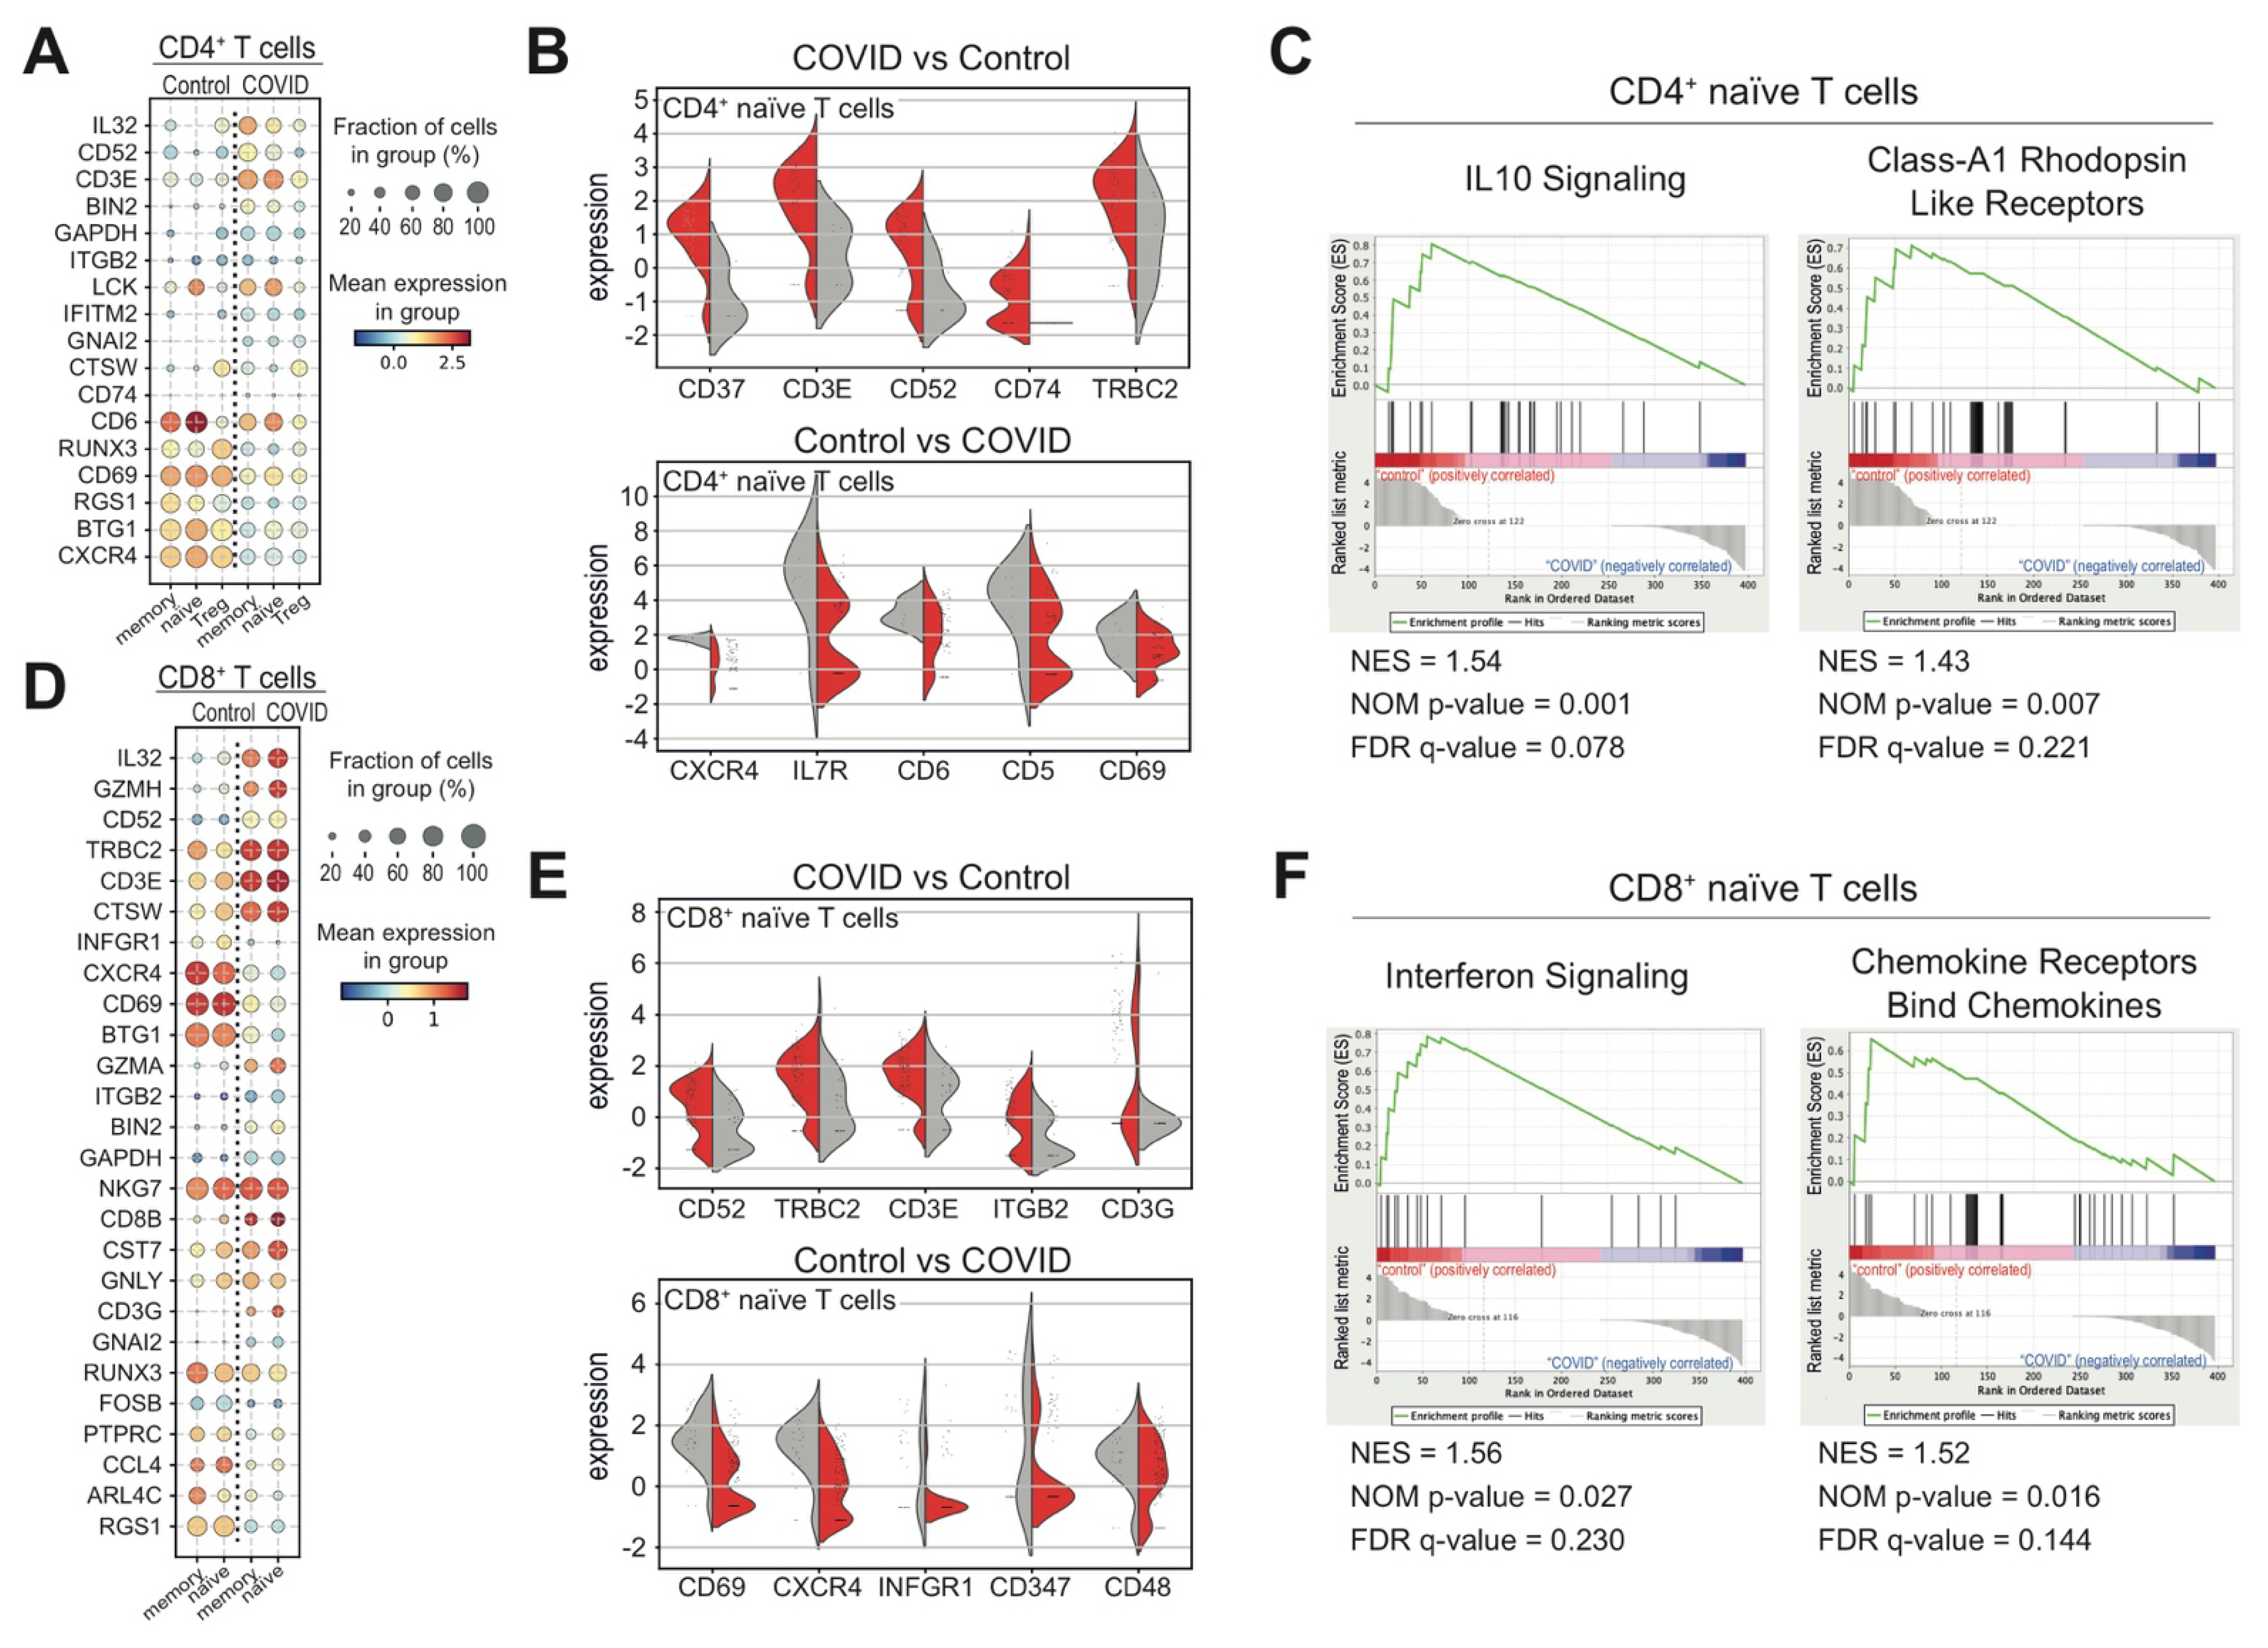
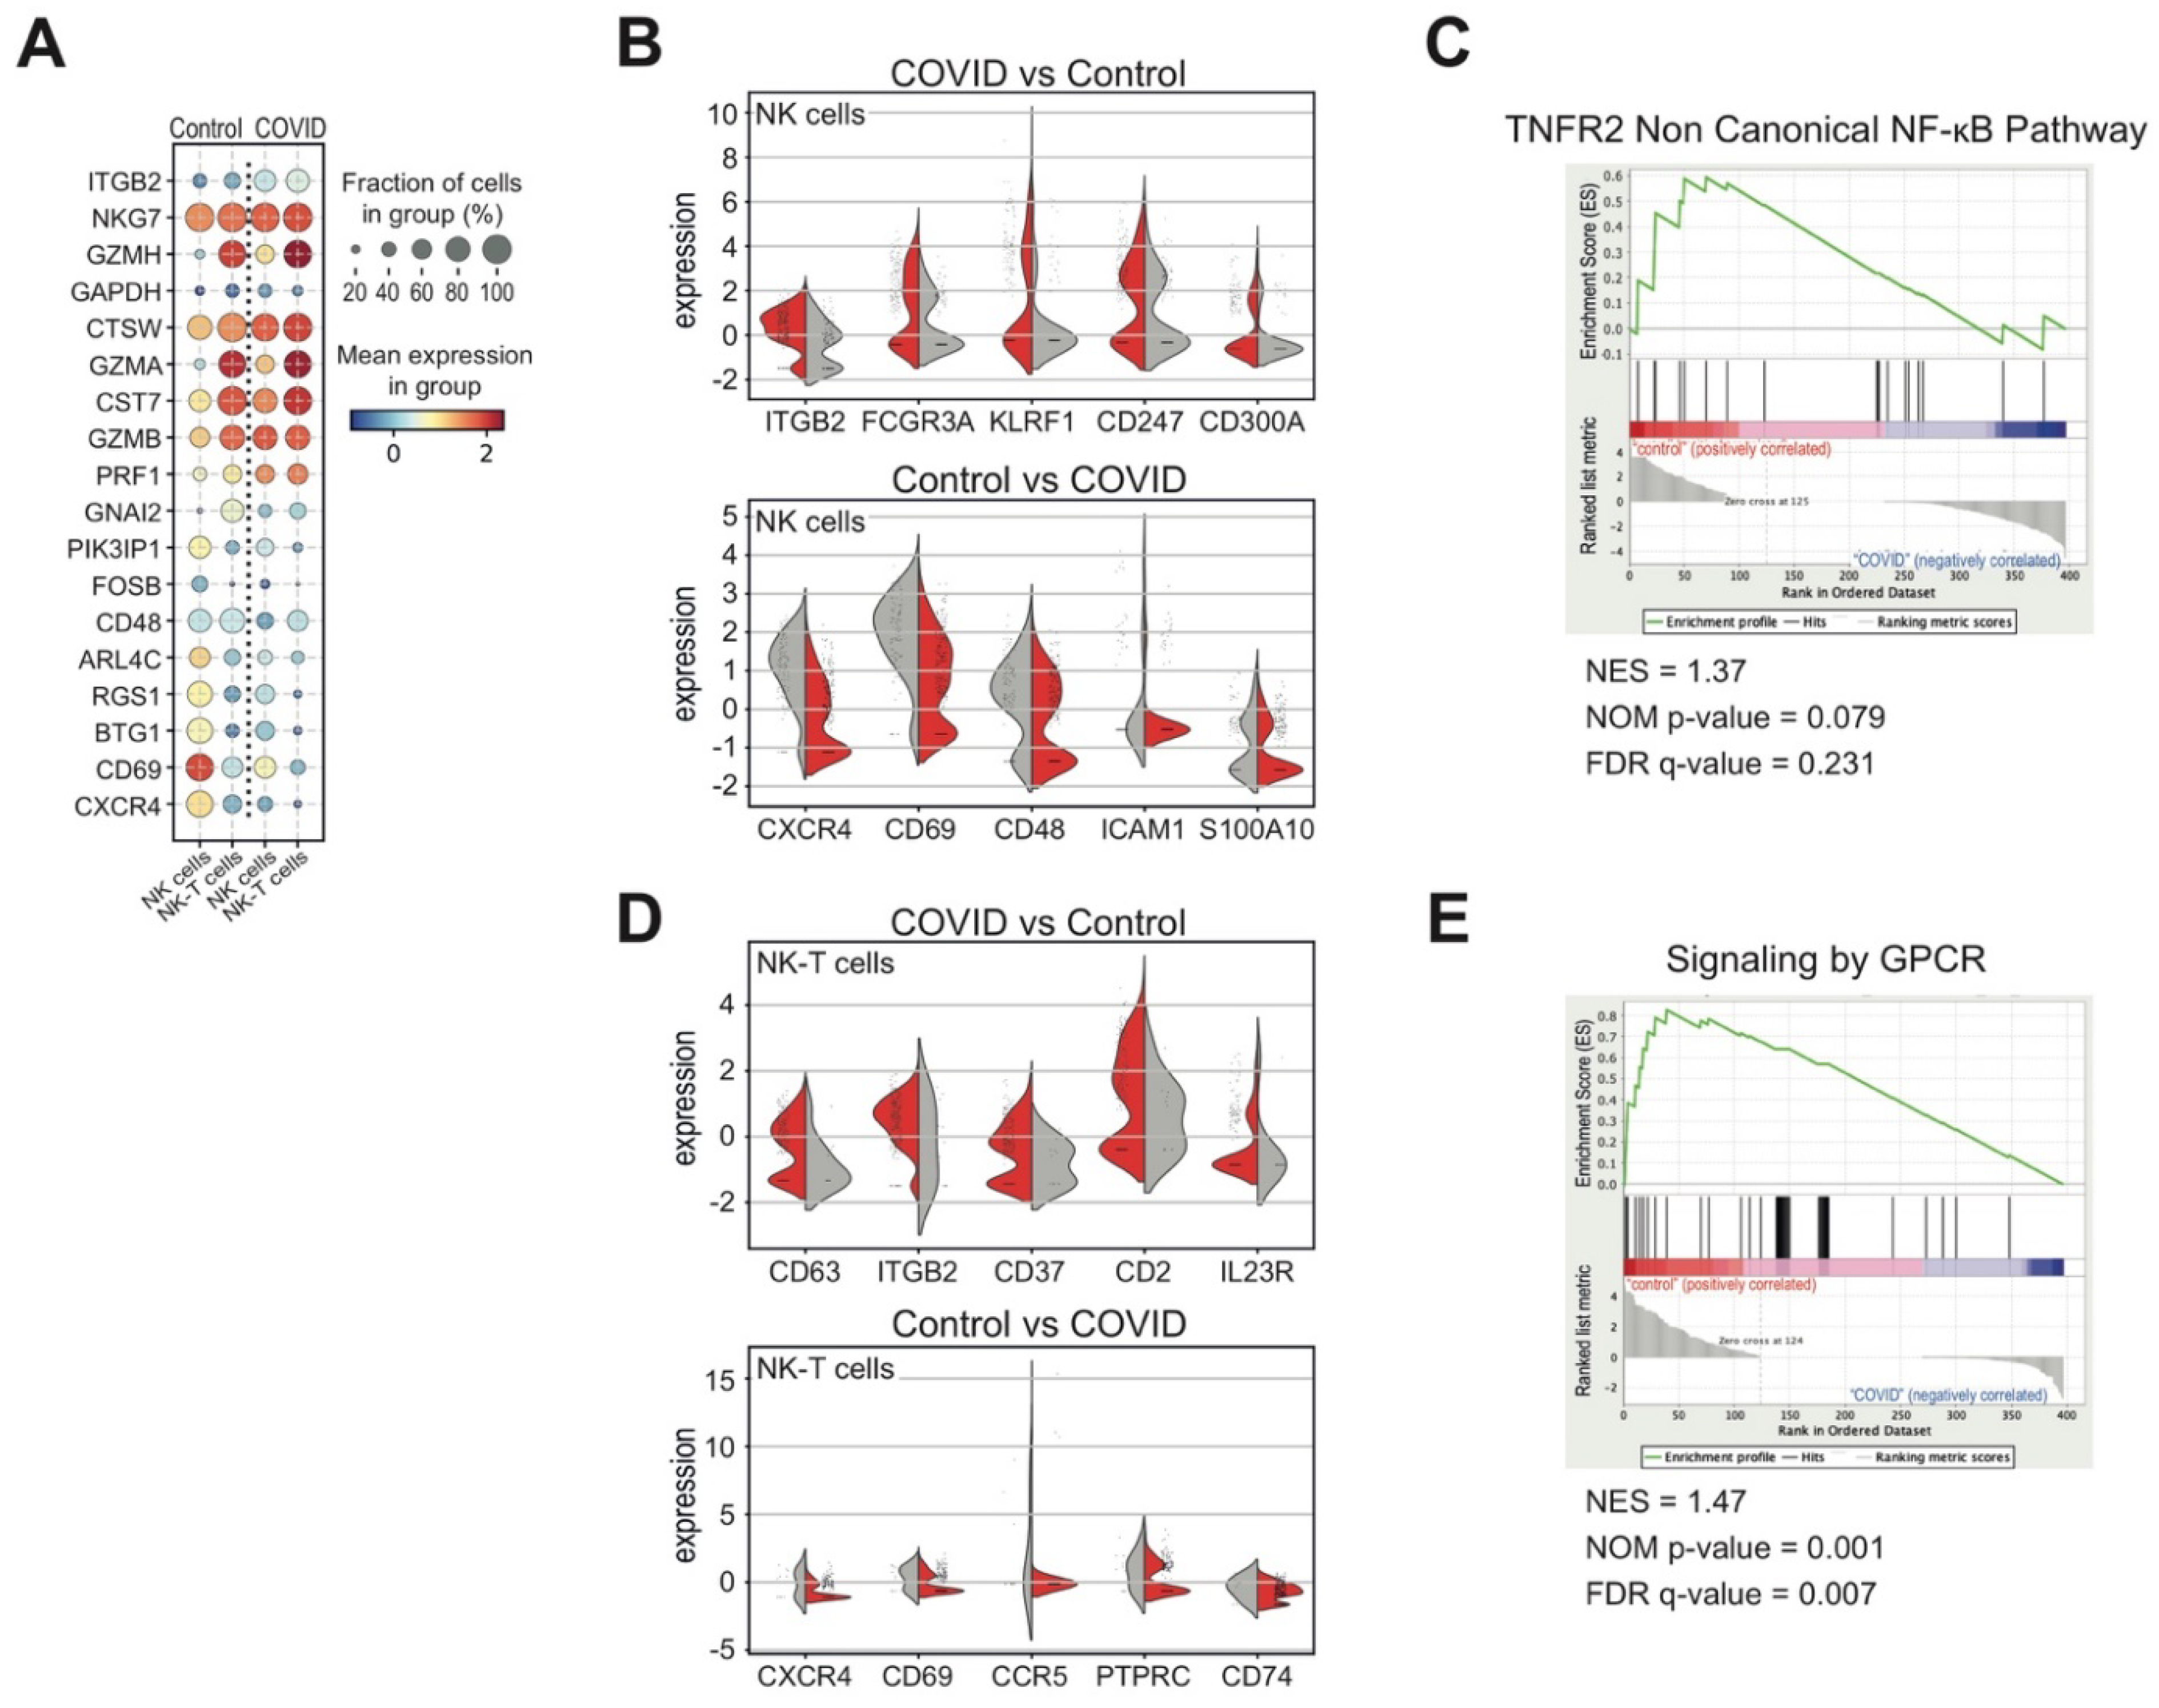
3.3. Heterogeneous T and NK Cell Subsets in COVID-19 Patients
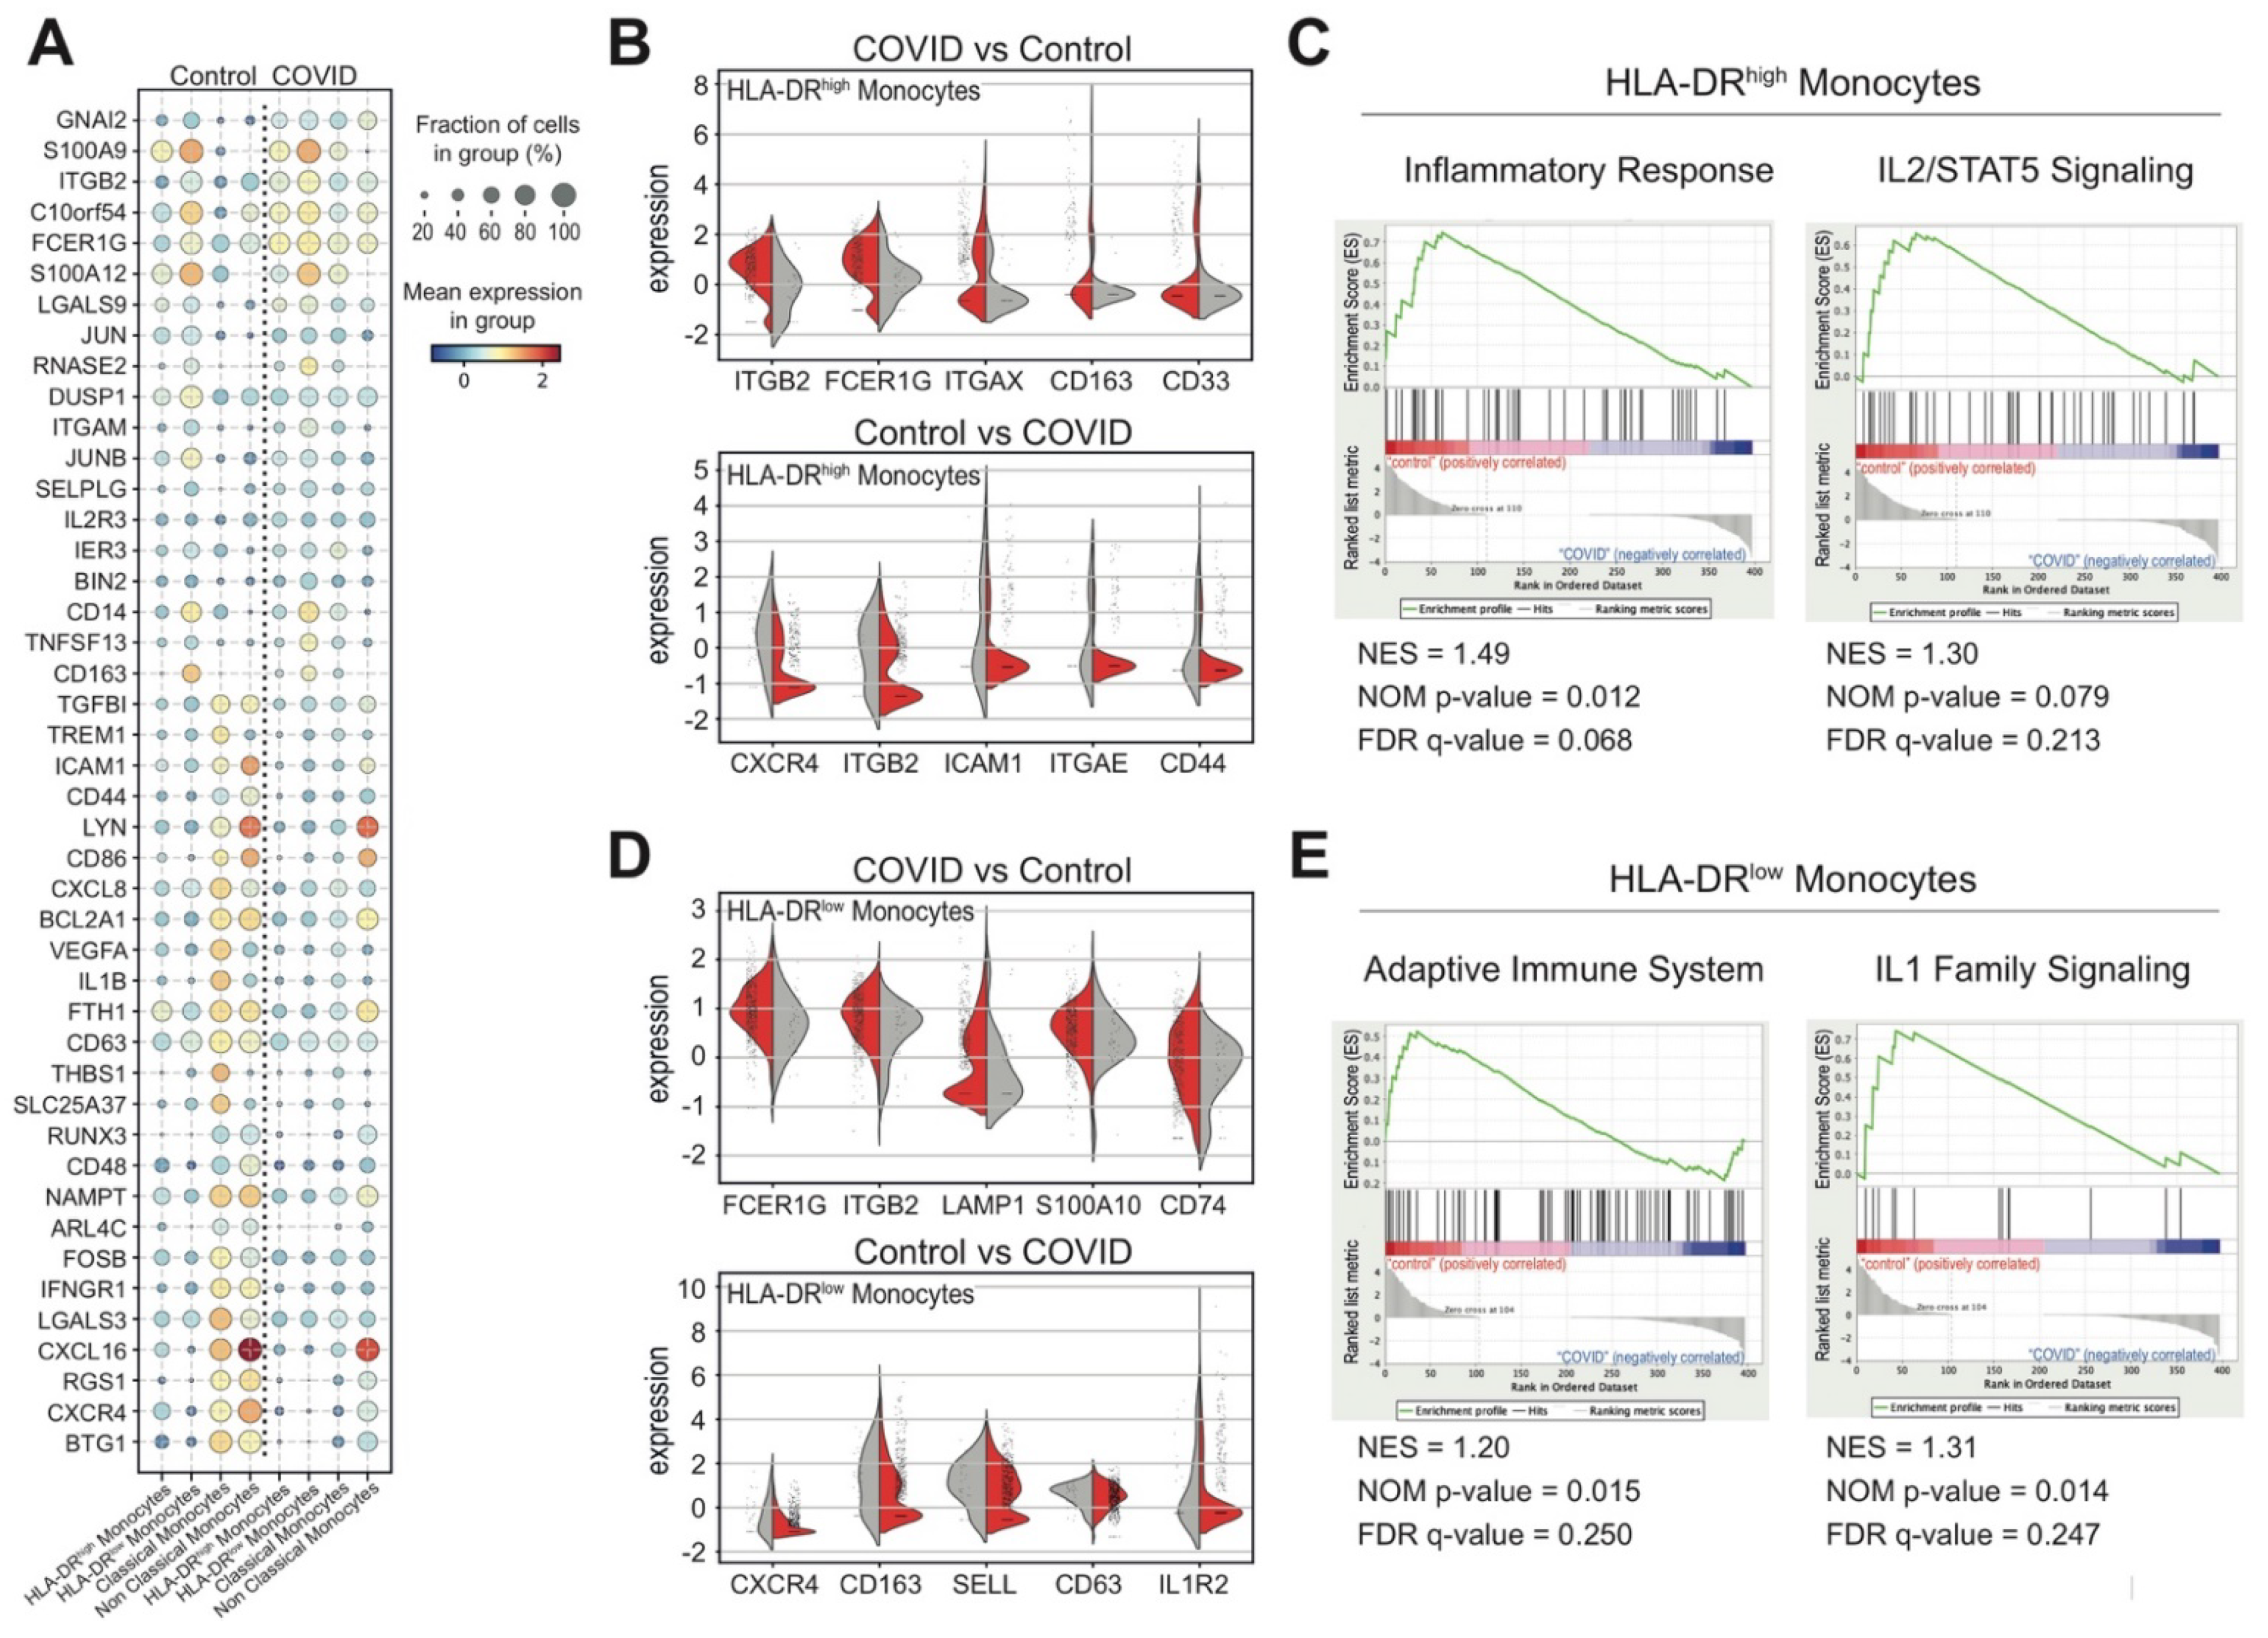
3.4. Monocytes and Their States in COVID-19 Patients
4. Discussion
Supplementary Materials
Author Contributions
Funding
Institutional Review Board Statement
Informed Consent Statement
Data Availability Statement
Acknowledgments
Conflicts of Interest
References
- Hu, B.; Guo, H.; Zhou, P.; Shi, Z.-L. Characteristics of SARS-CoV-2 and COVID-19. Nat. Rev. Microbiol. 2021, 19, 141–154. [Google Scholar] [CrossRef] [PubMed]
- Lee, I.T.; Nakayama, T.; Wu, C.-T.; Goltsev, Y.; Jiang, S.; Gall, P.A.; Liao, C.-K.; Shih, L.-C.; Schürch, C.M.; McIlwain, D.R.; et al. ACE2 localizes to the respiratory cilia and is not increased by ACE inhibitors or ARBs. Nat. Commun. 2020, 11, 1–14. [Google Scholar] [CrossRef] [PubMed]
- Ou, X.; Liu, Y.; Lei, X.; Li, P.; Mi, D.; Ren, L.; Guo, L.; Guo, R.; Chen, T.; Hu, J.; et al. Characterization of spike glycoprotein of SARS-CoV-2 on virus entry and its immune cross-reactivity with SARS-CoV. Nat. Commun. 2020, 11, 1620. [Google Scholar] [CrossRef] [PubMed] [Green Version]
- Shereen, M.A.; Khan, S.; Kazmi, A.; Bashir, N.; Siddique, R. COVID-19 infection: Emergence, transmission, and characteristics of human coronaviruses. J. Adv. Res. 2020, 24, 91–98. [Google Scholar] [CrossRef]
- Yap, J.K.Y.; Moriyama, M.; Iwasaki, A. Inflammasomes and Pyroptosis as Therapeutic Targets for COVID-19. J. Immunol. 2020, 205, 307–312. [Google Scholar] [CrossRef] [PubMed]
- Aleem, A.; Slenker, A.K. Monoclonal Antibody Therapy for High-Risk Coronavirus (COVID 19) Patients with Mild to Moderate Disease Presentations; StatPearls: Treasure Island, FL, USA, 2021.
- Ricci, D.; Etna, M.; Rizzo, F.; Sandini, S.; Severa, M.; Coccia, E. Innate Immune Response to SARS-CoV-2 Infection: From Cells to Soluble Mediators. Int. J. Mol. Sci. 2021, 22, 7017. [Google Scholar] [CrossRef]
- Huang, C.; Wang, Y.; Li, X.; Ren, L.; Zhao, J.; Hu, Y.; Zhang, L.; Fan, G.; Xu, J.; Gu, X.; et al. Clinical features of patients infected with 2019 novel coronavirus in Wuhan, China. Lancet 2020, 395, 497–506. [Google Scholar] [CrossRef] [Green Version]
- Sette, A.; Crotty, S. Adaptive immunity to SARS-CoV-2 and COVID-19. Cell 2021, 184, 861–880. [Google Scholar] [CrossRef]
- Pan, Y.; Jiang, X.; Yang, L.; Chen, L.; Zeng, X.; Liu, G.; Tang, Y.; Qian, C.; Wang, X.; Cheng, F.; et al. SARS-CoV-2-specific immune response in COVID-19 convalescent individuals. Signal Transduct. Target. Ther. 2021, 6, 1–10. [Google Scholar] [CrossRef]
- Tay, M.Z.; Poh, C.M.; Rénia, L.; Macary, P.A.; Ng, L.F.P. The trinity of COVID-19: Immunity, inflammation and intervention. Nat. Rev. Immunol. 2020, 20, 363–374. [Google Scholar] [CrossRef]
- Wu, Z.; McGoogan, J.M. Characteristics of and Important Lessons From the Coronavirus Disease 2019 (COVID-19) Outbreak in China: Summary of a Report of 72 314 Cases From the Chinese Center for Disease Control and Prevention. JAMA 2020, 323, 1239–1242. [Google Scholar] [CrossRef] [PubMed]
- Shibabaw, T.; Molla, M.D.; Teferi, B.; Ayelign, B. Role of IFN and Complements System: Innate Immunity in SARS-CoV-2. J. Inflamm. Res. 2020, ume 13, 507–518. [Google Scholar] [CrossRef]
- Kaklamanos, A.; Belogiannis, K.; Skendros, P.; Gorgoulis, V.G.; Vlachoyiannopoulos, P.G.; Tzioufas, A.G. COVID-19 Immunobiology: Lessons Learned, New Questions Arise. Front. Immunol. 2021, 12. [Google Scholar] [CrossRef] [PubMed]
- Xiao, F.; Tang, M.; Zheng, X.; Liu, Y.; Li, X.; Shan, H. Evidence for Gastrointestinal Infection of SARS-CoV-2. Gastroenterology 2020, 158, 1831–1833.e3. [Google Scholar] [CrossRef] [PubMed]
- Helms, J.; Tacquard, C.; Severac, F.; Leonard-Lorant, I.; Ohana, M.; Delabranche, X.; Merdji, H.; Clere-Jehl, R.; Schenck, M.; Gandet, F.F.; et al. High risk of thrombosis in patients with severe SARS-CoV-2 infection: A multicenter prospective cohort study. Intensive Care Med. 2020, 46, 1089–1098. [Google Scholar] [CrossRef] [PubMed]
- Von Weyhern, C.H.; Kaufmann, I.; Neff, F.; Kremer, M. Early evidence of pronounced brain involvement in fatal COVID-19 outcomes. Lancet 2020, 395, e109. [Google Scholar] [CrossRef]
- Xu, Z.; Shi, L.; Wang, Y.; Zhang, J.; Huang, L.; Zhang, C.; Liu, S.; Zhao, P.; Liu, H.; Zhu, L.; et al. Pathological findings of COVID-19 associated with acute respiratory distress syndrome. Lancet Respir. Med. 2020, 8, 420–422. [Google Scholar] [CrossRef]
- Schulte-Schrepping, J.; Reusch, N.; Paclik, D.; Baßler, K.; Schlickeiser, S.; Zhang, B.; Krämer, B.; Krammer, T.; Brumhard, S.; Bonaguro, L.; et al. Severe COVID-19 Is Marked by a Dysregulated Myeloid Cell Compartment. Cell 2020, 182, 1419–1440.e23. [Google Scholar] [CrossRef]
- Wen, W.; Su, W.; Tang, H.; Le, W.; Zhang, X.; Zheng, Y.; Liu, X.; Xie, L.; Li, J.; Ye, J.; et al. Immune cell profiling of COVID-19 patients in the recovery stage by single-cell sequencing. Cell Discov. 2020, 6, 1–18. [Google Scholar] [CrossRef]
- Wilk, A.J.; Rustagi, A.; Zhao, N.Q.; Roque, J.; Martínez-Colón, G.J.; McKechnie, J.L.; Ivison, G.T.; Ranganath, T.; Vergara, R.; Hollis, T.; et al. A single-cell atlas of the peripheral immune response in patients with severe COVID-19. Nat. Med. 2020, 26, 1070–1076. [Google Scholar] [CrossRef]
- Marshall, J.C.; Murthy, S.; Diaz, J.; Adhikari, N.K.; Angus, D.C.; Arabi, Y.M.; Baillie, K.; Bauer, M.; Berry, S.; Blackwood, B.; et al. A minimal common outcome measure set for COVID-19 clinical research. Lancet Infect. Dis. 2020, 20, e192–e197. [Google Scholar] [CrossRef]
- Levine, J.H.; Simonds, E.F.; Bendall, S.C.; Davis, K.L.; Amir, E.-A.D.; Tadmor, M.D.; Litvin, O.; Fienberg, H.G.; Jager, A.; Zunder, E.R.; et al. Data-Driven Phenotypic Dissection of AML Reveals Progenitor-like Cells that Correlate with Prognosis. Cell 2015, 162, 184–197. [Google Scholar] [CrossRef] [PubMed] [Green Version]
- Wolf, F.A.; Angerer, P.; Theis, F.J. SCANPY: Large-scale single-cell gene expression data analysis. Genome Biol. 2018, 19, 1–5. [Google Scholar] [CrossRef] [Green Version]
- Slovin, S.; Carissimo, A.; Panariello, F.; Grimaldi, A.; Bouché, V.; Gambardella, G.; Cacchiarelli, D. Single-Cell RNA Sequencing Analysis: A Step-by-Step Overview. Springer Protocols Handbooks 2021, 2284, 343–365. [Google Scholar] [CrossRef]
- Haghverdi, L.; Lun, A.T.L.; Morgan, M.D.; Marioni, J.C. Batch effects in single-cell RNA-sequencing data are corrected by matching mutual nearest neighbors. Nat. Biotechnol. 2018, 36, 421–427. [Google Scholar] [CrossRef]
- Giambra, V.; Gusscott, S.; Gracias, D.; Song, R.; Lam, S.H.; Panelli, P.; Tyshchenko, K.; Jenkins, C.E.; Hoofd, C.; Lorzadeh, A.; et al. Epigenetic Restoration of Fetal-like IGF1 Signaling Inhibits Leukemia Stem Cell Activity. Cell Stem Cell 2018, 23, 714–726.e7. [Google Scholar] [CrossRef] [Green Version]
- Van der Maaten, L.; Hinton, G. Visualizing data using t-SNE. J. Mach. Learn. Res. 2008, 9, 2579–2605. [Google Scholar]
- Xia, X.; Wen, M.; Zhan, S.; He, J.; Chen, W. An increased neutrophil/lymphocyte ratio is an early warning signal of severe COVID-19. J. South. Med. Univ. 2020, 40, 333–336. [Google Scholar]
- Chen, R.; Lan, Z.; Ye, J.; Pang, L.; Liu, Y.; Wu, W.; Qin, X.; Guo, Y.; Zhang, P. Cytokine Storm: The Primary Determinant for the Pathophysiological Evolution of COVID-19 Deterioration. Front. Immunol. 2021, 12, 589095. [Google Scholar] [CrossRef]
- Rabaan, A.; Al-Ahmed, S.; Muhammad, J.; Khan, A.; Sule, A.; Tirupathi, R.; Mutair, A.; Alhumaid, S.; Al-Omari, A.; Dhawan, M.; et al. Role of Inflammatory Cytokines in COVID-19 Patients: A Review on Molecular Mechanisms, Immune Functions, Immunopathology and Immunomodulatory Drugs to Counter Cytokine Storm. Vaccines 2021, 9, 436. [Google Scholar] [CrossRef]
- Franzén, O.; Gan, L.-M.; Björkegren, J.L.M. PanglaoDB: A web server for exploration of mouse and human single-cell RNA sequencing data. Database 2019, 2019. [Google Scholar] [CrossRef] [Green Version]
- Lederer, K.; Castaño, D.; Atria, D.G.; Oguin, T.H.; Wang, S.; Manzoni, T.B.; Muramatsu, H.; Hogan, M.J.; Amanat, F.; Cherubin, P.; et al. SARS-CoV-2 mRNA Vaccines Foster Potent Antigen-Specific Germinal Center Responses Associated with Neutralizing Antibody Generation. Immunity 2020, 53, 1281–1295.e5. [Google Scholar] [CrossRef] [PubMed]
- Rajamanickam, A.; Kumar, N.P.; Nancy, P.A.; Selvaraj, N.; Munisankar, S.; Renji, R.M.; Vijayalakshmi, V.; Murhekar, M.; Thangaraj, J.W.V.; Kumar, M.S.; et al. Recovery of Memory B-cell Subsets and Persistence of Antibodies in Convalescent COVID-19 Patients. Am. J. Trop. Med. Hyg. 2021, 105, 1255–1260. [Google Scholar] [CrossRef]
- Liu, B.; Han, J.; Cheng, X.; Yu, L.; Zhang, L.; Wang, W.; Ni, L.; Wei, C.; Huang, Y.; Cheng, Z. Reduced numbers of T cells and B cells correlates with persistent SARS-CoV-2 presence in non-severe COVID-19 patients. Sci. Rep. 2020, 10, 1–9. [Google Scholar] [CrossRef]
- Zhao, J.; Zhao, J.; Mangalam, A.K.; Channappanavar, R.; Fett, C.; Meyerholz, D.K.; Agnihothram, S.; Baric, R.S.; David, C.S.; Perlman, S. Airway Memory CD4 + T Cells Mediate Protective Immunity against Emerging Respiratory Coronaviruses. Immunity 2016, 44, 1379–1391. [Google Scholar] [CrossRef] [PubMed] [Green Version]
- Shaim, H.; Estrov, Z.; Harris, D.; Sanabria, M.H.; Liu, Z.; Ruvolo, P.; Thompson, P.A.; Ferrajoli, A.; Daher, M.; Burger, J.; et al. The CXCR4–STAT3–IL-10 Pathway Controls the Immunoregulatory Function of Chronic Lymphocytic Leukemia and Is Modulated by Lenalidomide. Front. Immunol. 2018, 8, 1773. [Google Scholar] [CrossRef] [PubMed]
- Jin, J.; Hu, H.; Li, H.S.; Yu, J.; Xiao, Y.; Brittain, G.C.; Zou, Q.; Cheng, X.; Mallette, F.A.; Watowich, S.S.; et al. Noncanonical NF-κB Pathway Controls the Production of Type I Interferons in Antiviral Innate Immunity. Immunity 2014, 40, 342–354. [Google Scholar] [CrossRef] [PubMed] [Green Version]
- Almishri, W.; Santodomingo-Garzon, T.; Le, T.; Stack, D.; Mody, C.H.; Swain, M.G. TNFα Augments Cytokine-Induced NK Cell IFNγ Production through TNFR2. J. Innate Immun. 2016, 8, 617–629. [Google Scholar] [CrossRef] [PubMed]
- Walzer, T.; Vivier, E. G-protein-coupled receptors in control of natural killer cell migration. Trends Immunol. 2011, 32, 486–492. [Google Scholar] [CrossRef]
- Takashima, Y.; Hamano, M.; Fukai, J.; Iwadate, Y.; Kajiwara, K.; Kobayashi, T.; Hondoh, H.; Yamanaka, R. GSEA-assisted gene signatures valid for combinations of prognostic markers in PCNSL. Sci. Rep. 2020, 10, 8435. [Google Scholar] [CrossRef]
- Damian, D.; Gorfine, M. Statistical concerns about the GSEA procedure. Nat. Genet. 2004, 36, 663. [Google Scholar] [CrossRef]
- Good, B.M.; Van Auken, K.; Hill, D.P.; Mi, H.; Carbon, S.; Balhoff, J.P.; Albou, L.-P.; Thomas, P.D.; Mungall, C.J.; A Blake, J.; et al. Reactome and the Gene Ontology: Digital convergence of data resources. Bioinformatics 2021, 37, 3343–3348. [Google Scholar] [CrossRef] [PubMed]
- Joshi-Tope, G. Reactome: A knowledgebase of biological pathways. Nucleic Acids Res. 2004, 33, D428–D432. [Google Scholar] [CrossRef] [PubMed] [Green Version]
- Espinoza-Delgado, I.; Bosco, M.C.; Musso, T.; Gusella, G.L.; Longo, D.L.; Varesio, L. Interleukin-2 and human monocyte activation. J. Leukoc. Biol. 1995, 57, 13–19. [Google Scholar] [CrossRef] [Green Version]
- Fields, J.; Günther, S.; Sundberg, E.J. Structural Basis of IL-1 Family Cytokine Signaling. Front. Immunol. 2019, 10, 1412. [Google Scholar] [CrossRef] [PubMed] [Green Version]
- Giamarellos-Bourboulis, E.J.; Netea, M.G.; Rovina, N.; Akinosoglou, K.; Antoniadou, A.; Antonakos, N.; Damoraki, G.; Gkavogianni, T.; Adami, M.-E.; Katsaounou, P.; et al. Complex Immune Dysregulation in COVID-19 Patients with Severe Respiratory Failure. Cell Host Microbe 2020, 27, 992–1000.e3. [Google Scholar] [CrossRef]
- Colucci, M.; De Santis, E.; Totti, B.; Miroballo, M.; Tamiro, F.; Rossi, G.; Piepoli, A.; De Vincentis, G.; Greco, A.; Mangia, A.; et al. Associations between Allelic Variants of the Human IgH 3′ Regulatory Region 1 and the Immune Response to BNT162b2 mRNA Vaccine. Vaccines 2021, 9, 1207. [Google Scholar] [CrossRef]
- Leadbetter, E.A.; Brigl, M.; Illarionov, P.; Cohen, N.; Luteran, M.C.; Pillai, S.; Besra, G.S.; Brenner, M.B. NK T cells provide lipid antigen-specific cognate help for B cells. Proc. Natl. Acad. Sci. USA 2008, 105, 8339–8344. [Google Scholar] [CrossRef] [Green Version]
- Miyasaka, T.; Aoyagi, T.; Uchiyama, B.; Oishi, K.; Nakayama, T.; Kinjo, Y.; Miyazaki, Y.; Kunishima, H.; Hirakata, Y.; Kaku, M.; et al. A possible relationship of natural killer T cells with humoral immune response to 23-valent pneumococcal polysaccharide vaccine in clinical settings. Vaccine 2012, 30, 3304–3310. [Google Scholar] [CrossRef]
- Bianchi, M.E.; Mezzapelle, R. The Chemokine Receptor CXCR4 in Cell Proliferation and Tissue Regeneration. Front. Immunol. 2020, 11, 2109. [Google Scholar] [CrossRef]
- Lourda, M.; Dzidic, M.; Hertwig, L.; Bergsten, H.; Medina, L.M.P.; Sinha, I.; Kvedaraite, E.; Chen, P.; Muvva, J.R.; Gorin, J.-B.; et al. High-dimensional profiling reveals phenotypic heterogeneity and disease-specific alterations of granulocytes in COVID-19. Proc. Natl. Acad. Sci. USA 2021, 118. [Google Scholar] [CrossRef] [PubMed]
- Silvin, A.; Chapuis, N.; Dunsmore, G.; Goubet, A.-G.; Dubuisson, A.; Derosa, L.; Almire, C.; Hénon, C.; Kosmider, O.; Droin, N.; et al. Elevated Calprotectin and Abnormal Myeloid Cell Subsets Discriminate Severe from Mild COVID-19. Cell 2020, 182, 1401–1418.e18. [Google Scholar] [CrossRef] [PubMed]
- Sodeifian, F.; Nikfarjam, M.; Kian, N.; Mohamed, K.; Rezaei, N. The role of type I interferon in the treatment of COVID-19. J. Med. Virol. 2021, 94, 63–81. [Google Scholar] [CrossRef] [PubMed]


Publisher’s Note: MDPI stays neutral with regard to jurisdictional claims in published maps and institutional affiliations. |
© 2021 by the authors. Licensee MDPI, Basel, Switzerland. This article is an open access article distributed under the terms and conditions of the Creative Commons Attribution (CC BY) license (https://creativecommons.org/licenses/by/4.0/).
Share and Cite
Sansico, F.; Miroballo, M.; Bianco, D.S.; Tamiro, F.; Colucci, M.; Santis, E.D.; Rossi, G.; Rosati, J.; Di Mauro, L.; Miscio, G.; et al. COVID-19 Specific Immune Markers Revealed by Single Cell Phenotypic Profiling. Biomedicines 2021, 9, 1794. https://doi.org/10.3390/biomedicines9121794
Sansico F, Miroballo M, Bianco DS, Tamiro F, Colucci M, Santis ED, Rossi G, Rosati J, Di Mauro L, Miscio G, et al. COVID-19 Specific Immune Markers Revealed by Single Cell Phenotypic Profiling. Biomedicines. 2021; 9(12):1794. https://doi.org/10.3390/biomedicines9121794
Chicago/Turabian StyleSansico, Francesca, Mattia Miroballo, Daniele Salvatore Bianco, Francesco Tamiro, Mattia Colucci, Elisabetta De Santis, Giovanni Rossi, Jessica Rosati, Lazzaro Di Mauro, Giuseppe Miscio, and et al. 2021. "COVID-19 Specific Immune Markers Revealed by Single Cell Phenotypic Profiling" Biomedicines 9, no. 12: 1794. https://doi.org/10.3390/biomedicines9121794