


Abstract
Coronavirus disease 2019 (COVID-19) is a syndrome that has been associated with multiple cardiac complications including myopericarditis. The pathophysiology and treatment for myopericarditis in the setting of COVID-19 infection is still under investigation.
We present a case of a 60-year-old male admitted for dyspnoea due to COVID-19. He developed new ST-segment elevation, elevated cardiac enzymes, severe left ventricular dysfunction, and high inflammatory markers in the setting of haemodynamic and respiratory collapse from the viral illness. He was diagnosed with COVID-19-induced myopericarditis. He showed rapid clinical improvement with a rapid wean off pressure support, resolution of electrocardiogram (ECG) findings, and recovery of left ventricular systolic function following treatment with intravenous immunoglobulin (IVIG) and methylprednisolone.
COVID-19’s complex and devastating complications continue to create new challenges for clinicians. Cardiac complications, specifically, have been shown to be a signal for worse prognosis in these patients. IVIG and steroids can inhibit the inflammatory cascade and decrease myocardial injury, with implications in treatment of severe myopericarditis.
COVID-19-associated myocarditis can be an indirect complication secondary to an inflammatory cascade.
Recognition of the potential role of immunomodulation in rapid improvement of cardiac function and stabilization of haemodynamics in COVID-19 myocardial injury.
Introduction
COVID-19 infection caused by severe acute respiratory syndrome coronavirus 2 (SARS-CoV-2) is known to incite an inflammatory response impacting multiple organ systems, including cardiac injury, which manifests as elevated cardiac biomarkers with electrodardiographic (ECG) or echocardiographic abnormalities.1
Myopericarditis is the clinical and pathological definition for concurrent pericardial and myocardial inflammation, mainly from cardiotropic viruses. Myocardial involvement can be varied, from focal to diffuse involvement of one or all four chambers, depending on the severity of illness.2
Timeline
| Timeline | Description |
|---|---|
| Day 0 | Patient admitted with acute hypoxic respiratory failure due to COVID-19. |
| Day 0: 4 h after admission | Patient intubated for worsening respiratory failure. ECG showed diffuse ST elevation, with evidence of acute inflammation and cardiac injury. |
| Day 1 | Patient was started on IVIG and high-dose steroid therapy. TTE showed severe segmental LV dysfunction. |
| Day 2 | Patient was weaned off pressor support with resolving shock. |
| Day 2–5 | Laboratory values show improvement in inflammatory markers and cardiac biomarkers, and recovering organ dysfunction. |
| Day 6 | Repeat TTE shows recovery of LV systolic function. |
| Day 13 | Repeat ECG demonstrates resolution of ST segment abnormalities. |
| Day 17 | Patient extubated to non-invasive ventilation support. |
| Day 20 | Patient was reintubated and required tracheostomy for persistent respiratory failure due to aspiration. |
| Day 35 | Full TTE confirms continued LV recovery. |
| Day 38 | Tracheostomy was successfully decannulated. |
| Day 52 | Patient was discharged from hospital to physical rehabilitation. |
Case presentation
A 60-year-old male with past medical history of hypertension and hyperlipidaemia presented to the emergency department with 8 days of fevers, cough, and worsening dyspnoea, with mild abdominal pain and diarrhoea despite completing a 3-day course of azithromycin as an outpatient. He denied chest pain, nausea, or vomiting. The patient was afebrile with maximum temperature of 37.4°C, heart rate at 96 b.p.m., and peripheral oxygen saturation (SpO2) of 87%. The physical exam demonstrated clear lungs and tachypnoea.
The nasopharyngeal swab was positive for SARS-CoV-2 by reverse transcription–polymerase chain reaction (RT–PCR), and the chest radiograph showed severe bilateral opacities (Figure 1). Admission labs were significant for lymphocytopenia, elevated inflammatory markers, and liver dysfunction. Initial high-sensitivity troponin, creatine kinase, and creatine kinase-MB (CK-MB) were also elevated (Table 1).
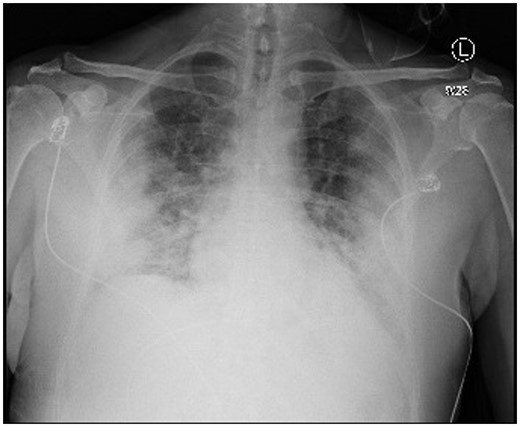
Chest radiograph with bilateral pulmonary infiltrates.
Lab values on admission
| Lab (units) | Reference range | Absolute value |
|---|---|---|
| White blood cell count (×103) | 3.8–10.5 | 17.9 |
| Absolute neutrophil count (×103) | 1.8–7.4 | 16.5 |
| Absolute lymphocyte count (×103) | 1.0–3.3 | 1.1 |
| Haemoglobin (g/dL) | 11.5–15.5 | 14.6 |
| Mean corpuscular volume (fL) | 80.0–100.0 | 88.7 |
| Platelet count (×103/μL) | 150–400 | 282 |
| Sodium (mmol/L) | 135–145 | 138 |
| Potassium (mmol/L) | 3.5–5.3 | 6 |
| Chloride (mmol/L) | 98–107 | 100 |
| Carbon dioxide – serum (mmol/L) | 22–31 | 25 |
| Blood urea nitrogen (mg/dL) | 7–23 | 17 |
| Creatinine (mg/dL) | 0.5–1.3 | 0.96 |
| Glucose – serum (mg/dL) | 70–99 | 277 |
| Calcium (mg/dL) | 8.4–10.5 | 9.3 |
| Protein total – serum (g/dL) | 6.0–8.3 | 7.8 |
| Albumin (g/dL) | 3.3–5.0 | 3.4 |
| Total bilirubin (mg/dL) | 0.2–1.2 | 0.7 |
| Alkaline phosphatase (μ/L) | 40–120 | 137 |
| Aspartate aminotransferase (μ/L) | 4–32 | 134 |
| Alanine aminotransferase (μ/L) | 4–33 | 137 |
| pH – arterial | 7.32–7.43 | 7.09 |
| Lactate (arterial) (mmol/L) | 0.5–2.0 | 1.4 |
| pCO2 (mmHg) | 41–51 | 101 |
| C-reactive protein (mg/dL) | <0.40 | 29.35 |
| Ferritin (ng/mL) | 15–150 | 6379 |
| Lactate dehydrogenase (U/L) | 135–225 | 588 |
| Procalcitonin (ng/mL) | 0.02–0.10 | 0.36 |
| D-dimer (ng/mL) | <230 | 458 |
| High-sensitivity troponin (ng/L) | <6 – 14 | 582 |
| Creatine kinase, serum (U/L) | 30–200 | 279 |
| Creatine kinase-MB (ng/mL) | 0–6.7 | 28.2 |
| Serum pro-brain natriuretic peptide (pg/mL)a | 0–300 | 15642 |
Measured on hospital day 3.
The patient was initially placed on a non-rebreather mask with supplemental oxygen via nasal cannula and placed in the prone position, but SpO2 remained at 82%. He was quickly intubated for acute hypoxaemic respiratory failure and started on hydroxychloroquine therapy for severe COVID-19 infection.
ECG obtained after admission demonstrated diffuse new ST-segment elevation, with QTc interval measured at 437 ms (Figure 2A). Transthoracic echocardiogram (TTE) was significant for severe segmental left ventricular (LV) systolic dysfunction, ejection fraction (EF) 15–20% with hypokinesis of the apex, distal anterior septum, and anterior and lateral walls, with a small pericardial effusion. Right ventricular size and function were normal (Figure 3; Supplementary material online, Videos 1 and 2).
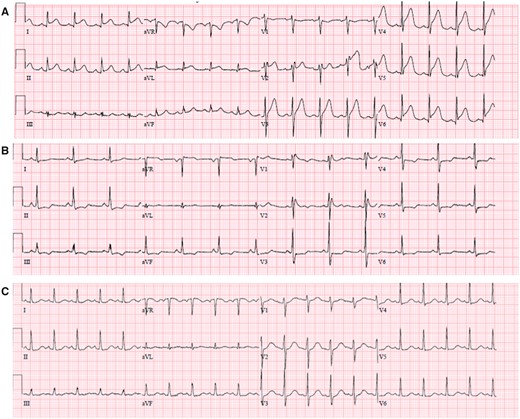
(A) ECG on day 1 shows diffuse ST elevation and PR depression in precordial and limb leads, reciprocal ST depression, and PR elevation in aVR. (B) Day 6 shows incomplete right bundle branch block and horizontal ST depression in precordial and limb leads. (C) Day 13 shows sinus tachycardia without ST or T wave abnormalities.
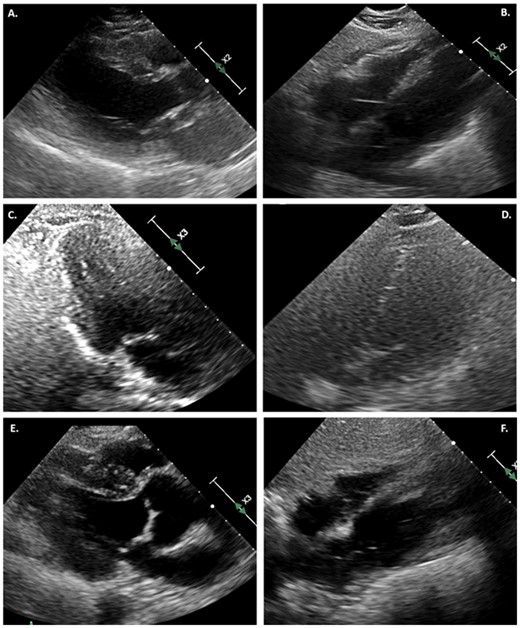
(A) TTE in parasternal long-axis view at end systole, demonstrating severe LV systolic dysfunction. (B) Subcostal view with small pericardial effusion. (C) Repeat echocardiogram on day 6 in three-chamber view at end systole, demonstrating normal LV function. (D) Resolution of pericardial effusion on hospital day 6. (E) TTE at day 35, showing continued normal systolic function in the parasternal long-axis view at end systole. (F) No further pericardial effusion on subcostal view.
Based on diffuse ECG changes suggestive of pericarditis, TTE findings, and laboratory evidence of systemic inflammation, the patient was initiated on treatment of fulminant myopericarditis on hospital day 1 with a 4-day regimen of intravenous immunoglobulin (IVIG) 20 g daily and methylprednisolone (50 mg every 6 h).
After the patient was intubated, haemodynamic support with epinephrine was initially started and weaned off 1 day after initiation of high-dose steroids and IVIG. Over the next few days, he remained afebrile with improving haemodynamics. Laboratory values demonstrated recovery of organ perfusion and inflammation (Figure 4).
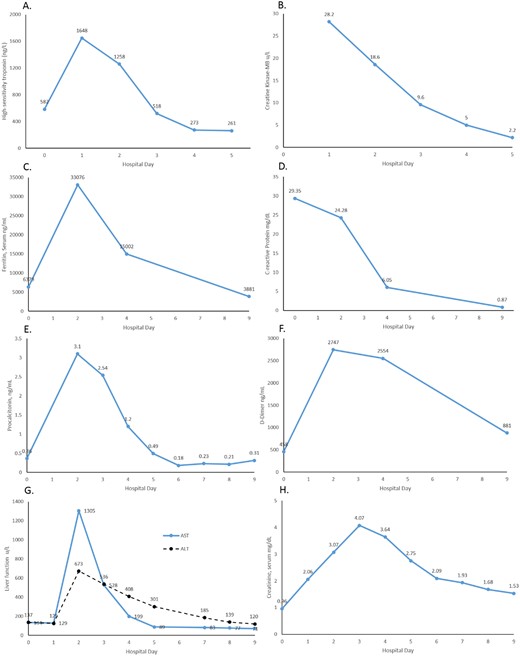
Graphs of laboratory values following steroid and IVIG treatment. Decreasing cardiac biomarker trends through Day 5: (A) high-sensitivity troponin; (B) CK-MB. Decreasing inflammatory markers through Day 9: (C) ferritin; (D) C-reactive protein; (E) procalcitonin; (F) D-dimer. Initial worsening then improvement through Day 9 of (G) hepatic function; (H) renal function.
Follow-up limited TTE on hospital day 6 demonstrated recovery of LV systolic function, confirmed again with full TTE on day 35. Previous areas of regional hypokinesis were no longer appreciated (Figure 3; Supplementary material online, Videos 3 and 4). A repeat ECG on day 6 was noted with transient horizontal ST depressions across precordial and limb leads (Figure 2B), before resolution of all ST–T wave abnormalities on follow-up ECG on day 13 (Figure 2C). He remained off pressor support and was extubated on hospital day 17; however, he required reintubation within 3 days for persistent respiratory failure due to aspiration. A tracheostomy was performed which was successfully decannulated on hospital day 38. The patient was ultimately discharged for physical rehabilitation on hospital day 52.
Discussion
COVID-19 is known to cause elevated cardiac biomarkers, and levels are overall higher in more severe cases of patients infected with SARS-CoV2. Cardiac injury, in turn, is associated with increased mortality.1 ECG changes with a positive troponin that normally would proceed to coronary angiography are now evaluated on a case by case basis, as ST-segment elevation in patients with COVID-19 has a high association with non-obstructive coronary disease. Some of these cases were subsequently diagnosed and managed as myocarditis.3
Our patient’s presentation was most consistent with COVID-19 myocarditis, with concurrent pericarditis diagnosed via diffuse ST-segment elevation on ECG and pericardial effusion. The diagnosis of stress cardiomyopathy and septic cardiomyopathy was entertained; however, our patient did not have the classic regional wall motion abnormalities4 or LV dilation5 typically seen in those cases of cardiac dysfunction, respectively.
Although cases of COVID-19 myocarditis and myopericarditis have been reported in the literature,6–8 the overall prevalence and pathophysiology of this disease manifestation are not well understood. Proposed mechanisms for acute myocardial injury include direct invasion via angiotensin-converting enzyme 2 (ACE2) expressed in the heart, or as a result of an overwhelming cytokine storm.9 The use of immunosuppressive therapies such as IVIG and steroids for other forms of myocarditis has been well studied, with a reported decrease in inflammatory markers and improvement in LVEF.10 In the COVID-19 literature, a case series successfully used IVIG in patients with rapid clinical deterioration and elevated inflammatory markers to suppress the inflammatory cascade.11 Another case report documents a patient with myocarditis who was treated with IVIG and steroids with favourable results.12
Our case uniquely demonstrates rapid reversal of cardiac injury associated with COVID-19 after the patient was started on immunomodulating treatment, and a correlating trend with decreasing inflammatory markers. Taken together, this supports the hypothesis of myocardial injury as a result of cytokine storm. Targeted treatment of inflammation with IVIG and steroids led to simultaneous reduction in inflammatory markers and cardiac enzyme levels, after which there was demonstrated improvement in cardiac function both clinically and by echocardiogram. Targeted anti-inflammatory therapy for myocardial injury in severe COVID-19 infection may improve the high mortality rates usually associated with elevated troponin levels in these patients. Our patient also demonstrated improvement in non-cardiac COVID-19 symptoms after therapy with IVIG, with reduced oxygen requirements following 1 day of treatment. This timeline for clinical improvement is significantly more accelerated than what is usually observed with hydroxychloroquine and steroid treatment alone.13,14
Conclusion
The natural history of cardiac injury related to SARS-CoV2 infection is not well understood, and usual diagnostic tools such as TTE, advanced imaging, and angiography are often limited in use to decrease the spread of infection exposure. In patients with increasing cardiac biomarkers, evidence of systemic inflammation and a low suspicion for acute coronary syndrome, inhibiting the inflammatory cascade may also treat the resulting myocarditis and reverse cardiac injury.
Lead author biography

Angela Li is a second year cardiology fellow at North Shore University/Long Island Jewish Medical Center in New York. She received her undergraduate degree from Johns Hopkins University and her medical degree from Penn State College of Medicine. She completed her Internal Medicine-Pediatrics residency at Rush University Medical Center in Chicago, Illinois. She has a special interest in interventional cardiology, structural heart disease and adult congenital heart disease.
Supplementary material
Supplementary material is available at European Heart Journal – Case Reports online.
Acknowledgements
We would like to acknowledge the contributions of the Northwell Health COVID-19 Research Consortium.
Slide sets: A fully edited slide set detailing this case and suitable for local presentation is available online as Supplementary data.
Consent: The author/s confirm that written consent for submission and publication of this case report including image(s) and associated text has been obtained from the patient in line with COPE guidance.
Conflict of interest: none declared.

Comments