
Impact of the Lockdown during the COVID-19 Pandemic on Electricity Use by Residential Users
by
 ,
,
Sławomir Bielecki
1,* ,
,
Tadeusz Skoczkowski
1,
Lidia Sobczak
2,
Janusz Buchoski
1,
Łukasz Maciąg
3 and
Piotr Dukat
3 1
Faculty of Power and Aeronautical Engineering, Warsaw University of Technology, 21/25 Nowowiejska St. 00–665 Warsaw, Poland
2
Faculty of Management, Warsaw University of Technology, 85 Narbutta St. 02-524 Warsaw, Poland
3
innogy Stoen Operator Sp. z o.o., 46 Piękna St. 00–672 Warsaw, Poland
*
Author to whom correspondence should be addressed.
Energies 2021, 14(4), 980; https://doi.org/10.3390/en14040980
Submission received: 14 January 2021
/
Revised: 4 February 2021
/
Accepted: 10 February 2021
/
Published: 12 February 2021
(This article belongs to the Special Issue COVID-19 Pandemics: Energy, Economic, Environmental, Social, Policy and Health Impacts)
Abstract
:The COVID-19 pandemic and the associated lockdown can be regarded as a forced social experiment, the results of which show how to use energy under specific conditions. During this period, there was a reduction in electricity consumption at the level of the power system, but a different specificity distinguishes the group of household users. The article aims at presenting and analysing the identified issues concerning residential electricity users based on the experience from the COVID-19 pandemic lockdown. Data from energy meters from almost 7000 flats in Warsaw’s housing estates during the lockdown in 2020 and the analogous period before the pandemic were used. The analysis showed that, on average, residential users staying practically the whole day in their flats increased their energy consumption, but without increasing their average daily peak power, smoothing the profile in the morning hours to the level reaching the peak power that had occurred in the analogous period before the lockdown. The peak power of the sections feeding the different numbers of dwellings also remained practically unchanged during the lockdown compared to the pre-pandemic period. The pressure to work and educate remotely should contribute to an increase in the digital competence of society, which may result in an increased interest in new forms of activity and cooperation based on demand-side response and prosumption mechanisms, with digital settlements for energy exchange and services.
1. Introduction
The first stark COVID-19 lockdown was a specific time in terms of meeting life’s needs and the use of specific competencies by household members. The compulsion to stay at home, limiting professional and social activities to one’s place of residence, has caused changes in the load profiles in all groups of energy users.
In articles and reports on COVID-19 pandemic issues in the context of energy and energy use, the problem is usually analysed from a global (e.g., [1,2,3,4]), regional (e.g., [5,6]) or national point of view. The COVID-19 impacts on the power systems and markets in European countries were considered in [7]. Paper [8] compared the impact of different containment measures taken by selected European countries (Spain, Italy, the United Kingdom, Belgium, the Netherlands and Sweden) on their electricity consumption profiles (of the whole country) in response to COVID-19. In [9], a specific model is developed to analyse the impact of COVID-19 on the electricity and petroleum demand in China. The paper [10] investigates the impact of COVID-19 in the Ontario province and the global consequences of the pandemic on the energy sector dynamics. In [11], it was investigated how COVID-19 cases affected Indian energy consumption during the pandemic crisis by testing whether the lockdown had a positive impact on energy consumption, also showing that richer regions were quicker to recover their energy consumption to the level before the lockdown. An analysis of the impact of physical distancing measures during the COVID-19 pandemic regarding mobility on the energy consumption trends for the Brazilian energy system and its subsystems was presented in [12]. A simulation study of the impact of confined measures due to COVID-19 on the energy demand for buildings in a virtual neighbourhood (district) in Sweden was presented in [13]. An Italian case of COVID-19’s impact on electricity consumption and energy prices was examined in [14]. An analysis of the demand profiles in national power systems (Italy, Germany, France, Spain and Poland) during the lockdown in the first half of 2020 was presented in [15].
In [16], the various actions taken by the “Group of Twenty” (G20) countries on electricity consumption after the COVID-19 outbreak was reviewed, and provided energy policy recommendations based on the different governments’ responses and actions addressing energy consumption in buildings. The authors in [17] aimed to investigate the global scenarios of power systems during COVID-19 along with the socio-economic and technical issues faced by the utilities. Paper [18] presents a comprehensive review of COVID-19’s impacts on the electricity sector, embracing demand and supply, power system operation and control, electricity market and regulation. In [19], the policies implemented in several jurisdictions around the world to protect energy consumers during confinement evoked by the pandemic was presented. Recommendations for energy policymakers to navigate the energy transition in different time horizons in respond to COVID-19 crisis was formulated in [20].
An analysis of the impact of COVID-19 fighting measures on energy and environmental footprints can be found in [21]. Considerations of dealing with the politics of sustainable energy transitions are presented in [22] and [23]. The authors of [24], considering the opportunities for sustainability transition research on electricity in the context of the COVID-19 outbreak, remarked that COVID-19 has lowered electricity prices all over Europe but that the impact on demand and supply varies regionally, from a reduction to no effect (in Finland and Sweden’s case) compared to previous years.
In the literature, there are very few cases of the analysis on the impact of the lockdown on the consumption of electricity in specific groups of end-users based on real measurements. This specifically applies to household users, an important group of consumers, who, due to the change of lifestyle, were likely to change their energy demand during this period. A pilot study based on data from 500 households in a Chinese city, evaluating the impact of the COVID-19 pandemic on household energy consumption, is presented in [25]. Other examples of analyses of electricity use during lockdown by home users can also be found in [26] (Australian case) and [27] (Spanish case).
This article analyses energy use in a specific group of users, i.e. households, on the example of dwellings in a large Central European city (Warsaw, Poland), comparing the values obtained from measurements during the lockdown period (called in Poland “national quarantine”, i.e., mobility or activity limitations in the whole community) and the corresponding period of the year before the pandemic. The discussion was additionally extended to naturally arising interest in new forms of participation of household users in the Smart Grid, which is fostered by the improving digital competences of the inhabitants, enforced by the activities during the lockdown. This work, therefore, has two methodological layers—the first based on real case studies, and the second of narration and considerations based on the literature.
The research objective of this paper is to analyse how the lockdown during the first wave of the COVID-19 pandemic in 2020 affected the electricity use patterns of residential electricity users and to identify potential changes in the near future in the organization of residential users’ energy use that may result from these users’ experiences during the lockdown period.
In particular, the specific objectives and contribution of this article are:
- Comparison of the average residential electricity demand profiles by day of the week during the lockdown and the corresponding period before the pandemic, based on the energy meters in the dwellings.
- Determination of the peak power of the feeder supplying a group of dwellings as a function of the number of the dwellings based on a proposed adaptation of the Bootstrap method, for the lockdown and analogous pre-pandemic period.
- Comparison of the average residential electricity consumption during the lockdown and the corresponding pre-pandemic period.
- Identify the near-term implications for the household energy users resulting from the lockdown experience.
These issues, in addition to their knowledge content, may have practical significance. They provide the information needed by designers of power distribution networks in housing estates and designers of installations in residential buildings. The designers are interested in the values that characterize the use of energy in potentially extreme but realistic conditions, such as the use of energy during the lockdown. Based on these values, the appropriate parameters of the network and installation equipment, e.g., feeders, switchgear and protection devices, can be selected.
The paper is organised as follows. In Section 1, the scope and objectives of the paper are presented as well as the review of the relevant literature. Section 2 presents a case study analysis of load data measured in households in multi-family buildings in one of the Warsaw housing estates supplied from the distribution network. The methodology of the study, including the gathering of input data, methods used in analysis and simulations are discussed in Section 2.1. Then, the results describing the lockdown and pre-pandemic period, namely the statistics of the peaks of individual users (dwellings) and the sections feeding the groups of dwellings, as a function of their number, averaged daily profiles and changes in energy consumption, are presented in Section 2.2. The results are discussed in Section 2.3. Section 3 elaborates on the most significant societal implications resulting from the mental impact on the way the energy is likely to be used in households in the post-pandemic era. Section 4 concludes the article.
2. Lockdown and Pre-Pandemic Period Case Study
The lockdown during the COVID-19 pandemic was expected to cause changes in the current energy demand, reducing the energy consumption in public buildings and that of commercial users but increasing that of household users. This part of the article presents the results of the research showing the changes in the average profile of a residential user (dwelling) living in a multi-family house (block of flats) during the nationwide restrictions forcing people to stay in their flats all the time (lockdown), except for specified and justified situations. The results of these studies will be compared with the same period of the year before the pandemic.
2.1. Methodology
This article provides the analysis of data from residential users dwelling in apartment blocks supplied from the distribution network operated by innogy Stoen Operator (Warsaw, Poland). The metering data of the electricity consumed came from smart meters installed at residential users in several Warsaw housing estates in multi-family buildings built after 2005. The residential users, from whom the data on electricity consumption was collected, were supplied with a 3-phase installation with a 25 A protection device. These users were not included in any demand-side response (DSR) programme and were billed at a single tariff (identical in all hours of the day) rated per kWh unit.
The data from 2020 covered the period of the severest restrictions against the pandemic, namely, the 5 weeks from 16 March to 18 April 2020 (Figure 1). Recommendations for restrictions on personal contacts and a call for a massive shift to remote work at the start of the lockdown on 16 March 2020 (schools were closed earlier) can be considered as the beginning of the soft lockdown, which was further intensified in the following days.
The most important events in the fight against the first wave of the COVID-19 pandemic in Poland include [28]:
- 8.03.2020—the Chief Sanitary Inspector recommended the cancellation of mass events indoors;
- 11.03.2020—all forms of teaching were suspended at most public universities;
- 12.03.2020—the Prime Minister of the Government and the relevant ministers for health, education and science informed about the decision to close all educational institutions (public and non-public: crèches, kindergartens, schools and universities), and from 16 March 2020 this also applied to day-care centres;
- 15.03.2020—Poland’s borders were closed to air and rail traffic, passport controls at the borders were restored, only Polish citizens were allowed to enter (with a 14-day quarantine) and a ban on public gatherings of more than 50 people, including state and religious gatherings, was introduced;
- 16.03.2020—following government recommendations, remote working in home offices, away from company buildings and institutions, was gradually implemented;
- 25.03.2020—a ban on movement was introduced except for performing necessary professional activities, meeting essential needs in everyday life (food shopping, obtaining health care), banning gatherings of more than two people and restrictions were introduced on the operation of public transport and participation in religious ceremonies (stark lockdown);
- 1.04.2020—minors were banned from staying in public space without adult caretakers, hairdressing and beauty shops were suspended, very restrictive restrictions were introduced on the number of people who can stay in shops and service points at the same time, and it was also forbidden to stay in parks, boulevards, forests and on beaches (total lockdown).
The restrictions in Poland were loosened on 20 April 2020, consisting, first of all, of increasing the limits of people in shops at the same time and allowing them to move for recreational purposes (Figure 1).
2.1.1. Description of Data
The set of data researched includes measurements from flats in apartment buildings supplied from district heating networks (without individual electric space and water heaters). In this type of household, LED lighting and home appliances of the highest energy efficiency class are increasingly being invested in. It is worth mentioning that a modern cooking trend is the phasing-out of gas ovens, being widely replaced by electric ovens, e.g., resistance or induction ovens, which increase the power demand.
Load measurement data sets were prepared for two periods. The first one is from 16 March 2020 at 0:00 a.m. to 18 April 2020 at 23:00 a.m. (815 h). The second set includes data from the period equivalent to 2 years before the pandemic, i.e., from 16 March 2018 at 0:00 a.m. to 18 April 2018 at 23:00 a.m.
The data from electricity meters were collected by remote access. The data for both periods included measurements of active and reactive power (separately inductive and capacitive) averaged over 1-h intervals in a set of 7671 dwellings (users) in the pre-pandemic period (2018) and 7885 dwellings in the lockdown in 2020. Both sets were treated as output sets of residential users, which are inseparable sets and contain the supply points (dwellings) from the same city territory. The inhabitants of this area belonged to similar social groups, so they have a similar behaviour when using energy.
Between the lockdown and the analogous periods, there may have been changes among the people living in the individual flats, so direct comparisons (the same individual household user) could lead to the wrong conclusions. For this reason, comparisons were made between the aggregate results characterising both sets of dwellings.
For the same reason, the different number of dwellings, exceeding 7500 in both cases (with at least 90% of the supply points from the set for the period before the pandemic being the same in the set for the lockdown), does not, according to the authors, affect the correctness of the considerations. The approach used allows us to learn about the trend in the whole group of residential users.
Based on the level of statistical significance approach according to Fisher (e.g., to eliminate high errors), 5% each of the records of the residential users with the lowest recorded peak loads and 5% each with the highest of the peak loads were rejected. Thus, the analyses were carried out with the records (load profiles) of both active and reactive power, each with 815 measurements:
- 7100 dwellings for the lockdown in 2020;
- 6904 dwellings for the equivalent period before the pandemic in 2018.
To determine the maximum loads, the apparent power values of individual residential users from both sets were determined at 1-h intervals, taking into account the larger of the inductive and capacitive reactive power loads that were recorded at the same 1-h interval. In this way, information was obtained on the potentially possible maximum load, taking into account the variant of the highest reactive power demand, increasing the current load of the feeders. The calculation of these values was carried out as follows:
where S—apparent power in the interval; i—receiver number; Δt—interval (1 h); P—active power averaged (in the interval); Qind, Qcap—reactive power, respectively inductive and capacitive averaged (in the interval); and max[...]—operator determining the highest value.
From a practical point of view, an interesting quantity characterising the energy consumption of a dwelling (or a group of dwellings) is the peak value. On its basis, elements of the network supply infrastructure and electrical installation are selected. It is not a question of the occasional largest momentary peaks in demand, but of the maximum size averaged over time corresponding to an appropriate thermal time constants multiplication of the network infrastructure’s fixed-temperature equipment. The currently used elements of distribution networks in cities are characterised by high thermal time constants (such as the network of innogy Stoen Operator, from which the measurement data analysed in the article come), which allows for consideration of the load values averaged over 1-h intervals. Such values are of vital importance for network and installation planners and designers.
2.1.2. Methods Used
This part of the work aims to analyse the energy consumption by residential users (dwellings) during the lockdown in 2020 and the same period before the pandemic (2018). The results obtained include:
- characteristics of the peak power of the power supply section as a function of the number of dwellings;
- average daily profiles of active energy use in an average dwelling;
- differences in the consumption of active energy by the group of residential users in both analysed periods.
Statistical analysis of the measurement data produced parameters characterising the group of values in the analysed periods. However, to determine the values of the peak loads of feeders supplying dwellings as a function of their number, a method based on bootstrapping was used. This knowledge can be useful for distribution network operators, planners and designers of municipal electricity grids and electrical installations in residential buildings.
The bootstrap approach is used to simulate possible loads in residential installations [29]. Bootstrap, developed in 1979, is a simulation method of statistical inference [30]. The method is predestined for situations where the distribution of a statistical or random variable describing the characteristic under consideration is unknown. Bootstrapping may be a better method for the estimation of a parameter’s distribution than classical methods based on a central boundary claim [31]. The bootstrap method based on a drawn output sample allows the estimation of a parameter characterising a population. With a non-parametric approach, this method is free of assumptions about the model. It consists of drawing independent samples of not more than the size of the primary sample [32] and calculating their statistics, where their average value is an estimation of the parameter sought to describe the community. For example, the method using bootstrapping to determine the diversity factors (for peak power estimation) for the municipal and commercial users (in the number from 1 to 60) was used in [33].
In the tests, the load measurement data of the dwellings was considered a primary sample. Bootstrap tests are sets of dwelling loads data. Thus, a bootstrap sample is a drawn sample of data from an existing set representing a community of power users. The key issue is to select a proper number of secondary samples. There are many rules for selecting the number. Theoretically, a correct approach, although not practical (especially for a large number of sets in a booster-stage sample), is the selection of the number of draws as equal to all possible variants of the elements of a bootstrap set of the adopted size [34]. In addition to complex algorithms for the optimal number of attempts (e.g., [35]), often, fixed values like the element from the initial sample size are used to determine the bootstrap decomposition estimator [31] or a simple recommendation that at least 1000 bootstrap-type tests should be used [36].
The algorithm used in our research was as follows:
- A set of users of assumed number N was drawn from the data set, creating a secondary sample.
- The annual profile of the hypothetical section feeding N consumers was determined, followed by its peak power in a 1-h interval.
- The cycle was repeated 5000 times, creating a bootstrap set of samples of the peak value of the section feeding the set of consumers of different types in a given configuration. The assumed number of cycle repeats ensured that each of the individual consumers was selected with equal probability.
The algorithm was performed for individual numbers of residential users:
N ∈ {1; 2; 3; 4; 5; 6; 7; 8; 9; 10; 12; 14; 16; 18; 20; 25; 30; 35; 40; 45; 50; 60; 70; 80; 90; 100; 120; 140; 160; 180; 200; 220; 240; 260; 280; 300; 320; 340; 360; 380; 400}.
For the number of dwellings outside the above set, the result can be approximated based on the results obtained from the calculation according to the presented algorithm. This approach may be interpreted as multiple creations of a virtual building (dwellings set) with N randomly selected dwellers from the possessed data set of real load records. Recurring repetition and analysis of such a created set of virtual buildings in a given configuration of the number of dwellings allow determining statistics estimating possible loads on common sections of installations supplying dwellings in such buildings.
The above actions were carried out on the data set from the lockdown and the data set from the whole of 2018. For each tested configuration of the dwelling sets, based on the results of random samples, the parameters (numerical characteristics of the distribution of the characteristics of the tested population) defining the obtained set of peak power values were determined. In particular, the higher-order percentiles, i.e., 99 and 95 (due to the need to determine possible values of the upper estimation range, useful for planning tasks, including possible extreme variants) and the mean and median values, as well as the standard deviation, were considered to estimate the possible peak powers for a given consumer configuration.
2.2. Results
2.2.1. Peak Loads
The statistical parameters concerning the peak values of power consumption by residential users from the analysed set in the lockdown and the analogous period before the pandemic are summarised in Table 1.
The average of the load peaks during the lockdown has decreased as compared to the analogous period of 2018 by about 4% (both active and apparent power), while the peak from the averaged profile based on sets of dwellings during the lockdown turns out to be higher than in the analogous period (about 10% for both active and apparent power). The values of the median parameters practically remain the same (differences up to 2 W/2 VA).
The maximum loads of both active and apparent power during individual hours of the analysed lockdown period and the analogous one in 2018 are characterised by more stable values in daily hours during the lockdown, which is evidenced by smaller fluctuations of the peak values in subsequent hours (no significant hour peaks of the largest load of residential users in the daily hours and a more equal level of maximum values—about 3 kVA, 2.7 kW) – Figure 4.
Figure 5, Figure 6, Figure 7 and Figure 8 show statistics on the load peaks recorded each day of the analysed national quarantine period and the analogous period in 2018. The distribution of load peaks during the lockdown is more even but still right-handed. The time of possible peak loads has also been extended during the lockdown (2–9 p.m.).
The duration of peak (active) power TPeak(period) during the analysed lockdown 2020 and the analogous period in 2018 was determined (referring to the number of hours of these periods, i.e., 815) (Figure 9).
During the lockdown, the average duration of peak power, TPeak(period), was 13.8%, with a standard deviation of 7.2 percentage points and a 99-percentile of 45.4%. In the analogous period of 2018, the average duration of peak power, TPeak(period), was 11.4%, with a standard deviation of 6.1 percentage points and a 99-percentile of 38%. Longer peak power durations during the lockdown are indicative of flattened load profiles.
According to the algorithm presented in the “Methods Used” subsection, the statistical parameters describing the values of the load peaks at the point of supply to dwellings in different configurations of their number (i.e., means, medians and 99-percentiles from random secondary bootstraps of virtual object communities for a given configuration of the number of dwellings) were determined. The choice of the parameter as the 99-percentiles was dictated by caution and the nature of the task. For the same reasons, data on the apparent power load were used as numerically greater than the active power load. Graphical representation of the obtained values together with the absolute differences are shown in Figure 10 and Figure 11.
The differences in values representing possible peaks as a function of the number of users (dwellings) between the lockdown 2020 and the pre-pandemic period are not large—of the order of a single kVA, which, with peak loads in nodes above 50 kVA, gives differences of only a few percent. It can be noted that, during the lockdown, there is a relatively small increase in peak capacity at the node with only a larger number of users (above 60: for the 99-percentiles from bootstrap tests and above 180 for the averages and medians from these tests) in relation to the pre-pandemic values. This may result from the flattening of the daily profiles of individual residential users during a lockdown—peaks flattened during similar periods of the day do not pass but overlap, and the greater the number of residential users, the greater the probability of overlap of values close to the peaks.
2.2.2. Profiles of Residential Users
By averaging the measurement values for all days of the week, with equal weight for each dwelling, the shapes of the average daily profiles of active energy use by a residential user during the lockdown in 2020 and the same period before the pandemic were obtained. Figure 12 present the obtained daily profiles of active power (in 1-h intervals) of residential users together with the values of standard deviations in both analysed periods. Flattening of the daily profiles is noticeable during the lockdown for working days, with a practically unchanged peak power. Standard deviations increase during the lockdown, practically only for the daytime hours.
The obtained peak power values in the analysed profiles result from the averaging of the values for a large set of measurement data and are characteristic for the Polish system (averaged active power of a household consumer during the peak hour is about 300–350 W).
2.2.3. Differences in Energy Consumption
The increase in consumption of active energy by household users during the lockdown in the daytime hours compared to the same period of the year is noticeable (Figure 13). The highest values of standard deviations during the lockdown are observed in the daytime hours on public holidays.
The average consumption of active energy of one household during the whole analysed lockdown period was 180 kWh with a standard deviation of 261 Wh; in the corresponding period of 2018, the average was 155 kWh with a standard deviation of 246 Wh, so the average consumption of active electricity by one household in the analysed group of dwellings during the lockdown increased by almost 16% compared to the corresponding period of 2018. For 65% of the hours of the period under consideration, the average active energy consumption during the lockdown was higher than that of the same hours in the corresponding period in 2018 (Figure 14 and Figure 15). The biggest differences (up to 60%) are observed between 10 a.m. and 8 p.m. (Figure 16).
2.3. Discussion
This research was conducted on the data of about 7000 dwellings. Although the input data came from a specific urban area, we can assume that the results are representative for the habitants living in modern housing estates in large cities intended for the middle class. Modern dwellings are usually equipped with similar equipment of a high energy efficiency class and do not use electricity for heating or water-heating purposes.
In the literature, there is insufficient research on residential electricity use during lockdown based on metering analyses. For example, in [27], it is shown the case of electricity demand in a 4-member dwelling in a Spanish city during the lockdown in 2020; hence, as emphasized by the authors, it could be considered a sample of what is happening in many homes during the period of quarantine. In [26], it is described the measured changes to electricity use across 491 Australian households in pre-lockdown (1 February–19 March 2020) and lockdown period (21 March–8 May 2020), reporting on the sample of 17 households with detailed per-circuit electricity monitoring. The conclusions and trends presented in the cited papers are qualitatively consistent with the observations obtained from the research presented in this article. The quantitative differences result from local conditions (e.g., climatic conditions and average living standards), which influence the way energy is used by people in countries.
2.3.1. Peak Power during Lockdown and Before the Pandemic
It can be concluded that the peak capacities in the group of residential users during the lockdown remained practically unchanged as compared to the pre-pandemic period. This statement results from the following observations:
- Comparing the values of peaks of the whole group of residential users: during the lockdown, their average value decreased by about 4% and the median by 0.1% (for both active and apparent power) compared to the analogous period; while, comparing the value of the peak from the average load of the dwelling resulting from the averaging, it increased by about 9% during the lockdown and the median increased by about 0.5% during the lockdown (for both active and apparent power) (Table 1). The differences do not, therefore, give a clear indication of the increase or decrease in the average peak, and from a practical point of view, these differences are not high.
In the case of the Australian analysis [26], it can be observed that peaks of the hourly consumption weekday totals for all analysed households by the state in half of the cases reached practically the same values during the lockdown as during the pre-lockdown, although analogous periods of the years were not compared, only the consecutive ones. The average peak load values of one household, except for the Tasmania area, were 2–2.5 kW.
An interesting observation was made on a sample of household users in Spain [27], namely, that the daily demand peaks were higher in an analogous period in 2019 than during lockdown (14 March–30 April 2020). The explanation for this is that, as people remain in their homes throughout the day, the power demand in 2020 is more equally distributed throughout the whole day and not just during the morning and afternoon peak hours, as it was before lockdown.
2.3.2. Profiles
Analysing the averaged daily profiles of active power (Figure 12) of the analysed group of residential users, the following observations can be made:
- The peak load on weekdays appears at 8 p.m. and reaches practically the same values (about 330 W) both in the lockdown and in the analogous period of 2018; one exception is the averaged profile for Friday from the analogous period of 2018 when the peak was slightly lower.
- During the lockdown, the shape of the daily profile was flattened (equalizing to a peak during the daytime), and on weekdays the southern valley almost disappeared; the largest load peaks were between 5 a.m. and 8 a.m. (from 100 W to about 250 W), another relatively small one between midnight (from 250 W to about 300 W) and the last daily peak was between 6 p.m. and 8 p.m. (to 350 W); the night valley appears about 4–5 a.m., i.e., later than in the analogous period of 2018 (approx. 3 h), and its value is higher by several Watts.
- During the lockdown, the Saturday and Sunday profiles resembled each other, reaching the highest afternoon peak around 2 p.m. (up to 350 W), the night valley around 5 a.m. (below 100 W) and the evening valley around 6 p.m. (over 300 W) before the second peak (evening) at 7–8 p.m. (around 330 W). On Saturday, the observed flattening of the profile during the daytime is no longer characteristic during the lockdown. The weekend peak in the afternoon (2–3 p.m.) of the lockdown dominates over the peak of the pre-lockdown period from 8 p.m., with the average load at that hour during the lockdown increased by several Watts.
In the Australian case [26], it was seen that lockdown did not significantly change the household profile throughout the day; but, the evening peaks in 4 of the 6 analysed Australian states during lockdown are notable, which was probably caused by a greater number of residents remaining and eating at home in a larger number of nights during the lockdown. In the Spanish case [27], in the analogous period in 2019, the demand was concentrated in two peaks (between 7 a.m. and 9 a.m. and after 8 p.m.); during lockdown 2020, the demand is spread over the morning, and the night peak is shifted an hour later and is lower than before the lockdown.
2.3.3. Energy Consumption
The energy demand reflects the intensity of activities carried out by the user, so during the lockdown, due to the need to stay in the flat, work and study remotely, there was an increase in energy consumption by households. In the lockdown, as compared to the same period before the pandemic, the consumption of electricity in the group of residential users in question increased. This was linked with an increase in consumption during the daytime hours (10 a.m.–6 p.m.) and an increase in consumption on weekend days. The highest average increase in load during the lockdown is also observed at times when on weekdays the load during the analogous period was in the order of 200–300 kVA (Figure 13 and Figure 14). The average energy consumption in the analysed group of residential users during the lockdown increased by about 16% compared to the analogous period in 2018.
In the Australian case, the analysis showed a seemingly substantial effect of lockdown on energy use [26]. A comparison of changes in energy use during lockdown to the same periods in the previous year supports the thesis of seasonal independence of energy demand and allows to isolate the effect of lockdown restrictions. A study of one Australian state (Queensland) showed that the reduction in energy use by residential users between lockdown related to the pre-lockdown period in the same 2020 year was less than between the same periods in 2019, suggesting an increase of demand during the lockdown. On the other hand, as it was estimated, the additional energy used for cooking, heating, entertainment, working and learning from home during lockdown was not enough to balance the reduction in air-conditioning load between the two periods. Moreover, the majority of Queensland households in the investigation recorded decreases in overall energy use during lockdown relative to the pre-pandemic period. Thus, it can be concluded that the changes in the quantitative energy demand of household users in the lockdown period result from the local activities and lifestyles of individual residents which are, inter alia, related to local habits and average economic situation.
2.3.4. Limitations
The authors are aware that the analysis has several limitations and drawbacks (Table 2). These limitations should be taken into account when generalizing the conclusions of the study to other areas (especially with different climatic, demographic and economic conditions than those in Central Europe) with different patterns of residential electricity use, as well as to different groups of residential users. The research can be treated as a case study performed on a large number of objects, showing the trends and characteristic phenomena in energy use at the residential level under conditions such as a lockdown.
Energy consumption at each moment of the day was therefore based on the current needs of the consumer and was not limited or subordinated to external stimuli from the supplier. Neither the use of reactive energy nor the amount of peak power (household users) was subject to billing.
This article does not present analyses of measurements of the reactive power used by users, as the analysis of this issue requires a special approach and more detailed study [37]. The results of the analyses concern a specific and abundant group of users, i.e., residential users, and are based on real measurements. Despite these limitations, the results of the studies and analyses are a case study to determine how the national quarantine conditions, including the lockdown stages, change the average energy demand of residential users. The view of how electricity is used under such specific conditions may provide a starting point for considering the extent of possible changes in the energy consumption profile of a household user caused by measures affecting that consumer.
Elimination of the limitations listed in Table 2 requires a significant extension of the research and data set under analysis with additional information (identification and grouping of additional attributes of users) or extension of the duration of the conditions of a specific experiment, such as a lockdown, which is not socially desirable.
3. The Prospective Mental Lockdown Implications
The lockdown can be considered as a specific experiment, allowing observation of energy demand by residential users in extreme situations, influencing the development of the digital competence of users and, in this context, considering its impact on the attitude of residential users towards electricity use. The lockdown has enforced changes in household behaviour, resulting from the need to carry out, as far as possible, existing household activities. It has led, among other things, to popularisation of
- forms of implementation in remote mode:
- ◦
- professional work and education;
- ◦
- home entertainment;
- ◦
- business and private meetings.
- digital tools in the field of:
- ◦
- payments and settlements, including online trading;
- ◦
- new services and activities based on the Internet;
- ◦
- dealing with official matters.
The lockdown showed that some professional activities can be performed from home with similar efficiency. The benefits of remote working cause businesses to substantially increase plans for remote hiring in the future, which will produce an acceleration in the already upward trend of greater remote work [38]. There are trends of homes transforming into spaces where home-schooling, office work, recreational activities and social interaction have become a norm; hence, it should be predicted to over time increase their influence on energy use and also energy upgrades need to be considered in decision making [39].
Of course, in the longer term, the spread of remote working will require a resolution of new management as well as organisational and psychological issues (such as work-home interference, ineffective communication, procrastination, loneliness, social support, job autonomy, monitoring and workload—identified in the context of remote working during a pandemic [40]), and it may indirectly translate into individual energy profiles. The spread of remote or hybrid operation should, therefore, be taken into account in energy analyses, including network load planning [41].
A separate research issue is an identification to what extent the above forms and tools will apply in the post-pandemic period and how they will affect the power demand and use of electricity in residential buildings. Approaching this issue requires interdisciplinary research and discussion. In this context, the authors decided to identify the main implications and signal the basic connections of aspects related to the impact of the lockdown experience on the future use of energy by residential users (Figure 17). The elements identified in the diagram interact with each other. These interrelated aspects are divided into 3 groups:
- direct lockdown effects on the behaviour of users (dependent activities and the need for digital competence development);
- the main repercussions identified from the energy side, as a sector;
The implementation of remote activities causes immediate changes in the energy profiles of users and in the amount of energy used per day, which was discussed on the example of the case of the residents of Warsaw’s district in the first part of this article. DSR mechanisms are a recognized means used to directly influence the profiles of users within the Smart Grid concept, while the solutions based on prosumption are a developing means to cover the energy demand by the active users themselves. The issue to be resolved is how the lockdown experience can affect the scope and potential of these measures.
On the other hand, remote activities (involuntarily developed during the lockdown) force interest in new forms of settlements and services provided using digital means of communication; in particular, it may concern settlement between users (prosumers) and the Distributed System Operator (DSO), as indicated later in the article. A special measure in this concept may be the development of digital finance, understood as financial services provided through mobile devices (phones, computers), the Internet or cards connected to a reliable digital payment system [46]. All these interacting measures of a technical, organisational and financial nature are one of the pillars of a Smart Grid development, understood as the concept of providing effective delivery of power by responding to all the conditions with the adaptation of several strategies by using state-of-the-art information communication technologies [47].
3.1. User Activation First Step: DSR
Methods, commonly known as DSR (or demand-side response), understood as energy management on the demand-side, can alongside be used to reduce the peaks of very high demand to avoid energy shortages [48]. DSR is a temporary adjustment by the power user in response to the price signal or is realised under a contract with the DSO. The research and considerations of DSR in the household sector have appeared since the end of the 20th century, e.g., [49]. We can consider two types of DSRs: when it reduces (suppresses) power demand (down DSR), and when it increases (creates) demand for electricity (up DSR) [50]. DSR should be considered as a programme dedicated to users to influence the way they use energy and shape their daily consumption profile from the point of view of the supplier (network operator)) [51].
Probably due to the higher power potential and available control technology, the more recognized area of DSR applications concerns commercial users, e.g., [52]. Trials and tests are undertaken to enable seamless demand response services in the residential and tertiary building domains [53].
Different user visions are identified in DSR (indifferent consumer, resource man, energy citizen) and strategies for enrolling a user’s home as a functioning element in the power grid (automation, gamification), and the success of the development of a household DSR depends on market innovations [54]. The growth of price-based DSR is observable, which extends DSR to residential and small business users (but without giving them access to balancing or capacity markets) [55].
According to a survey conducted by Japanese researchers [56], among households is a huge interest in DSR participation—only 28% of households showed a negative attitude toward participation in DSR programs. The results of another survey conducted among 10,000 households in Japan responding to a request for a DSR are presented in [50]. The study from [57] shows a Swedish case, in which a relatively small economic compensation for DSR participation is required for households in apartments, whereas households in detached houses require higher benefits.
Smart households, especially when a home energy management system exists, have the further capability to enhance effective implementation of residential DSR [58]. This concept can be considered in conjunction with intelligent building and energy efficiency within prosumer-based local grids [59]. It necessitates the proposition of models that minimise the electricity cost and user discomfort while taking into account the peak energy consumption. For residential DSRs, approaches based on Artificial Intelligence (AI) are used across the Internet of Things (IoT), e.g., [60,61].
DSR is not the only strategy available for residential users when they try to contribute to cut peak-time consumption. A broad range of short-term reduction and substitution solutions, e.g., variable tariffs, as well as a long-term investment, e.g., remote-controlled energy-efficient home appliances, are also economically viable options [62].
In the current scheme, the user cooperates with two entities technically related to the power supply, namely, the DSO and the seller of energy, which is an intermediary of the generators. The most convenient situation for the DSO would be a practically constant load over time, which would facilitate load forecasting and even use of network infrastructure. On the other hand, the generation based on renewable sources is characterised by variability, particularly depending on weather conditions. It would be most effective when energy from RES was consumed by the least distant user.
Therefore, the DSR mechanisms for cutting peak demand should account for the scheduling of the supply of energy from RES. In the long term, the implementation of such mechanisms should lead, among other things, to
- mitigation of pressure on the development of new generation capacity and network investments;
- creation of conditions for optimising electricity prices;
- optimal management of congestion in the distribution and transmission networks,
- improving consumers’ awareness of energy management on the demand side and potential own benefits of distributed generation, i.e., the end-user (small/large) consciously controls own energy consumption;
- improving, on the distribution side, the management of price and quantity risks in the energy market.
The analysis of energy use by residential consumers during the lockdown provides experience-based knowledge on the ability to use electricity under extreme conditions (i.e., continuous presence in a home and the readiness of devices to use). The group of consumers analysed in the article was not participating in any DSR programme; they were also billed according to a single-zone tariff. Thus, these users could freely use their devices without having any motivation to shape the profile as desired by the DSO. Nevertheless, as shown, the average power profiles were “naturally” flattened during the daytime.
The observed situation showed that during a full lockdown it was not necessary to use DSR mechanisms to stimulate consumers to smooth profiles in times of increased energy demand. A widespread trend to perform remote work in one’s flat will increase the energy demand of residential buildings during the daytime, partly flattening the average energy use profile, although in the direction of maintaining the load during the daytime in the area of already existing power peaks. In this case, we can talk about an area-wide partial transfer of energy consumption from the places of previous stationary work (mainly office buildings) to residential buildings, which can also be considered as some form of impact on energy users within the demand-side management (DSM) generalisation.
3.2. Next Step: Smart Prosumer
Work done from home will increase interest in the reliability of energy supply. Distributed resources, located close to energy users, can play an important role here. In connection with the development and diffusion of RES technologies [63], photovoltaic (PV) sources seem to be particularly predestined to meet the increased demand for energy during the daytime hours by residential consumers. It is possible to develop prosumer PV installations on the roofs and facades of multi-family buildings (e.g., [64,65,66,67], including green roofs [68]). A techno-economic model for PV household-prosumers may include state of charge management strategies in dedicated energy storage systems, e.g., [69].
The development of renewable sources is supported by climate policy aimed at decarbonisation [70] and promoting sustainable development. In the last aspect, it should be emphasized that based on Regulation (EU) 2019/2088 of the European Parliament and of the Council [71], since March 2021, institutional investors (funds, banks and insurers), asset managers and financial advisors have been taking into account the risks for sustainable development in their investment decisions and advice, which will result in an increased interest in various forms of support for initiatives favouring mechanisms for efficient and sustainable use of energy resources, and thus also in balancing methods that promote the minimal loss-making use of energy from renewable sources by all groups of users. Such a trend will be highlighted by the increased adoption of smart home technologies, electric vehicles (EVs) and flexible demand-side activities [72]. In this context, it should be emphasised that the European Commission takes the view that clean and RES-based energy will also be one of the pillars of economic recovery after the COVID-19 crisis [73].
Moreover, an increase in renewable power used was observed during the pandemic and this is not purely circumstantial. COVID-19 possibly have hastened the end of fossil fuel energy in the power sector [74,75]. In this context, consideration may be given to a resilient RES-based energy supply network model, which, presented in [76], is based on risk-sharing between the government, power plant and consumers in the light of the COVID-19 pandemic.
Prosumer installations cooperating within a group of intelligent buildings (including residential buildings, managed by a cooperative), forming a smart micro-grid, will be an element to improve power supply reliability and achieve the objectives of the energy transformation. As concluded in [14], during the COVID-19 pandemic, the share of RES in the generation has increased, so it is possible to run a power system with a high share of energy production from RES, but without a high level of flexibility on the demand side and energy storage installations, the cost of auxiliary services in the power system may be very high.
Participation in the abovementioned automated DSR programs by residential users is related to algorithms for such systems, such as Home Energy Management systems (HEMS), and may influence the load diversity and potentially result in creating new peaks at the lowest price intervals (e.g., [77]). The observed interest in DSR applications for individual consumers connected to Smart Grids, which allow for remote control of consumers by operators of electricity distribution systems and HEMS systems in consumer houses, encourages the development of multi-objective optimization algorithms [78]. Paper [79] investigates the factors influencing residents’ willingness to adopt and pay for HEMS and their relationship with the new living dynamics during the quarantine period in a pandemic such as COVID-19. The restrictions during the COVID-19 pandemic could help focus new attention on the relationship between household activities and energy use, helping people realize the importance of smart home technologies and in the transition to the Smart Grid [80].
A survey conducted after a period of strict lockdown in California [80] confirmed the interest of household users in buying and implementing smart home technology (especially in families with children), where the motivation is to save energy expenditure and improve interaction with devices to improve their comfort and home environment (including exposure to social media). The implementation of such technologies can be costly in the short term, especially for families with limited income security due to the COVID-19 situation.
3.3. Consequence: Digital Settlements for Energy Exchange
The use of local, prosumer energy sources will require initiatives from building managers and residents themselves. A new model of energy billing between local prosumers, using blockchain technology, would be useful in this solution (smart contracts, peer-to-peer market, energy transactions) [81,82,83,84,85,86,87], which requires the appropriate legal changes [88]. However, the use of blockchain in the energy sector will not be limited to settlement issues alone [85,89]. Full structures of smart contracts based on the DSR framework are being considered, aggregating the prosumers in houses where infrastructure and functioning are provided by blockchain technology [90].
Blockchain technology is suggested as part of the next step in this transition to decentralised energy structures, because it has potential to enable distributed, peer-to-peer trading with reduced transaction costs, increased security, prosumer choice and may vivify many stakeholders [91].
Blockchain can be utilised as a means to support energy exchanges in a community of prosumers [86]. A holistic exploration and conceptualization of blockchain-based microgrids, as well as practical implications for institutional development and academic research, are presented in [82]. Various platforms are developing (for energy trading and smart contracts, which rewards the producers of green energy or to help its users to save energy), which offer a token that can be rewarded to the users and can be monetarized [92]. Such an approach can be developed as an innovative digital finance product. The increasing digital competence of individual users, forced by the lockdown, may increase interest in such solutions.
Christine Lagarde, the president of the European Central Bank (ECB), said that the COVID-19 pandemic has accelerated the trend towards digitalization, with non-cash payments, making a change in the nature of money faster [93]. In this context, one can mention the interest in crypto-currencies, the concept of which was already given in 1921 by Henry Ford (“New York Tribune”, 4 December 1921), who proposed to replace the existing gold-backed currency system into one based on an “energy currency” [94]. Finally, energy corresponds to the value of work that was done and besides the potential of work that can be done. Energy is fundamental to the economy and energy-related money can offer a means to improve the qualities of the monetary system, also stimulating the low-carbon energy transition [95]. It is observed a positive correlation between crypto-currencies trading volumes and energy consumption [96].
A concept of digital energy-currency may be introduced to incentivise energy efficiency behaviour [92]. Some crypto-currencies (and an open currency exchange market structures) are created dedicated to the settlement of RES-based energy trading between prosumers in the Smart Grid (e.g., see [92,97]).
3.4. Comments
The period of forced lockdown was a specific period in terms of demand and use of energy by household users. The experience of this period can provide important information to show the specificities of using electricity in an extreme situation. Electricity was extremely used during this period by all household members staying at home for the majority of the time of the day and was used for purposes such as
- living, with the needs being increased as they were restricted outside the home;
- realisation of work duties resulting from the need to work remotely, as well as school duties in remote learning mode;
- rest in a form limited to own homes.
Other activities, such as heating and cooling, cooking of meals and transport, identified in [25], had a smaller share in changes in electricity demand due to the widespread use of forms of energy other than electricity for these purposes in Poland. The lockdown increased the use of electronic equipment (e.g., computer hardware, lighting systems), which resulted in changes in the consumption of inactive electric power (reactive power). Therefore, an analysis of the loads on household users during the lockdown may provide interesting information influencing the design and determination of power demand in the installations of residential buildings and the power networks of housing estates. This is because they provide information about the possible use of energy in extreme conditions, which can also potentially happen in a pandemic-free period.
The COVID-19 pandemic period and the means taken, including lockdown restrictions, will have a long-term impact on the functioning of many economic sectors, including energy. The global socio-economic effects of the COVID-19 pandemic includes, i.a., higher unemployment and poverty rates, altered education sectors, changes in the character of work, lower GDPs and heightened risks to health care workers [3].
The use of electricity in residential buildings during a lockdown is a set of experiences, which are translated into technical, economic and organisational issues, and this is the result of mental changes forced by the lockdown and affecting current and future energy use. The effects (repercussions) resulting from the impact of lockdown on household electricity consumers (Figure 17) can be considered in two categories due to the time of their visibility (Table 3).
The changes observed in the average profiles of residential users are related to the lockdown period and do not necessarily have to be specific to the post-pandemic period, but they do show the extent of possible changes that will undoubtedly occur during the post-pandemic due to the preferences and experiences of users in the lockdown. This situation requires interest from various stakeholders in the constantly evolving energy structure.
In this context, research questions and problems can be formulated, the solution of which will be important in planning the use of electricity for end-users and, consequently, in designing the networks and installations supplying households. The problem to be resolved is to what extent the changes observed will impact on the immediate future. As regards predicting profiles and volume of electricity use in dwellings after the pandemic, the following should be borne in mind:
- the development of techniques for work, education, leisure and entertainment in remote form;
- the expected economic recession, affecting, among other things, the reorganisation of work in certain sectors, reduction in demand for certain goods and services and changes in the standard of living of various social groups;
- opportunities to deepen social differences and the problem of energy poverty;
- the range of measures that can be implemented in the event of a recurrence of a pandemic;
- environmental issues and the need to prevent a climate disaster, which implies changes in the way many consumer goods are used;
- current social and individual needs;
- impact of various legal forms of dwellings (rent, lease, ownership) on participation in various energy initiatives (including participation in DSR, prosumer cooperatives, energy saving, etc.);
- an offer from energy companies in the area of prosumption promoting, programs for demand side and the new forms of settlements;
- a framework for the functioning of the energy market and energy services, openness to the implementation of digital energy-currency.
Remote working seems to be the most important experience with lockdown, which affects changes in the use of energy in households. In this context, consideration should be given to possible permanent changes in energy use, taking into account the following:
- the anticipated percentage of people with the appropriate skills and professions to work remotely;
- the penetration of remote working in the context of economic needs;
- development of remote work management methods in the context of its effectiveness;
- possibility to perform remote work also outside the place of residence;
- the correlation between the prevalence of remote working and mobility, especially electromobility needs;
- requirements for equipment conditions to be provided for remote working;
- the impact of remote working equipment (electronic office equipment) on the power quality in the electrical installation and the necessary remedial measures;
- the problem of demand for reactive power (especially capacitive) in residential buildings;
- the need to ensure the supply of quality and reliability in the context of developing local RES;
- automation of processes related to energy use during both remote working and domestic activities;
- the effectiveness of DSR programmes for remote-working dwellers.
These issues may be treated as research problems allowing for the development of guidelines for the design of electrical installations in residential buildings and networks in residential areas, including the optimisation of the parameters of the envisaged energy infrastructure. An additional issue may be the relationship between the development of cyber-billing and digital finance and the development of the energy market segment based on prosumer services and DSM/DSR mechanisms.
The authors in [99] argue that conducting social research in the energy domain ought to give special consideration to the internal and external validity of their work conducted during the pandemic period. They set out the principles that researchers can consider giving themselves and other research users greater confidence that the findings and recommendations will still be applicable in the years to come.
4. Conclusions
The article, based on the measurement data from about 7000 dwellings in Warsaw housing estates, shows how the average daily energy demand profiles of household users changed during the lockdown of COVID-19 pandemic compared to the analogous period of the year before the pandemic. An increase in daily electricity demand was observed with practically unchanged peak loads. This concerns both the peak value in the average profiles and the expected peak load values of the sections feeding a group of flats as a function of their number. These are issues that are of technical interest to engineers who design and operate distribution networks and buildings’ electrical installations. Determining the potentially possible peak loads of the sections feeding end-users is an important issue from the point of view of the cost and profitability of investments in the supply infrastructure.
The analysis has shown that in installations with high thermal time constants, e.g., for cables, the use of electricity by household users in extreme conditions, such as domestic quarantine during a lockdown, should not pose a risk of a long-term overload of electric networks. From the point of view of the network and electrical installation design for a residential building, the parameters related to the permissible load capacity of cables and wires can be maintained. Conclusions obtained as a result of the analysis of load data during the lockdown may be applied to the post-pandemic period. This is because they provide information on the possible use of energy in extreme conditions, which can also potentially occur in a pandemic-free period. The lockdown has shown that part of the activity can be carried out in household conditions, which will result in changes in the way and schedule of using electricity in households.
The results of the lockdown may be seen as the result of a social experiment involving the partial relocation of electricity consumption, as a result of the need for remote working and remote education. Of course, this was possible in the case of office and intellectual work, i.e., the transfer of energy consumption from office buildings and schools to residential buildings. This can be seen as a specific form of influencing energy consumers from a group of administrative and legal means. An additional issue is the extent to which the identified changes will remain after the pandemic is over. The EU concept of “the consumer in the energy centre” should be interpreted from the point of view of the increasing share of remote work, services and education in the post epidemic society.
The loads analysed and described in this article concerned the conditions of use of electricity by users not participating in the DSR mechanisms. From a DSO’s point of view, a situation in which network elements will not be significantly loaded is desirable. DSR mechanisms allow the operator to manage the network by reducing the electricity demand over a certain period in a certain area and thus stabilise the network operation. The dissemination of smart metering will allow for the implementation of DSR programmes, also addressed to home users. To use resources and infrastructure rationally, the conditions of supply (available generation capacity at different levels of the network), demand (options of energy consumption capacity) and energy supply capacity (network constraints) should be taken into account when designing DSR programmes. These conditions may vary over time.
The situation forced by the lockdown was the need to work and learn remotely, and its secondary effect should be to increase the digital competence within society. In the context of the functioning of energy, this may contribute to an increased interest in new forms of cooperation between end-users and their suppliers and distributors. This may particularly affect interest in models of digital settlements between energy users and DSO. In the long term, it may contribute to changes in financial systems (crypto-currencies covering energy resources, digital energy-currency).
A situation that forces people to stay at home and work remotely for longer increases the pressure on DSO to meet high-reliability standards. Users interested in uninterruptible power supply can increasingly turn to their energy sources. This will also apply to dwellers who could use PV panels on the roofs of buildings, for example, within a cooperative. This will require new models of cooperation between the prosumer group and the distribution network operator. The problem of a forward-looking increase in the share of distributed generation, including in networks supplying residential building installations, requires designers of future installations to provide for the connection of additional energy sources and to formulate technical conditions that these units should meet to be able to cooperate with the installation or network being designed. It will be necessary to analyse the cost-effectiveness of project implementation options in terms of the anticipated possibilities of installing prosumer sources.
The connection of newly distributed sources based on the unstable generation of RES will complicate the problem of an optimal load distribution in the grid and installations. This will require new analyses, taking into account the economic conditions of energy generation and consumption within an appropriate time horizon. The changes should concern the tariff settlement system, taking into account the DSR mechanisms, which should be based on a new methodology for evaluating the cost-effectiveness of possible solutions and digital finance solutions.
Author Contributions
Conceptualization, S.B., T.S. and L.S.; methodology, S.B. and T.S.; software, S.B.; validation, S.B., T.S. Ł.M. and P.D.; formal analysis, S.B., T.S. and L.S.; investigation, S.B. Ł.M., L.S. and P.D.; resources, S.B., T.S., L.S. Ł.M., P.D. and J.B.; data curation, S.B. Ł.M. and P.D.; writing—original draft preparation, S.B., T.S., L.S. and J.B.; writing—review and editing, S.B., T.S., L.S., J.B., P.D. and Ł.M.; visualization, S.B. and J.B.; supervision, T.S.; project administration, S.B.; funding acquisition, S.B. and Ł.M. All authors have read and agreed to the published version of the manuscript.
Funding
This research was funded by the European Union’s Horizon 2020 Research and Innovation Programme under Grant Agreement No: 730403, project INNOPATHS: Innovation pathways, strategies and policies for the Low-Carbon Transition in Europe.
Institutional Review Board Statement
Not applicable.
Informed Consent Statement
Not applicable.
Data Availability Statement
The data are not publicly available due to privacy.
Acknowledgments
We would like to thank the employees of innogy Stoen Operator Sp. z o. o. for their support, the delivery of measurement data and valuable inspirations. Special thanks to Ewa Stefaniak, MA, for her kind and valuable help in preparing the content of the work.
Conflicts of Interest
The authors declare no conflict of interest.
References
- International Energy Agency IEA. Global Energy Review 2020–The Impacts of Covid-19 Crisis on Global Energy Demand and CO2 Emissions; International Energy Agency IEA: 2020. Available online: https://www.iea.org/reports/global-energy-review-2020/global-energy-and-co2-emissions-in-2020 (accessed on 12 January 2021).
- International Energy Agency IEA. COVID19-Exploring the Impacts of the COVID19 Pandemic on Global Energy Markets, Energy Resilience, and Climate Change; International Energy Agency IEA: 2020. Available online: https://www.iea.org/topics/covid-19 (accessed on 5 December 2020).
- Mofijur, M.; Fattah, I.R.; Alam, A.; Islam, A.S.; Ong, H.C.; Rahman, S.A.; Najafi, G.; Ahmed, S.; Uddin, A.; Mahlia, T. Impact of COVID-19 on the social, economic, environmental and energy domains: Lessons learnt from a global pandemic. Sustain. Prod. Consum. 2021, 26, 343–359. [Google Scholar] [CrossRef]
- Aktar, M.A.; Alam, M.; Al-Amin, A.Q. Global economic crisis, energy use, CO2 emissions, and policy roadmap amid COVID-19. Sustain. Prod. Consum. 2021, 26, 770–781. [Google Scholar] [CrossRef]
- Akrofi, M.M.; Antwi, S.H. COVID-19 energy sector responses in Africa: A review of preliminary government interventions. Energy Res. Soc. Sci. 2020, 68, 101681. [Google Scholar] [CrossRef]
- Gebreslassie, M.G. COVID-19 and energy access: An opportunity or a challenge for the African continent? Energy Res. Soc. Sci. 2020, 68, 101677. [Google Scholar] [CrossRef]
- Bompard, E.; Mosca, C.; Colella, P.; Antonopoulos, G.; Fulli, G.; Masera, M.; Poncela-Blanco, M.; Vitiello, S. The Immediate Impacts of COVID-19 on European Electricity Systems: A First Assessment and Lessons Learned. Energies 2020, 14, 96. [Google Scholar] [CrossRef]
- Bahmanyar, A.; Estebsari, A.; Ernst, D. The impact of different COVID-19 containment measures on electricity consumption in Europe. Energy Res. Soc. Sci. 2020, 68, 101683. [Google Scholar] [CrossRef]
- Norouzi, N.; De Rubens, G.Z.; Choupanpiesheh, S.; Enevoldsen, P. When pandemics impact economies and climate change: Exploring the impacts of COVID-19 on oil and electricity demand in China. Energy Res. Soc. Sci. 2020, 68, 101654. [Google Scholar] [CrossRef] [PubMed]
- Abu-Rayash, A.; Dincer, I. Analysis of the electricity demand trends amidst the COVID-19 coronavirus pandemic. Energy Res. Soc. Sci. 2020, 68, 101682. [Google Scholar] [CrossRef] [PubMed]
- Aruga, K.; Islam, M.; Jannat, A. Effects of COVID-19 on Indian Energy Consumption. Sustainability 2020, 12, 5616. [Google Scholar] [CrossRef]
- Carvalho, M.; Delgado, D.B.D.M.; De Lima, K.M.; Cancela, M.C.; Dos Siqueira, C.A.; De Souza, D.L.B. Effects of the COVID-19 pandemic on the Brazilian electricity consumption patterns. Int. J. Energy Res. 2021, 45, 3358–3364. [Google Scholar] [CrossRef]
- Zhang, X.; Pellegrino, F.; Shen, J.; Copertaro, B.; Huang, P.; Saini, P.K.; Lovati, M. A preliminary simulation study about the impact of COVID-19 crisis on energy demand of a building mix at a district in Sweden. Appl. Energy 2020, 280, 115954. [Google Scholar] [CrossRef] [PubMed]
- Ghiani, E.; Galici, M.; Mureddu, M.; Pilo, F. Impact on Electricity Consumption and Market Pricing of Energy and Ancillary Services during Pandemic of COVID-19 in Italy. Energies 2020, 13, 3357. [Google Scholar] [CrossRef]
- Narajewski, M.; Ziel, F. Changes in Electricity Demand Pattern in Europe Due to COVID-19 Shutdowns. IAEE Energy Forum/Covid-19 Issue 2020. arXiv 2020, arXiv:2004.14864, 44–47. [Google Scholar]
- Qarnain, S.S.; Muthuvel, S.; Bathrinath, S. Review on government action plans to reduce energy consumption in buildings amid COVID-19 pandemic outbreak. Mater. Today Proc. 2020. Available online: https://pubmed.ncbi.nlm.nih.gov/32377508/ (accessed on 12 February 2021). [CrossRef] [PubMed]
- Elavarasan, R.M.; Shafiullah, G.; Raju, K.; Mudgal, V.; Arif, M.; Jamal, T.; Subramanian, S.; Balaguru, V.S.; Reddy, K.; Subramaniam, U. COVID-19: Impact analysis and recommendations for power sector operation. Appl. Energy 2020, 279, 115739. [Google Scholar] [CrossRef]
- Zhong, H.; Member, S.; Tan, Z.; Member, S.; He, Y.; Member, S. Implications of COVID-19 for the electricity industry: A comprehensive review. CSEE J. Power Energy Syst. 2020, 6, 489–495. [Google Scholar] [CrossRef]
- Mastropietro, P.; Rodilla, P.; Batlle, C. Emergency measures to protect energy consumers during the Covid-19 pandemic: A global review and critical analysis. Energy Res. Soc. Sci. 2020, 68, 101678. [Google Scholar] [CrossRef]
- Steffen, B.; Egli, F.; Pahle, M.; Schmidt, T.S. Navigating the Clean Energy Transition in the COVID-19 Crisis. Joule 2020, 4, 1137–1141. [Google Scholar] [CrossRef]
- Klemeš, J.J.; Van Fan, Y.; Jiang, P. The energy and environmental footprints of COVID-19 fighting measures–PPE, disinfection, supply chains. Energy 2020, 211, 118701. [Google Scholar] [CrossRef]
- Kuzemko, C.; Bradshaw, M.; Bridge, G.; Goldthau, A.; Jewell, J.; Overland, I.; Scholten, D.; Van De Graaf, T.; Westphal, K. Covid-19 and the politics of sustainable energy transitions. Energy Res. Soc. Sci. 2020, 68, 101685. [Google Scholar] [CrossRef]
- Sovacool, B.K.; Del Rio, D.F.; Griffiths, S. Contextualizing the Covid-19 pandemic for a carbon-constrained world: Insights for sustainability transitions, energy justice, and research methodology. Energy Res. Soc. Sci. 2020, 68, 101701. [Google Scholar] [CrossRef] [PubMed]
- Kanda, W.; Kivimaa, P. What opportunities could the COVID-19 outbreak offer for sustainability transitions research on electricity and mobility? Energy Res. Soc. Sci. 2020, 68, 101666. [Google Scholar] [CrossRef] [PubMed]
- Cheshmehzangi, A. COVID-19 and household energy implications: What are the main impacts on energy use? Heliyon 2020, 6, e05202. [Google Scholar] [CrossRef]
- Snow, S.; Bean, R.; Glencross, M.; Horrocks, N. Drivers behind Residential Electricity Demand Fluctuations Due to COVID-19 Restrictions. Energies 2020, 13, 5738. [Google Scholar] [CrossRef]
- Santiago, I.; Moreno-Munoz, A.; Quintero-Jiménez, P.; Garcia-Torres, F.; Gonzalez-Redondo, M. Electricity demand during pandemic times: The case of the COVID-19 in Spain. Energy Policy 2021, 148, 111964. [Google Scholar] [CrossRef]
- Covid-19 in Poland. Governments Actions. Available online: https://www.gov.pl/web/koronawirus/dzialania-rzadu (accessed on 22 November 2020). (In Polish)
- Bielecki, S. Estimation of Peak Loads in Residental Electricity by Means of a Coincidence Factor Method. Rynek Energii 2020, 1, 65–70. [Google Scholar]
- Efron, B. Bootstrap Methods: Another Look at the Jackknife. Ann. Stat. 1979, 7, 1–26. [Google Scholar] [CrossRef]
- Singh, K.; Xie, M. Bootstrap: A Statistical Method; Rutgers University: 2008. Available online: https://www.stat.rutgers.edu/home/mxie/rcpapers/bootstrap.pdf (accessed on 10 January 2021).
- Efron, B. Estimating the Error Rate of a Prediction Rule: Improvement on Cross-Vaildation. J. Am. Stat. Assoc. 1983, 78, 316–331. [Google Scholar] [CrossRef]
- Chatlani, V.P.; Tylavsky, D.J.; Montgomery, D.C.; Dyer, M. Statistical Properties of Diversity Factors for Probabilistic Loading of Distribution Transformers. In Proceedings of the 2007 39th North American Power Symposium, Cruces, NM, USA, 30 September–2 October 2007; pp. 555–561. [Google Scholar]
- Fox, J. Applied Regresssion Analysis and Generalized Linear Models; SAGE Publications Inc.: London, UK, 2008. [Google Scholar]
- Davidson, R.; MacKinnon, J.G. Bootstrap tests: How many bootstraps? Econ. Rev. 2000, 19, 55–68. [Google Scholar] [CrossRef] [Green Version]
- Efron, B.; Tibshirani, R.J. An Introdution to the Bootstrap; Chapman&Hall: Boca Raton, FL, USA; London, UK; New York, NY, USA; Washington, DC, USA, 1993. [Google Scholar]
- Bielecki, S.; Skoczkowski, T. An enhanced concept of Q-power management. Energy 2018, 162, 335–353. [Google Scholar] [CrossRef]
- Ozimek, A. The Future of Remote Work. SSRN Electron. J. 2020. Available online: https://papers.ssrn.com/sol3/papers.cfm?abstract_id=3638597 (accessed on 12 February 2021). [CrossRef]
- Rana, A.; Perera, P.; Ruparathna, R.; Karunathilake, H.; Hewage, K.; Alam, M.S.; Sadiq, R. Occupant-based energy upgrades selection for Canadian residential buildings based on field energy data and calibrated simulations. J. Clean. Prod. 2020, 271, 122430. [Google Scholar] [CrossRef]
- Wang, B.; Liu, Y.; Qian, J.; Parker, S.K. Achieving Effective Remote Working During the COVID-19 Pandemic: A Work Design Perspective. Appl. Psychol. 2021, 70, 16–59. [Google Scholar] [CrossRef]
- Why the Future of Work Might Be ‘Hybrid’. Available online: https://www.bbc.com/worklife/article/20200824-why-the-future-of-work-might-be-hybrid (accessed on 15 November 2020).
- Golušin, M.; Dodić, S.; Popov, S. Chapter 2-Energy and Sustainable Development. In Sustainable Energy Management; Golušin, M., Dodić, S., Popov, S., Eds.; Academic Press Inc.: Cambridge, MA, USA, 2013; pp. 7–57. ISBN 9780124159785. [Google Scholar]
- European Commission. A Framework Strategy for a Resilient Energy Union with a Forward-Looking Climate Change Policy; 25.2.2015 COM(2015) 80 Final; European Commission: Brussels, Belgium, 2015. [Google Scholar]
- European Commission Clean Energy for All Europeans. Available online: https://ec.europa.eu/energy/en/topics/energy-strategy-and-energy-union/clean-energy-all-europeans (accessed on 1 July 2018).
- Hosseini, S.E. An outlook on the global development of renewable and sustainable energy at the time of COVID-19. Energy Res. Soc. Sci. 2020, 68, 101633. [Google Scholar] [CrossRef]
- Ozili, P.K. Impact of digital finance on financial inclusion and stability. Borsa Istanb. Rev. 2018, 18, 329–340. [Google Scholar] [CrossRef]
- Raza, N.; Akbar, M.Q.; Soofi, A.A.; Akbar, S. Study of Smart Grid Communication Network Architectures and Technologies. J. Comput. Commun. 2019, 7, 19–29. [Google Scholar] [CrossRef] [Green Version]
- Verschae, R.; Kato, T.; Matsuyama, T. Energy Management in Prosumer Communities: A Coordinated Approach. Energies 2016, 9, 562. [Google Scholar] [CrossRef]
- Matsukawa, I.; Kakimoto, H.A.A.H. Household Response to Incentive Payments for Load Shifting: A Japanese Time-of-Day Electricity Pricing Experiment. Energy J. 2000, 21, 21. [Google Scholar] [CrossRef] [Green Version]
- Nakano, S.; Washizu, A. On the Acceptability of Electricity Demand Side Management by Time of Day. Energies 2020, 13, 3665. [Google Scholar] [CrossRef]
- Sisodiya, S.; Kumbhar, G.B. Demand-Side Resources for Electric Energy Management. In Proceedings of the 2018 4th International Conference on Electrical Energy Systems (ICEES), Chennai, India, 7–9 February 2018; pp. 20–25. [Google Scholar]
- Bel, C.Á.; Ortega, M.A.; Escrivá, G.E.; Marín, A.G. Technical and economical tools to assess customer demand response in the commercial sector. Energy Convers. Manag. 2009, 50, 2605–2612. [Google Scholar] [CrossRef] [Green Version]
- Tzovaras, D.; Damousis, I.; Papanikolaou, A.; Pitsiladis, G.; Barbagelata, G. DRIMPAC—Unified Demand Response Interoperability Framework Enabling Market Participation of Active Energy Consumers. Proceedings 2019, 20, 15. [Google Scholar] [CrossRef] [Green Version]
- Goulden, M.; Spence, A.; Wardman, J.; Leygue, C. Differentiating ‘the user’ in DSR: Developing demand side response in advanced economies. Energy Policy 2018, 122, 176–185. [Google Scholar] [CrossRef]
- Darby, S.J. Demand response and smart technology in theory and practice: Customer experiences and system actors. Energy Policy 2020, 143, 111573. [Google Scholar] [CrossRef]
- Yamaguchi, Y.; Chen, C.-F.; Shimoda, Y.; Yagita, Y.; Iwafune, Y.; Ishii, H.; Hayashi, Y. An integrated approach of estimating demand response flexibility of domestic laundry appliances based on household heterogeneity and activities. Energy Policy 2020, 142, 1–12. [Google Scholar] [CrossRef]
- Torstensson, D.; Wallin, F. Potential and Barriers for Demand Response at Household Customers. Energy Procedia 2015, 75, 1189–1196. [Google Scholar] [CrossRef] [Green Version]
- Güner, S.; Erenoğlu, A.K.; Şengör, I.; Erdinç, O.; Catalão, J.P.S. Effects of On-Site PV Generation and Residential Demand Response on Distribution System Reliability. Appl. Sci. 2020, 10, 7062. [Google Scholar] [CrossRef]
- Noga, M.; Ożadowicz, A.; Grela, J.; Hayduk, G. Active Consumers in Smart Grid Systems-Applications of the Building Automation Technologies. Przegląd Elektrotechniczny 2013, 89, 227–233. [Google Scholar]
- Hu, Y.-C.; Lin, Y.-H.; Lin, C.-H. Artificial Intelligence, Accelerated in Parallel Computing and Applied to Nonintrusive Appliance Load Monitoring for Residential Demand-Side Management in a Smart Grid: A Comparative Study. Appl. Sci. 2020, 10, 8114. [Google Scholar] [CrossRef]
- Ullah, I.; Rasheed, M.B.; Alquthami, T.; Tayyaba, S. A Residential Load Scheduling with the Integration of On-Site PV and Energy Storage Systems in Micro-Grid. Sustainability 2019, 12, 184. [Google Scholar] [CrossRef] [Green Version]
- Walker, I.; Hope, A. Householders’ readiness for demand-side response: A qualitative study of how domestic tasks might be shifted in time. Energy Build. 2020, 215, 109888. [Google Scholar] [CrossRef] [Green Version]
- Skoczkowski, T.; Bielecki, S.; Wojtyńska, J. Long-Term Projection of Renewable Energy Technology Diffusion. Energies 2019, 12, 4261. [Google Scholar] [CrossRef] [Green Version]
- Heesen, H.T.; Herbort, V.; Rumpler, M. Performance of roof-top PV systems in Germany from 2012 to 2018. Sol. Energy 2019, 194, 128–135. [Google Scholar] [CrossRef]
- Gullbrekken, L.; Kvande, T.; Time, B. Roof-integrated PV in Nordic Climate-Building Physical Challenges. Energy Procedia 2015, 78, 1962–1967. [Google Scholar] [CrossRef] [Green Version]
- Galvin, R. I’ll follow the sun: Geo-sociotechnical constraints on prosumer households in Germany. Energy Res. Soc. Sci. 2020, 65, 101455. [Google Scholar] [CrossRef]
- Huang, P.; Lovati, M.; Zhang, X.; Bales, C.; Hallbeck, S.; Becker, A.; Bergqvist, H.; Hedberg, J.; Maturi, L. Transforming a residential building cluster into electricity prosumers in Sweden: Optimal design of a coupled PV-heat pump-thermal storage-electric vehicle system. Appl. Energy 2019, 255, 113864. [Google Scholar] [CrossRef]
- Baumann, T.; Nussbaumer, H.; Klenk, M.; Dreisiebner, A.; Carigiet, F.; Baumgartner, F. Photovoltaic systems with vertically mounted bifacial PV modules in combination with green roofs. Sol. Energy 2019, 190, 139–146. [Google Scholar] [CrossRef]
- Hernández, J.; Sanchez-Sutil, F.; Muñoz-Rodríguez, F.; Baier, C. Optimal sizing and management strategy for PV household-prosumers with self-consumption/sufficiency enhancement and provision of frequency containment reserve. Appl. Energy 2020, 277, 115529. [Google Scholar] [CrossRef]
- Skoczkowski, T.; Bielecki, S.; Węglarz, A.; Włodarczak, M.; Gutowski, P. Impact assessment of climate policy on Poland’s power sector. Mitig. Adapt. Strat. Glob. Chang. 2018, 23, 1303–1349. [Google Scholar] [CrossRef] [PubMed] [Green Version]
- The European Parliament and the Council of the European Union. Regulation (EU) 2019/2088 of the European Parliament and of the Council of 27 November 2019 on Sustainability-related Disclosures in the Financial Services Sector; The European Parliament and the Council of the European Union: 2019. Available online: https://eur-lex.europa.eu/eli/reg/2019/2088/oj (accessed on 12 February 2021).
- Brown, D.; Hall, S.; Davis, M.E. What is prosumerism for? Exploring the normative dimensions of decentralised energy transitions. Energy Res. Soc. Sci. 2020, 66, 101475. [Google Scholar] [CrossRef]
- European Commission. European Commission Report from the Commission to the European Parliament, the Council, the European Economic and Social Committee and the Committee of the Regions Renewable Energy Progress Report; 14.10.2020 COM(2020) 952 Final; European Commission: Brussels, Belgium, 2020. [Google Scholar]
- World Economic Forum COVID-19 Is a Game-Changer for Renewable Energy. Here’s Why. Available online: https://www.weforum.org/agenda/2020/06/covid-19-is-a-game-changer-for-renewable-energy/ (accessed on 20 December 2020).
- Gold, R.; Hodari, D. Coronavirus Pandemic Speeds Shift to Cleaner Energy. The Wall Street Journal, 13 October 2020. Available online: https://www.wsj.com/articles/coronavirus-pandemic-speeds-shift-to-cleaner-energy-11602561601(accessed on 18 December 2020).
- Tsao, Y.-C.; Thanh, V.-V.; Lu, J.-C.; Wei, H.-H. A risk-sharing-based resilient renewable energy supply network model under the COVID-19 pandemic. Sustain. Prod. Consum. 2021, 25, 484–498. [Google Scholar] [CrossRef]
- Ghazvini, M.A.F.; Soares, J.; Abrishambaf, O.; Castro, R.; Vale, Z. Demand response implementation in smart households. Energy Build. 2017, 143, 129–148. [Google Scholar] [CrossRef] [Green Version]
- Ivanov, O.; Chattopadhyay, S.; Banerjee, S.; Neagu, B.-C.; Grigoras, G.; Gavrilas, M. A Novel Algorithm with Multiple Consumer Demand Response Priorities in Residential Unbalanced LV Electricity Distribution Networks. Mathematics 2020, 8, 1220. [Google Scholar] [CrossRef]
- Chen, C.-F.; De Rubens, G.Z.; Xu, X.; Li, J. Coronavirus comes home? Energy use, home energy management, and the social-psychological factors of COVID-19. Energy Res. Soc. Sci. 2020, 68, 101688. [Google Scholar] [CrossRef] [PubMed]
- Zanocco, C.; Flora, J.; Rajagopal, R.; Boudet, H. Exploring the effects of California’s COVID-19 shelter-in-place order on household energy practices and intention to adopt smart home technologies. Renew. Sustain. Energy Rev. 2020, 139, 110578. [Google Scholar] [CrossRef]
- Andoni, M.; Robu, V.; Flynn, D.; Abram, S.; Geach, D.; Jenkins, D.; McCallum, P.; Peacock, A. Blockchain technology in the energy sector: A systematic review of challenges and opportunities. Renew. Sustain. Energy Rev. 2019, 100, 143–174. [Google Scholar] [CrossRef]
- Ahl, A.; Yarime, M.; Tanaka, K.; Sagawa, D. Review of blockchain-based distributed energy: Implications for institutional development. Renew. Sustain. Energy Rev. 2019, 107, 200–211. [Google Scholar] [CrossRef]
- Esmat, A.; De Vos, M.; Ghiassi-Farrokhfal, Y.; Palensky, P.; Epema, D. A novel decentralized platform for peer-to-peer energy trading market with blockchain technology. Appl. Energy 2021, 282, 116123. [Google Scholar] [CrossRef]
- Meeuw, A.; Schopfer, S.; Wörner, A.; Tiefenbeck, V.; Ableitner, L.; Fleisch, E.; Wortmann, F. Implementing a blockchain-based local energy market: Insights on communication and scalability. Comput. Commun. 2020, 160, 158–171. [Google Scholar] [CrossRef]
- Teufel, B.; Sentic, A.; Barmet, M. Blockchain energy: Blockchain in future energy systems. J. Electron. Sci. Technol. 2019, 17, 100011. [Google Scholar] [CrossRef]
- Petri, I.; Barati, M.; Rezgui, Y.; Rana, O.F. Blockchain for energy sharing and trading in distributed prosumer communities. Comput. Ind. 2020, 123, 103282. [Google Scholar] [CrossRef]
- Hu, W.; Li, H. A blockchain-based secure transaction model for distributed energy in Industrial Internet of Things. Alex. Eng. J. 2021, 60, 491–500. [Google Scholar] [CrossRef]
- Diestelmeier, L. Changing power: Shifting the role of electricity consumers with blockchain technology–Policy implications for EU electricity law. Energy Policy 2019, 128, 189–196. [Google Scholar] [CrossRef]
- Adeyemi, A.; Yan, M.; Shahidehpour, M.; Botero, C.; Guerra, A.V.; Gurung, N.; Zhang, L.; Paaso, A. Blockchain technology applications in power distribution systems. Electr. J. 2020, 33, 106817. [Google Scholar] [CrossRef]
- Patsonakis, C.; Terzi, S.; Moschos, I.; Ioannidis, D.; Votis, K.; Tzovaras, D. Permissioned Blockchains and Virtual Nodes for Reinforcing Trust Between Aggregators and Prosumers in Energy Demand Response Scenarios. In Proceedings of the 2019 IEEE International Conference on Environment and Electrical Engineering and 2019 IEEE Industrial and Commercial Power Systems Europe (EEEIC/I&CPS Europe), Genoa, Italy, 11–14 June 2019; pp. 1–6. [Google Scholar]
- Ahl, A.; Yarime, M.; Goto, M.; Chopra, S.S.; Kumar, N.M.; Tanaka, K.; Sagawa, D. Exploring blockchain for the energy transition: Opportunities and challenges based on a case study in Japan. Renew. Sustain. Energy Rev. 2020, 117, 109488. [Google Scholar] [CrossRef]
- Marinakis, V.; Doukas, H.; Koasidis, K.; AlBuflasa, H. From Intelligent Energy Management to Value Economy through a Digital Energy Currency: Bahrain City Case Study. Sensors 2020, 20, 1456. [Google Scholar] [CrossRef] [PubMed] [Green Version]
- European Central Bank the Future of Money–Innovating While Retaining Trust. Available online: https://www.ecb.europa.eu/press/inter/date/2020/html/ecb.in201130~ce64cb35a3.en.html (accessed on 30 December 2020).
- The Library of Congress Chronicling America. Available online: https://chroniclingamerica.loc.gov/lccn/sn83030214/1921-12-04/ed-1/seq-1/ (accessed on 30 December 2020).
- Collins, J.R.; Schuster, L.; Greenham, T. Energising Money. An Introduction to Energy Currencies and Accounting. 2013. Available online: https://b.3cdn.net/nefoundation/d5efb739f3fb9a137c_q2m6y7916.pdf (accessed on 4 January 2021).
- Schinckus, C.; Nguyen, C.P.; Ling, F.C.H. Crypto-currencies trading and energy consumption. Int. J. Energy Econ. Policy 2020, 10, 355–364. [Google Scholar] [CrossRef]
- Mihaylov, M.; Jurado, S.; Avellana, N.; Van Moffaert, K.; De Abril, I.M.; Nowe, A. NRGcoin: Virtual currency for trading of renewable energy in smart grids. In Proceedings of the 11th International Conference on the European Energy Market (EEM14), Kraków, Poland, 28–30 May 2014; pp. 1–6. [Google Scholar]
- Association of Polish Electrical Engineers. Instalacje Elektryczne w Obiektach Budowlanych; N SEP-E-002, Instalacje Elektryczne w Budynkach Mieszkalnych, Podstawy Planowania; Association of Polish Electrical Engineers: Warsaw, Poland, 2003. (In Polish) [Google Scholar]
- Fell, M.J.; Pagel, L.; Chen, C.-F.; Goldberg, M.H.; Herberz, M.; Huebner, G.M.; Sareen, S.; Hahnel, U.J. Validity of energy social research during and after COVID-19: Challenges, considerations, and responses. Energy Res. Soc. Sci. 2020, 68, 101646. [Google Scholar] [CrossRef] [PubMed]
Figure 1.
Timeline with the dates of introducing significant restrictions for Polish residents during the national quarantine (lockdown) period during the first wave of the COVID-19 pandemic in 2020 and the recording period of measurement data used in the study.
Figure 1.
Timeline with the dates of introducing significant restrictions for Polish residents during the national quarantine (lockdown) period during the first wave of the COVID-19 pandemic in 2020 and the recording period of measurement data used in the study.

Figure 2.
Histograms of the active power peaks registered in users during (a) 2018 and (b) the lockdown in 2020.
Figure 2.
Histograms of the active power peaks registered in users during (a) 2018 and (b) the lockdown in 2020.

Figure 3.
Histograms of apparent power peaks registered in users during (a) 2018 and (b) the lockdown in 2020.
Figure 3.
Histograms of apparent power peaks registered in users during (a) 2018 and (b) the lockdown in 2020.

Figure 4.
Maximum values of active power (a) and apparent power (b) that occurred in the analysed periods in the analysed group of users in the following 1-h intervals: lockdown 2020—red lines; the same period of 2018—blue lines.
Figure 4.
Maximum values of active power (a) and apparent power (b) that occurred in the analysed periods in the analysed group of users in the following 1-h intervals: lockdown 2020—red lines; the same period of 2018—blue lines.


Figure 5.
Histograms of the peak loads with active power during the lockdown and the analogous period in 2018.
Figure 5.
Histograms of the peak loads with active power during the lockdown and the analogous period in 2018.

Figure 6.
Histograms of the apparent peak loads during the lockdown and analogous period in 2018.

Figure 7.
Histograms of peak load hour of active power during the lockdown and the analogous period in 2018.
Figure 7.
Histograms of peak load hour of active power during the lockdown and the analogous period in 2018.

Figure 8.
Histograms of peak load hour of apparent power during the lockdown and the analogous period in 2018.
Figure 8.
Histograms of peak load hour of apparent power during the lockdown and the analogous period in 2018.

Figure 9.
Histograms of peak power duration, TPeak(period) values, over 815 h covering the same period as the lockdown of 2018 (a) and the 2020 lockdown (b), in percentages.
Figure 9.
Histograms of peak power duration, TPeak(period) values, over 815 h covering the same period as the lockdown of 2018 (a) and the 2020 lockdown (b), in percentages.

Figure 10.
Comparison of the apparent power peaks (designated as the 99 percentiles from bootstrap tests) in the node feeding the respective number of residential users—horizontal axis, pre-pandemic (2018); and lockdown—vertical axis on the left; the absolute difference between the pre-pandemic and lockdown 2020—vertical axis on the right; values in kVA.

Figure 11.
Comparison of apparent power peaks (determined as the averages and medians from bootstrap tests) in the node feeding the respective number of residential users—horizontal axis, during the lockdown; and before the pandemic (2018)—vertical axis on the left; the absolute difference between the pre-pandemic period and lockdown 2020—vertical axis on the right; values in kVA.

Figure 12.
Averaged profiles of the daily active power load of residential users on particular days of the week (averaged over 1-h intervals), based on the averaging of the set of dwellings, including the lockdown period in 2020 and the corresponding period of 2018: continuous lines present usage profiles, and points refer to standard deviations of values at a given hour of the day.


Figure 13.
Graphs of the average active energy consumption (a) and standard deviations (b) in the group of analysed dwellings over 815 h during the lockdown in 2020 (red lines) and in 2018 (blue lines).
Figure 13.
Graphs of the average active energy consumption (a) and standard deviations (b) in the group of analysed dwellings over 815 h during the lockdown in 2020 (red lines) and in 2018 (blue lines).


Figure 14.
The scattering diagram of the 1-h active energy load averaged over dwellings (in relation to the lockdown and the same period of 2018); one point represents one of the 815 h of the analysed periods, and the straight line corresponds to the relation y = x.
Figure 14.
The scattering diagram of the 1-h active energy load averaged over dwellings (in relation to the lockdown and the same period of 2018); one point represents one of the 815 h of the analysed periods, and the straight line corresponds to the relation y = x.

Figure 15.
Histogram of the absolute values of the differences between the average active energy consumption of the analysed group of dwellings during the 815 hours between the analogous period in 2018 and the lockdown in 2020 (negative values indicate a higher load during the lockdown than the analogous period in 2018).

Figure 16.
Differences between the average active energy consumption of the residential users in each of the 815 hours analysed, covering the same period in 2018 and the lockdown 2020 in terms of absolute (a) and percentage differences, relative to the average of the lockdown (b), ranked by the hour of the day (one point represents one of the 815 h analysed). The continuous red line represents the average of the points.

Figure 17.
Links between the aspects identified in the article related to lockdown experiences in the context of electricity use in dwellings.
Figure 17.
Links between the aspects identified in the article related to lockdown experiences in the context of electricity use in dwellings.


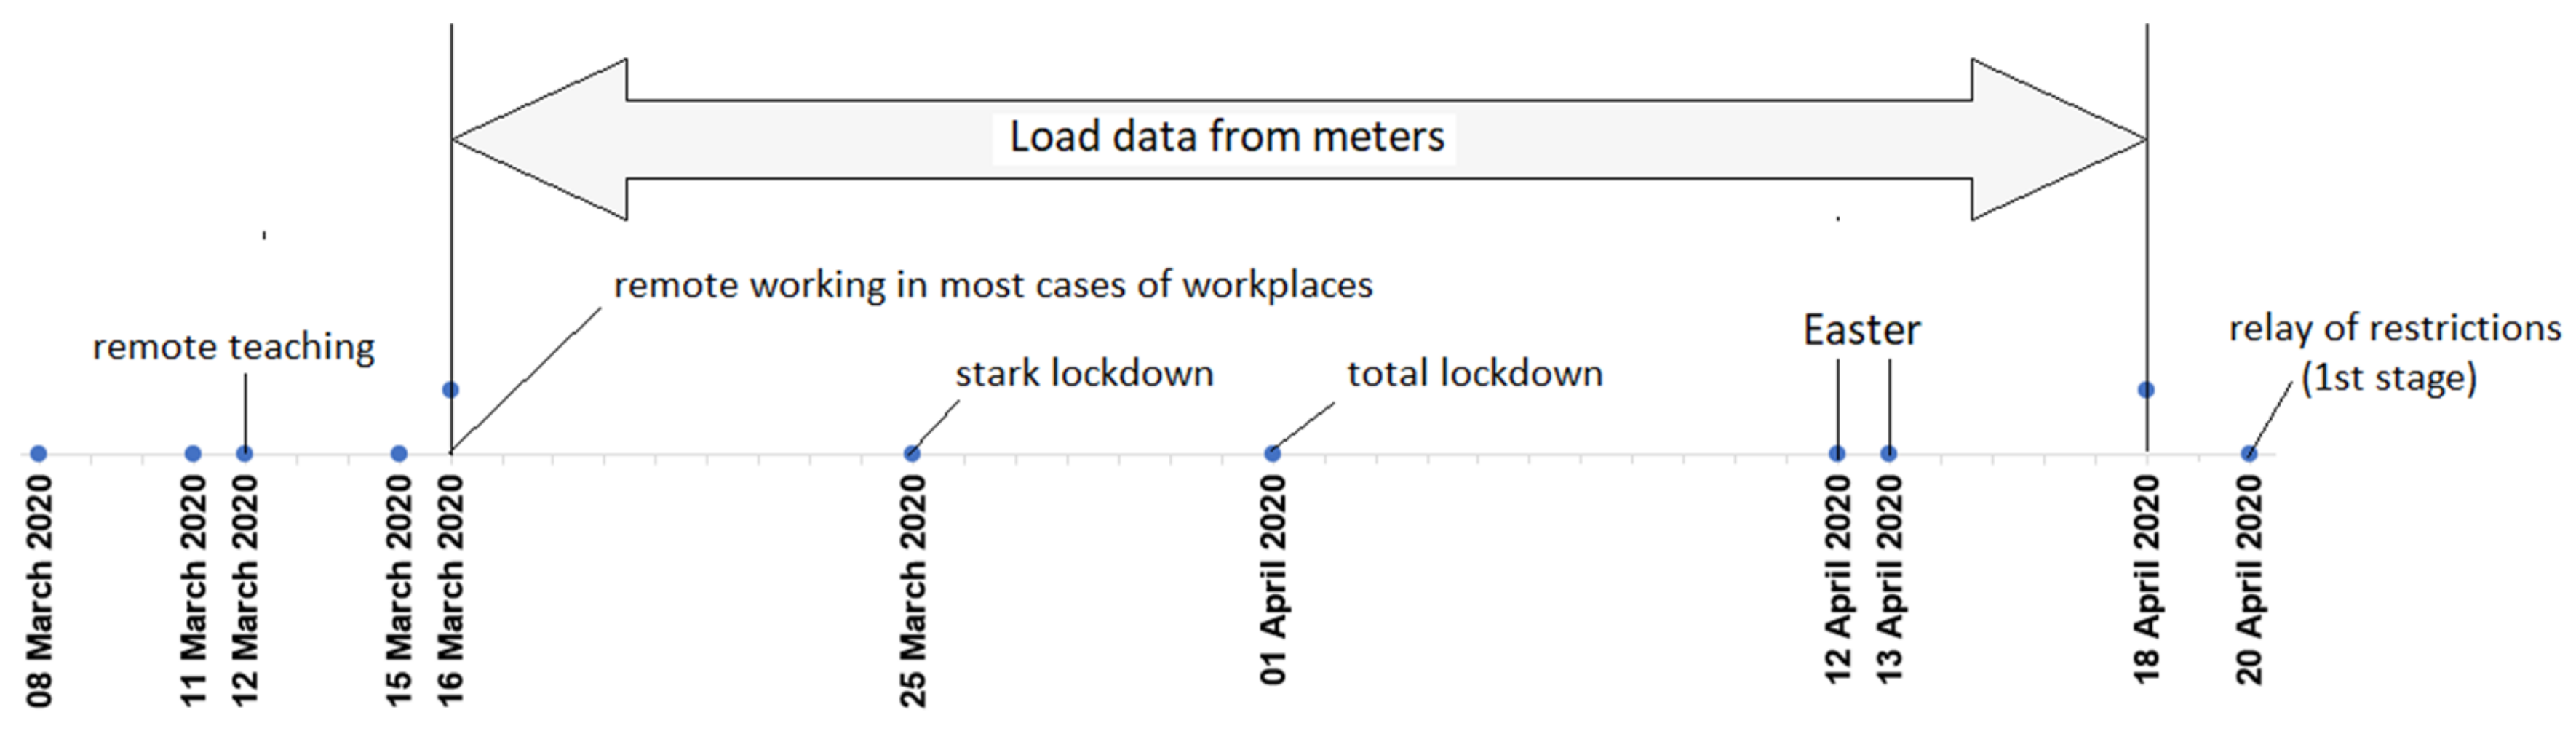
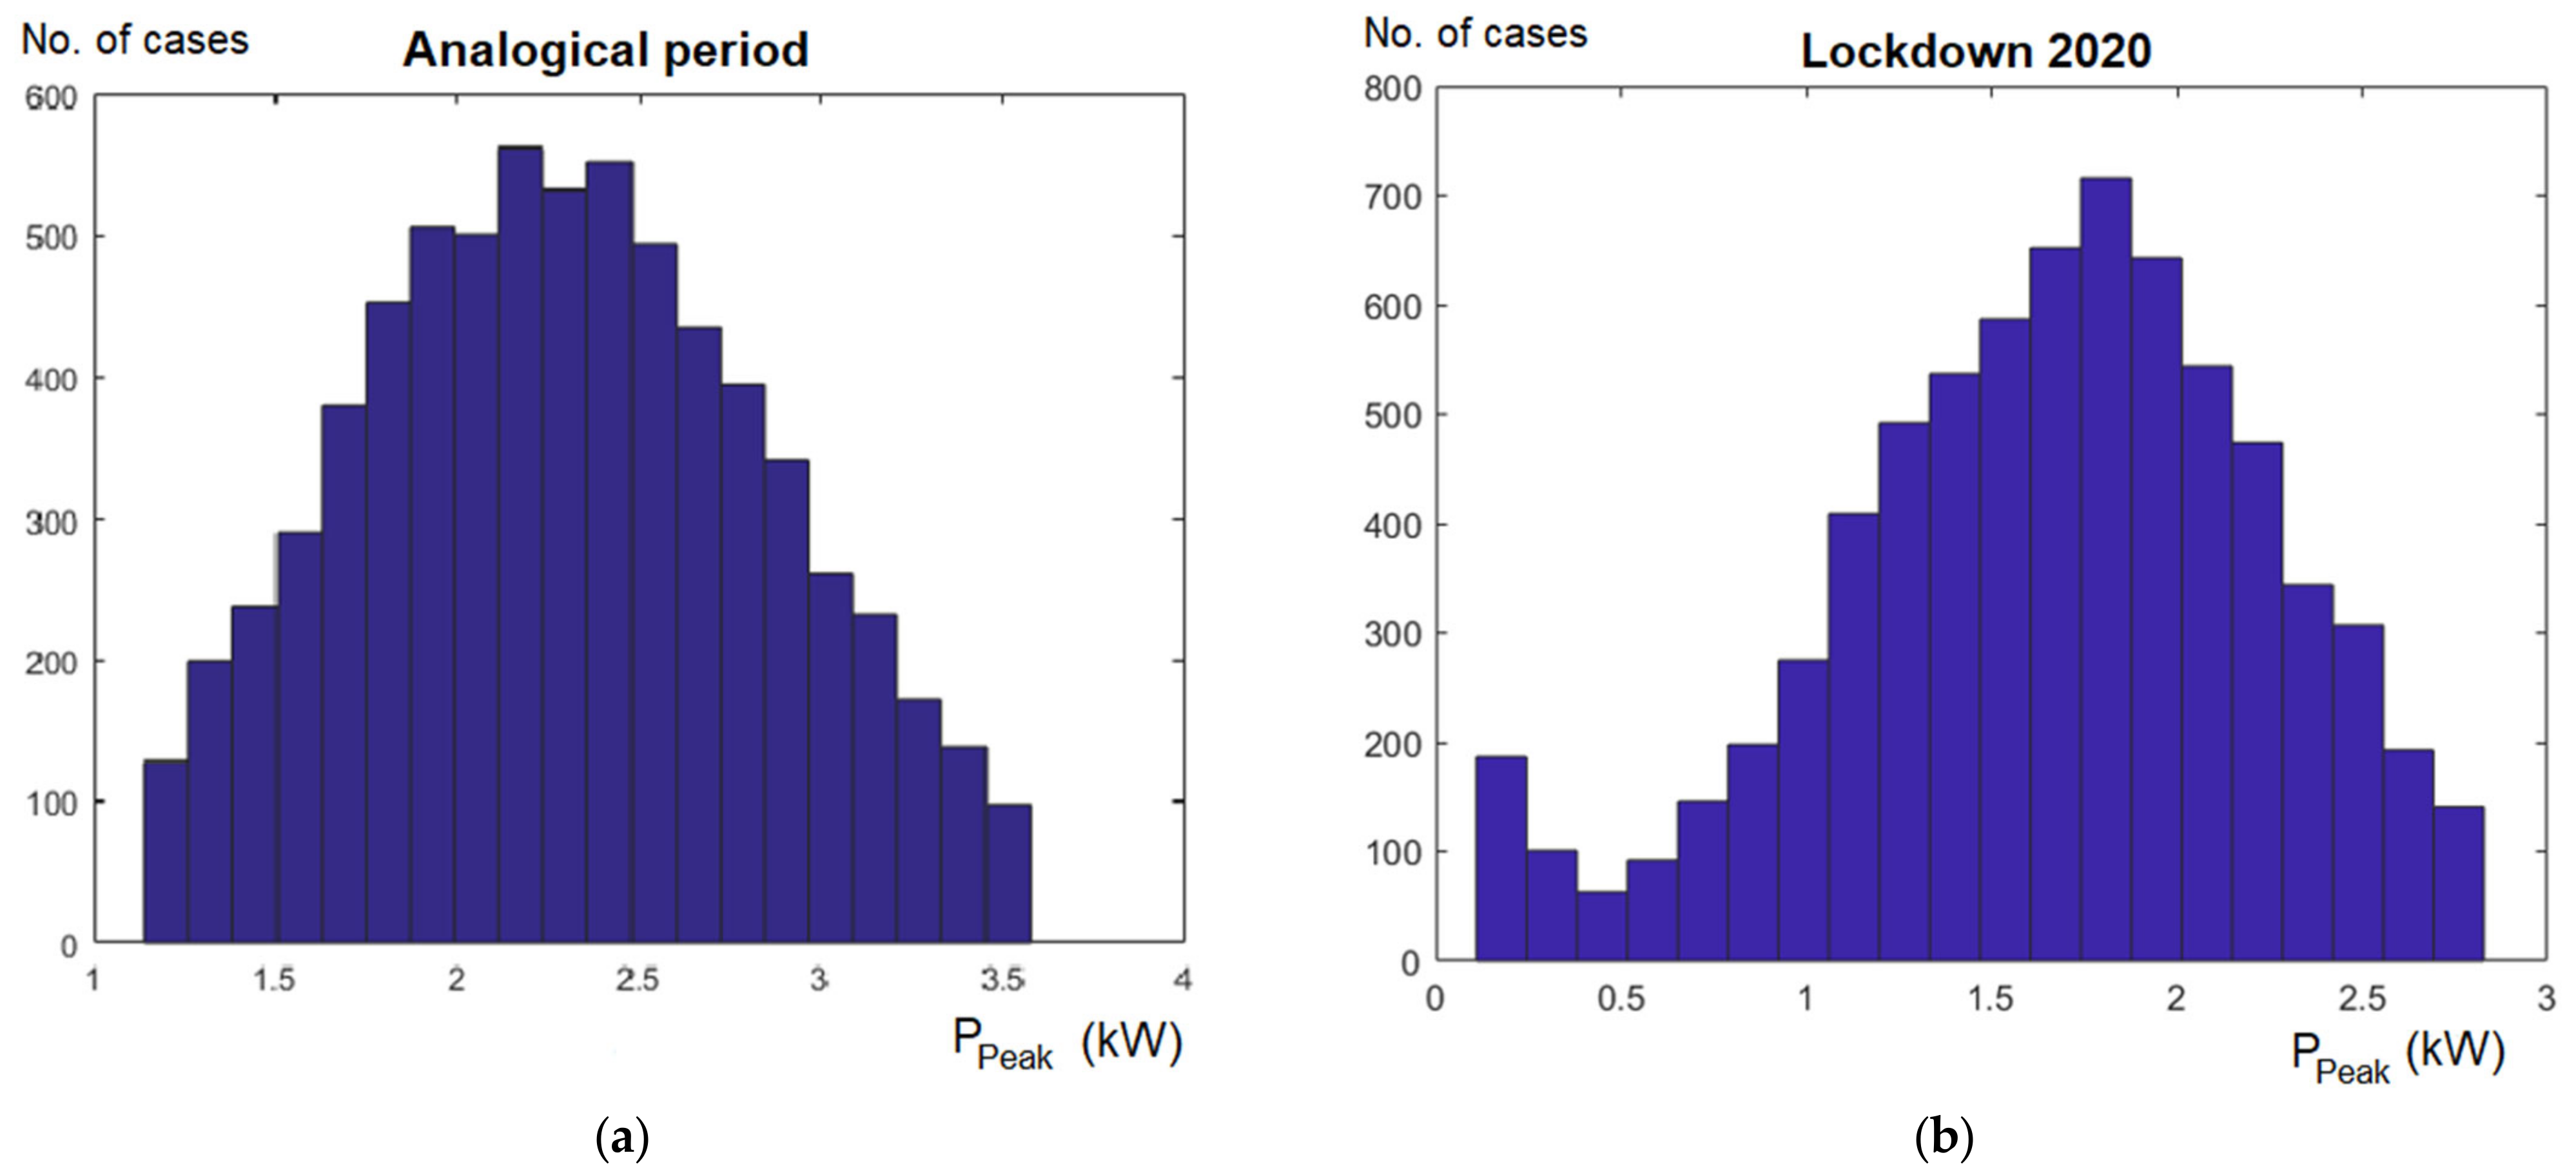
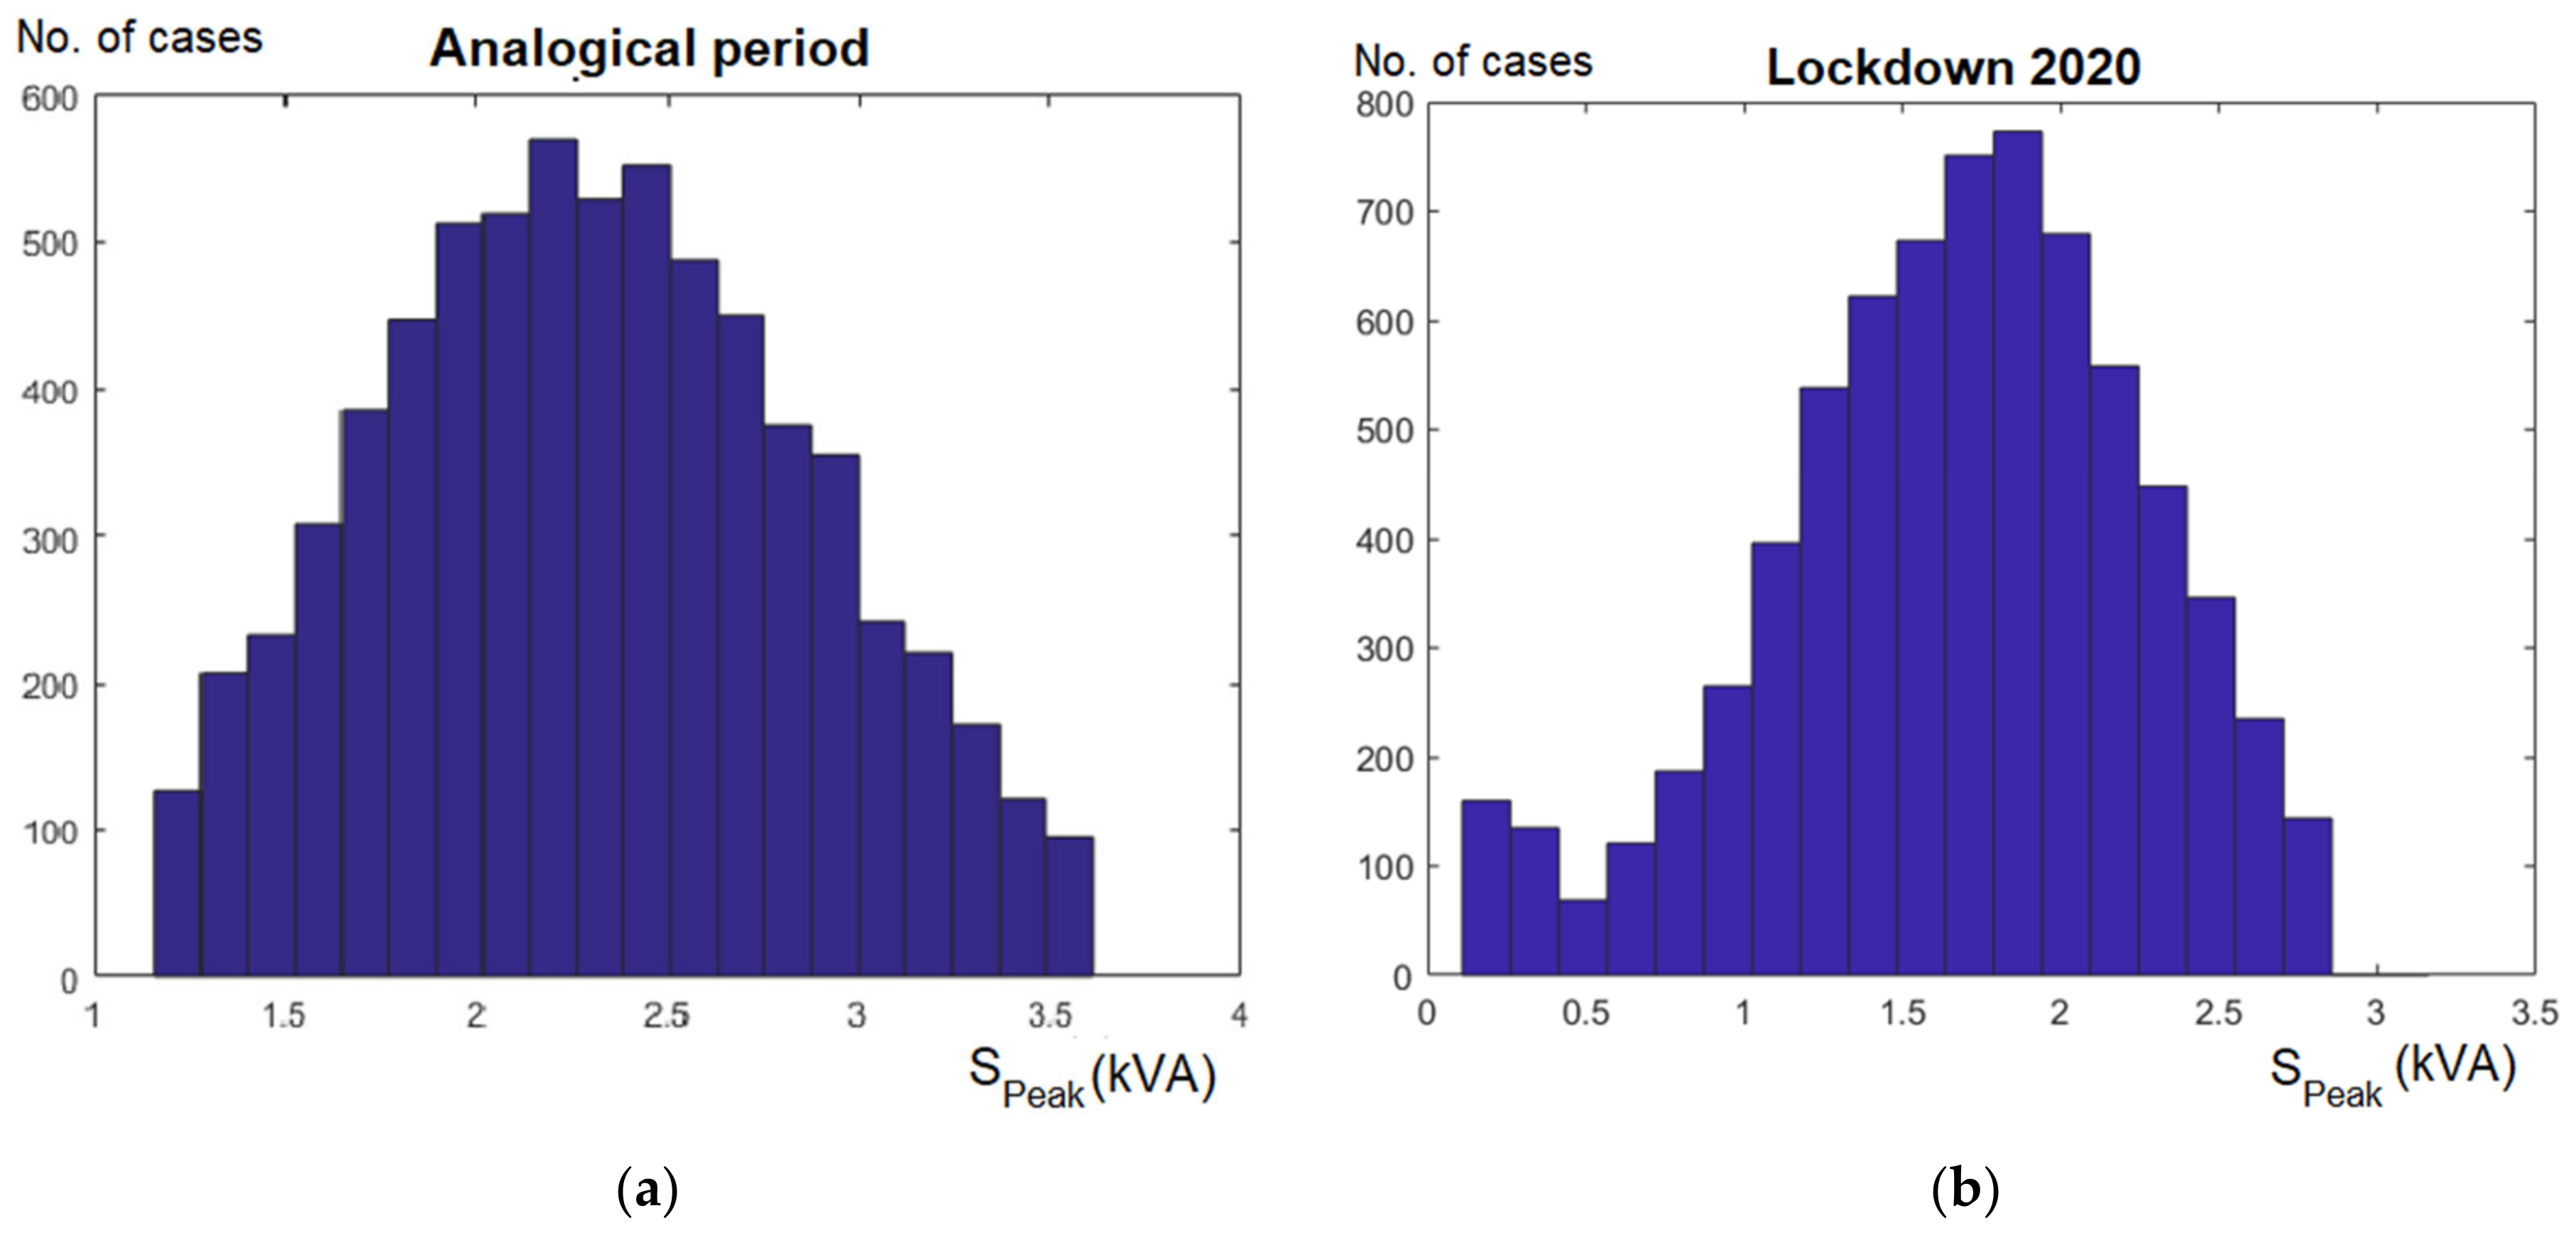
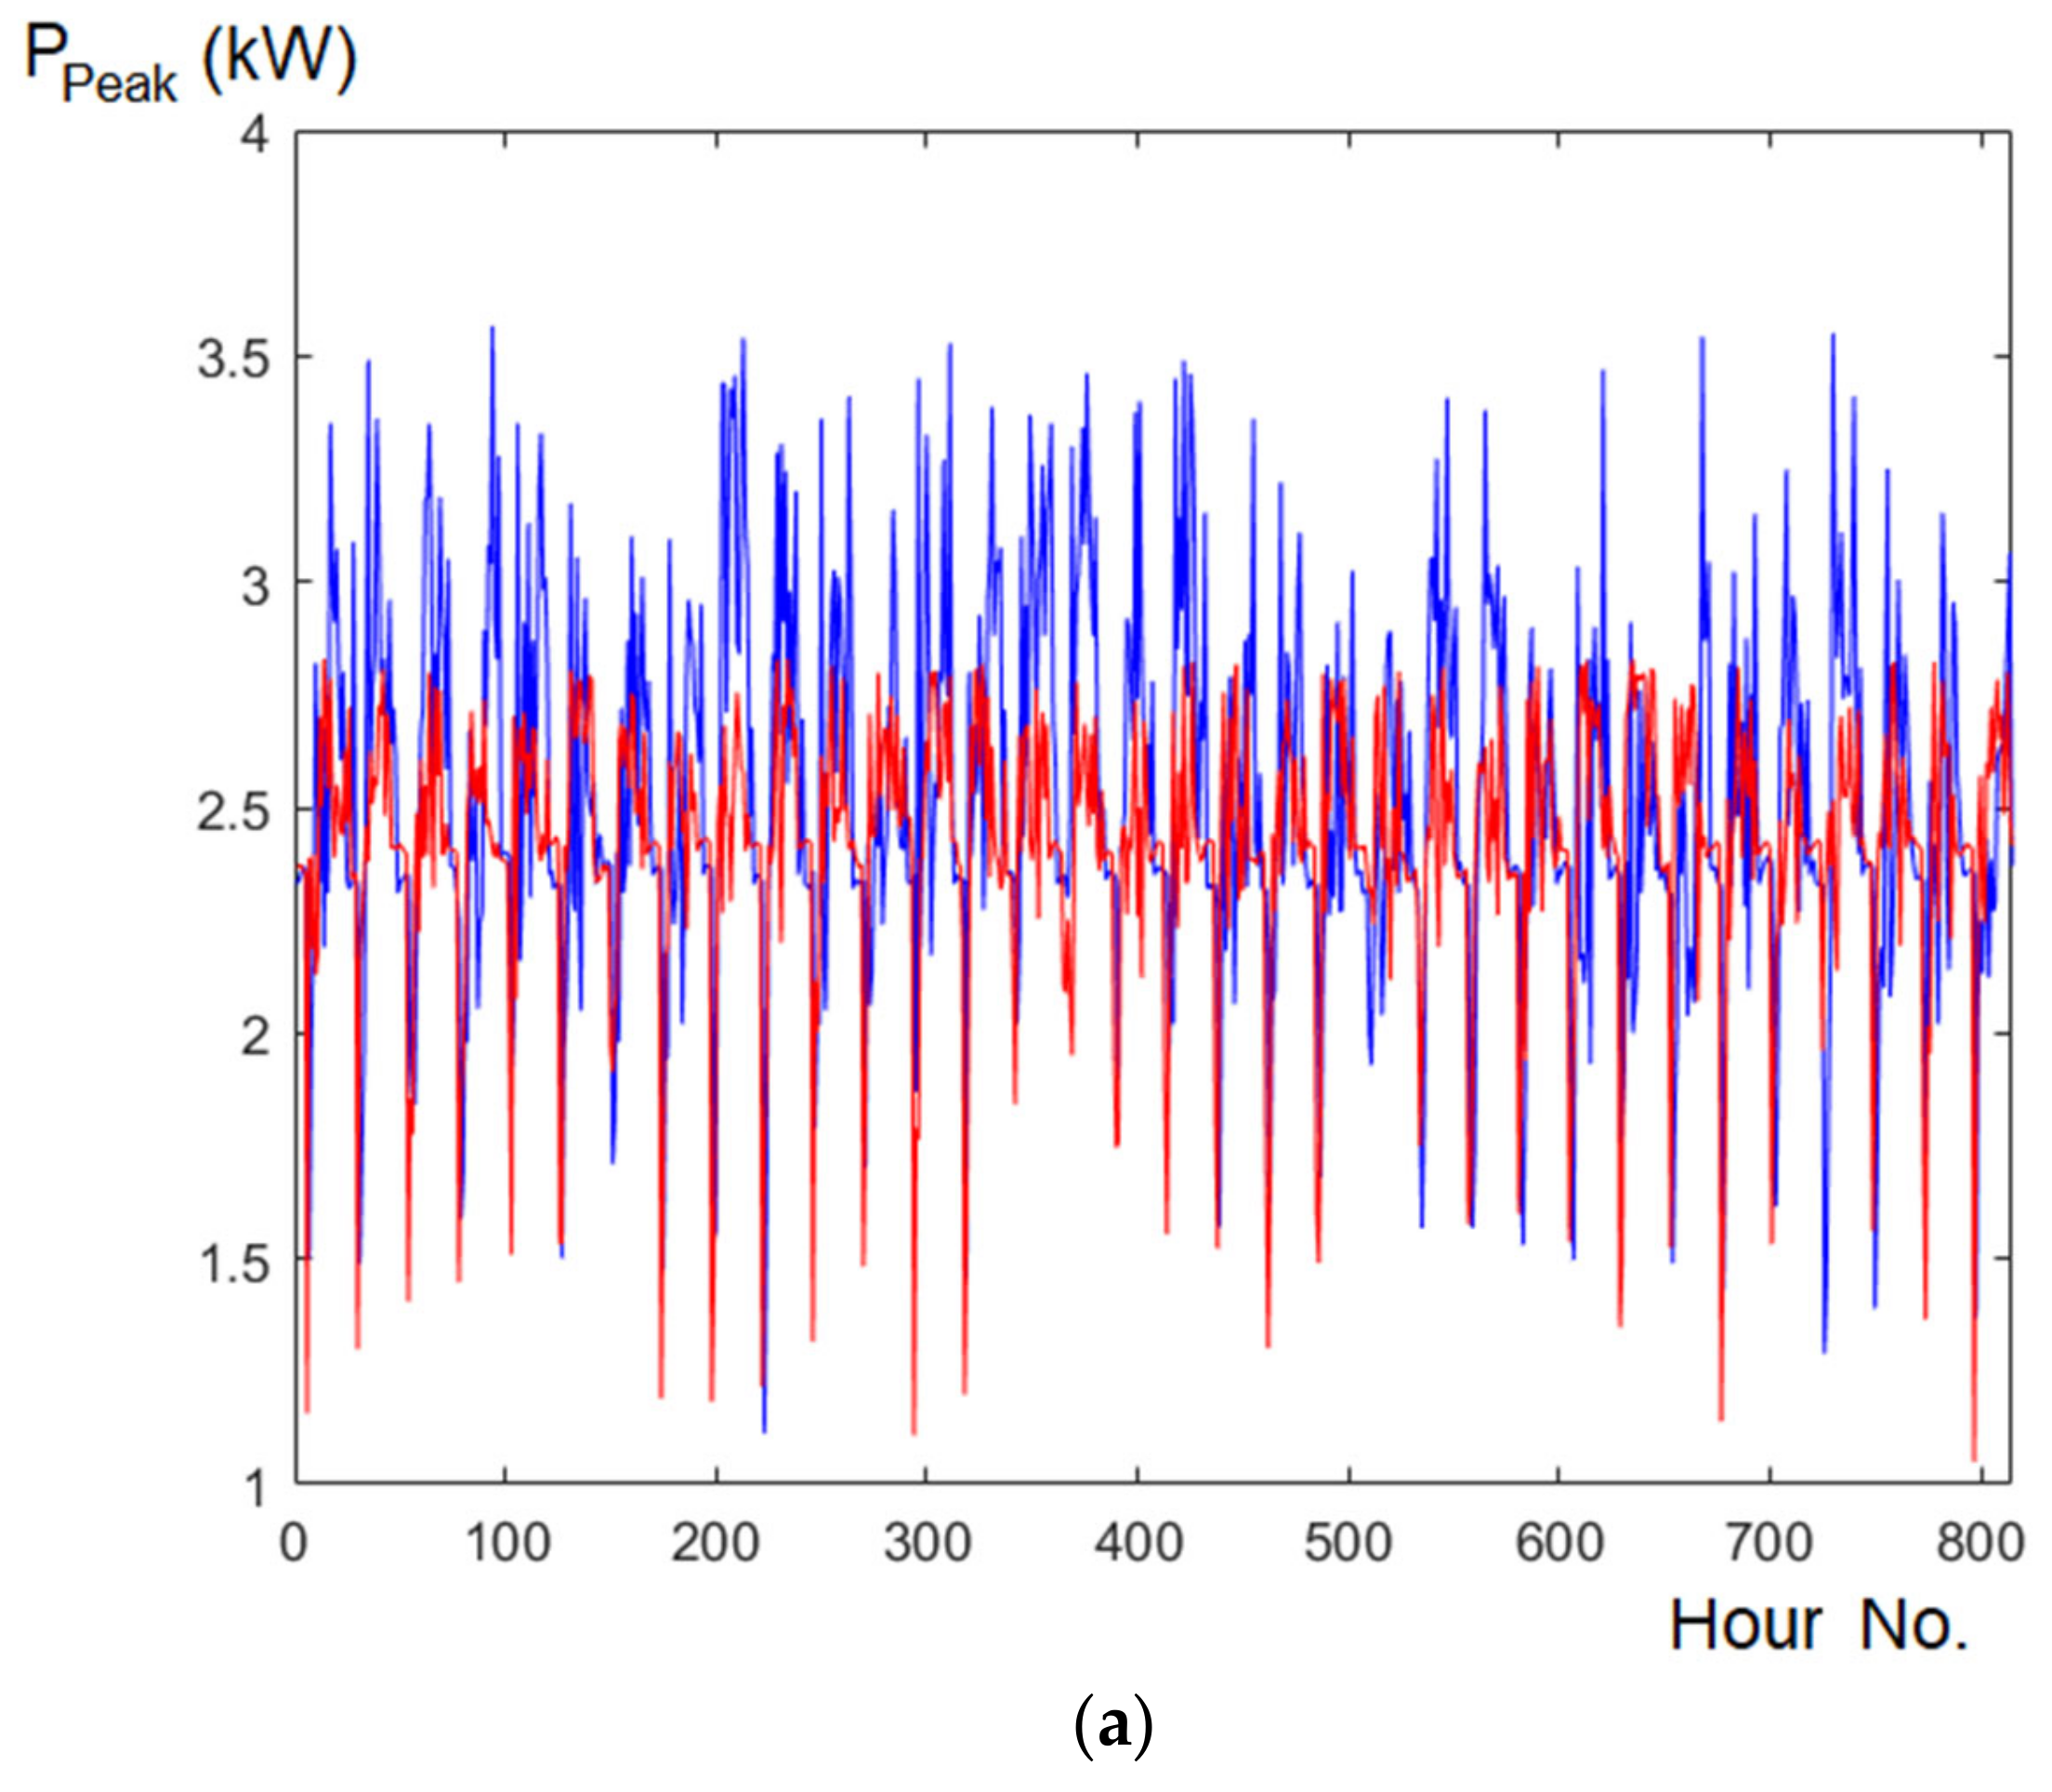
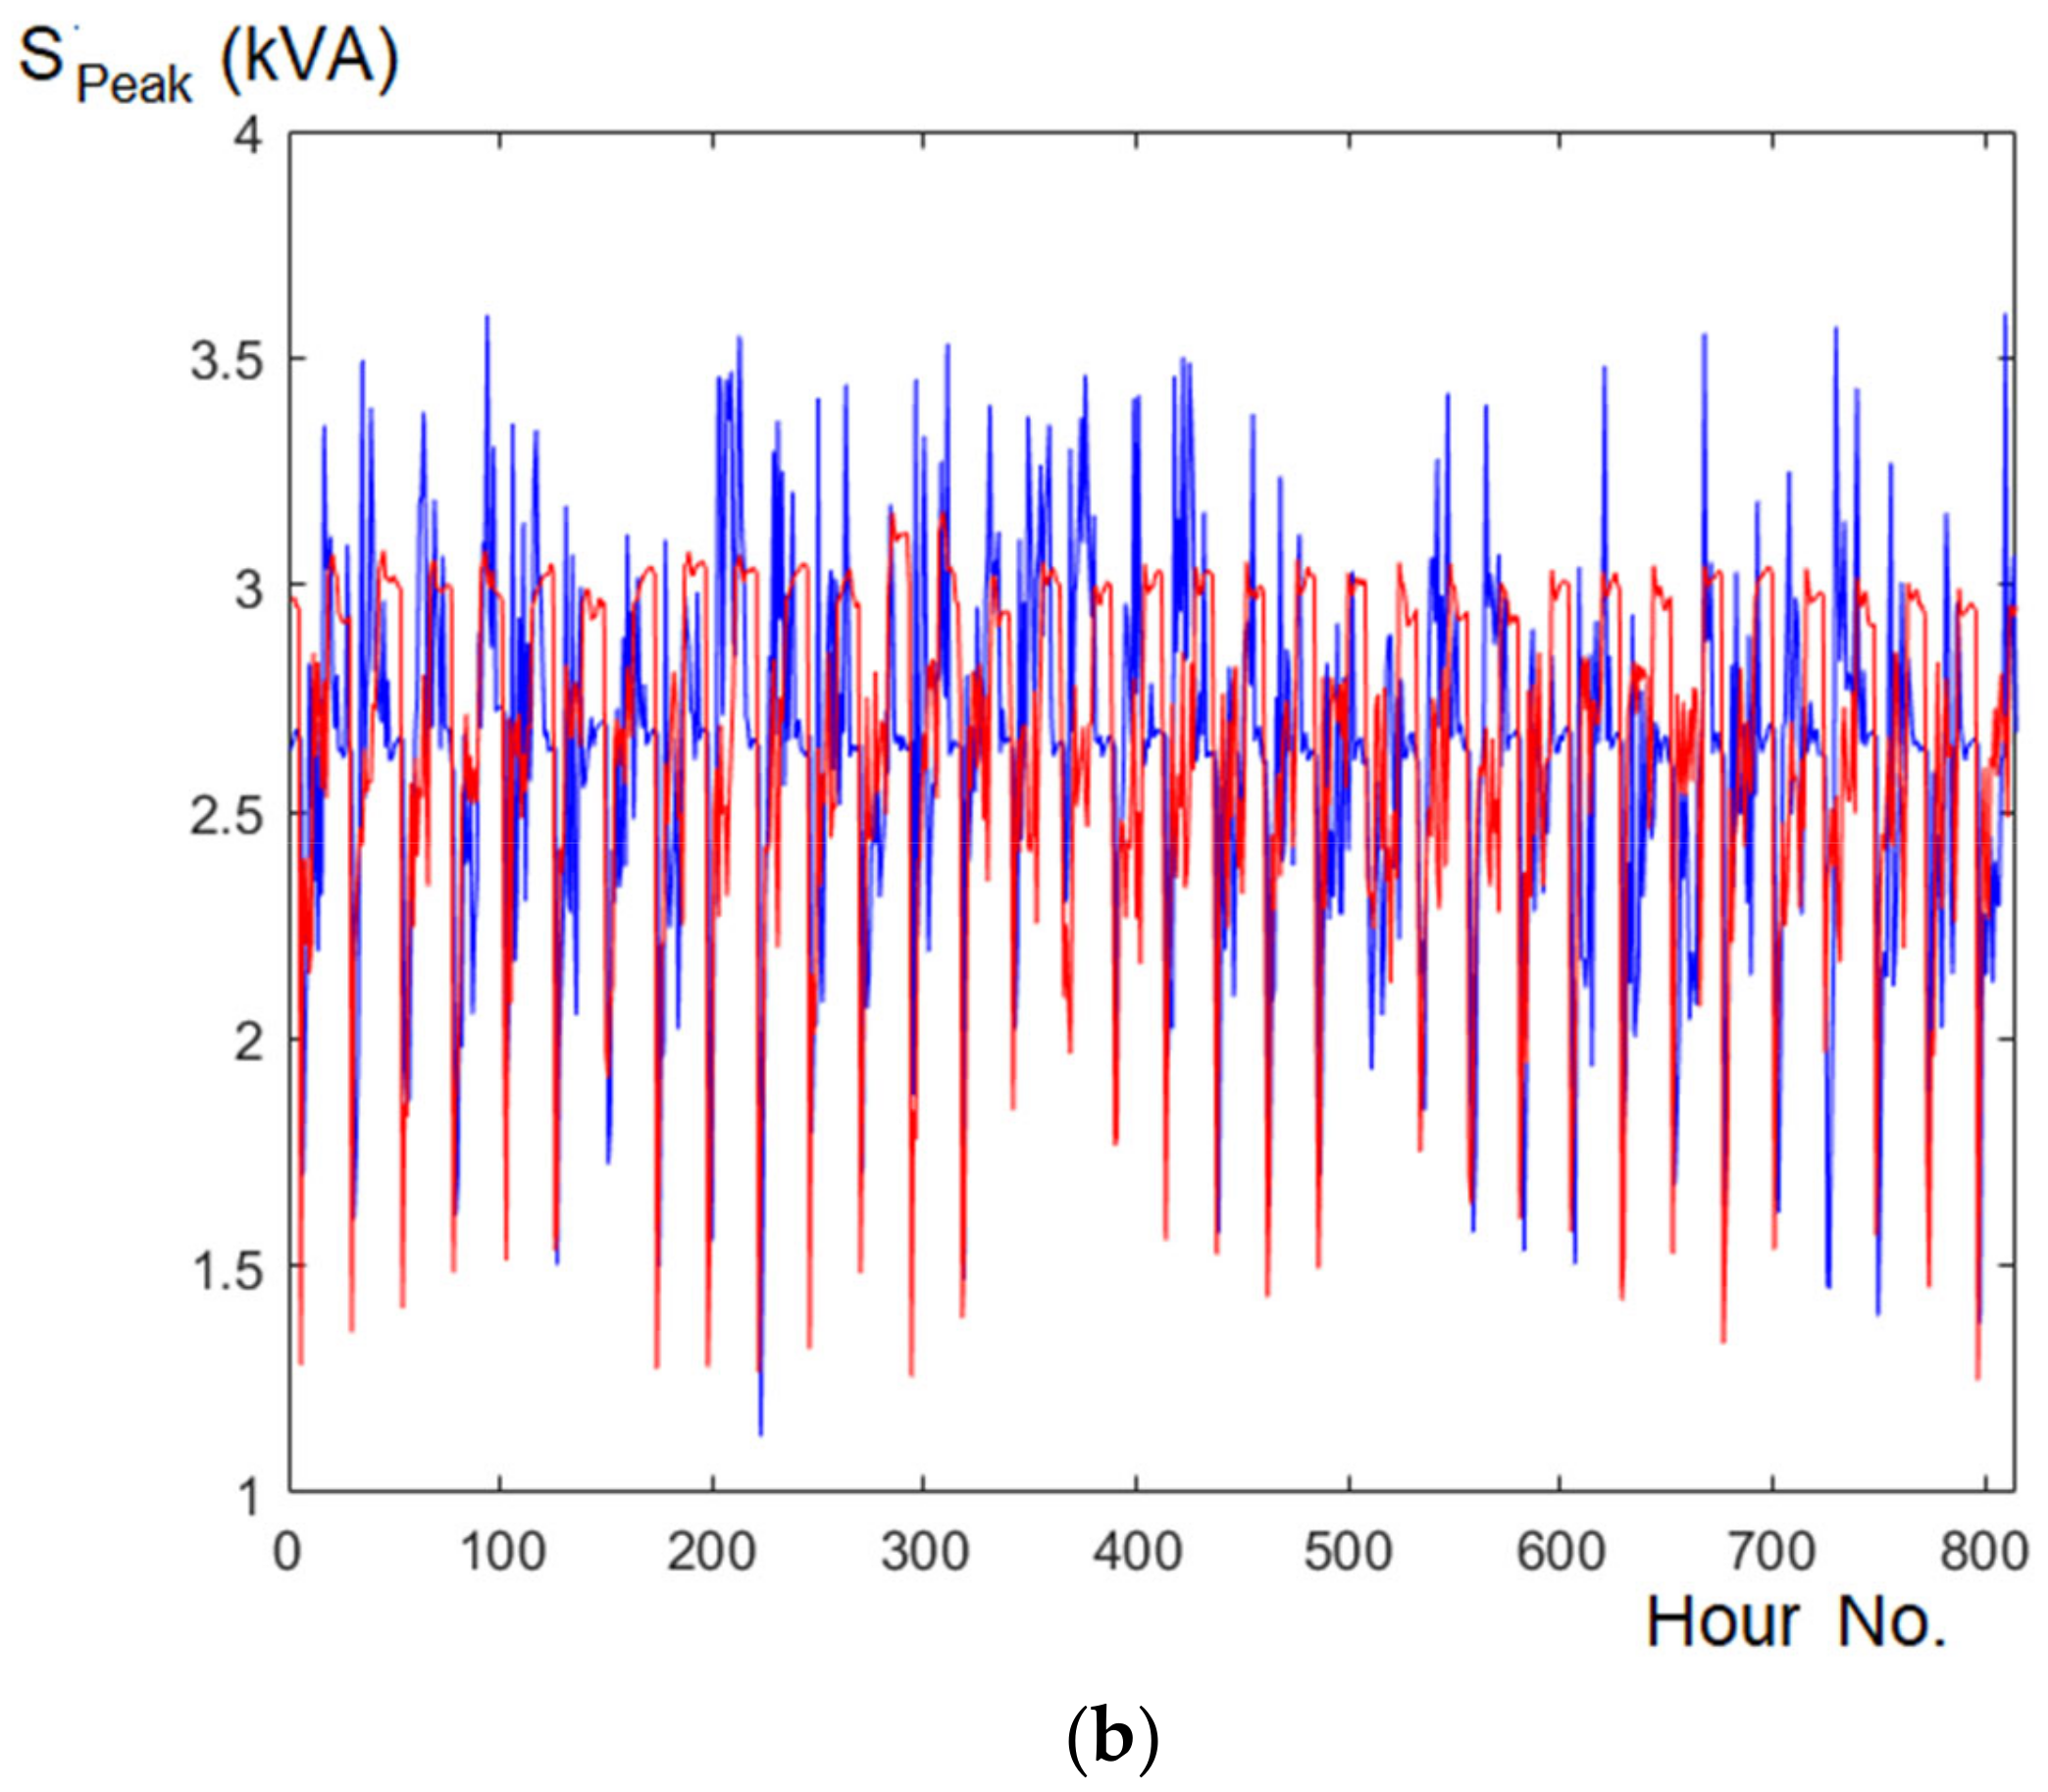
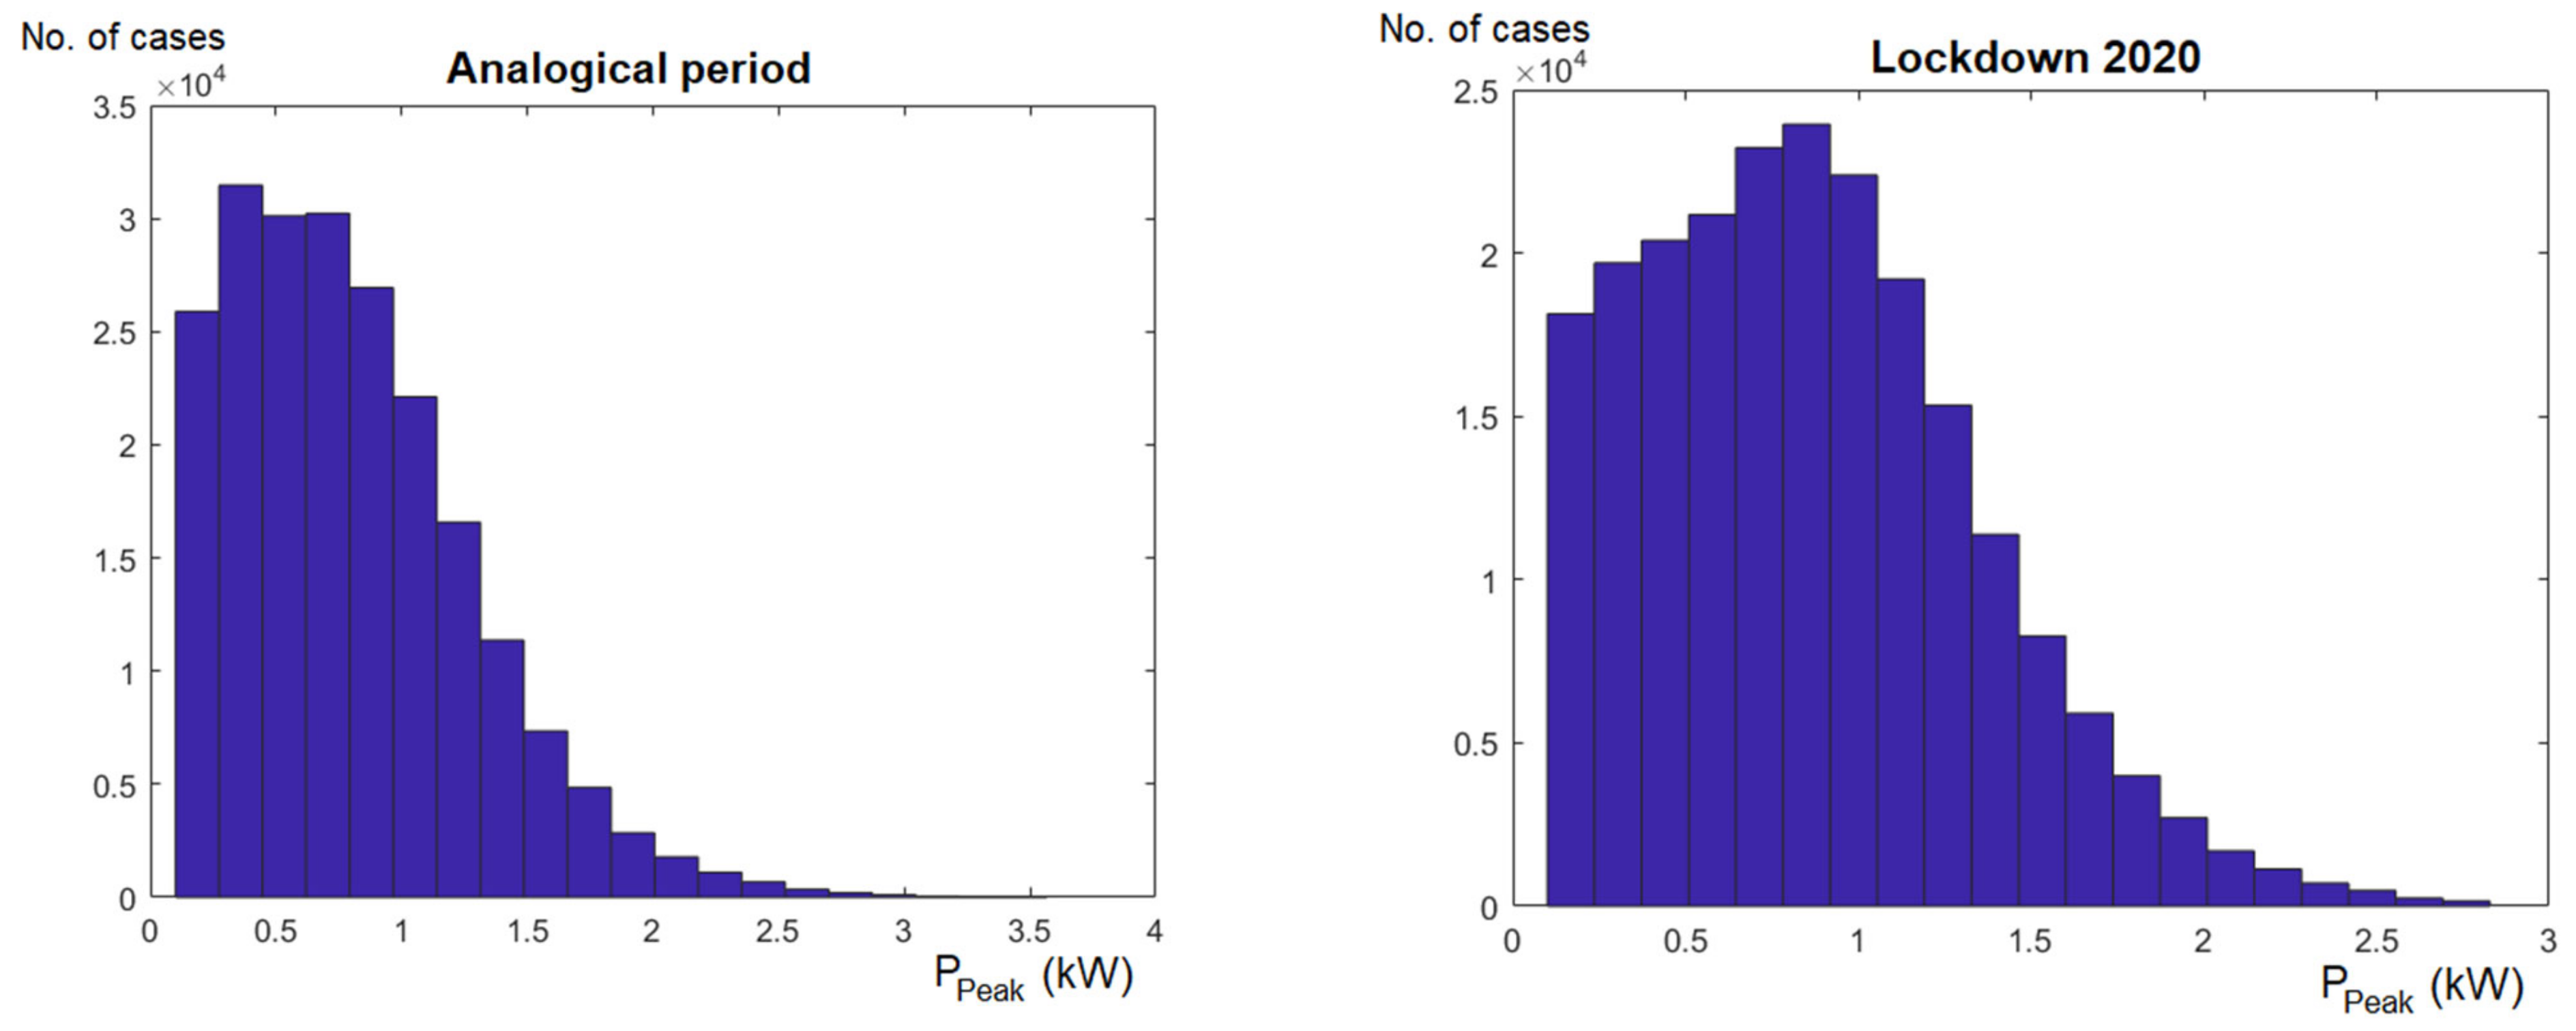
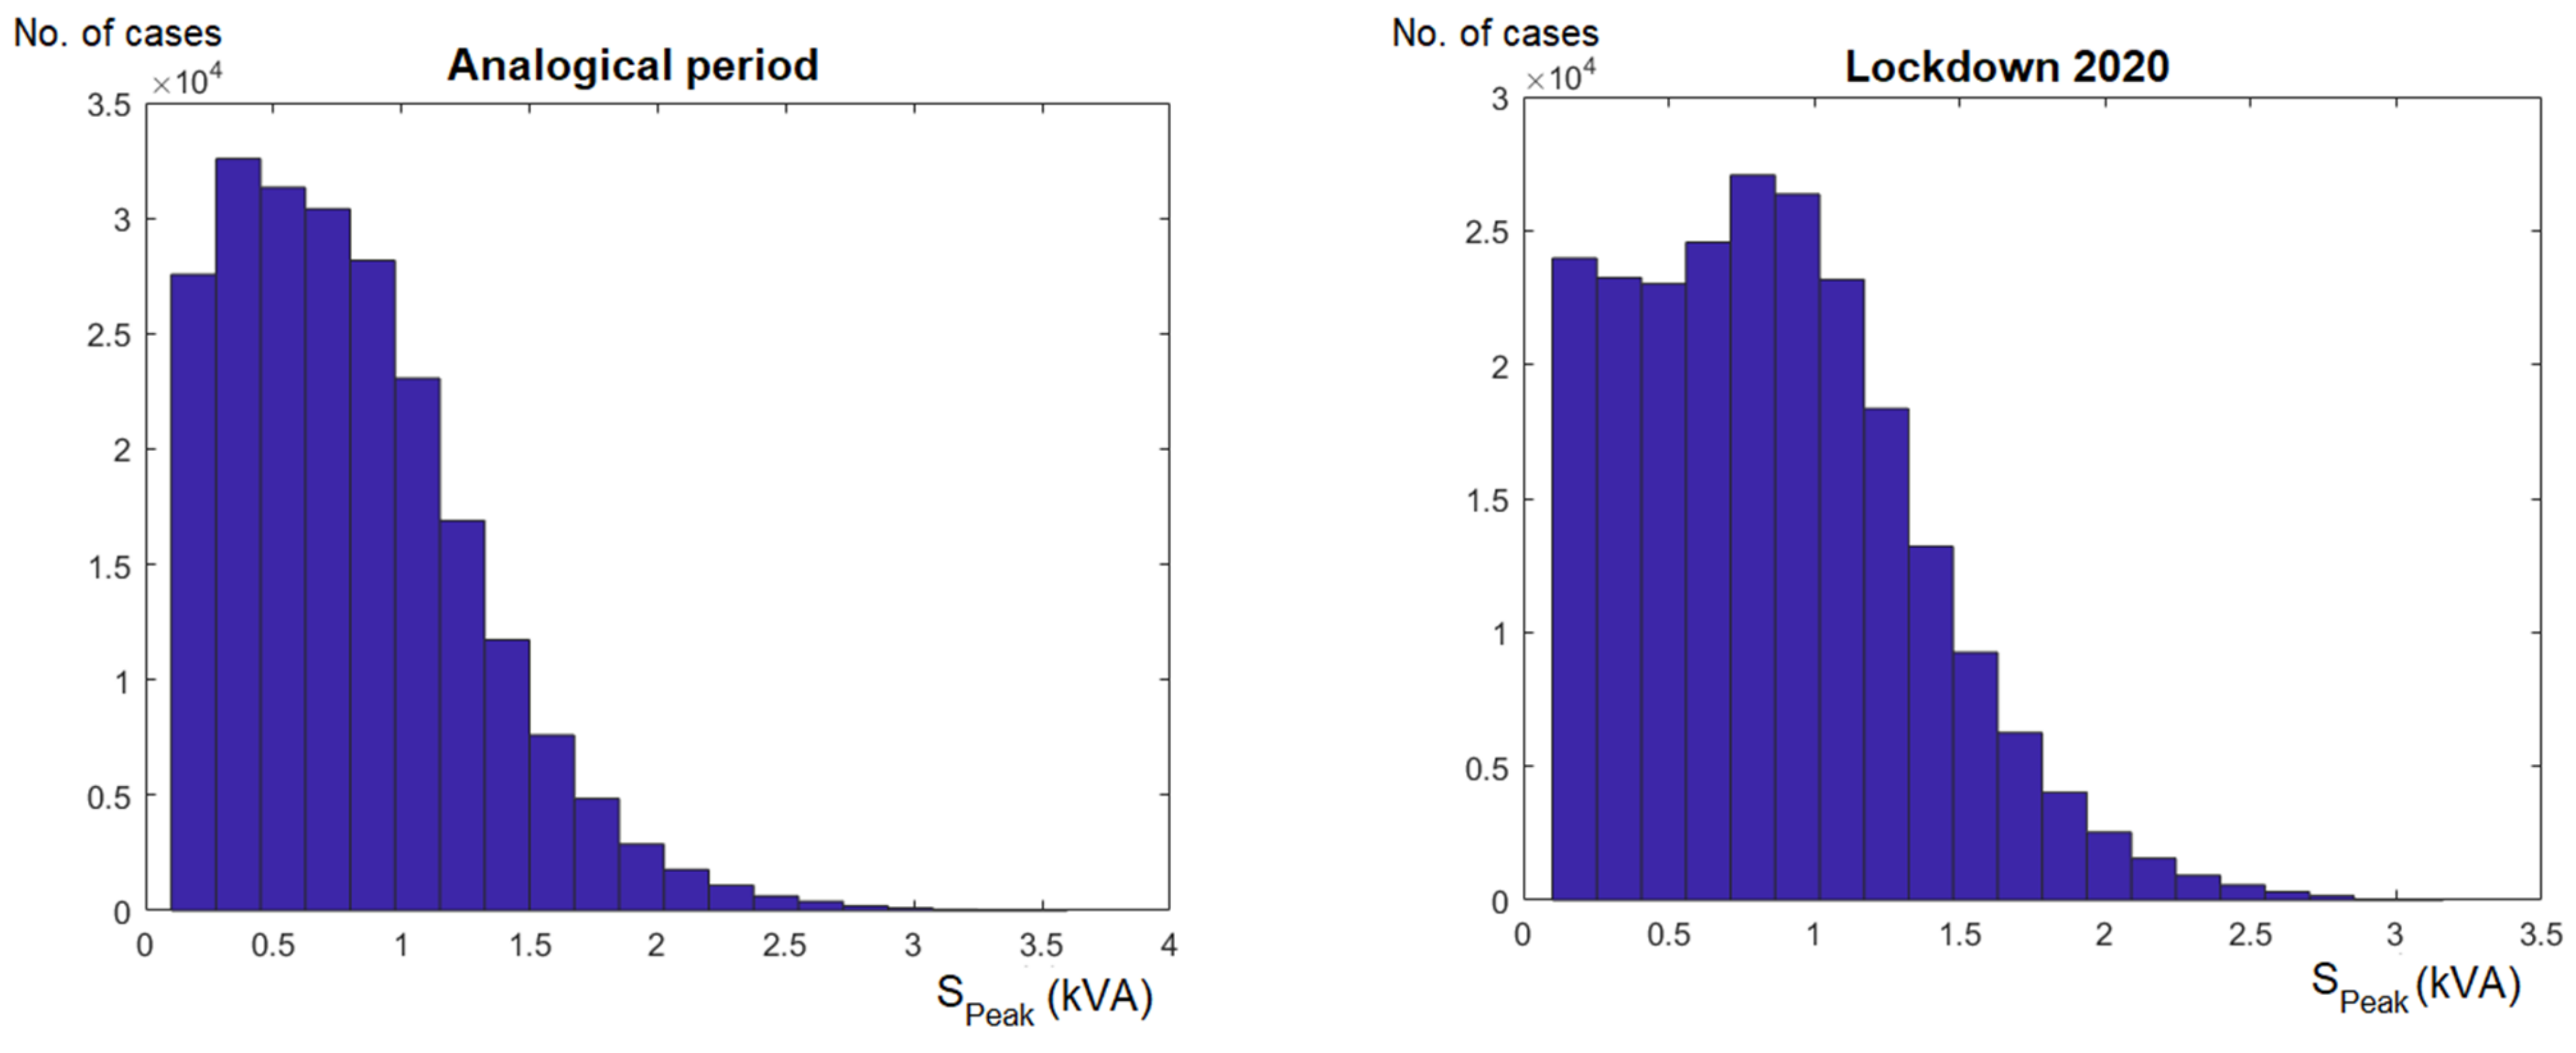
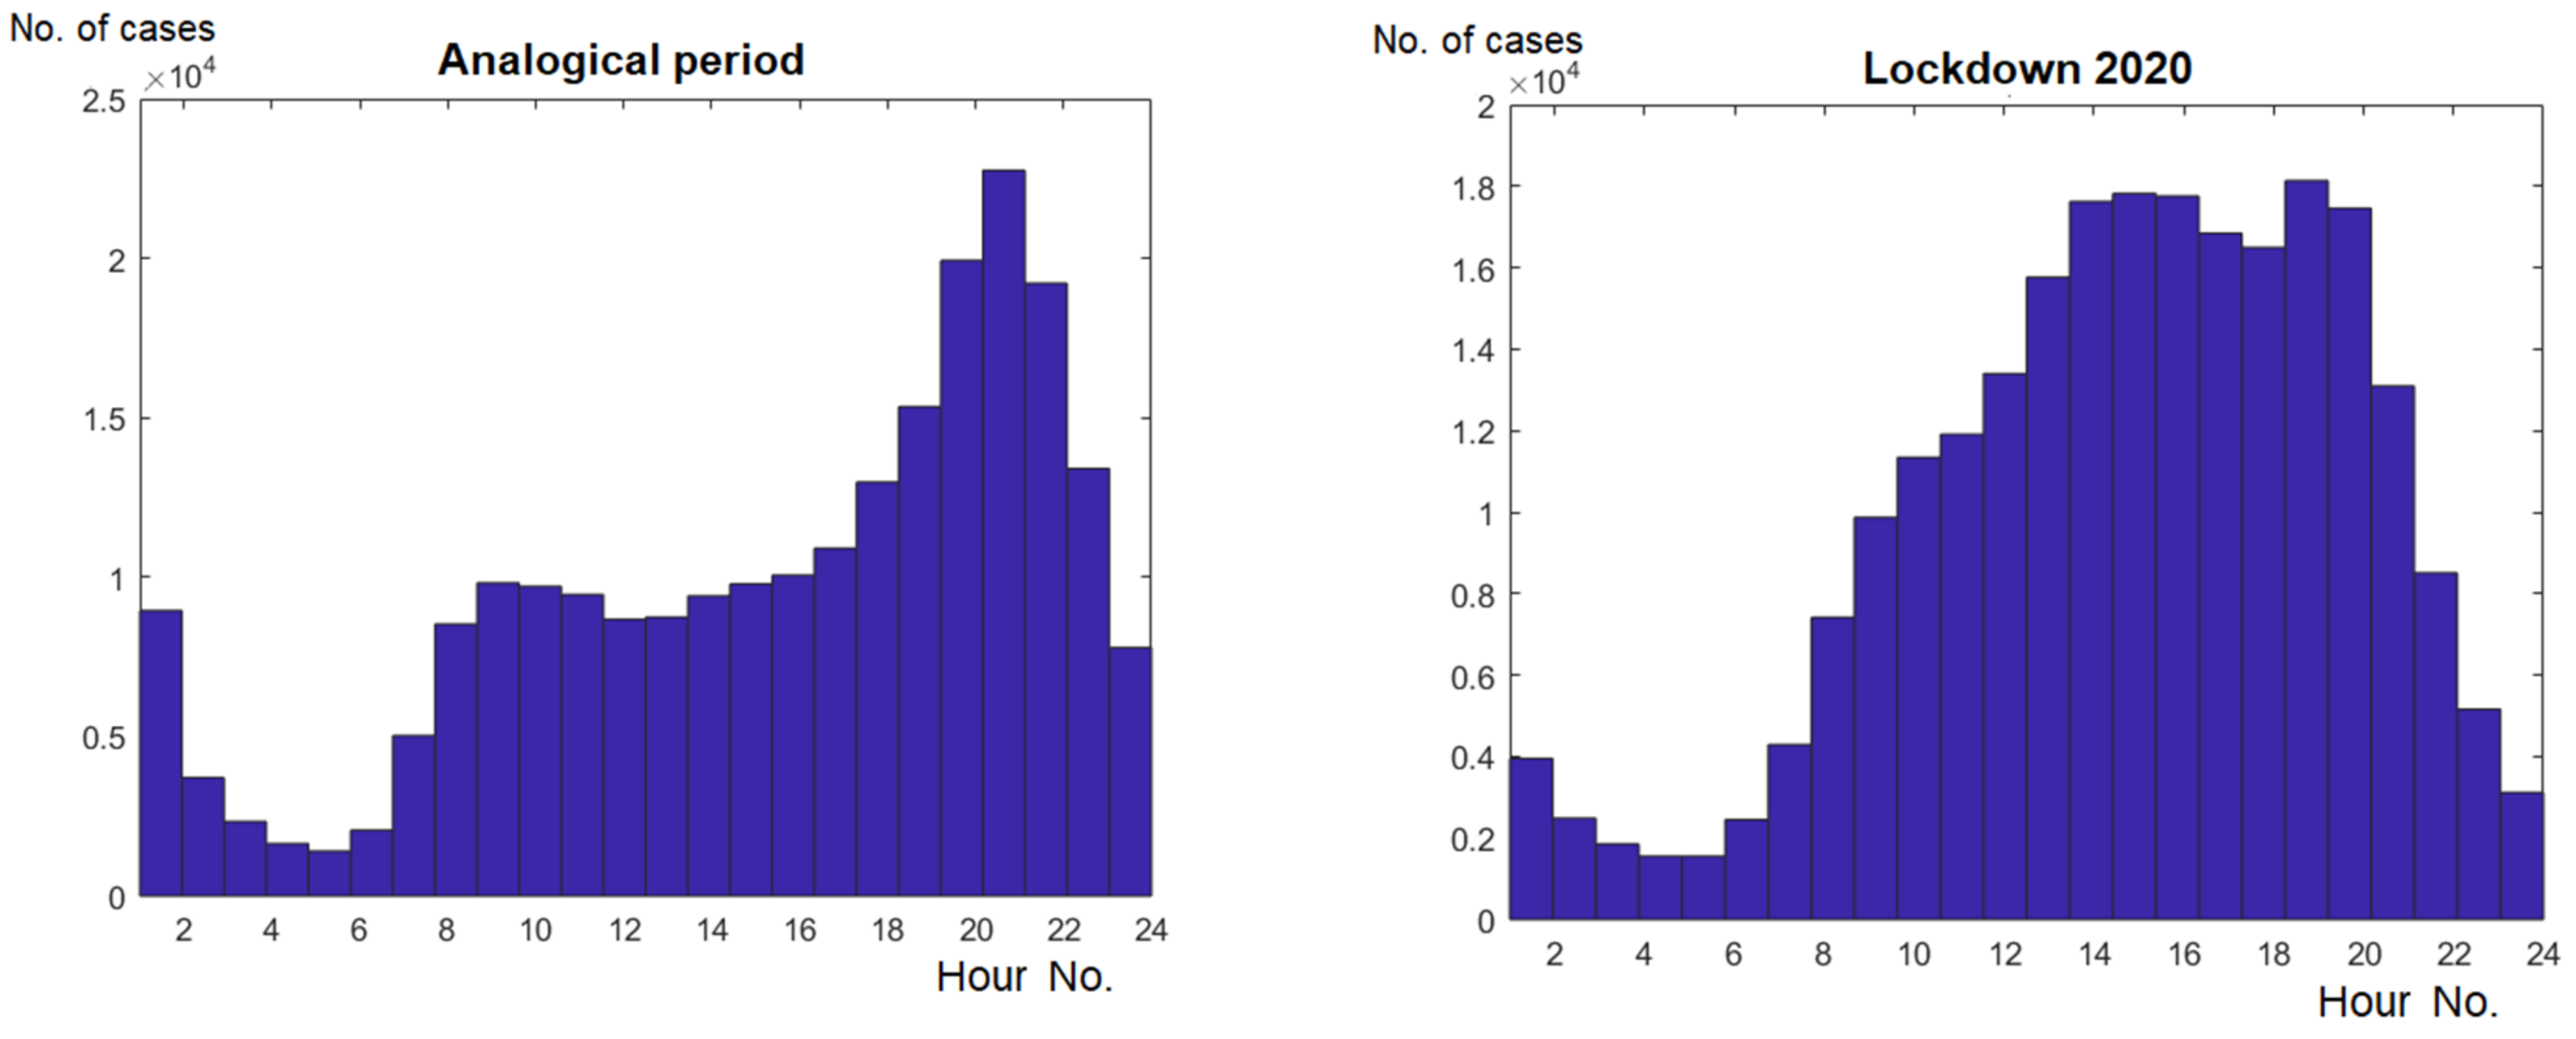
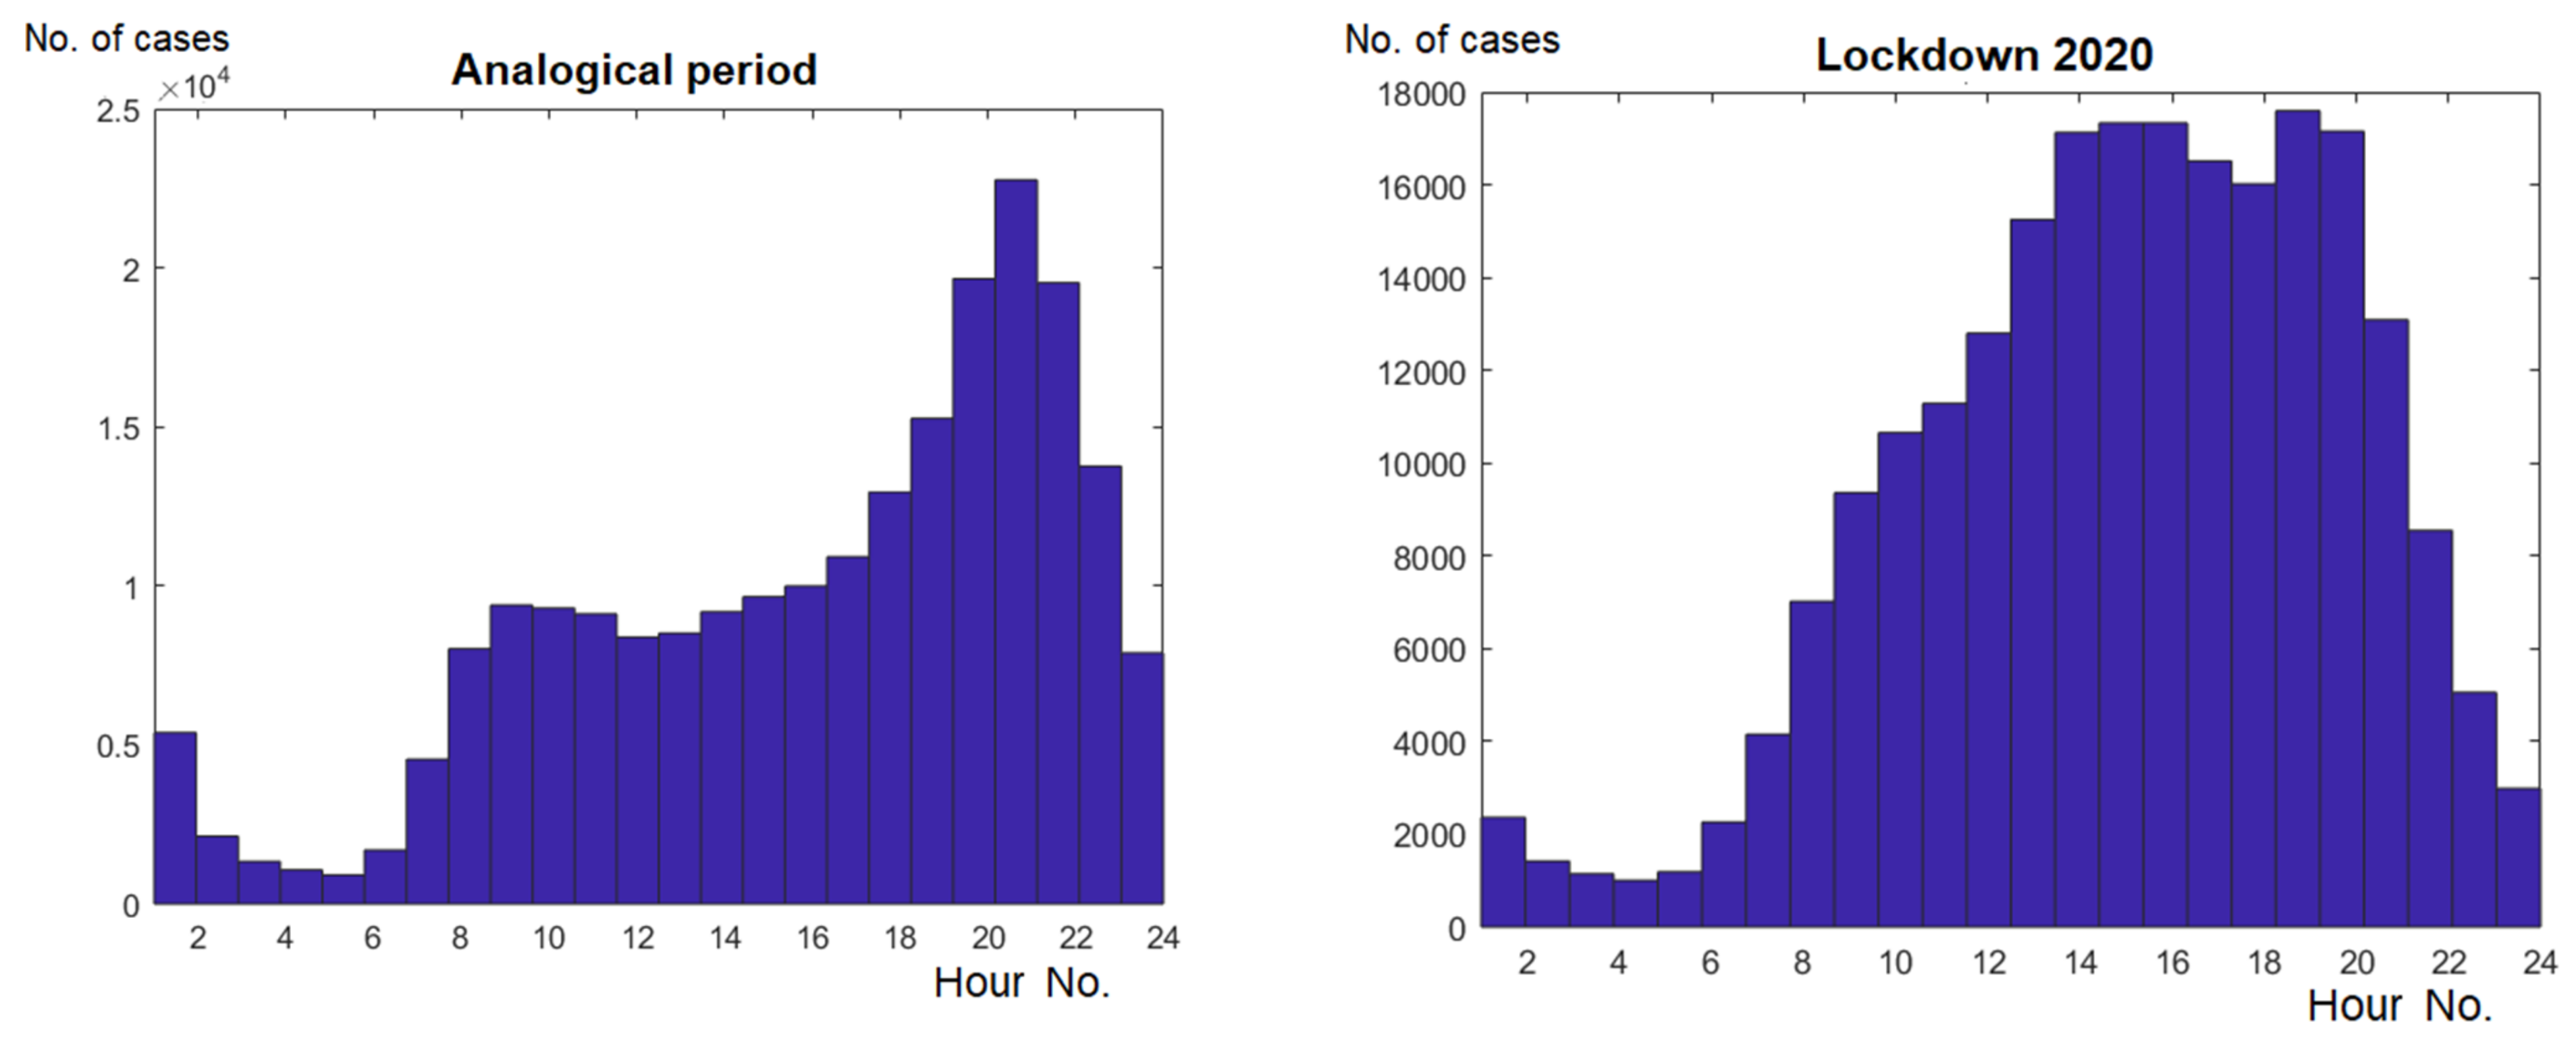
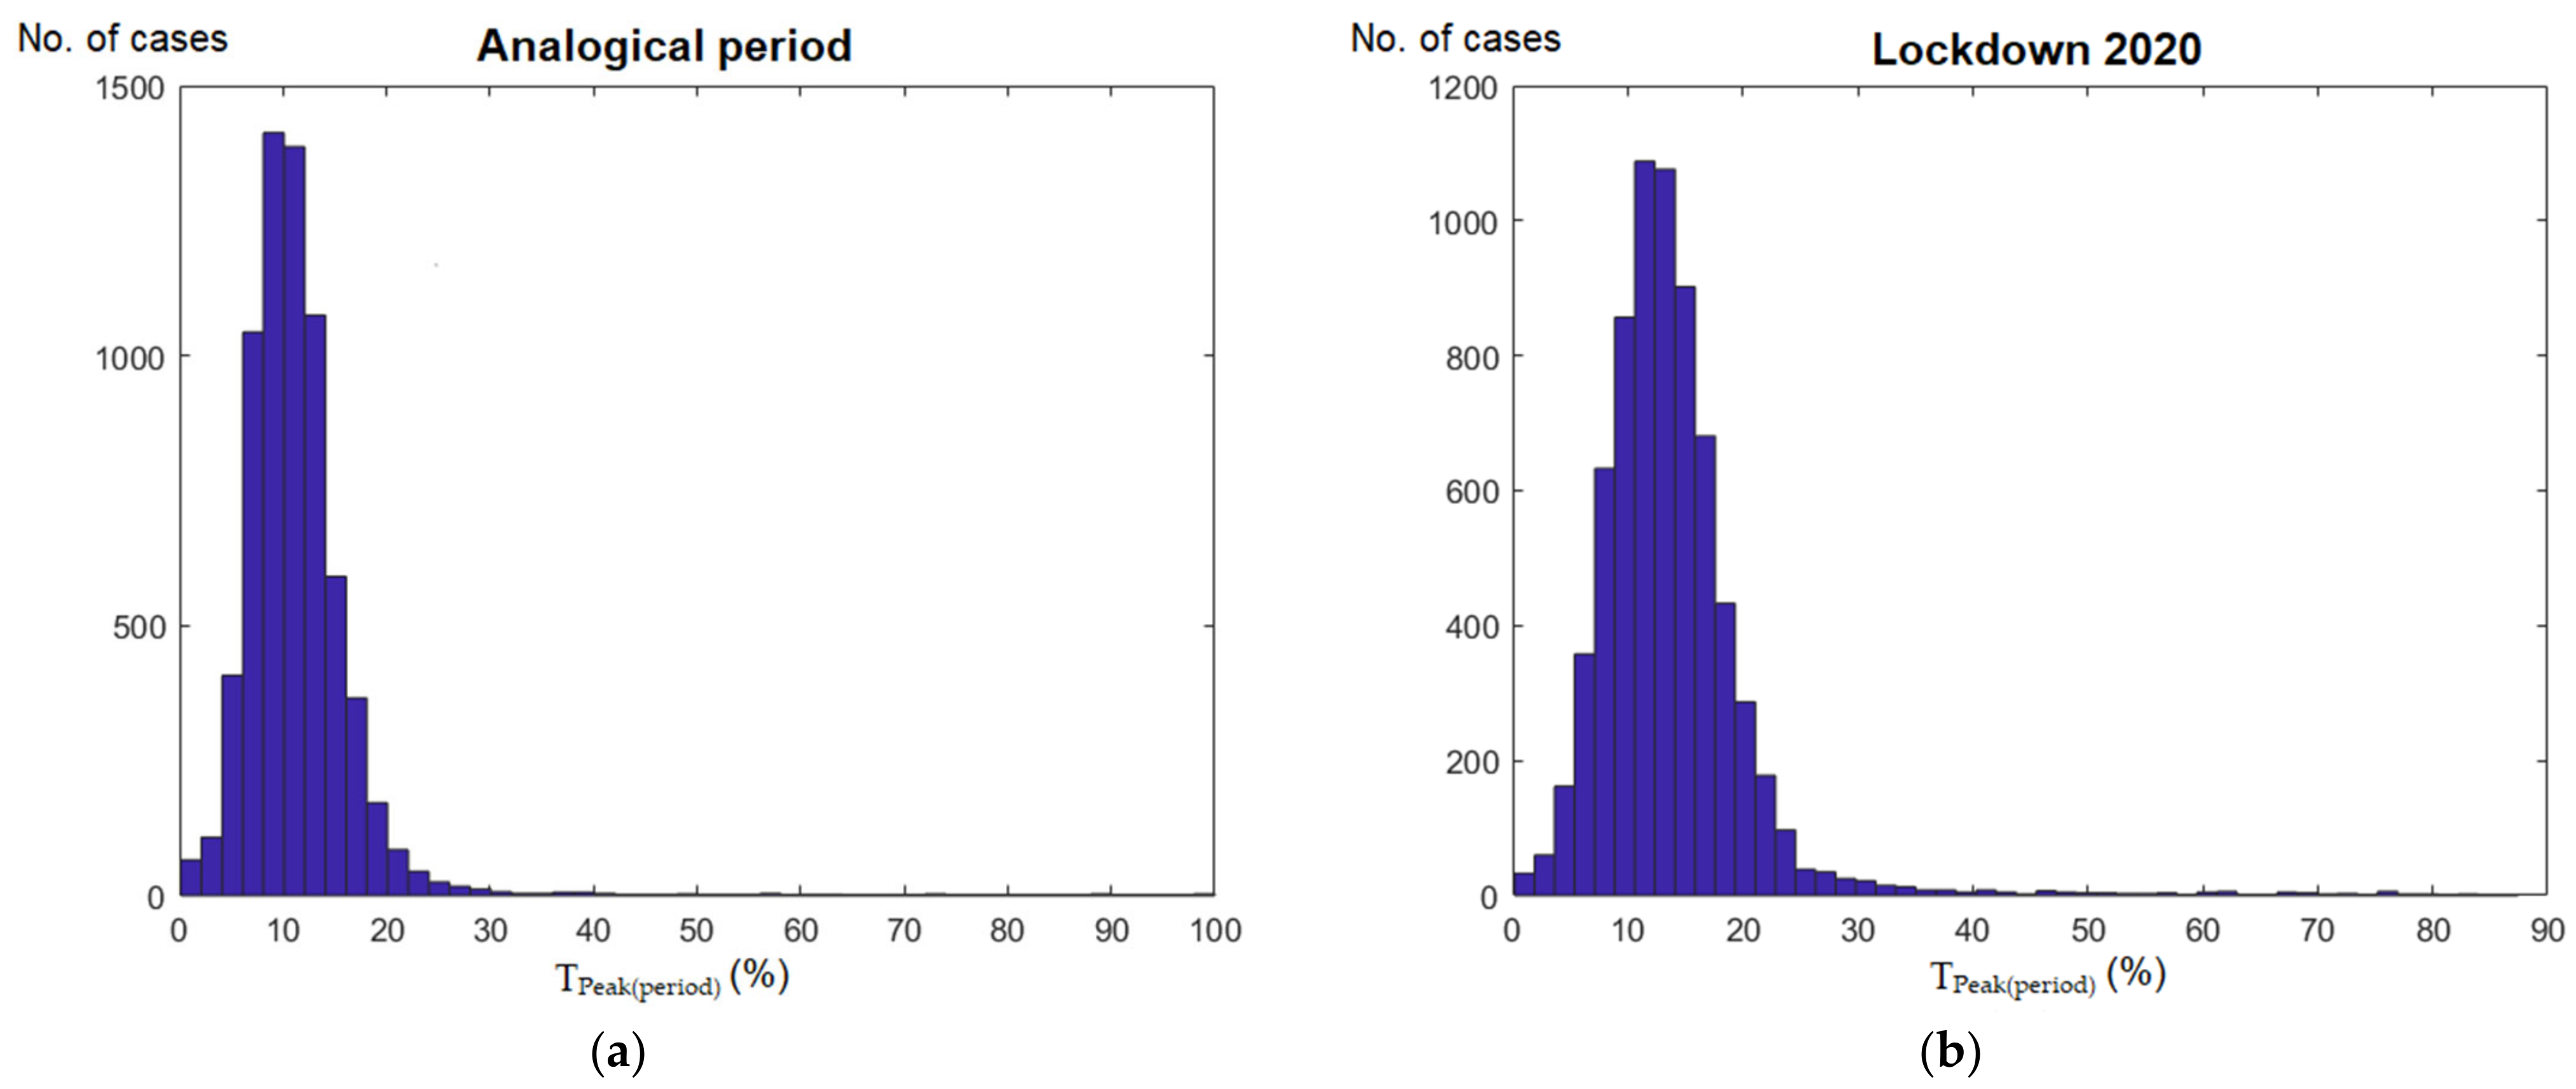
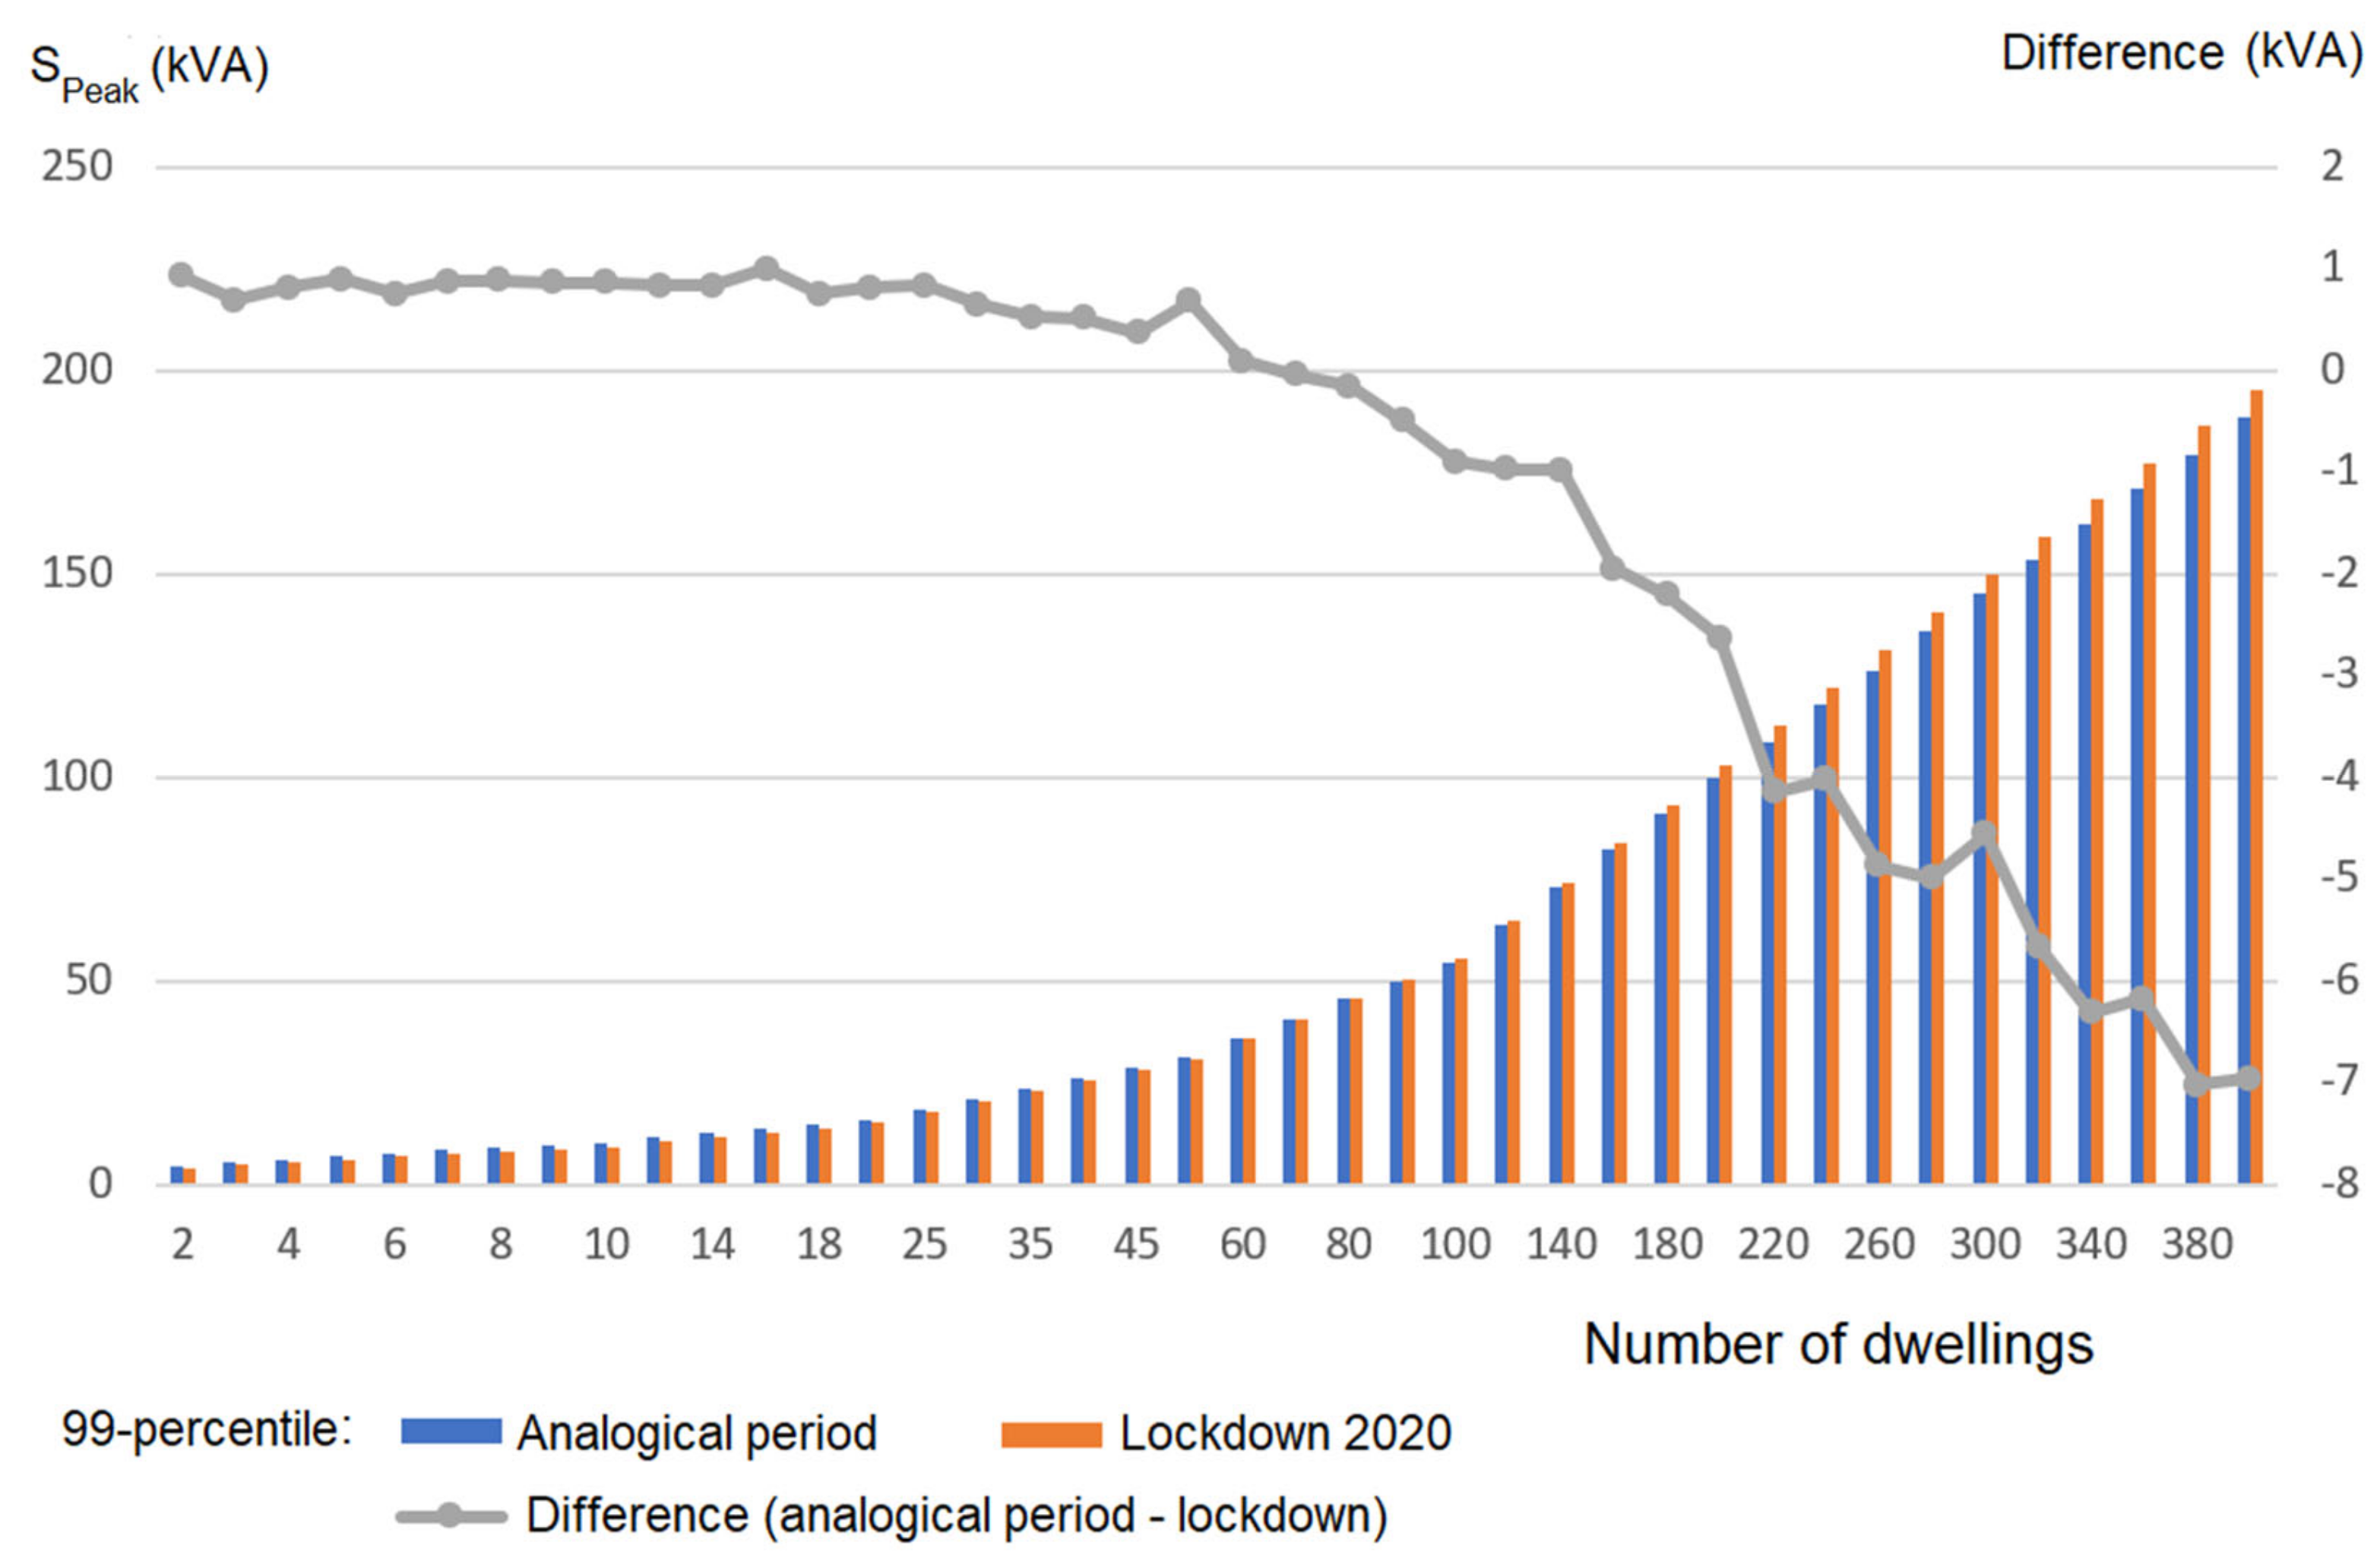
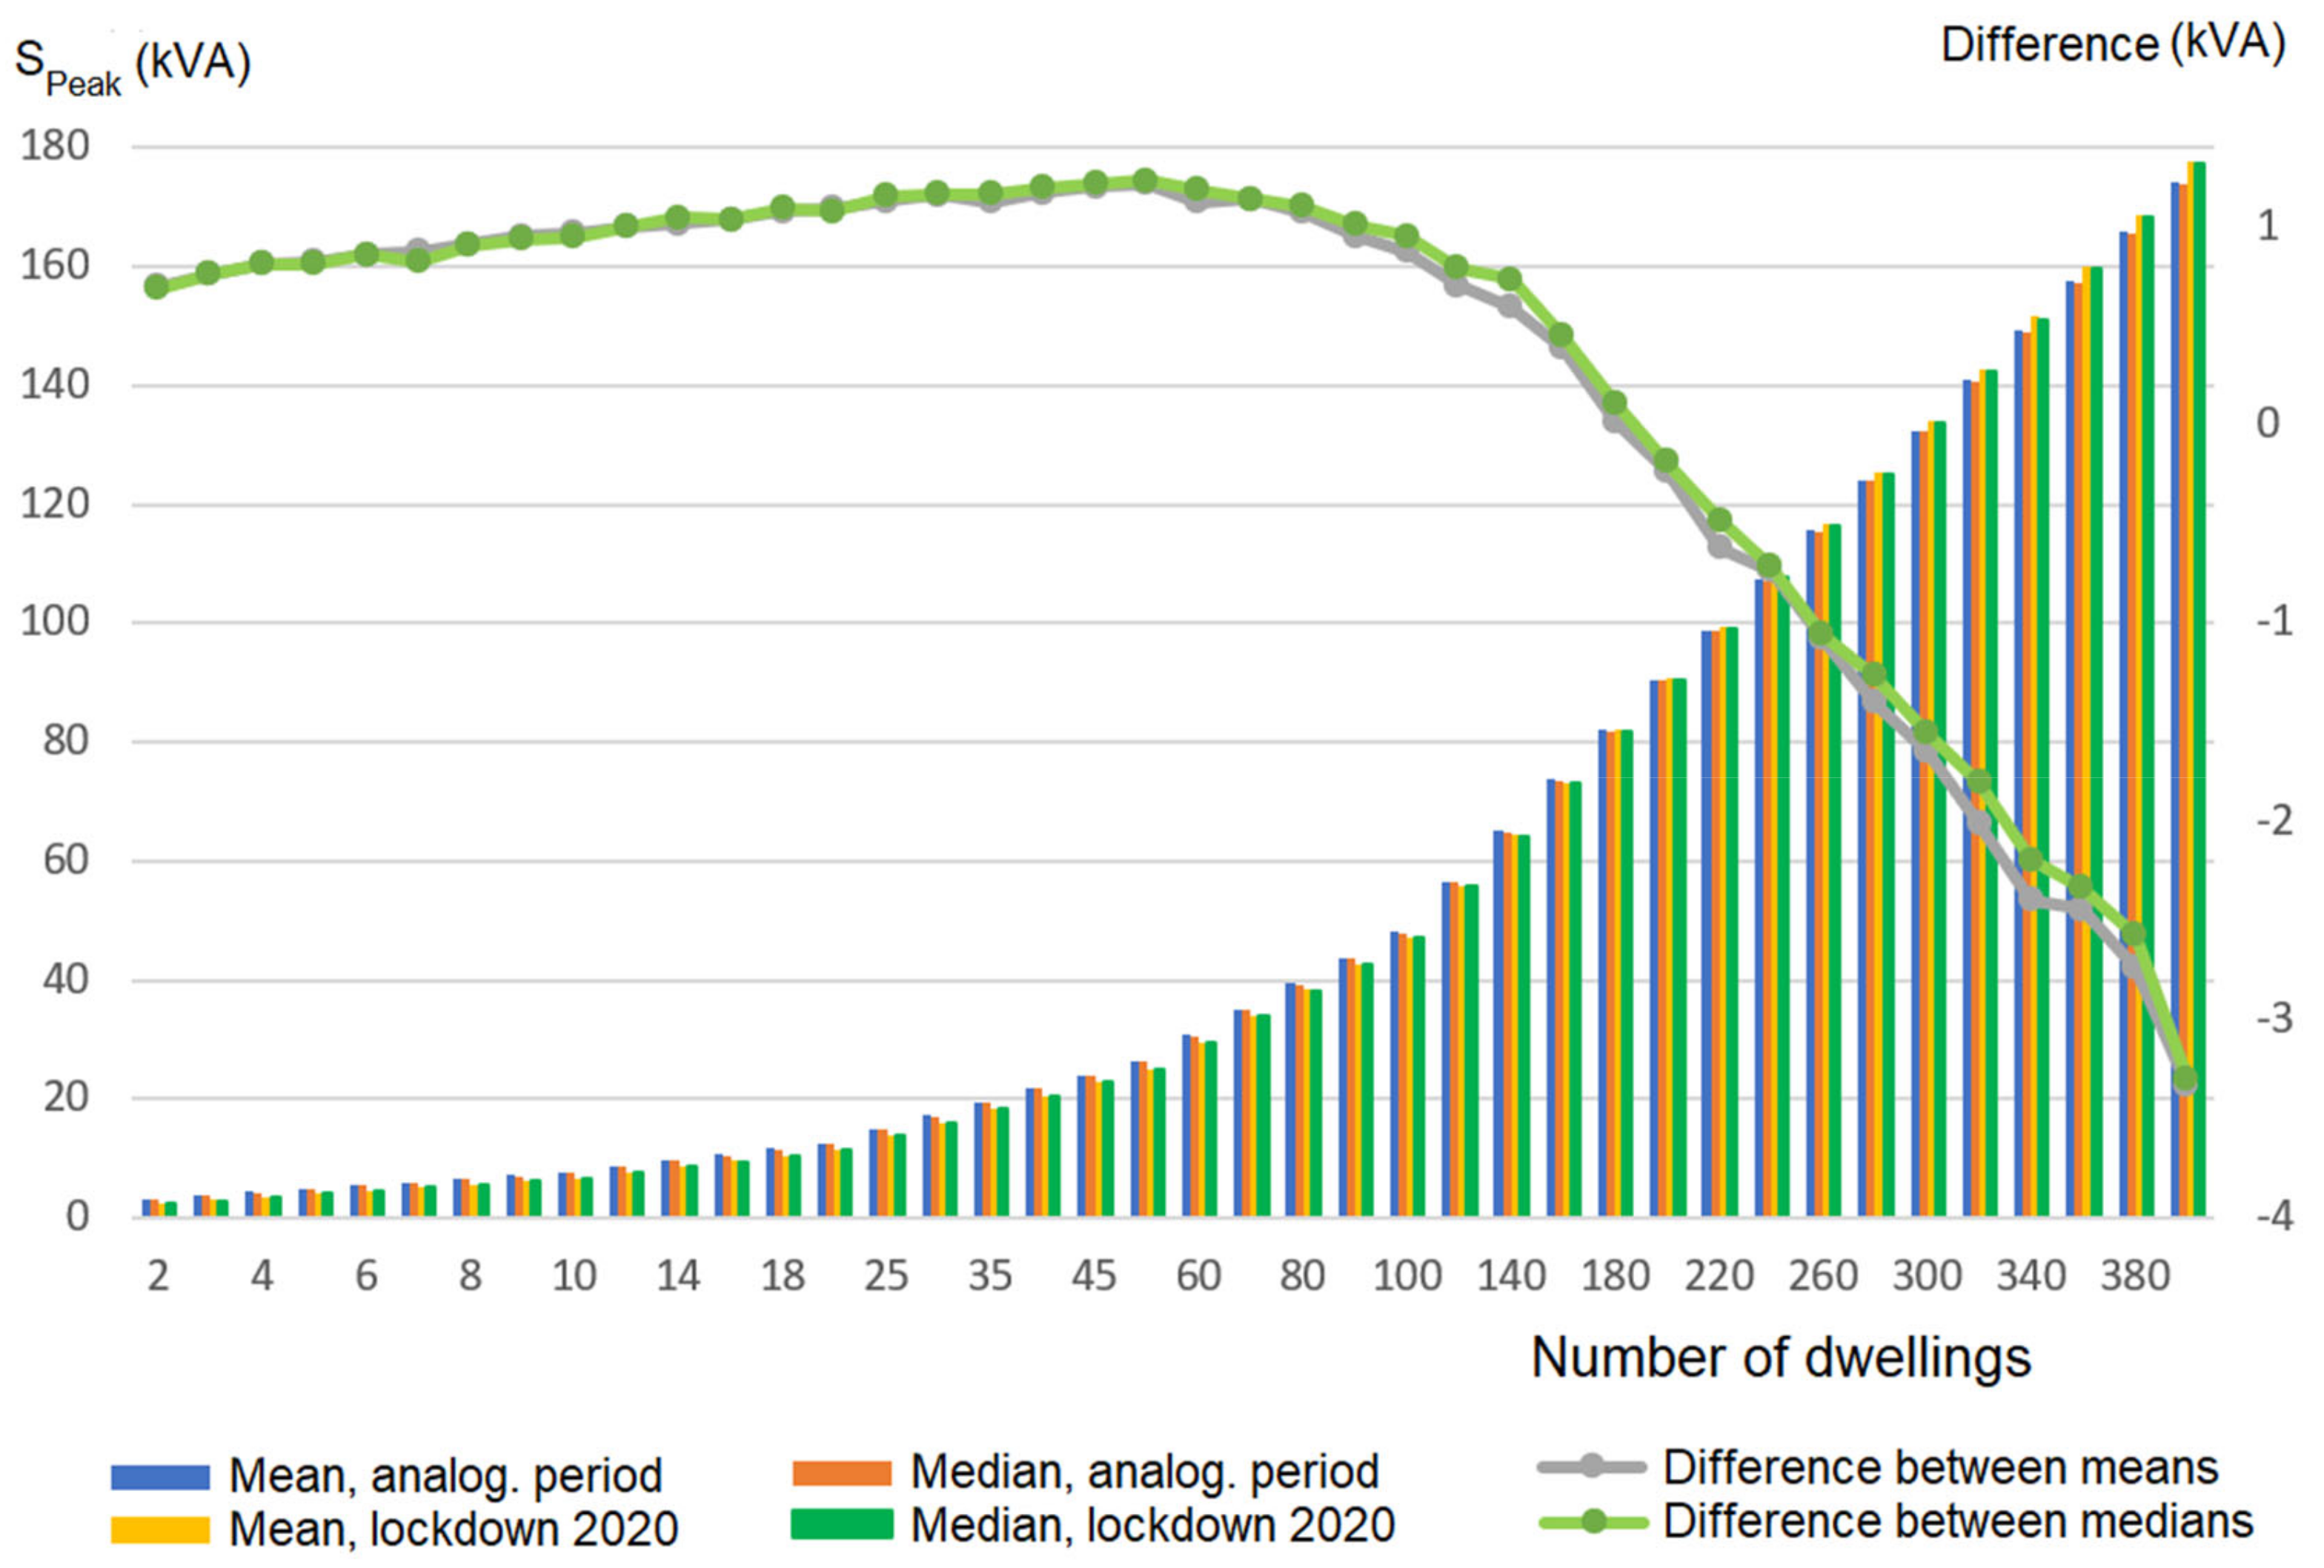
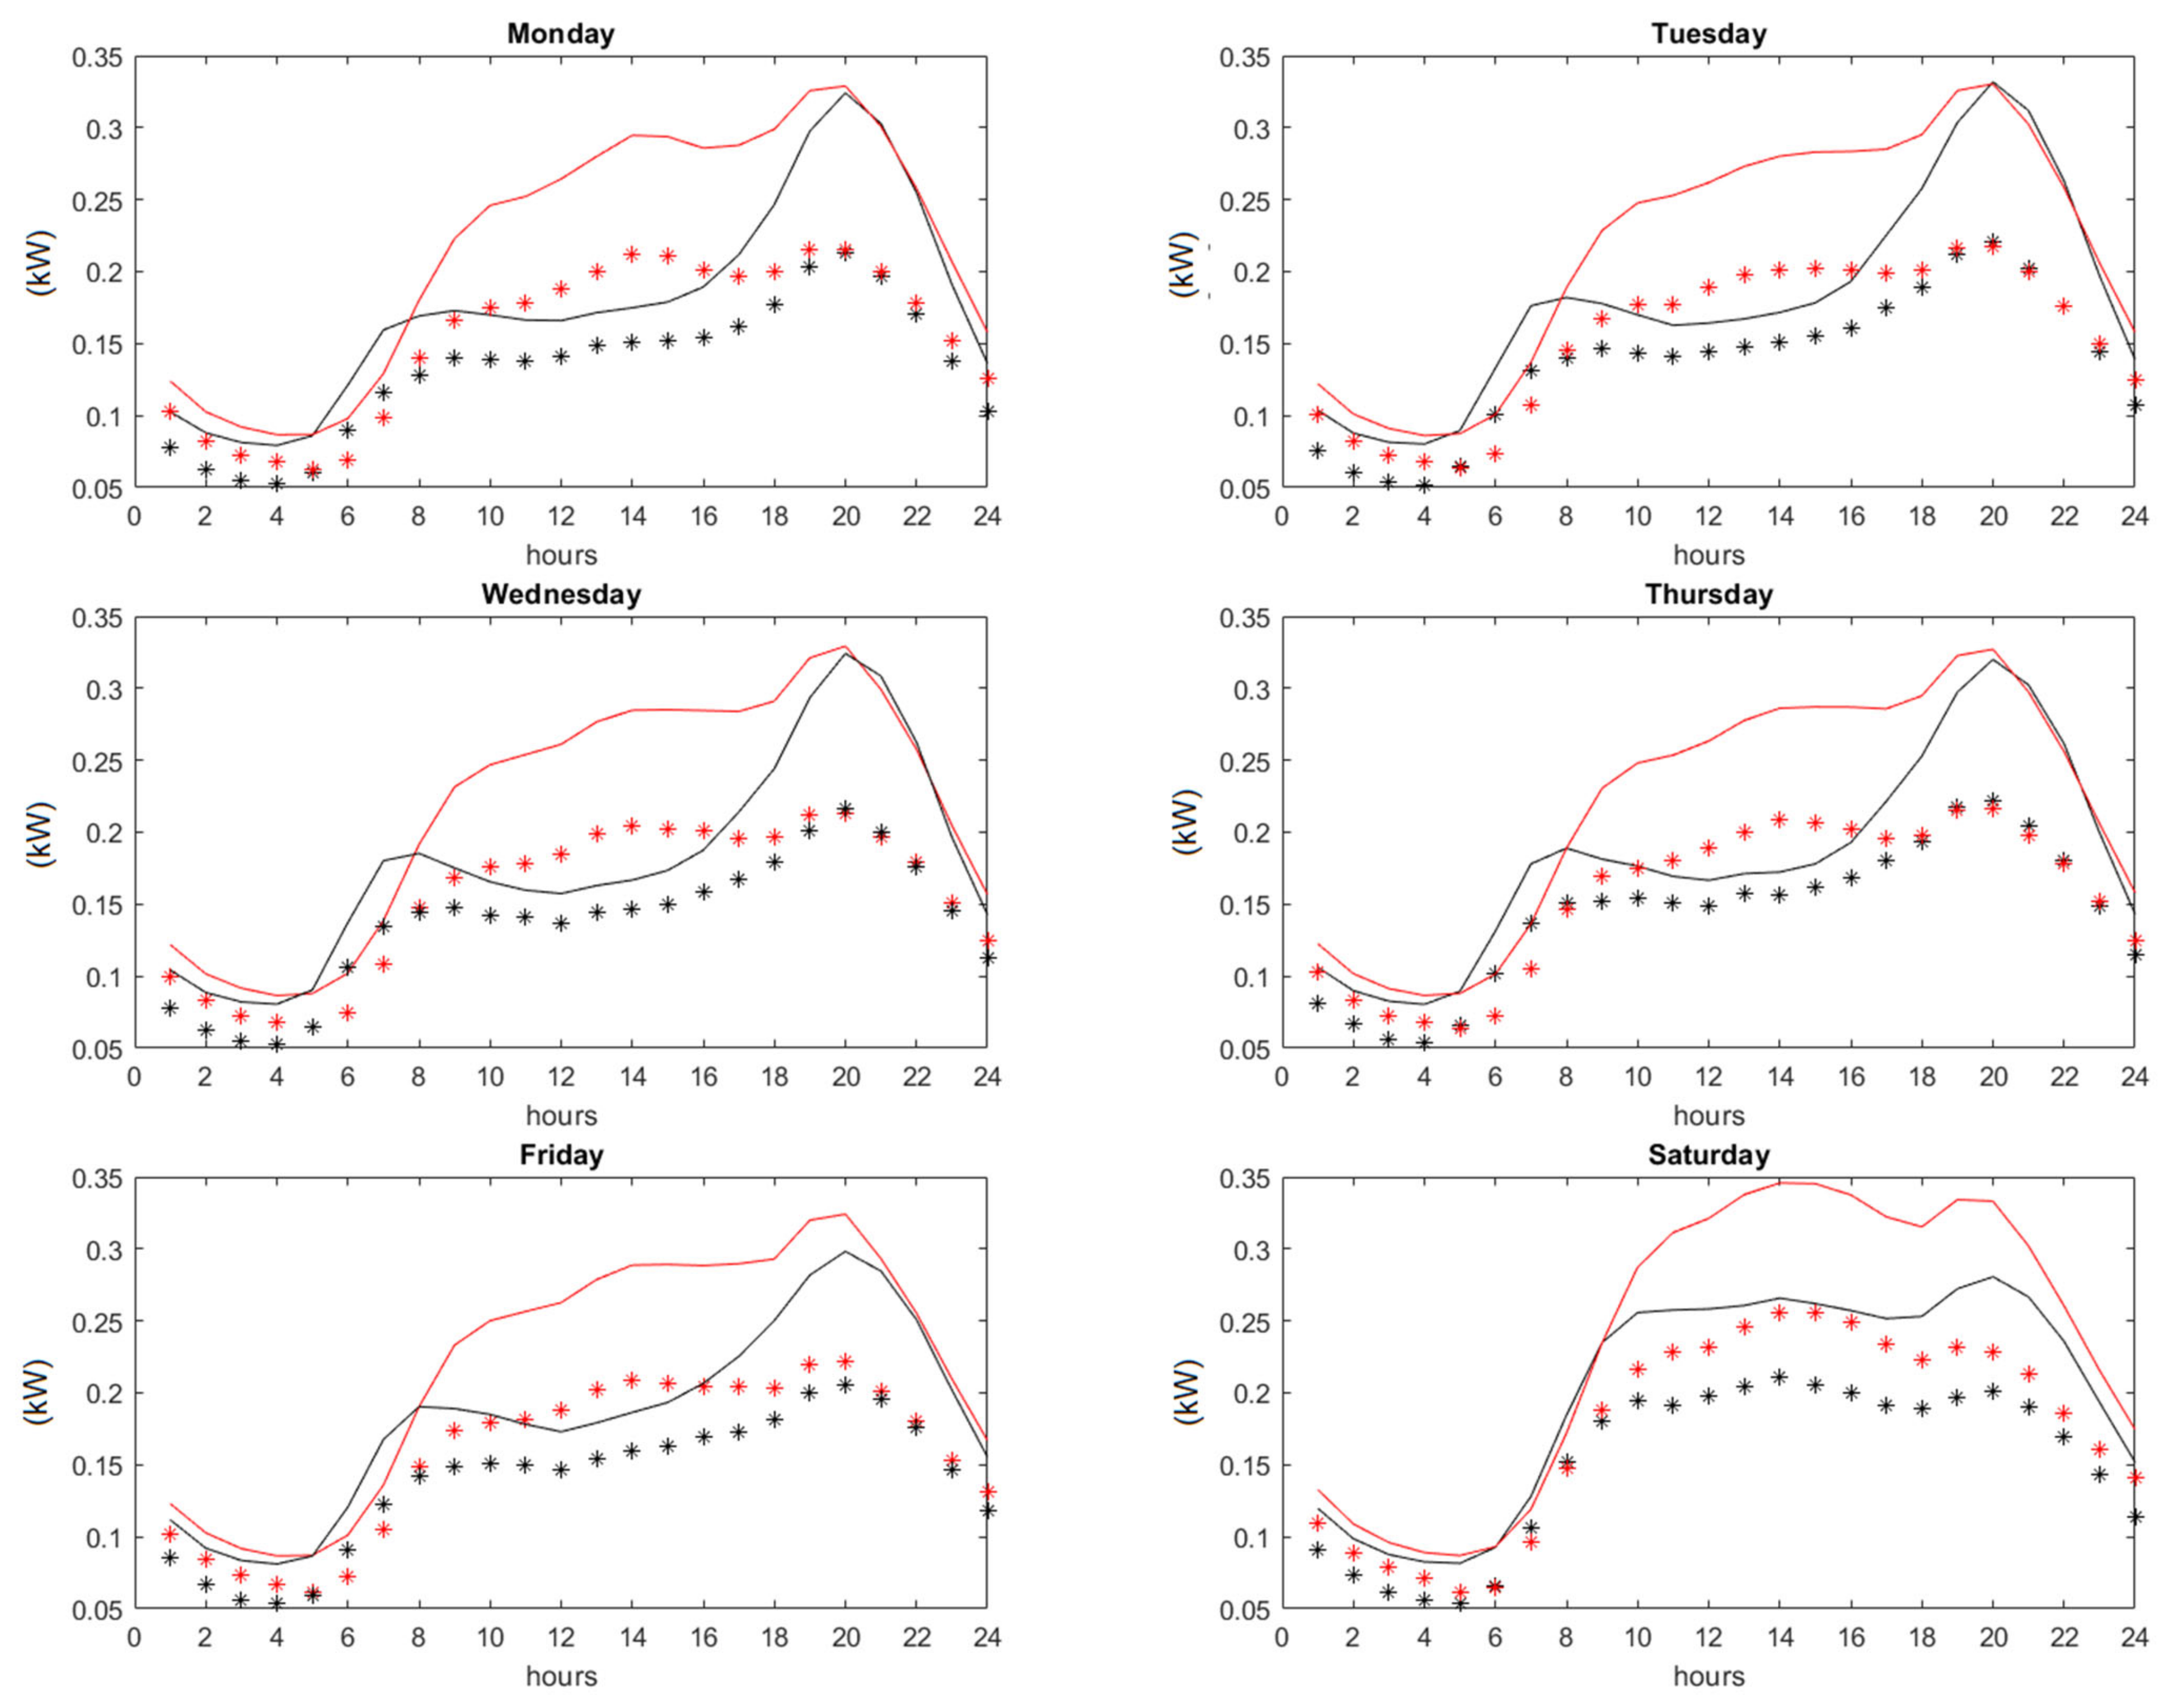
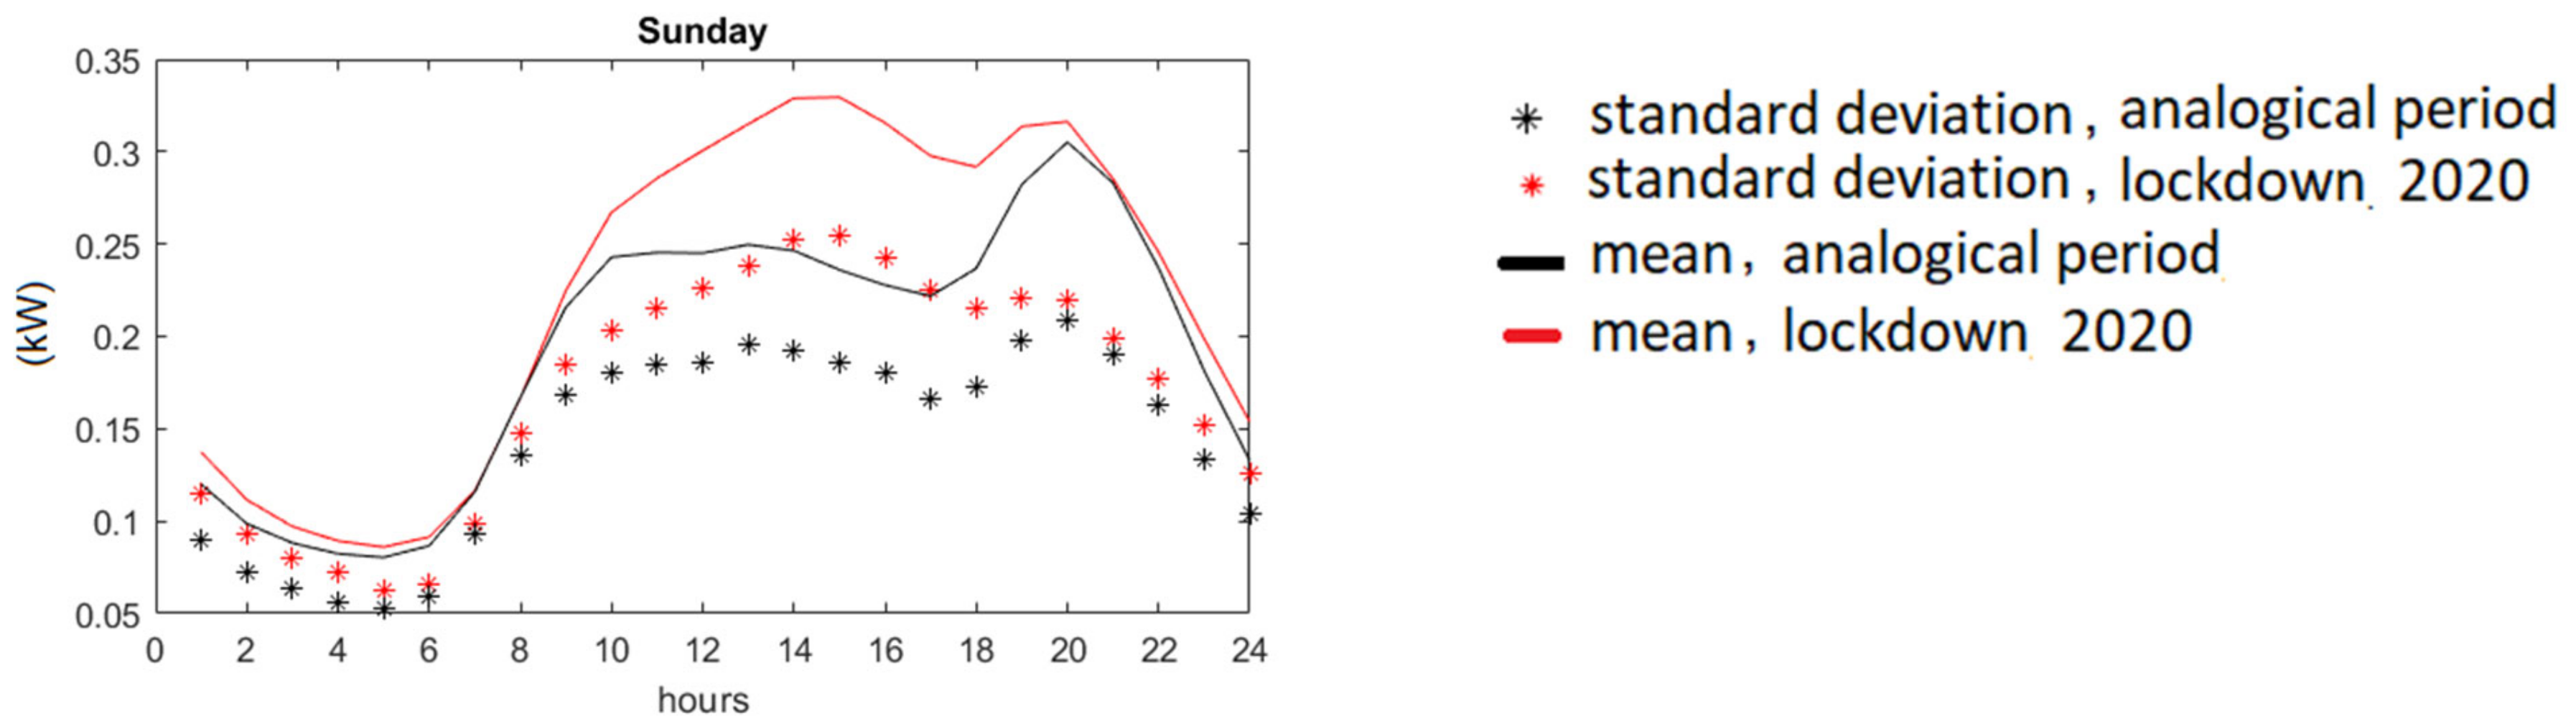
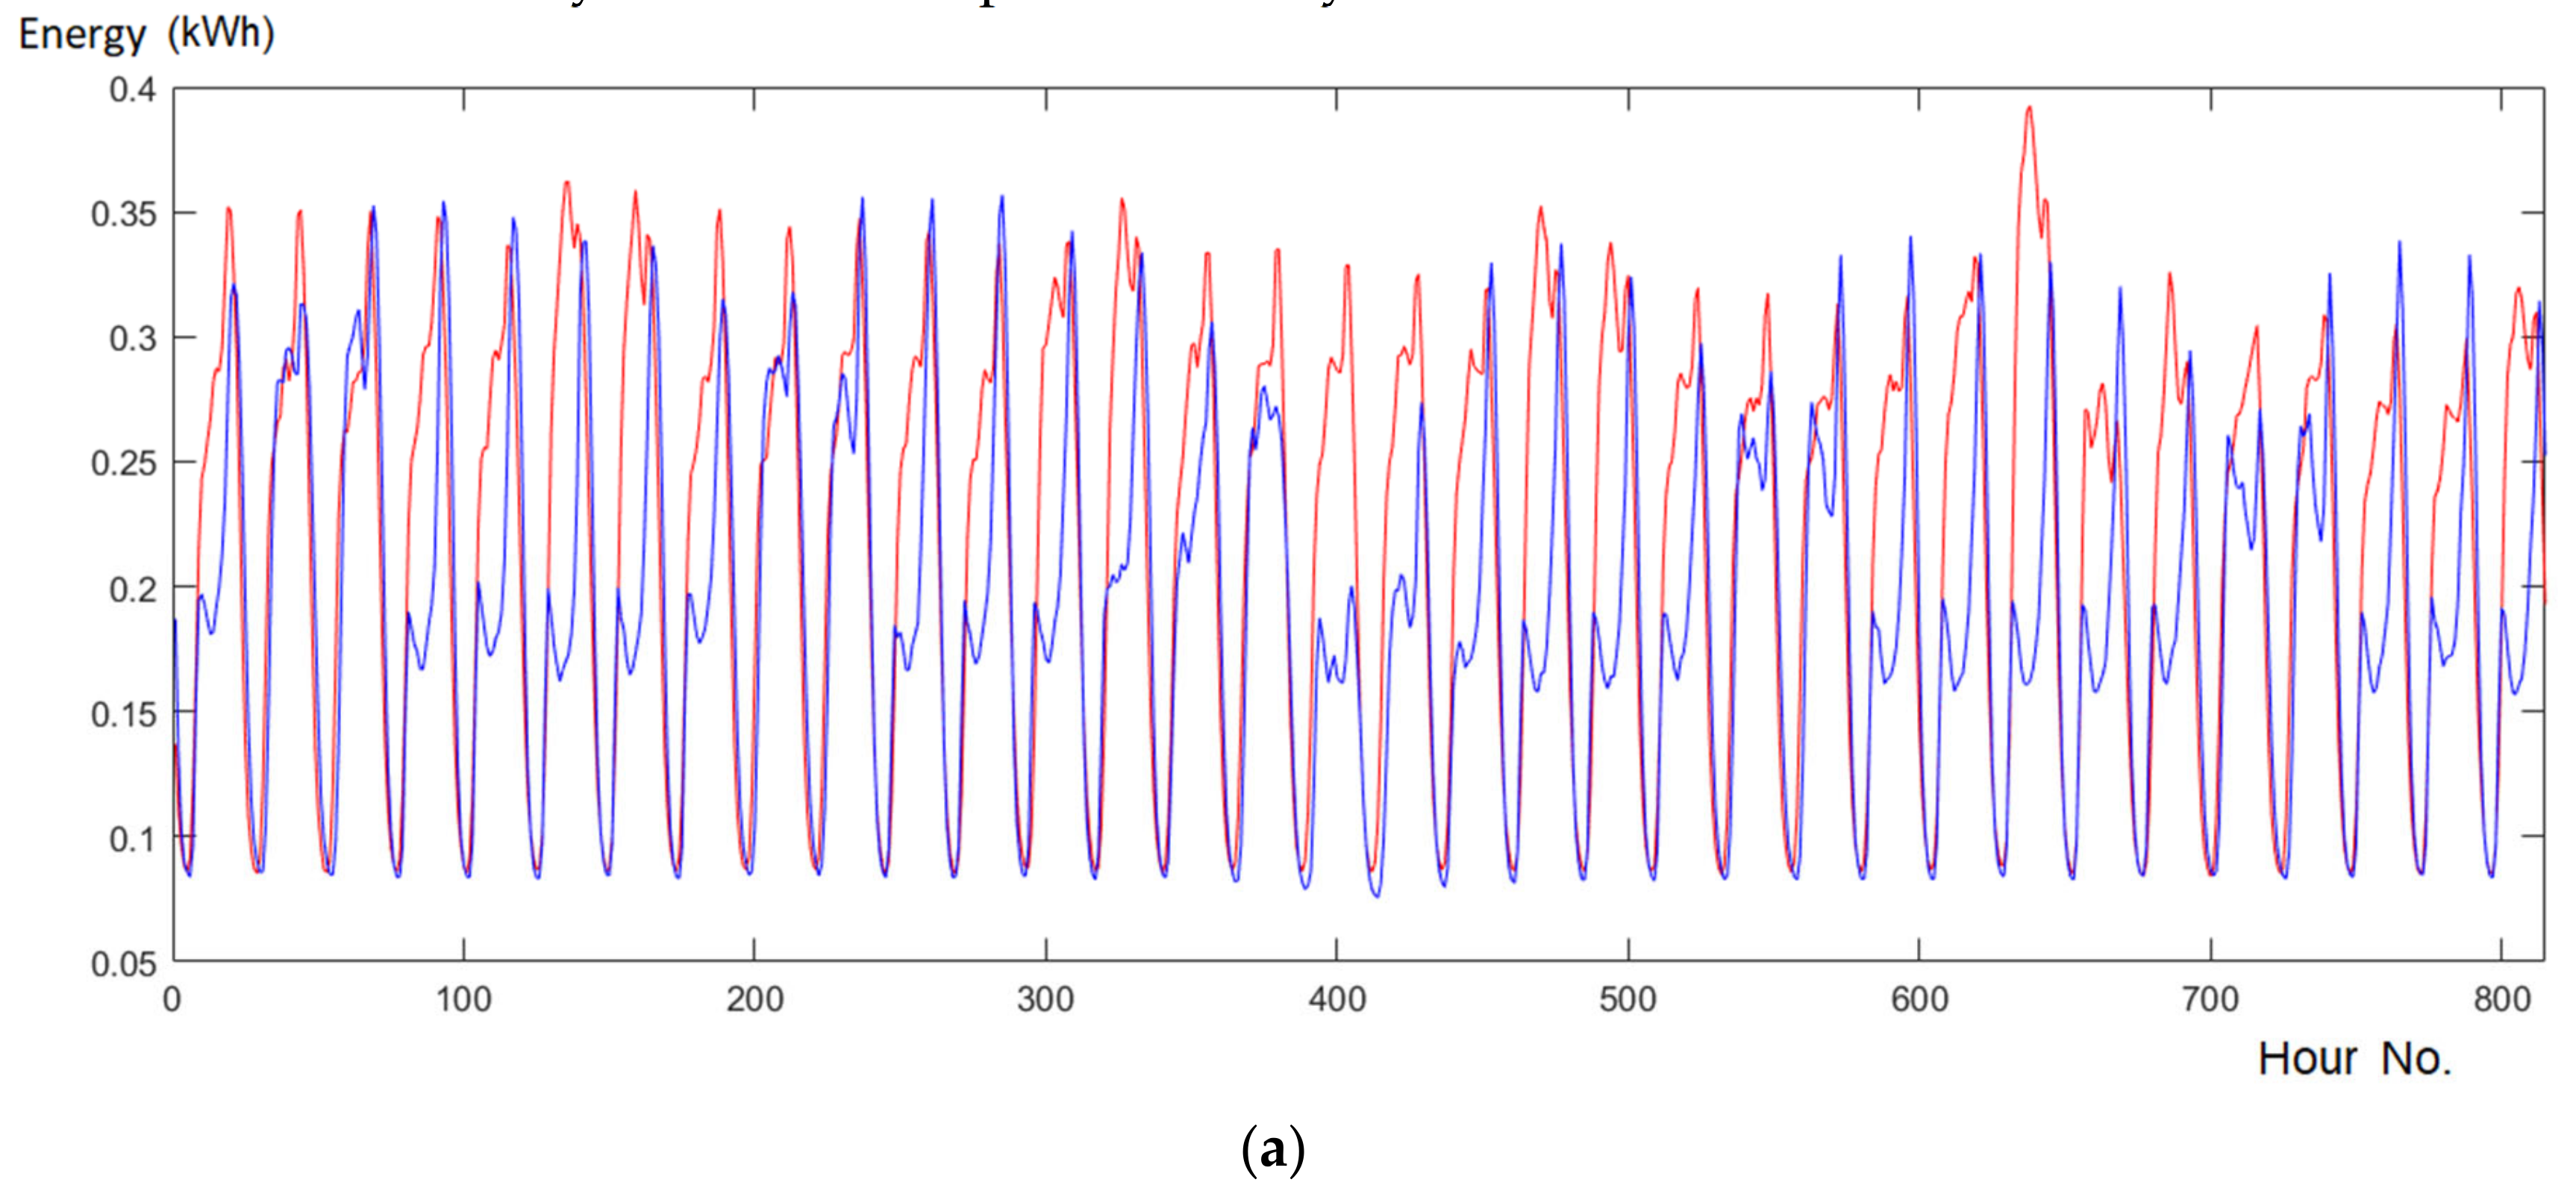
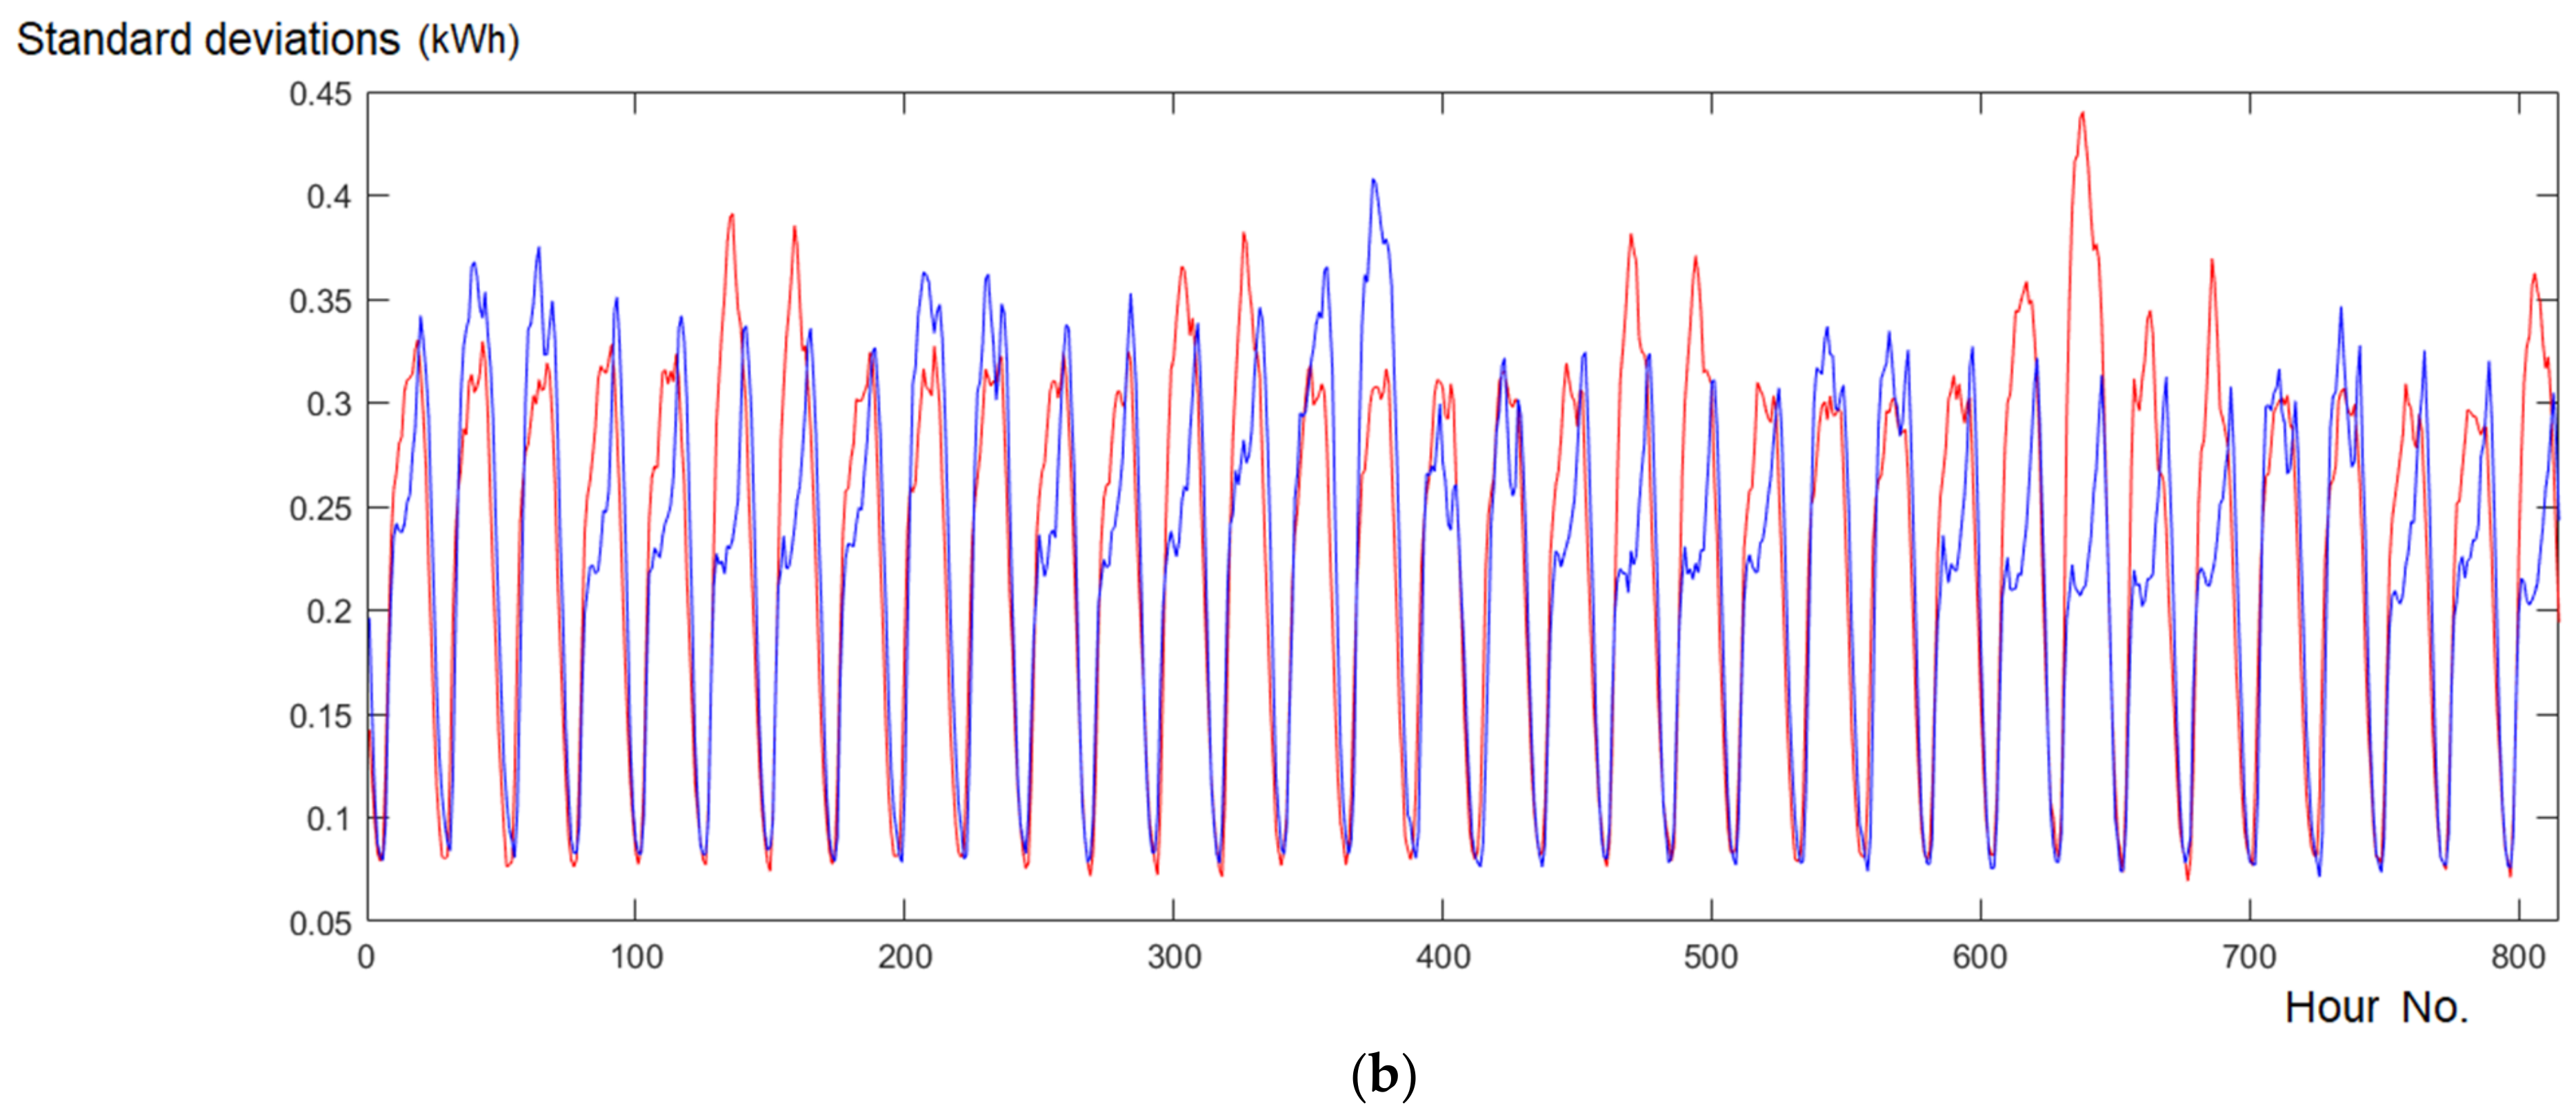
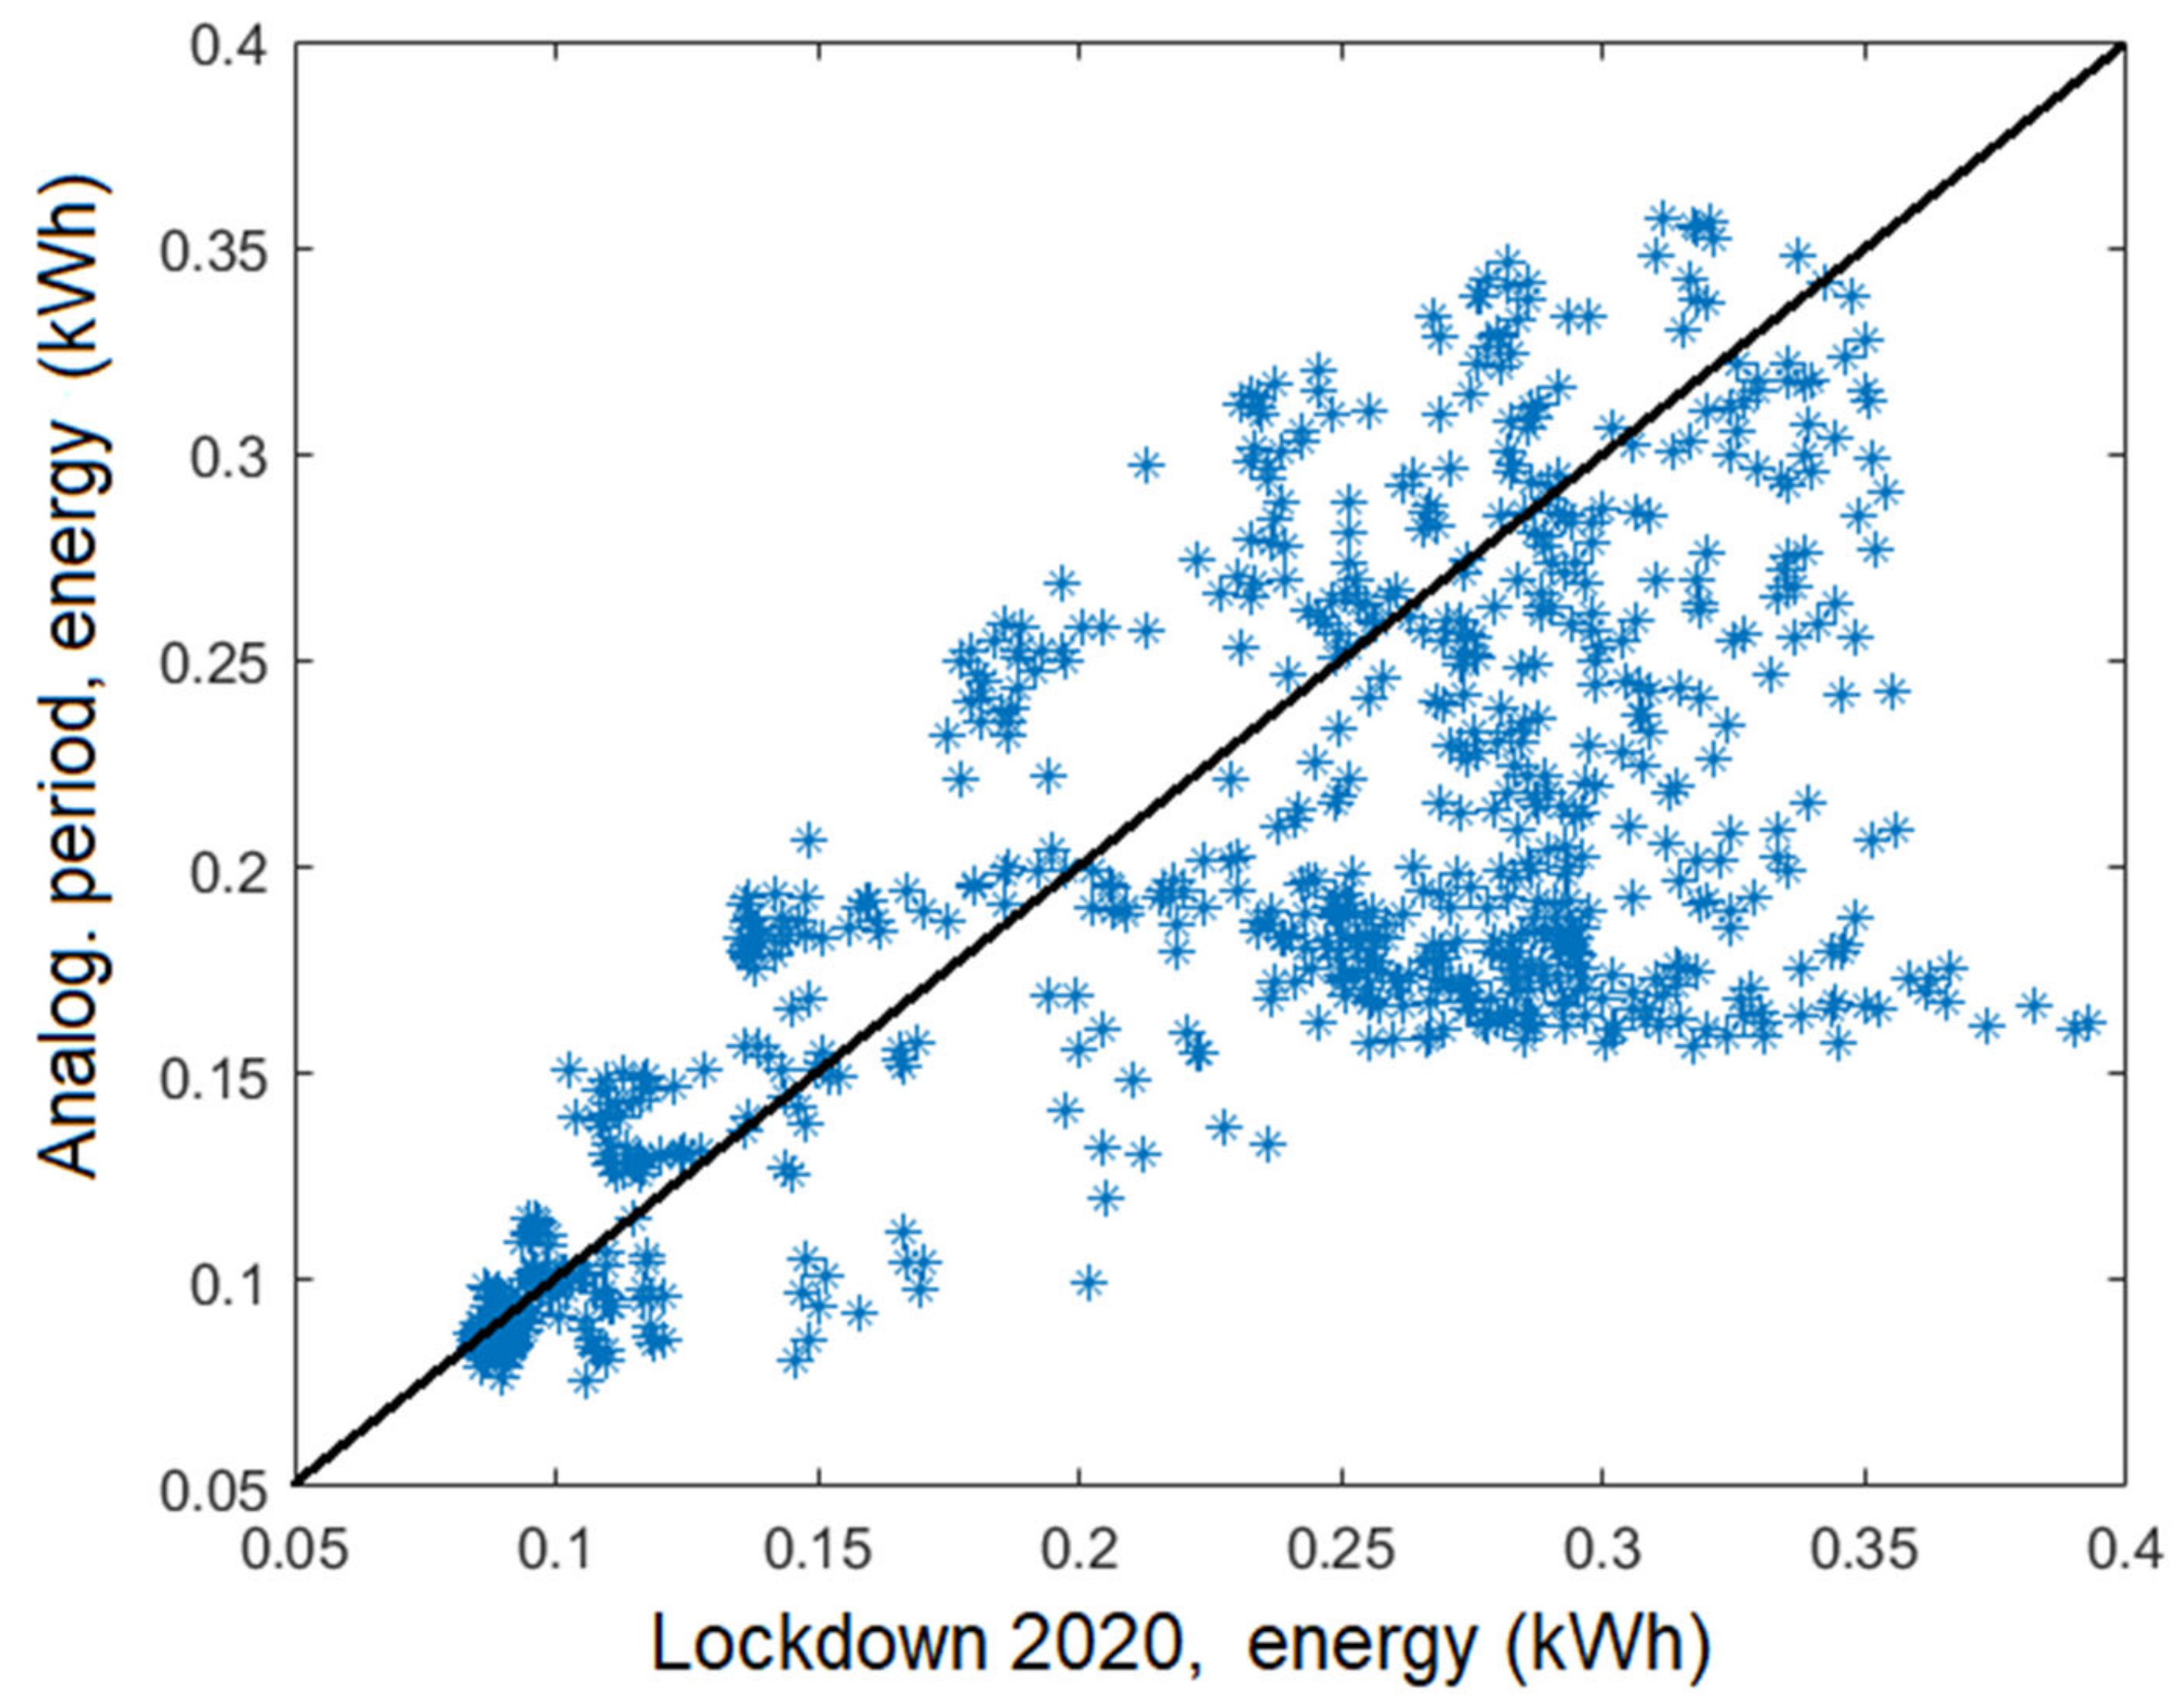
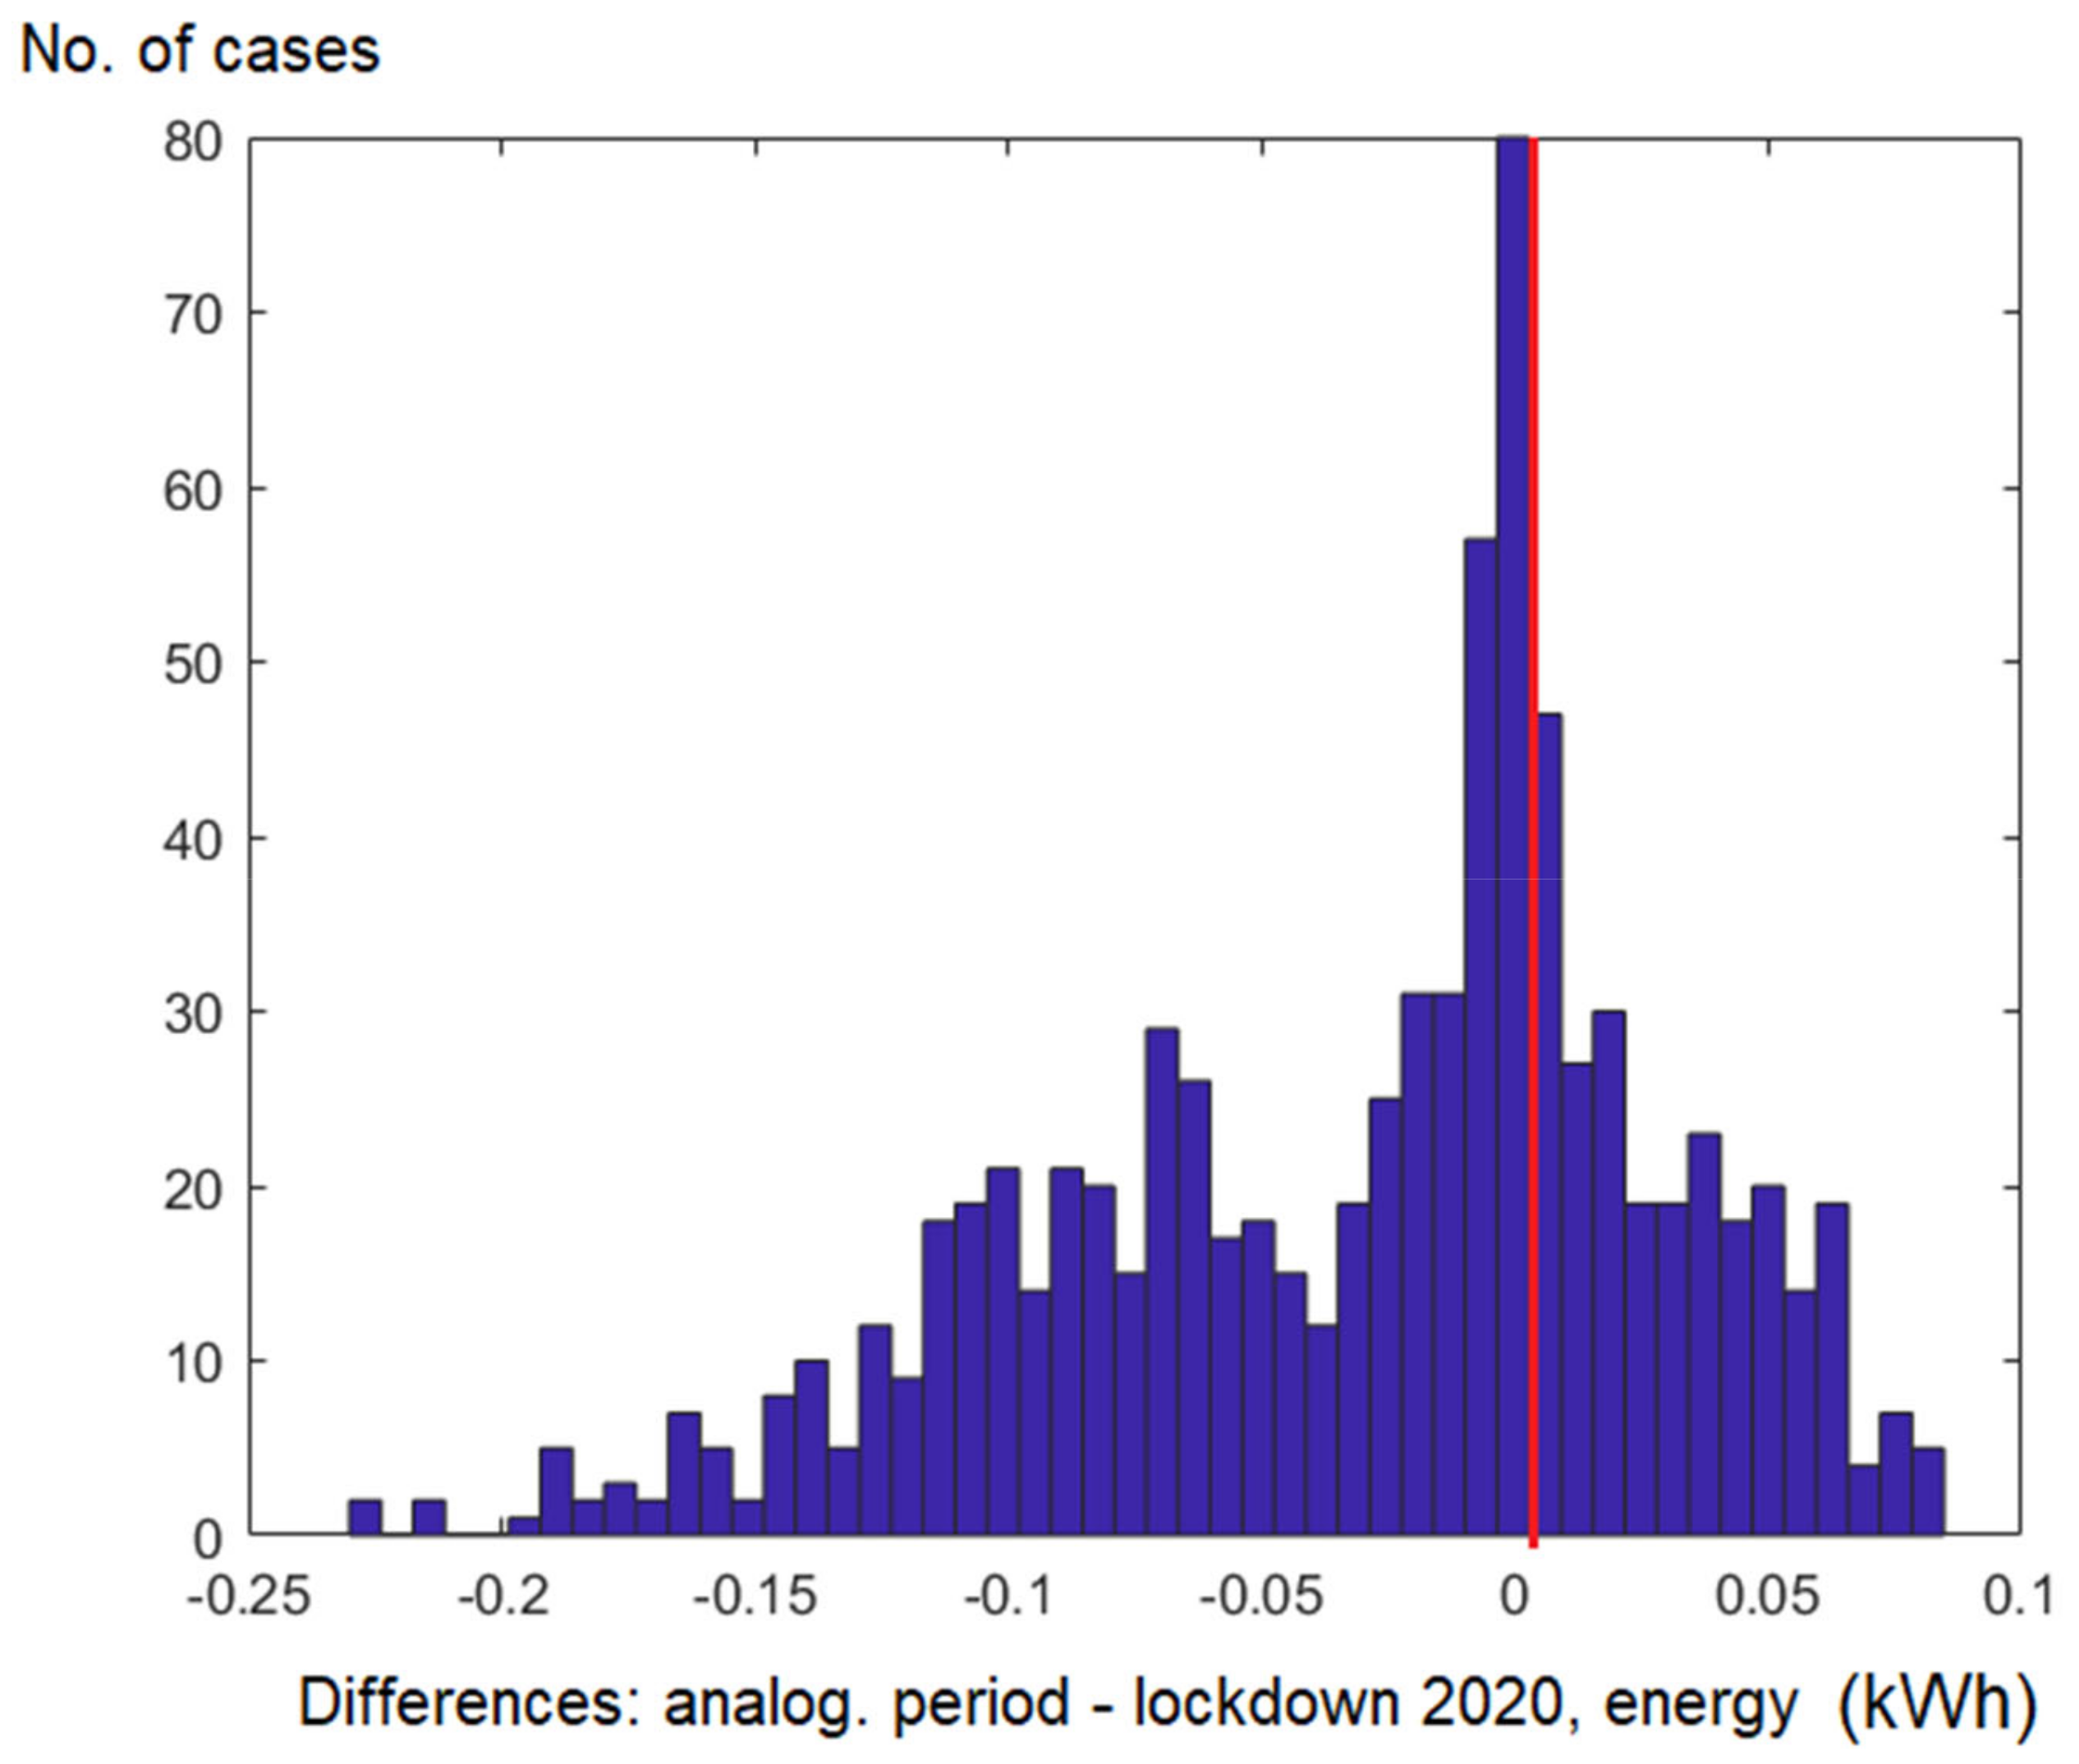
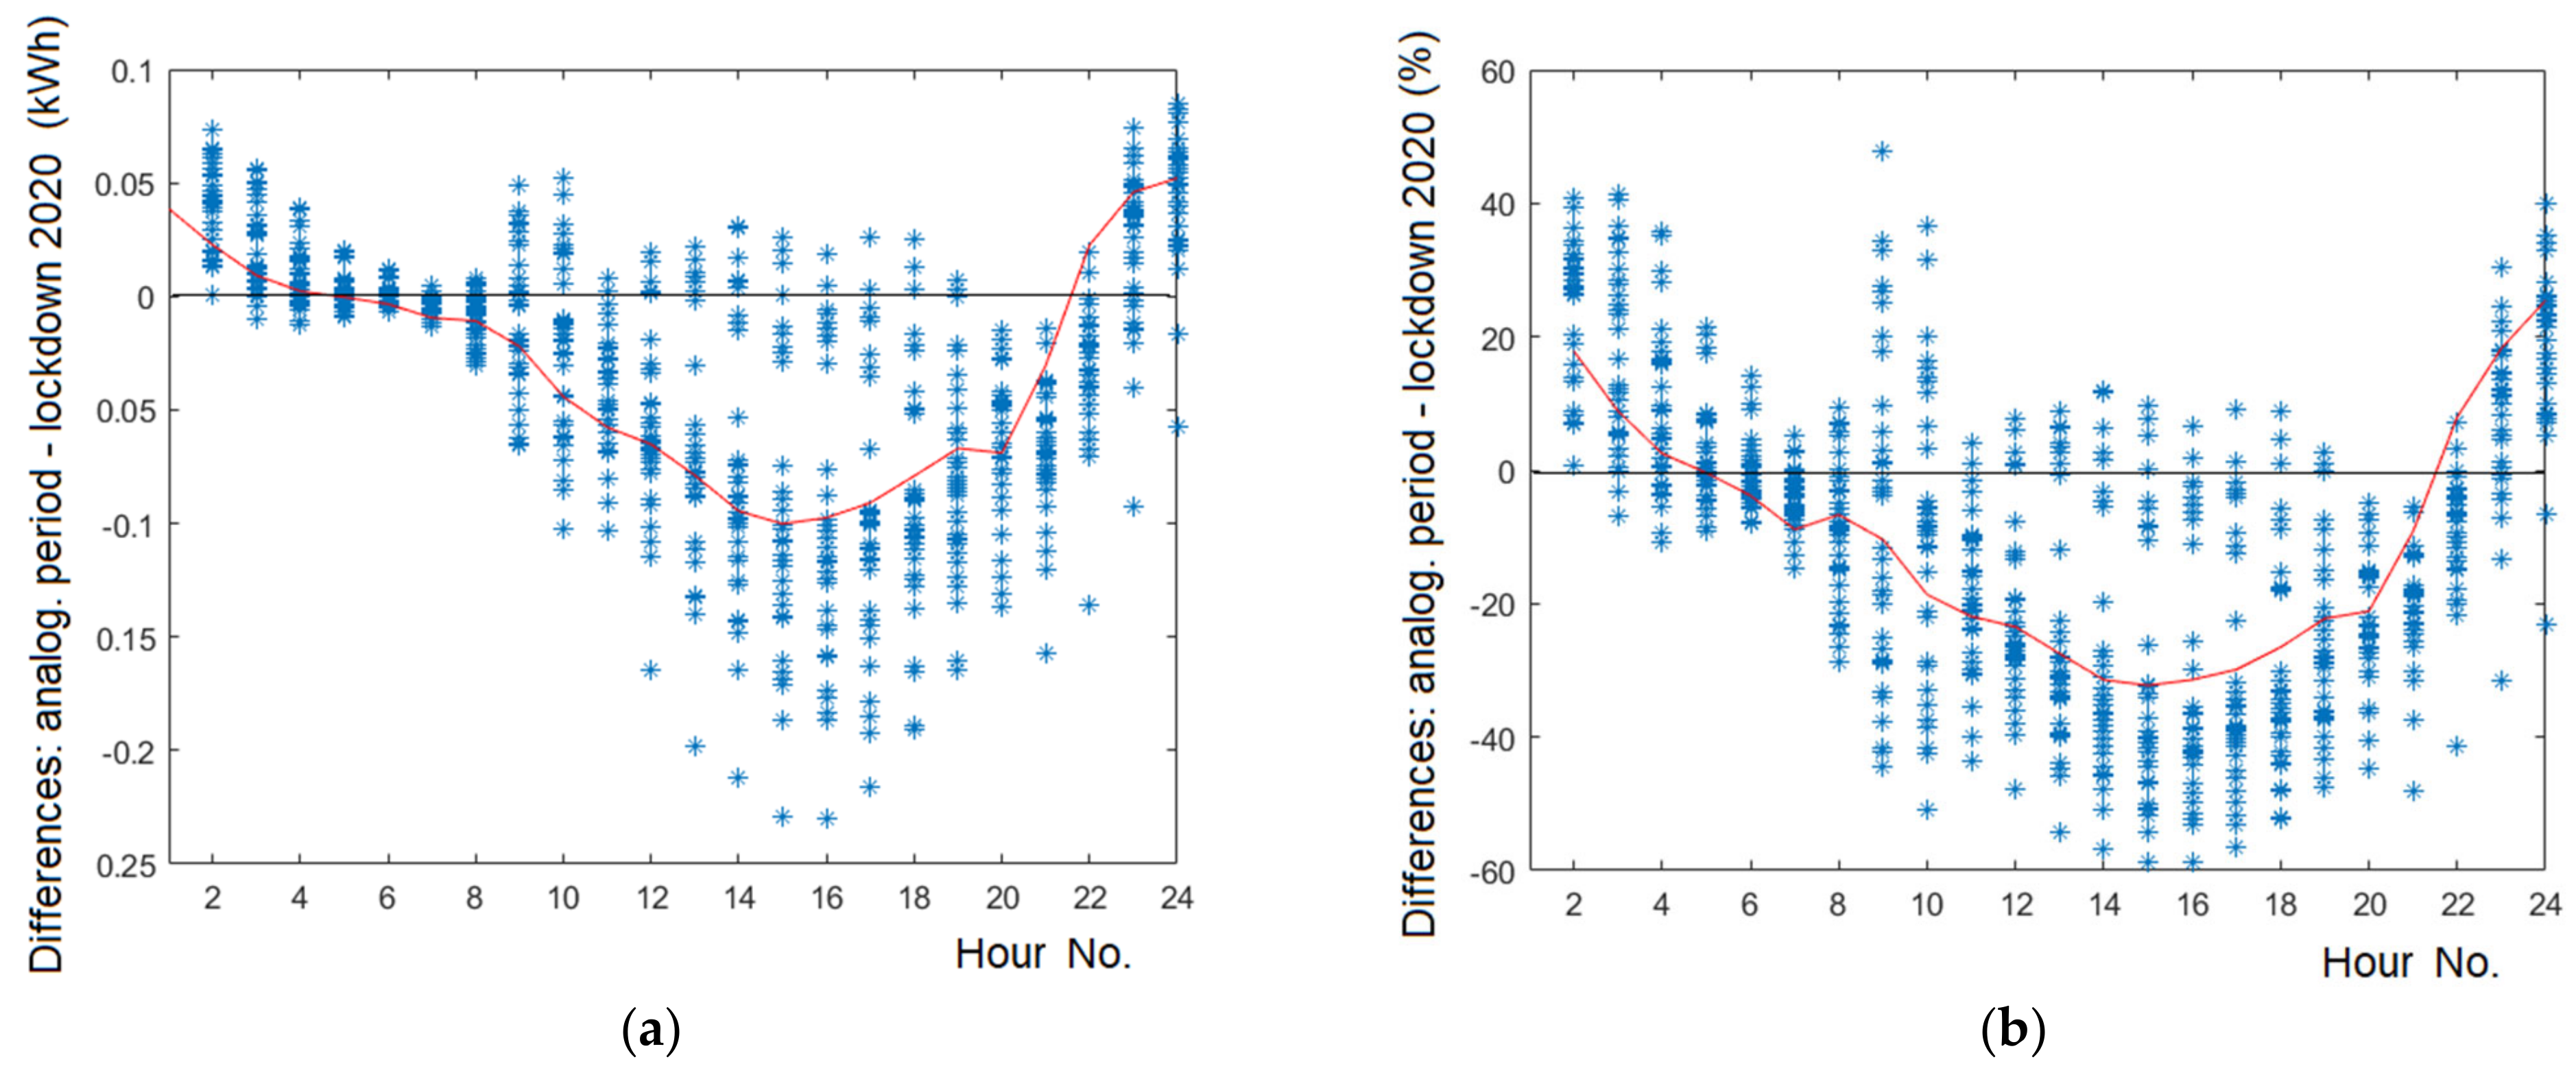
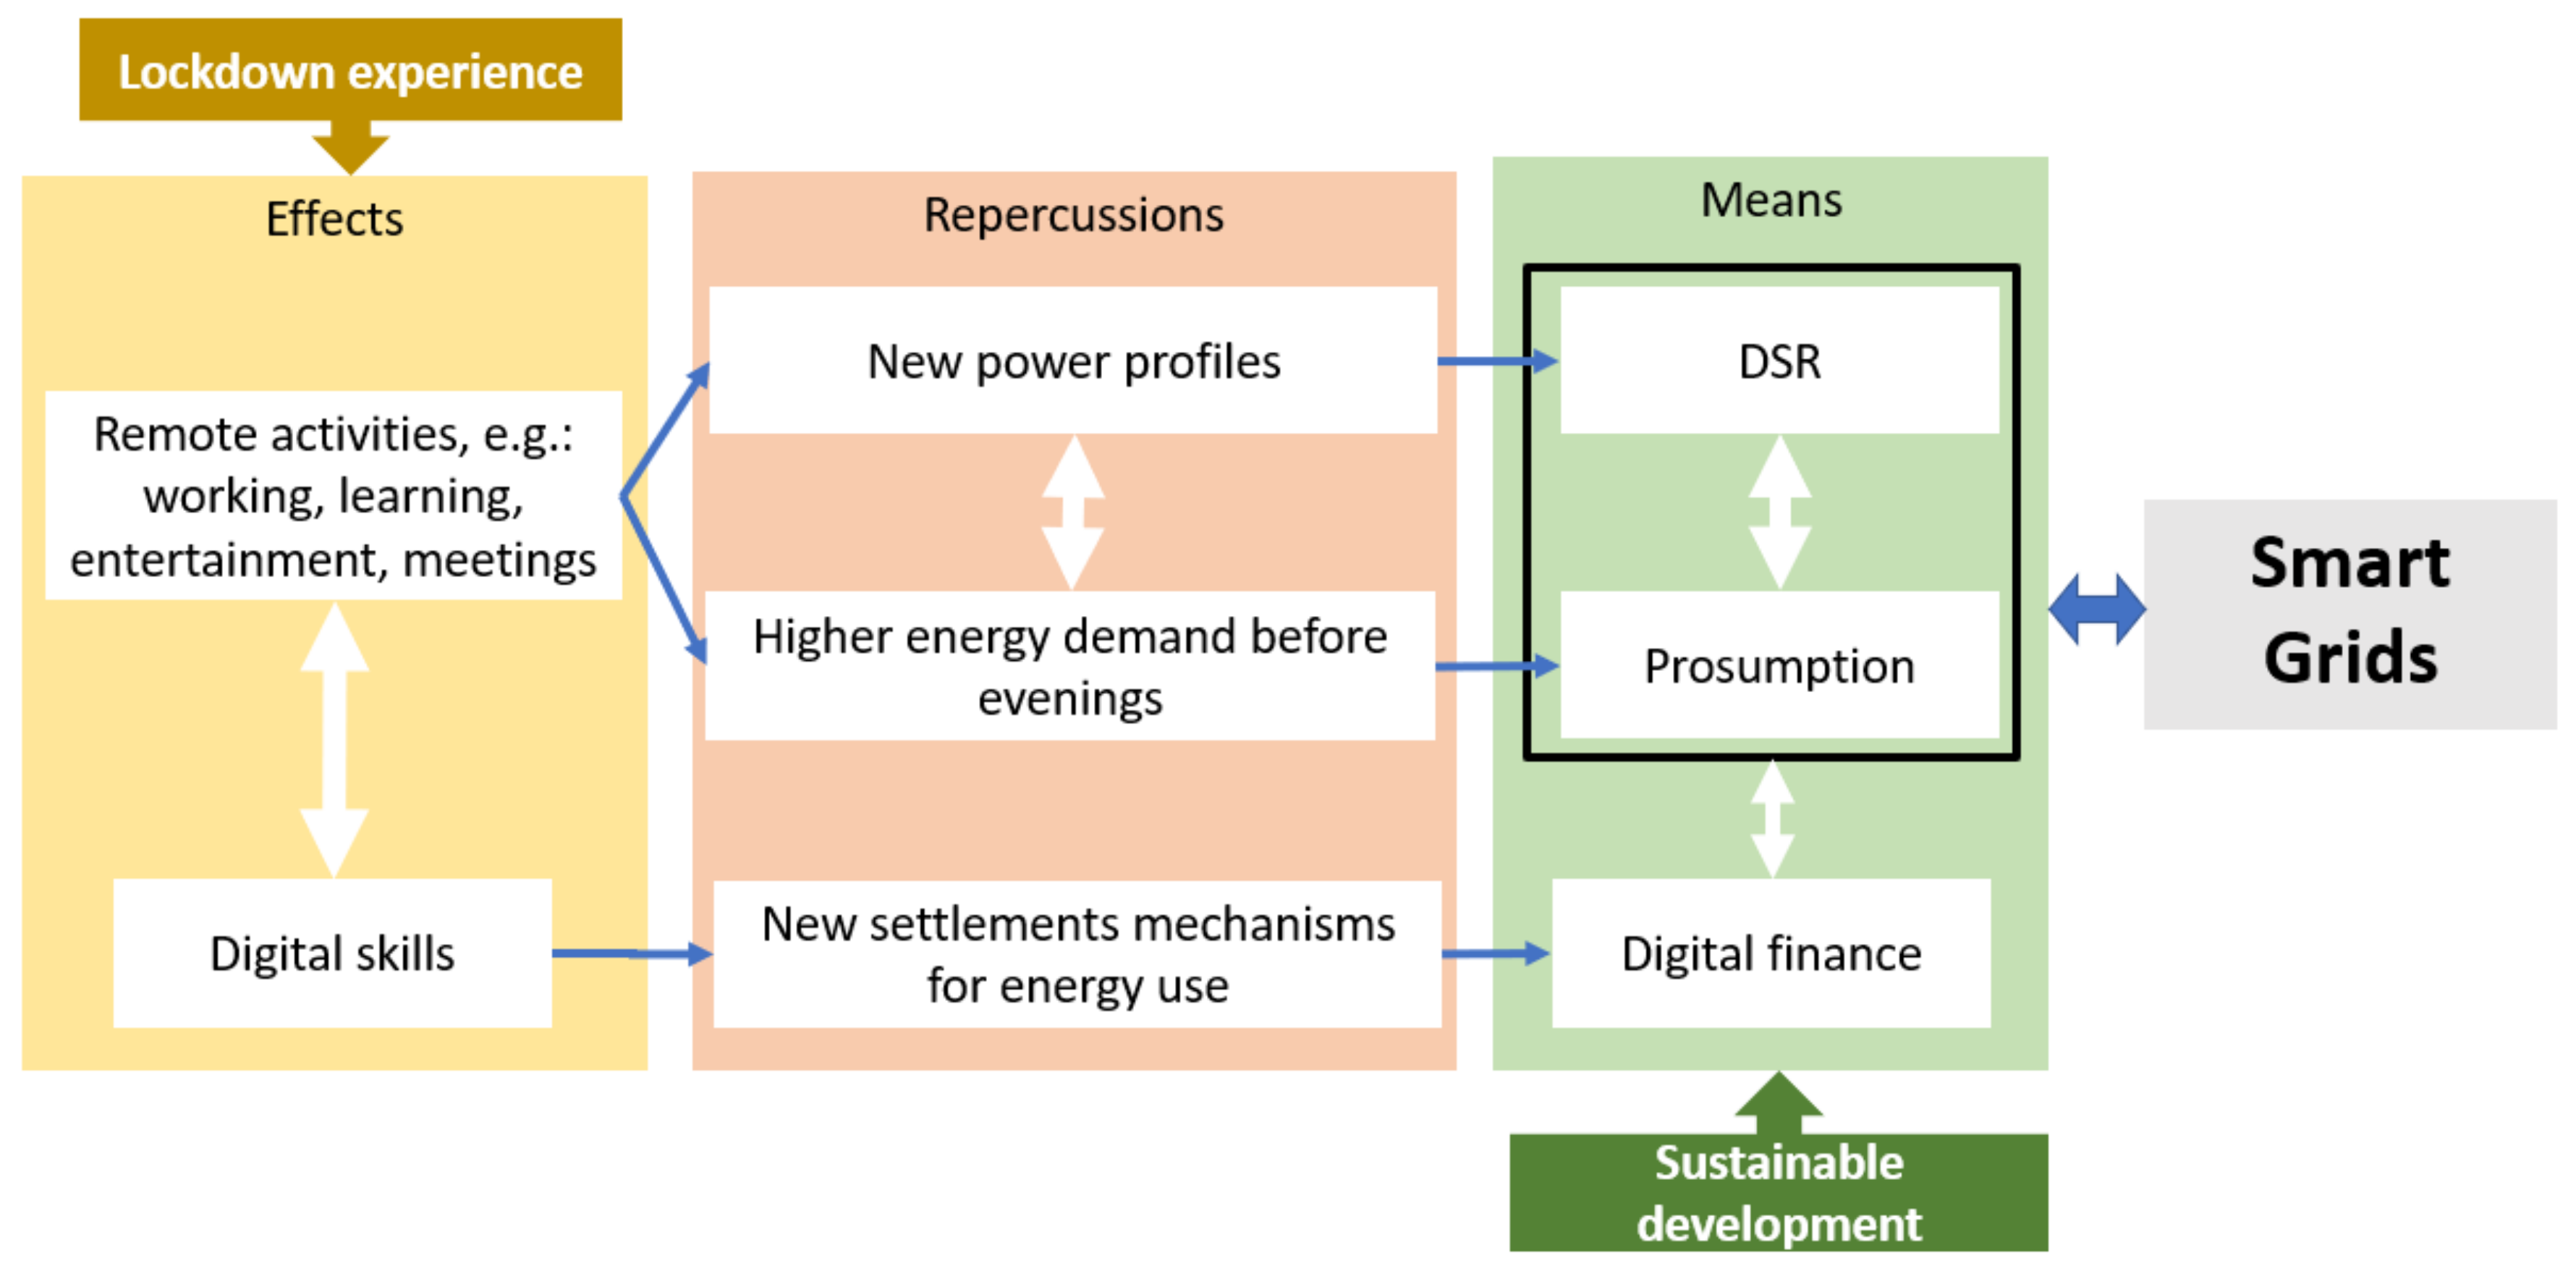
Table 1.
Average values of the peak loads (active power P, apparent power S) of the analysed group of residential users.
Table 1.
Average values of the peak loads (active power P, apparent power S) of the analysed group of residential users.
| Parameter | Lockdown 2020 | Analogous Period 2018 | ||
|---|---|---|---|---|
| P (kW) | S (kVA) | P (kW) | S (kVA) | |
| Average of the peak values of the set of users | 1.651 | 1.668 | 1.714 | 1.732 |
| Peak from averaged loads over the period | 0.393 | 0.433 | 0.357 | 0.396 |
| Median from the peak values of the set of users | 1.698 | 1.714 | 1.70 | 1.716 |
| Peak value from median loads in the period | 0.261 | 0.308 | 0.26 | 0.306 |
| Standard deviation of the peak values of users in the period | 0.587 | 0.584 | 0.598 | 0.595 |
| Standard deviation from the peak loads in the period | 0.299 | 0.399 | 0.409 | 0.391 |
Table 2.
Main limitations of the analysis.
| Limitation | Comments |
|---|---|
| One type of household customers—flats in blocks of flats built in a similar period (after 2005), inhabited by representatives of the middle class of metropolitan society in a Central European country. | The data sample used for the study shows a phenomenon that is the result of a trend that, in lockdown conditions, is observed in the home user group due to the nature and objectives of the restrictions introduced during the forced social quarantine. Qualitatively, the observed trends should be similar in the whole group of household users regardless of location and type of construction (including single or multi-family houses). |
| The data set of users is numerous, although representative of a group of users with a similar standard of living. | Except for extreme groups of residential users (conditions of severe poverty or very high wealth), given the purpose and nature of the forced social quarantine, the trends observed should be specific to the whole group of household users. |
| The lack of information on the attributes of individual users of flats made it impossible to categorise and group profiles | The aim was to set general trends and to compare them with the results of a practical method used to determine peak power in a feeder supplying a different number of dwellings, which does not categorise dwellings concerning additional attributes of their users. |
| The lockdown covered only one season (spring) | There are no other experiences of a similar nature to a general quarantine involving a strict lockdown. The study selected the longest possible period during which residents with appropriate attention were subjected to recommendations and restrictions. |
| The electricity in the study was not used for heating purposes, including domestic hot water preparation or cooling | The use of electricity produced conventionally is not very energy efficient. Heat can come from a properly adapted district heating network. |
| The load data were averaged over 1-h intervals, so they do not take into account the instantaneous power consumption | The averaging period is appropriate to time constants of elements used in networks (e.g., wires and cables) and allows for appropriate elimination of short, incidental and uncharacteristic load peaks from consideration. |
| Estimating the peak in supply feeders based on the results obtained does not take into account the possible impact of generation sources in the installation (prosumer installations). | The analysed set of users allowed the observation of the energy demand (as a base) in the analysed periods. The impact of prosumer installations within the residential building installation is an additional issue. |
| Measurement data from the lockdown period included its different stages in terms of the range of restrictions. | The stark lockdown covered 76% of the time from which the measurement data was collected, of which the total lockdown covered more than half. The whole period from which the data were analysed covers the time when remote working and learning was common, residents followed the recommendations to spend most of their time in their flats, avoiding contact with other people. Therefore, the way and nature of energy use by the residents in the different stages of the analysed period did not differ significantly in terms of the typical daily schedule of the residents. Furthermore, the analysed peaks were selected as maximum values for the user from the whole analysed period. |
| Precision of measurement data | The measurement data were obtained from certified electricity meters (under the class standards in force in Poland: not less than 1 for active energy and 3 for reactive energy), installed at the end-users. The current legalization feature for all devices and the remote reading system allows reducing measurement errors. To eliminate possible thick errors, 5% of the records with the highest and 5% with the lowest peak power recorded during the data collection period have been removed from the measurement data set (in the set with data from 2020 and 2018). |
| Not all working residents could do remote work | The measurement data provide a view of the situation among a diverse group of residents of a typical housing estate in a large Central European city, showing the use of energy in extreme conditions (lockdown). Some of the lockdown users stayed in their flats, carrying out other activities (suspension of activities by their employers), some went to their workplaces on a similar scale as before the pandemic. |
Table 3.
Potential impact of a lockdown on the use of electricity in dwellings.
| Criterion | Effects | |
|---|---|---|
| Immediate | Postponed in Time | |
| Character | Technical (network load) Economic (energy and infrastructure costs) | Technical (changes in network infrastructure) Mental (changes in energy use) Economic (investment in equipment and services) Social (new prosumer organisations) |
| Source of knowledge about them | Measurements | Observations, surveys, suppositions, measurements |
| Effects identified | Changes in the shape of the daily profile Increase in energy consumption during the daytime h | Interest of users: -services based on remote communication, e.g. based on DSR -smart home and Smart Grid possibilities -own RES, prosumption -new forms and methods of electronic settlements based on digital finance |
| Reasons | Fulfilling current life and work needs | Increased digital competences of residents, available Smart Grid possibilities, awareness of users’ needs |
| Spread after the pandemic | Possible changes, towards the restoration of the pre-lockdown condition, but rather only partial restoration is to be expected | Successive expansion (diffusion of tools) |
| Required reaction from | DSOs | |
| Current monitoring of the state of the network | Implementation of new services, activating users Openness to new participants (e.g. brokers, aggregators, cooperatives Changes in the current paradigm of network functioning Smart-metering diffusion Development of the network for the implementation of the Smart Grid | |
| Power network designers | ||
| A grid designed according to the existing guidelines (e.g., [98]) can withstand (due to peak power) the observed loads with an additional reserve. | Taking into account the possibility of two-way energy flow in the distribution network (within the area of the estate) from prosumer sources Taking into account the possibility of powering EV charging stations Providing functionality of Smart Grid solutions | |
| End users | ||
| Monitoring of consumption Rational energy management | To be active in exploiting the technical possibilities and rules of the market. Participation in energy initiative group (e.g., clusters, cooperatives) Monitoring of consumption Rationalisation of the use of equipment for the DSR Cooperation with new service providers | |
| Regulators | ||
| Current activities (same as before the pandemic) | Implementation of new forms of protection for energy-poor consumers Monitoring of the expanded market – new forms of activity, in the interest of end-users | |
Publisher’s Note: MDPI stays neutral with regard to jurisdictional claims in published maps and institutional affiliations. |
© 2021 by the authors. Licensee MDPI, Basel, Switzerland. This article is an open access article distributed under the terms and conditions of the Creative Commons Attribution (CC BY) license (http://creativecommons.org/licenses/by/4.0/).
Share and Cite
MDPI and ACS Style
Bielecki, S.; Skoczkowski, T.; Sobczak, L.; Buchoski, J.; Maciąg, Ł.; Dukat, P. Impact of the Lockdown during the COVID-19 Pandemic on Electricity Use by Residential Users. Energies 2021, 14, 980. https://doi.org/10.3390/en14040980
AMA Style
Bielecki S, Skoczkowski T, Sobczak L, Buchoski J, Maciąg Ł, Dukat P. Impact of the Lockdown during the COVID-19 Pandemic on Electricity Use by Residential Users. Energies. 2021; 14(4):980. https://doi.org/10.3390/en14040980
Chicago/Turabian StyleBielecki, Sławomir, Tadeusz Skoczkowski, Lidia Sobczak, Janusz Buchoski, Łukasz Maciąg, and Piotr Dukat. 2021. "Impact of the Lockdown during the COVID-19 Pandemic on Electricity Use by Residential Users" Energies 14, no. 4: 980. https://doi.org/10.3390/en14040980
Note that from the first issue of 2016, this journal uses article numbers instead of page numbers. See further details here.