Article

Mortality Prediction of COVID-19 Patients Using Radiomic and Neural Network Features Extracted from a Wide Chest X-ray Sample Size: A Robust Approach for Different Medical Imbalanced Scenarios

1
Medical Physics Unit, Azienda USL-IRCCS di Reggio Emilia, 42123 Reggio Emilia, Italy
2
Department of Physics and Astronomy-DIFA, University of Bologna, 40126 Bologna, Italy
3
Radiology Unit, Azienda USL-IRCCS di Reggio Emilia, 42123 Reggio Emilia, Italy
4
Clinical and Experimental Medicine PhD Program, University of Modena and Reggio Emilia, 41121 Modena, Italy
5
Department of Experimental, Diagnostic and Specialty Medicine–DIMES, 40126 Bologna, Italy
6
Istituto Nazionale di Fisica Nucleare (INFN), 40127 Bologna, Italy
7
Clinical Immunology, Allergy and Advanced Biotechnologies Unit, Azienda USL-IRCCS di Reggio Emilia, 42123 Reggio Emilia, Italy
8
Rheumatology Unit, Azienda USL-IRCCS di Reggio Emilia, 42123 Reggio Emilia, Italy
9
Rheumatology Division, University of Modena and Reggio Emilia, 41121 Modena, Italy
*
Author to whom correspondence should be addressed.
These authors contributed equally to this work.
Appl. Sci. 2022, 12(8), 3903; https://doi.org/10.3390/app12083903
Submission received: 15 March 2022 / Revised: 4 April 2022 / Accepted: 6 April 2022 / Published: 12 April 2022

Abstract

:
Aim: The aim of this study was to develop robust prognostic models for mortality prediction of COVID-19 patients, applicable to different sets of real scenarios, using radiomic and neural network features extracted from chest X-rays (CXRs) with a certified and commercially available software. Methods: 1816 patients from 5 different hospitals in the Province of Reggio Emilia were included in the study. Overall, 201 radiomic features and 16 neural network features were extracted from each COVID-19 patient’s radiography. The initial dataset was balanced to train the classifiers with the same number of dead and survived patients, randomly selected. The pipeline had three main parts: balancing procedure; three-step feature selection; and mortality prediction with radiomic features through three machine learning (ML) classification models: AdaBoost (ADA), Quadratic Discriminant Analysis (QDA) and Random Forest (RF). Five evaluation metrics were computed on the test samples. The performance for death prediction was validated on both a balanced dataset (Case 1) and an imbalanced dataset (Case 2). Results: accuracy (ACC), area under the ROC-curve (AUC) and sensitivity (SENS) for the best classifier were, respectively, 0.72 ± 0.01, 0.82 ± 0.02 and 0.84 ± 0.04 for Case 1 and 0.70 ± 0.04, 0.79 ± 0.03 and 0.76 ± 0.06 for Case 2. These results show that the prediction of COVID-19 mortality is robust in a different set of scenarios. Conclusions: Our large and varied dataset made it possible to train ML algorithms to predict COVID-19 mortality using radiomic and neural network features of CXRs.

1. Introduction

SARS-CoV-2 disease (COVID-19) globally impacted the whole world during 2020 [1], and the number of infected patients and mortality grew rapidly throughout 2021 [2]. At the beginning of the pandemic, the standard protocol in Italian hospitals for diagnosing pneumonia in patients with pulmonary issues entering the emergency room consisted of chest X-ray radiography (CXR). CXR is a more widely used, simpler and faster radiological technique than high-resolution computed tomography (HRCT). Additionally, as reported in Soda [3], it induces lower radiation doses. Clinicians often perform an HRCT scan as a follow-up exam for a deeper investigation for suspected COVID lesions highlighted by the X-ray radiography. As CT imaging is a 3D imaging modality, it is able to capture more information than CXR [4]. The main drawbacks of CXR and HRCT are the exposure of patients to ionizing radiation, the inability to distinguish between different viruses, and their uselessness in asymptomatic cases [5].
The development of laboratory tests such as the rapid antigen, molecular real-time polymerase chain reaction (RT-PCR) and serological tests was fundamental for a fast, accurate, and cost-effective diagnosis and for monitoring the spread of SARS-CoV-2 [5]. The rapid antigen test is intended to detect specific antigens from the SARS-CoV-2 virus in individuals with suspected COVID-19. RT-PCR is a molecular test that directly measures parts of the viral genome or viral transcripts [5]. The serological test detects the presence of antibodies, which are generated over days to weeks after infection exposure [6].
With the large-scale availability of these tests, CXRs and HRCTs were no longer fundamental for detecting the disease, but remained the standard procedure for any in-depth diagnostic assessment and auxiliary diagnostic tool for symptomatic patients in the early stage, whose viral load is low and difficult to identify using laboratory tests [7]. Although the Italian Society of Medical and Interventional Radiology stated that chest imaging cannot replace laboratory diagnostic tests [8], an advantage of radiological imaging is the possibility to conduct systematic and thorough analysis such as the quantification of healthy lung parenchyma compared to emphysema, ground-glass opacity and consolidation [9]. The current gold standard diagnostic tool is RT-PCR, but it lacks accuracy, has limited sensitivity (71% to 98%) [10] and is time-consuming [5]. Therefore, diagnostic methods should be further developed and improved [5,6,7].
In the first half of 2020, due to the shortage of laboratory tests, early imaging findings became fundamental for predicting a patient’s prognosis and the course of his disease [11].
Deep learning (DL) algorithms have been extensively applied for COVID-19 detection/segmentation of infected pneumonia regions from HRCTs and CXRs [12,13,14,15,16]. Shiri [12] built a residual network to develop a fast, consistent, robust and human error immune framework for lung and pneumonia lesion detection and quantification. Ozturk [14] proposed a model to provide accurate diagnostics for binary classification (COVID vs. No-Findings) and multi-class classification (COVID vs. No-Findings vs. Pneumonia). For a complete literature review of the application of DL in chest imaging, consider Laino [4].
Many recent studies have also attempted to predict COVID-19 patient clinical prognosis (either mortality, mechanical ventilation requirement, hospitalization or need for intubation) by feeding machine learning (ML) methods with clinical/demographic and/or radiomic features extracted from CXRs or HRCTs [3,17,18,19,20,21,22,23,24,25]. In their recent study, Bae [17], Varghese [19], and Shiri [23] showed the potential usefulness of information extracted from radiographs. Radiomics is an image data mining framework that extracts extensive information from medical images using a range of features, based on the pixel values of the images; a correlation is then established with clinical and biological findings. Imaging analysis through radiomics provides a non-invasive approach to improving diagnosis, prognosis, therapy response and survival prediction [26,27,28,29]. One of the main limitations of some of these studies is the shortage of available COVID-19 CXRs and HRCTs, which leads to the creation of small datasets.
In addition, it is well known that class imbalance is one of the main causes of the decrease of generalization in DL and ML algorithms [15,16,30,31,32,33,34]. Bridge [16] proposed a novel activation function to improve COVID diagnosis performance when one class significantly outweighs the other. In specific situations, such as in medical datasets, the cost of a misprediction in the minority classes (ill or high-risk patients) is much more problematic than a misprediction in the majority class (healthy or low-risk patients). Therefore, there is a need for a good sampling technique for medical datasets.
In this panorama, we aimed to develop prognostic models to predict mortality in COVID-19 patients using neural network and radiomic features of CXRs, extracted with a certified (CE marked) and commercially available tool (QUIBIM Chest X-ray Classifier software) to automatically segment the CXRs and extract relevant features. The advantage of using an automatic technique for lung segmentations is to overcome limitations linked to radiologist manual segmentations, such as the extensive time necessary for the task and the heavy user-dependence. Applications of AI in medical imaging entail numerous advantages [35] even if they have still some criticalities [36]. After CXR segmentations, the software extracts 201 first order and second order radiomic features. In addition, the QUIBIM Chest X-ray Classifier tool employs a neural network for automatic detection of pulmonary nodules or masses on chest radiographs. It analyzes each CXR, identifies the characteristic pattern of the lung lesions present and provides the probability for the lesion to belong to 16 different lesion types. Given the high imbalance of the input dataset, we have arranged a balanced dataset for the training pipeline, but we have validated the performance for death prediction on both balanced and imbalanced test sets.
To our knowledge, only one other study [37] has employed the QUIBIM certified tool, though not for mortality prediction. However, we believe the use of a certified and commercially available software and its verification in a clinical context is essential to making research studies fully reproducible and effectively applicable in contexts of everyday reality.
The main and new advantage of our approach lies in our models’ generalizability to different medical scenarios, characterized by balanced and imbalanced datasets. In fact, according to the data collected by the Istituto Superiore di Sanità [38], in Italy the rate of patient deaths in intensive care units varied between about 15% to about 50%, throughout the period of March 2020–July 2020 [39]. A similar variability has been reported in other studies from other countries [40,41,42,43,44,45]. An even more imbalanced case study is represented by COVID-19 patients collected based on visits to the emergency room. Similar conditions have occurred in the Azienda Unità Sanitaria Locale-IRCCS di Reggio Emilia, which comprises different hospitals and medical centers. This was the reason that led to our study. To our knowledge, this aspect had not been analyzed by any of the previous studies. We believe our model could appropriately be applied to all these different contexts and could have supported clinical decision-making and helped hospital resource allocation throughout the period under study. It could have helped clinicians to establish the seriousness of the ongoing disease and decide which patients to hospitalize or move to intensive care.
A key strength of our study with respect to those previously conducted is the numerosity of our data, which allowed us to test and validate our models on different scenarios. With respect to other studies conducted in Italy, we believe we have a considerably higher number of patients. For example, Grassi [9] enrolled only 116 patients; from the literature review by Laino [4] we can see that most of the datasets have under 400 COVID-19 positive patients. Moreover, Tamal [46] collected 226 CXRs containing COVID-19, while Bae [17] and Varghese [19] studied 515 and 167 COVID-19 positive patients, respectively. The large number of patients collected enabled us not only to avoid data augmentation techniques, but also to apply an under-sampling technique to obtain the balanced dataset [47]. Moreover, our dataset was processed by collecting images and clinical information of patients coming from an entire province. Therefore, different hospital facilities collaborated on this study.
Finally, a further innovative aspect of our work is the combination of the radiomic features extracted from the CXRs with a set of probability scores that help to assign each lesion to one of 16 different lesion classes.

2. Materials and Methods

2.1. Study Population

The present study is part of a major multicenter project titled “Endothelial, neutrophil, and complement perturbation linked to acute and chronic damage in COVID- 19 pneumonitis coupled with machine learning approaches”, code: COVID-2020-12371808, involving different units of the Azienda Unità Sanitaria Locale-IRCCS di Reggio Emilia, and therefore gathering patients from the entire Province of Reggio Emilia.
The project was conducted following approval by Reggio Emilia’s Ethics Committee (project number dated back to the 28th of July 2020: 855/2020/OSS/AUSLRE) and competent authorities, following the EU and national directives and according to the principles of the Helsinki Declaration.
The patients included in the project had to meet the following inclusion criteria: age >18 years old, positive RT-PCR swab, CXR to confirm the presence of pneumonia. These criteria generated an initial cohort of 2805 patients. A patient subset was identified according to the following additional criteria: patients who had undergone a baseline CXR for pneumonia detection between the 27th of February 2020 and the 30th of May 2020 and a positive RT-PCR swab dating within 12 days from the X-ray exam. Patients with ongoing therapy with steroids and biological agents at diagnosis/baseline were excluded. Following these criteria, the study population amounted to 1816 patients. We managed and supervised the collection and the analysis, in compliance with the rules of the European General Data Protection Regulation (GDPR), of chest imaging data and the data analysis.
Table 1 summarizes the population features, including gender, age and death. Patient deaths were clinically attributed to COVID-19 disease. Our dataset was imbalanced concerning the investigated event (death by COVID-19). A large dataset of CXR images was assembled from multiple centers with different acquisition equipment, so our data have an inherent variability and heterogeneity. Such heterogeneity may be an advantage to demonstrate the generalization capacity of our machine learning algorithms, as stated by Bae [17]. The CXR imaging was acquired using five different types of X-ray equipment adopting both direct radiography units (DR, 81%) and computed radiography units (CR, 19%). In particular, CR images were all acquired with Carestream Health (Carestream Health Inc., Rochester, NY, USA) CR devices (CLASSIC CR 0.38%, CR850A 0.38%, CR975 18.24%). On the other hand, DR images were acquired with DRX-1 (17.01%) and DRX-Revolution Nano (0.81%) from Carestream Health, as well as DigitalDIAGNOST (63.18%) from Philips (Koninklijke Philips N.V., Eindhoven, Netherlands). All devices were subjected to periodic quality assurance controls according to procedures described in the literature [48,49]. To our knowledge, none of the previous studies have employed a comparable number of different devices.

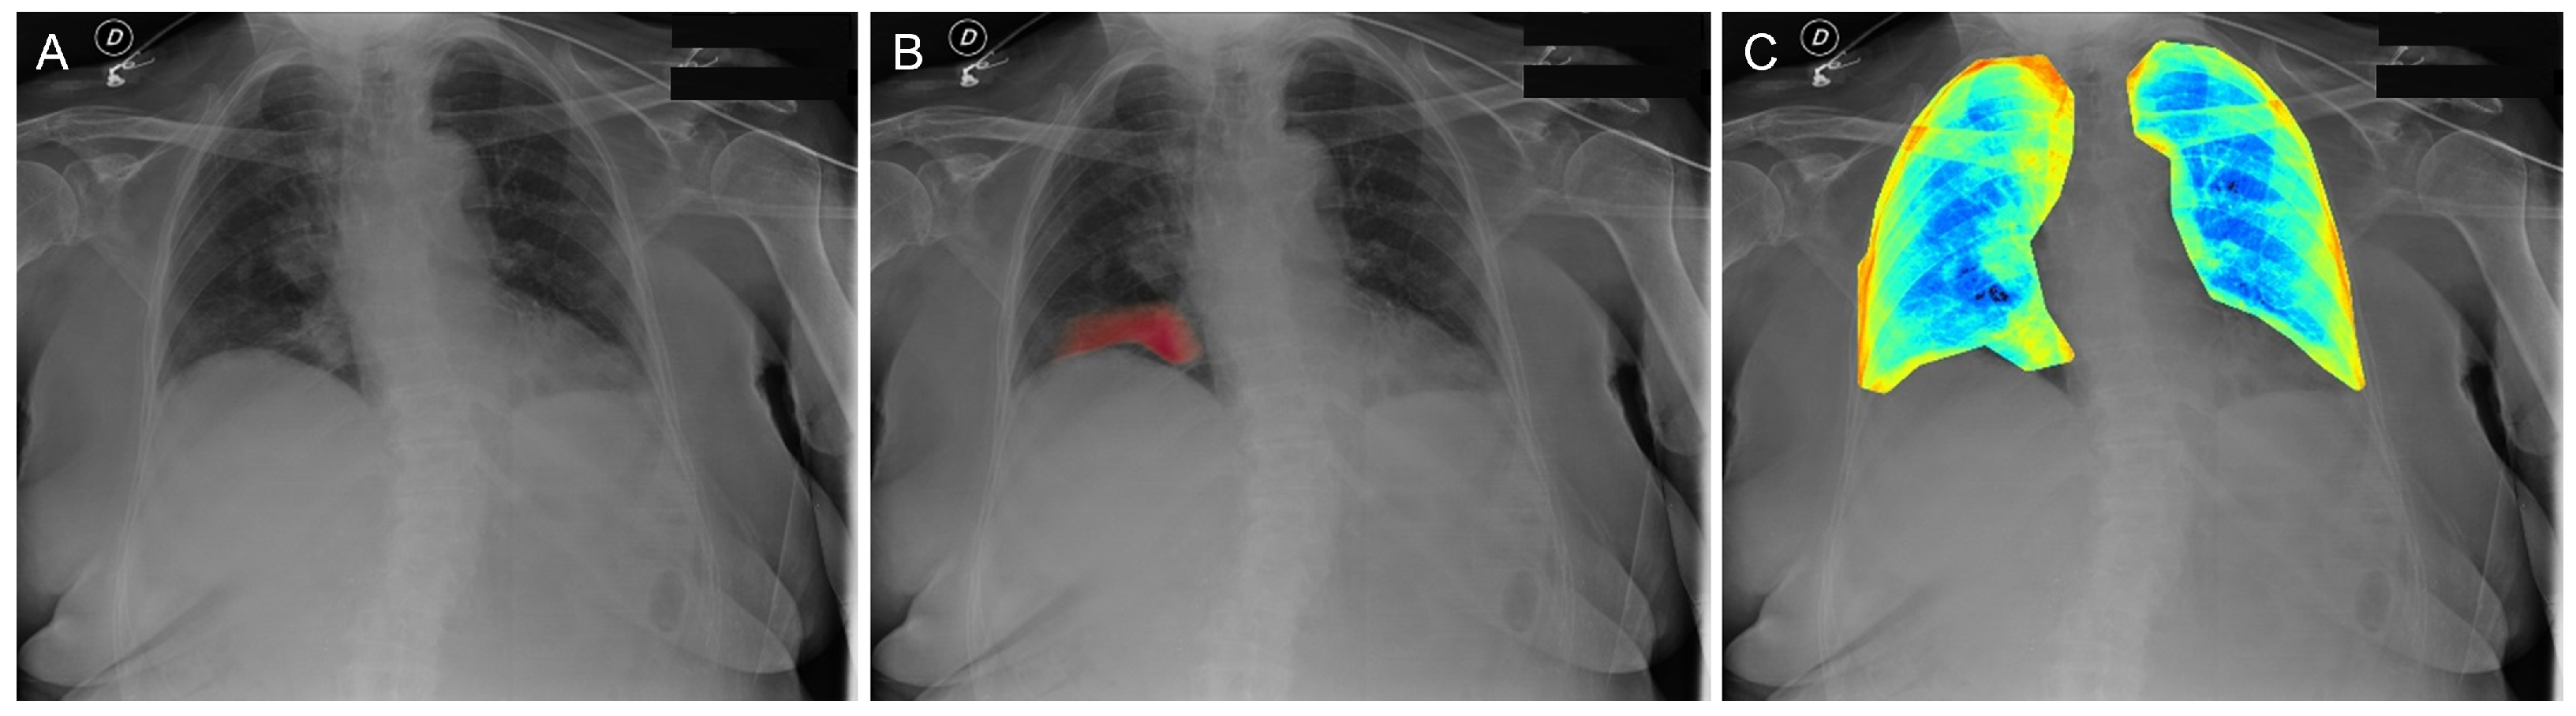
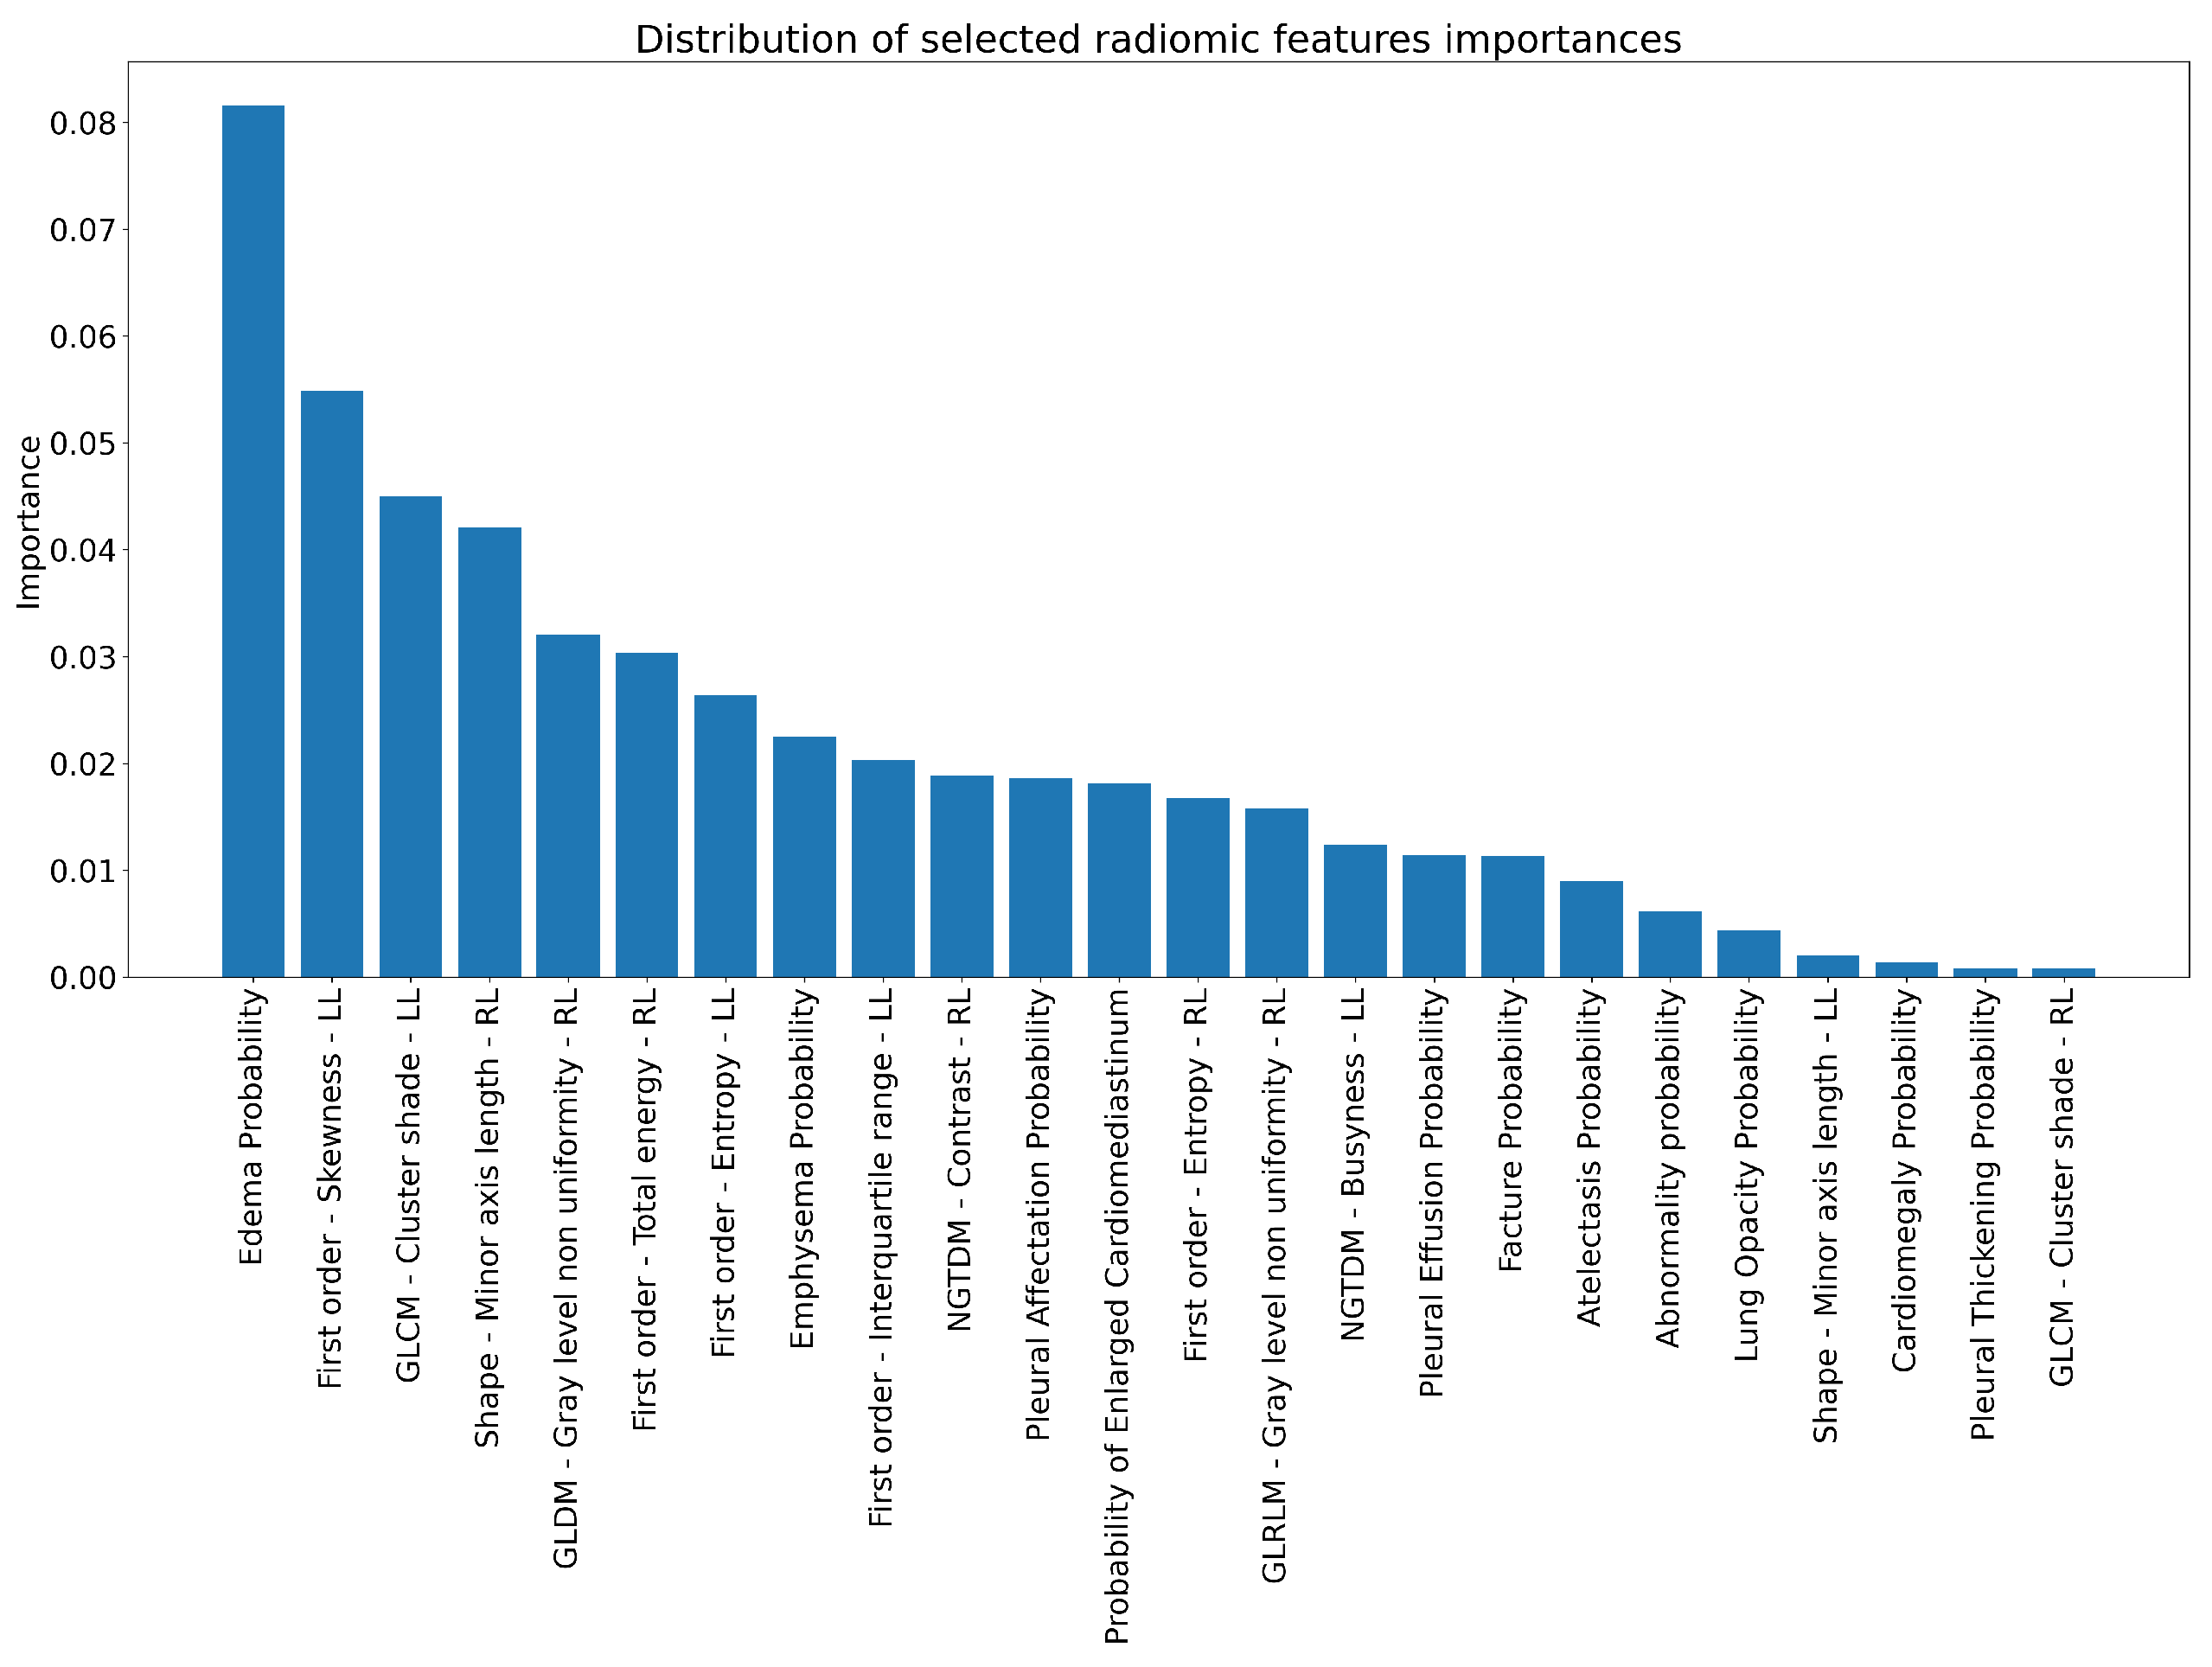
2.2. Radiomic Features Collection and Neural Network Findings

We analyzed COVID-19 patients’ CXRs using the certified QUIBIM Chest X-ray classifier [50]. A processed COVID-19 patient’s CXR is shown in Figure 1. This AI radiological tool can automatically identify PA/AP acquisitions of CXRs and estimate the presence probability of 15 different findings: COVID-19, atelectasis, cardiomegaly, consolidation, edema, emphysema, enlarged cardio-mediastinum, fibrosis, fracture, hernia, lung lesion, lung opacity, pleural effusion, pleural thickening, and pneumothorax. For each radiological finding, a convolutional neural network (CNN) detects the lung segmentation ROI referred to the specific finding and provides the probability of that finding being present. It also computes the abnormal probability, which shows only the three most probable findings. As far as we know, no previous research has exploited these types of features for COVID mortality prediction.
Beyond these 16 values, the tool extracts 201 first order and second order radiomic features. Radiomic feature computation is based on the Pyradiomics python package. In total, the Chest X-ray Classifier module returns 217 features. Manual examination of chest X-rays is very time consuming, radiologist-dependent, and requires a high degree of expertise. The strength of using an automatic technique to perform lung segmentations is to overcome these limitations.

2.3. Pipeline

The general pipeline consisted of a balancing process, a three-step feature selection, and a classification model comparison. The entire pipeline was conducted on Python 3.7.9, specifically using the Scikit-Learn, Pandas, and Numpy packages. Figure 2 schematizes the construction of training and testing sets, feature selection, and classification model workflow.
A dataset is imbalanced if it contains many more examples of one class than the others. When the imbalance is massive, conventional learning algorithms tend to ignore small classes while concentrating on classifying the large ones accurately [51,52,53,54,55]. However, the cost in mispredicting the minority classes in medical datasets, where high-risk patients usually belong to these less-favored classes, is higher than that for the majority class. The performance in these cases is strongly related to the imbalance rate of the input dataset. Therefore, there is a need for a good sampling technique for medical datasets. Since our starting dataset was imbalanced for the event under investigation (only 11% were dead patients), we trained each classification model with a balanced set. The chosen balancing method was the under-sampling technique [56], applicable due to the vastness of the starting dataset. The balanced sample created presented the same number, 194, of dead and survived patients, for a total of 388 patients. To choose patients of the survived group, we randomly selected 194 out of 1622, and we iterated the entire process 100 times to make results independent from this random selection. Classification models did not require all 217 features since most were highly correlated or did not show a predictive power for the mortality prediction. The three-step feature selection aimed to reduce the number of features, avoiding overfitting and improving the performance of the model.
The new balanced dataset was subjected to the first step of feature selection with the removal of highly correlated features (Spearman’s R 2 > 0.8, step 1 of Figure 2). Then, it was split into the Training set (67%, n = 258) depicted in green in Figure 2, and Testing set (33%, n = 130), shown in black in Figure 2. The maximum relevance minimum redundancy (MRMR, step 2 of Figure 2) algorithm was applied to select the feature with the maximum relevance, based on F-statistic, for the outcome value, and the minimum redundancy, based on average Pearson correlation, concerning the features selected at previous iterations. The MRMR algorithm allowed choosing a priori the number of features to be selected in the process. This number was set at 30 to avoid overfitting and so that the number of features did not exceed 10% of the positive events investigated (patient’s death, 194 events in our database). The third step consisted of a 5-fold cross validated Lasso (Lasso CV, step 3 of Figure 2) applied on previously standardized data. This regression automatically selected useful features, discarding useless or redundant features by setting its coefficient equal to 0. As a result, Lasso CV further decreased the number of features.
The features that survived the three-step feature selection were used to train three kinds of classification models: RandomForest (RF), AdaBoost (ADA) and Quadratic Discriminant Analysis (QDA) classifiers. Two of these are based on decision trees: RF is a bagging method, while ADA is a boosting method. The QDA classifier, instead, is a statistical method that uses a quadratic decision surface to separate measurements of two or more classes of objects or events. From the original Testing set (in black), two different Testing sets were obtained to evaluate the three trained classifiers: a Balanced Testing set with the same number of dead and survived patients (in yellow in Figure 2), and an Imbalanced Testing set with 33 dead patients and 305 survived patients (in pink in Figure 2).
Five metrics were used to evaluate the classifiers on both the Balanced and the Imbalanced Testing sets: area under the curve (AUC) score, accuracy (ACC), average precision (AP), sensitivity (SENS) and specificity (SPEC). Finally, the confusion matrix was calculated for each classifier in order to show percentage differences in True Positives (TP), False Positives (FP), True Negatives (TN) and False Negatives (FN).
To make results independent from the train-test split process, the whole pipeline was iterated 100 times, as shown in Figure 2. Then, the final five metrics and the confusion matrices were computed as 100 iterations mean. The results are reported in Table 2.
Our pipeline was inspired by the work of An [57], who under-sampled the datasets before performing random training-test splitting and repeated the process several times with different random seeds. At each repetition, his models were trained in the training set and tested in the test set. His results demonstrated that the ML model’s performance can vary widely between different training-test set pairs. Therefore, a single random split of a dataset into training and test sets may lead to an unreliable report of the estimated model performance. In our study, the need for under-sampling reduced the size of our initial dataset and led us to employ this pipeline.

3. Results

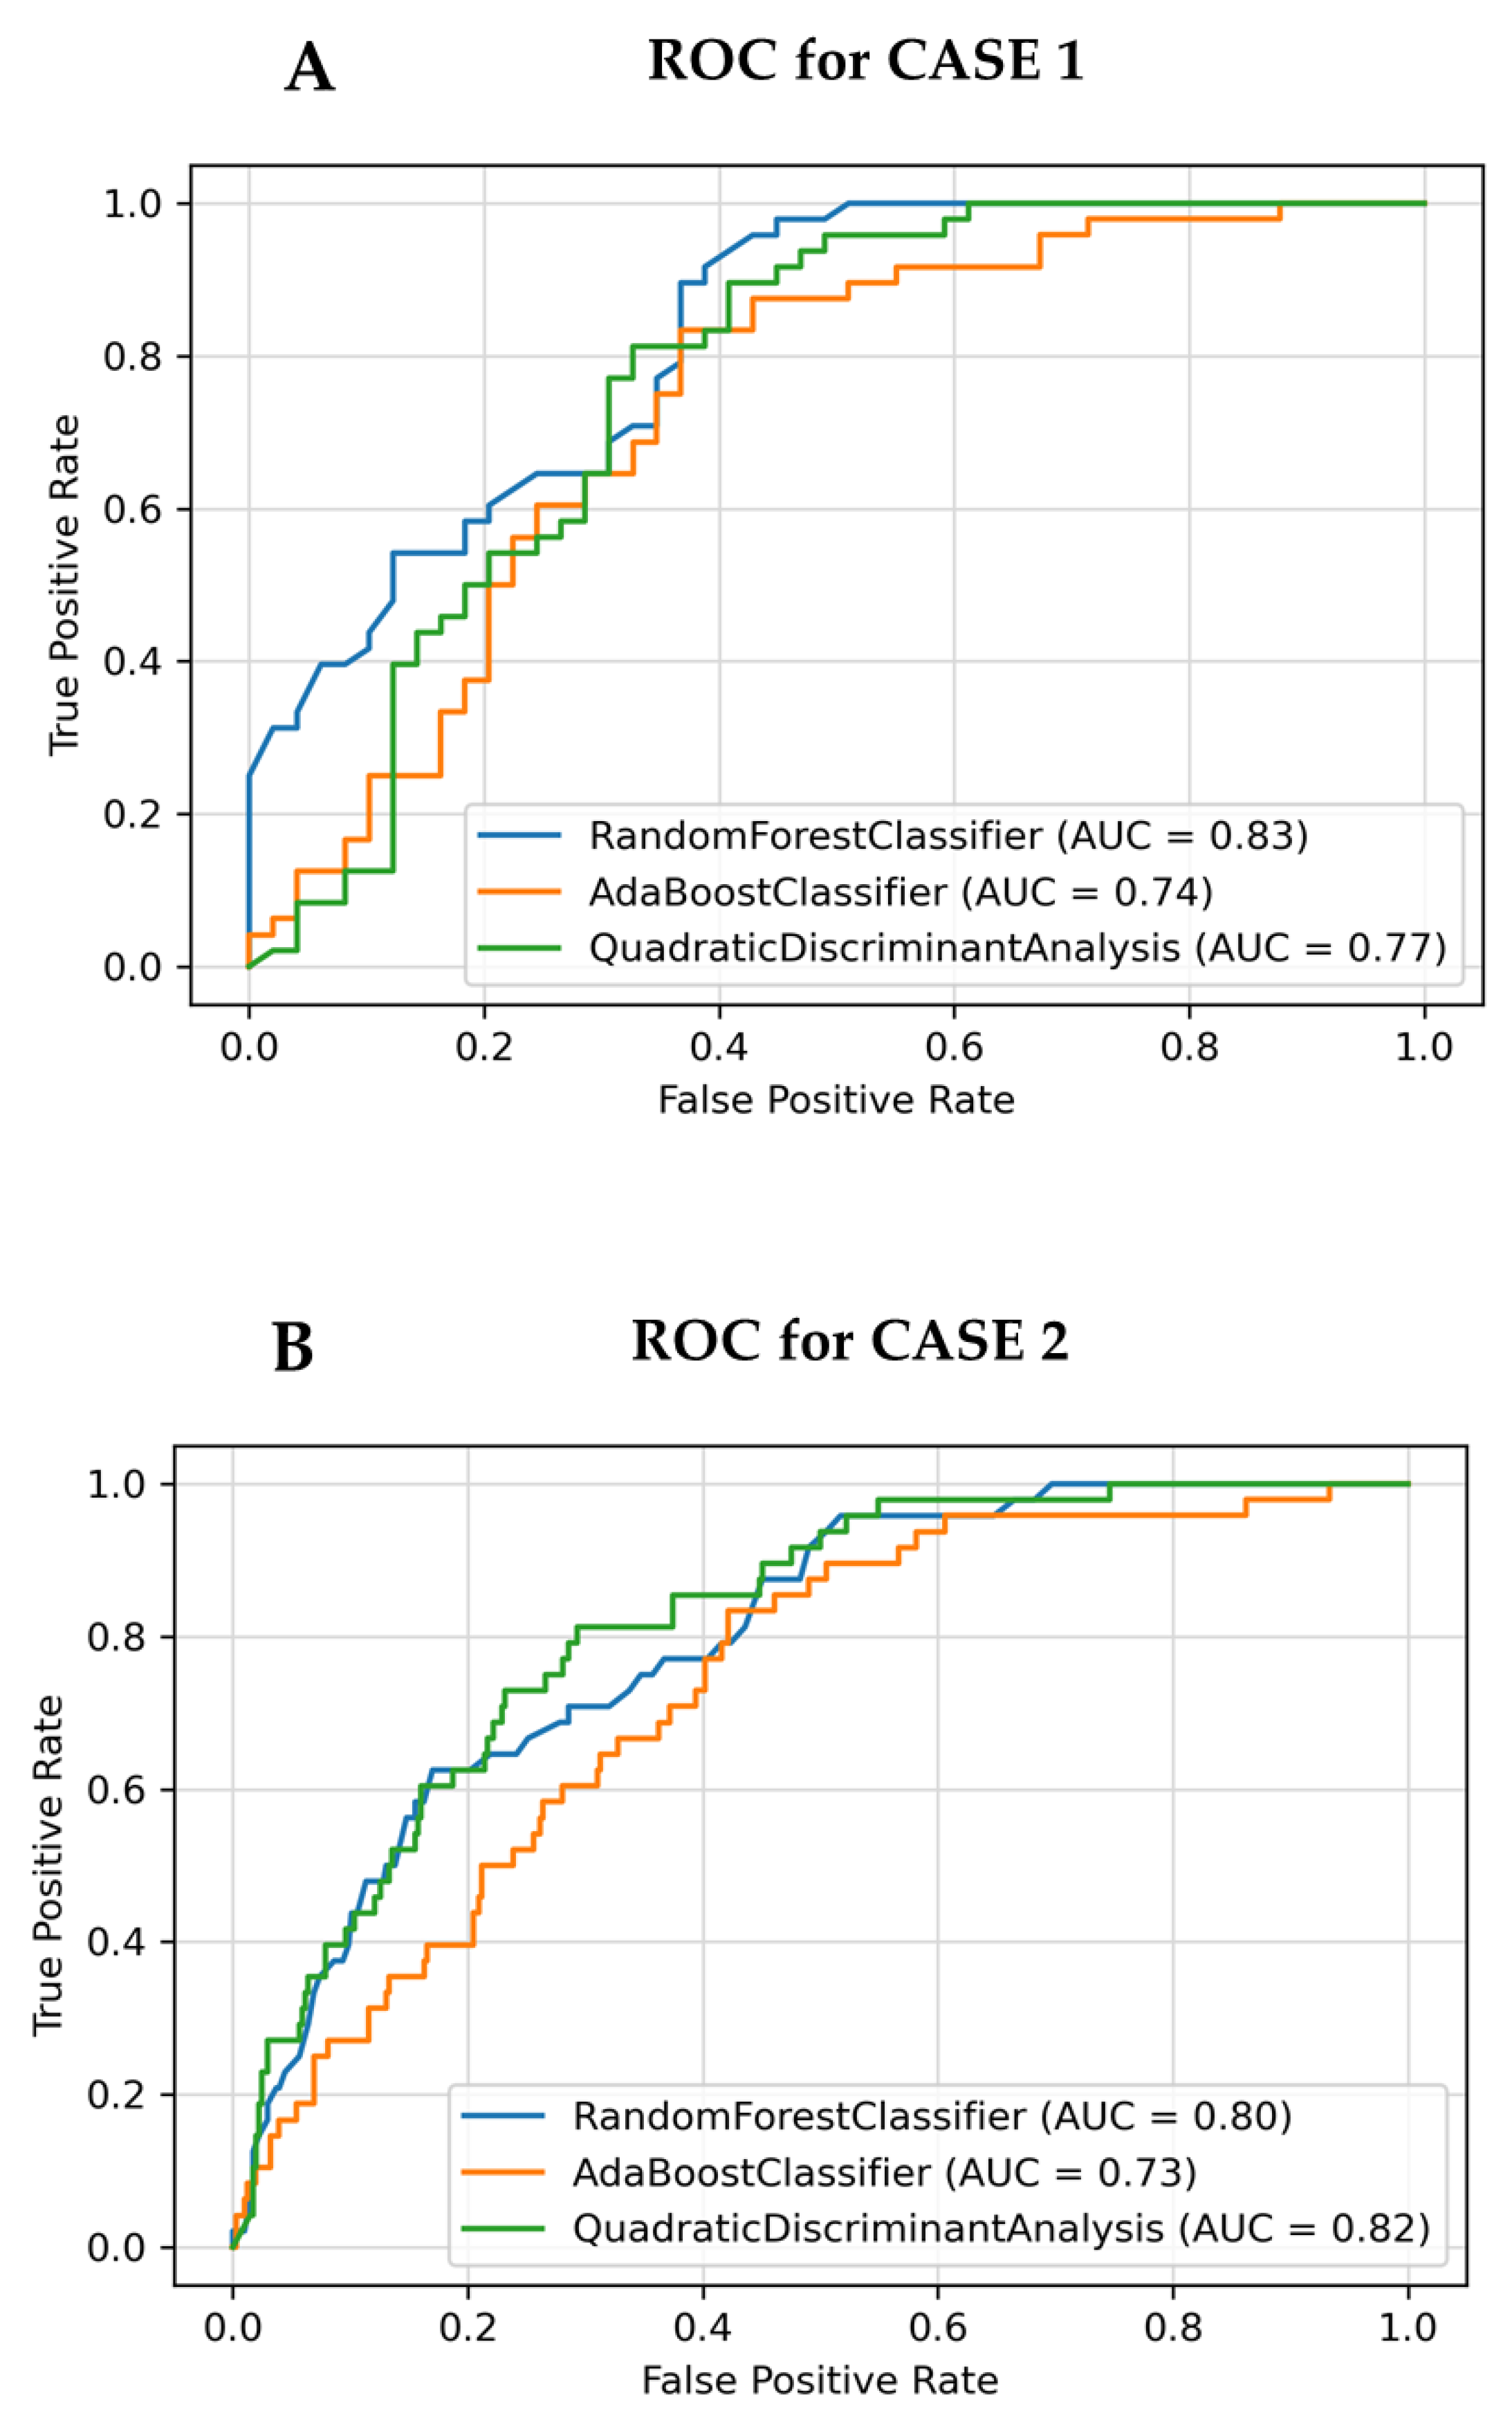
3.1. Case 1: Testing on Balanced Case

Among the 217 features group, fifteen different chest-finding probabilities were present. After removing highly correlated features, our pipeline extracted those resulting from MRMR. Then, the Lasso CV algorithm pointed out the most important features via the importance coefficient. Both MRMR and Lasso CV had death as the outcome. Essential radiomic features were used in our predictive models training process, becoming the inputs, while death would be the only outcome. The distribution of the importance for these selected features is illustrated in Figure 3.
All the metrics’ means (obtained over the 100 iterations of the whole pipeline) with their standard deviations together with the confusion matrices classification results are reported in Table 2—Case 1. A graphical representation of the performance is shown in Figure 4A, where ROC Curves for one iteration are depicted.

3.2. Case 2: Testing on Imbalanced Case

To validate the applicability of the models to an imbalanced scenario, they were tested on a dataset with the same imbalanced proportion of the original case (obtained as shown in Figure 2). The correspondent metrics and confusion matrices are reported in Table 2—Case 2, the ROC Curves of one iteration in Figure 4B.

4. Discussion

Machine learning (ML) classifiers could be used as innovative diagnostic and prognostic tools, greatly reducing the waste of resources in the medical environment by monitoring the patient’s disease course. In this context, radiomics provides a useful non-invasive support capable of obtaining a large amount of easily processable information. Several studies in the literature have used radiomics in COVID-19 affected patients. Tamal [46] applied radiomics to facilitate the recognition and diagnosis of COVID-19 patients, where algorithms predicted the presence of COVID-19 infection in the lungs through 100 radiomic features extracted from the Pyradiomics python package. Their models were trained on 378 CXRs depicting COVID-19 normal (viral/bacterial) pneumonia or other lung conditions. Bae [17] and Varghese [19] fed a set of ML and DL models with radiomic features to predict COVID-19 patient mortality, mechanical ventilation requirement, need for intubation or need for ICU. They processed, respectively, 515 and 167 COVID-19 positive patients, with an imbalance of 31% and 15%. Our study, having a larger dataset of patients (1816), all classified as positive for COVID-19 disease, made it possible to consider the performance of our classifiers on different balance/imbalance scenarios. It is interesting to note that Bae’s percentage of dead patients (31%) is halfway between our balanced dataset percentage (50%) and our imbalanced dataset percentage (11%). Their metrics (AUC = 0.83; SENS = 0.74; SPEC= 0.79) were similar to our RF model classifier results of Case 1 (AUC = 0.82; SENS = 0.84; SPEC = 0.60) and of Case 2 (AUC = 0.79; SENS = 0.76; SPEC = 0.70).
Considering Figure 3, it is noteworthy that the 15 most important features include three chest-finding probabilities: Edema Probability, Emphysema Probability and Pleural Affectation Probability, with the Edema Probability listed as the most important one. This demonstrates how the neural network features extracted probabilities strongly affect the final mortality prediction and are a significant addition to the radiomic features conventionally extracted.
The metrics collected in Table 2—Case 1 show high mean ACC, AUC, AP and SENS. The highest AUC score was reached with the RF classifier. It is interesting to note a non-negligible percentage of FPs, but it is essential to highlight that this did not affect the classification quality obtained, as indicated in the studies showing the application of the under-sampling technique [58]. Additionally, the sufficiently high values for AP and SENS determine the ability to correctly recognize positive subjects (dead patients), an essential key for these types of medical research.
To prove the consistency of this result, we validated the models’ performance on the imbalanced test set (created as reported in Figure 2). With reference to Table 2, comparing the metrics of Case 1 and Case 2, ACC, AUC, SENS and SPEC are nearly the same: the models maintain almost constant performance metrics when tested on an imbalanced dataset, with the only exception of AP. As for Case 1, also Case 2 is characterized by high TP and TN rates, which are in this case 11% and 89%, respectively. Our results are in accordance with these values. The reason for the decrease of AP can be linked to the slight increase of FPs.
The validation of our models on imbalanced data allows the use of our pipeline in many different applications. In fact, as outlined by the Istituto Superiore di Sanità [38], Istituto Nazionale di Fisica Nucleare [39] and others [40,41,42,43,44,45], both access to the emergency room and intensive care unit recovery have been characterized by different imbalance ratios between dead and surviving patients. Therefore, we believe our models are suitable to address different kinds of imbalanced datasets, making it possible to predict COVID-19 mortality in a large set of scenarios.
Additional validation with a holdout dataset could be the goal for further studies to provide an unbiased evaluation in different imbalance scenarios. Our work could benefit from the inclusion of images from other hospitals and locations to be used as the validation set. Although the ever-changing landscape of the pandemic could represent a limitation to the development of related research, our approach may be able to properly manage the variability of the pandemic’s evolution, supporting radiologists in assessing the severity of the disease and deciding on possible hospitalization or early implementation of a specific therapy.
In the study presented here, we used a simple, immediate, well described and largely applied method to manage the imbalance of classes. Recent literature has included new studies where advanced methods for label enhancement and creation of balanced datasets are explored. Xie [59] proposed a new data resampling technique named Gaussian Distribution-based Oversampling to handle the imbalanced data for classification. Du [60] developed a graph-based learning with label enhancement, and Liu [61] generated a strong ensemble by self-paced harmonizing data hardness via under-sampling. Future works may benefit in performance and robustness from the deployment of methods such as the ones reported to tackle class imbalance.
Previously published works did not investigate balanced and imbalanced cases for COVID-19 mortality prediction using radiomic and neural network features. Moreover, to our knowledge, only one study [37] utilized the commercial QUIBIM software: the use of this tool makes our pipeline fully reproducible and effectively applicable to clinical contexts.
Furthermore, another advantage of our approach is the wide numerosity of data, obtained with different XR machines and collected from the entire Province of Reggio Emilia.

5. Conclusions

Our study showed that ML classifiers applied to radiomic and neural network information could monitor COVID-19 patients’ survival in a reliable way. In fact, radiomic and neural network data extracted from each patient’s image, easily obtainable with commercial tools, could predict mortality through classification models with high AUC scores. When the classification models are trained on an imbalanced dataset, they tend to ignore the less-favored class (dead patients) while concentrating on correctly classifying the predominant one (survived patients). In cases in which the cost in mispredicting the less-favored class is higher than that of the predominant class, a dataset balancing technique is necessary. Our models (trained on balanced datasets) have been tested successfully on both balanced and imbalanced datasets.
Our pipeline represents an important tool for the early screening of COVID-19 patients to limit criticalities and to appropriately allocate the (limited) resources available. It could also address similar scenarios, helping clinicians to assess the severity of the disease and promptly stratify the patient population to support the decision of a personalized care pathway.

Author Contributions

Conceptualization, G.M., C.D.C. and M.I.; methodology, G.M. and C.D.C.; software, G.M., C.D.C. and D.G.L.; validation, C.D.C.; formal analysis, G.M. and C.D.C.; investigation, G.M. and C.D.C.; resources, C.S. and M.I.; data curation, G.B., F.M., S.C., G.M., D.G.L., A.N.; writing—original draft preparation, G.M., C.D.C. and L.V.; writing—review and editing, M.I., R.S., M.B., A.B. and V.T.; visualization G.M., C.D.C. and L.V.; supervision, M.I., M.B., R.S., A.B., D.R., G.C.; project administration, M.I.; funding acquisition, C.S. and M.I. All authors have read and agreed to the published version of the manuscript.

Funding

This research was funded by the Italian Ministry of Health. The present study takes part in a major multicenter project titled “Endothelial, neutrophil, and complement perturbation linked to acute and chronic damage in COVID-19 pneumonitis coupled with machine learning approaches”, whose code was COVID-2020-12371808. Azienda USL-IRCCS di Reggio Emilia was the project promoter.

Institutional Review Board Statement

The study was conducted in accordance with the Declaration of Helsinki, and approved by the Institutional Ethics Committee of the Area Vasta Emilia Nord (Registry no. 855/2020/OSS/AUSLRE, approved on the 28th of July 2020).

Informed Consent Statement

Informed consent and personal data treatment were obtained from all subjects involved in the study. Written informed consent has been obtained from patients to publish this paper. Dead patients’ consent was obtained from the Personal Data Protection Authority, the Italian authority governing personal data treatment carried out for scientific research purposes due to reasons of organizational impossibility (deceased or non-contactable subjects).

Data Availability Statement

The data presented in the study are part of a specific authorization that was issued by our Ethics Committee. The author will therefore not be able to respond to any request for data sharing with other centers, unless he has received specific authorization from his Ethics Committee.

Acknowledgments

The authors are grateful to all units of the Azienda Unità Sanitaria Locale-IRCCS di Reggio Emilia for the support and the data collection.

Conflicts of Interest

The authors declare no conflict of interest.

References

  1. Zhu, N.; Zhang, D.; Wang, W.; Li, X.; Yang, B.; Song, J.; Zhao, X.; Huang, B.; Shi, W.; Lu, R.; et al. A Novel Coronavirus from Patients with Pneumonia in China. N. Engl. J. Med. 2019, 382, 727–733. [Google Scholar] [CrossRef] [PubMed]
  2. Wang, C.; Wang, Z.; Wang, G.; Lau, J.Y.N.; Zhang, K.; Li, W. COVID-19 in early 2021: Current status and looking forward. Signal Transduct. Target. Ther. 2021, 6, 114. [Google Scholar] [CrossRef] [PubMed]
  3. Soda, P.; Natascha, C.D.; Tessadori, J.; Giovanni, V.; Valerio, G.; Chandra, B.; Muhammad, U.A.; Rosa, S.; Ermanno, C.; Deborah, F.; et al. AIforCOVID: Predicting the clinical outcomes in patients with COVID-19 applying AI to chest-X-rays. An Italian multicentre study. Med. Image Anal. 2021, 74, 102216. [Google Scholar] [CrossRef] [PubMed]
  4. Laino, M.E.; Ammirabile, A.; Posa, A.; Cancian, P.; Shalaby, S.; Savevski, V.; Neri, E. The Applications of Artificial Intelligence in Chest Imaging of COVID-19 Patients: A Literature Review. Diagnostics 2021, 11, 1317. [Google Scholar] [CrossRef] [PubMed]
  5. Roberts, A.; Chouhan, R.S.; Shahdeo, D.; Shrikrishna, N.S.; Kesarwani, V.; Horvat, M.; Gandhi, S. A Recent Update on Advanced Molecular Diagnostic Techniques for COVID-19 Pandemic: An Overview. Front. Immunol. 2021, 12, 5316. [Google Scholar] [CrossRef]
  6. Dhar, B.C. Diagnostic assay and technology advancement for detecting SARS-CoV-2 infections causing the COVID-19 pandemic. Anal. Bioanal. Chem. 2022, 414, 2903–2934. [Google Scholar] [CrossRef] [PubMed]
  7. Wu, X.; Chen, Q.; Li, J.; Liu, Z. Diagnostic techniques for COVID-19: A mini-review. J. Virol. Methods 2022, 301, 114437. [Google Scholar] [CrossRef]
  8. Neri, E.; Miele, V.; Coppola, F.; Grassi, R. Use of CT and artificial intelligence in suspected or COVID-19 positive patients: Statement of the Italian Society of Medical and Interventional Radiology. La Radiol. Med. 2020, 125, 505–508. [Google Scholar] [CrossRef]
  9. Grassi, R.; Belfiore, M.P.; Montanelli, A.; Patelli, G.; Urraro, F.; Giacobbe, G.; Fusco, R.; Granata, V.; Petrillo, A.; Sacco, P.; et al. COVID-19 pneumonia: Computer-aided quantification of healthy lung parenchyma, emphysema, ground glass and consolidation on chest computed tomography (CT). La Radiol. Med. 2020, 126, 3. [Google Scholar] [CrossRef]
  10. Islam, N.; Ebrahimzadeh, S.; Salameh, J.P.; Kazi, S.; Fabiano, N.; Treanor, L.; Absi, M.; Hallgrimson, Z.; Leeflang, M.; Hooft, L.; et al. Thoracic imaging tests for the diagnosis of COVID-19. Cochrane Database Syst. Rev. 2021, 9, CD013639. [Google Scholar]
  11. Rubin, G.D.; Ryerson, C.J.; Haramati, L.B.; Sverzellati, N.; Kanne, J.P.; Raoof, S.; Schluger, N.W.; Volpi, A.; Yim, J.J.; Martin, I.B.; et al. The Role of Chest Imaging in Patient Management during the COVID-19 Pandemic: A Multinational Consensus Statement from the Fleischner Society. Radiology 2020, 296, 172–180. [Google Scholar] [CrossRef] [PubMed] [Green Version]
  12. Shiri, I.; Arabi, H.; Salimi, Y.; Sanaat, A.H.; Akhavanalaf, A.; Hajianfar, G.; Askari, D.; Moradi, S.; Mansouri, Z.; Pakbin, M.; et al. COLI-NET: Fully Automated COVID-19 Lung and Infection Pneumonia Lesion Detection and Segmentation from Chest CT Images. medRxiv 2021. [Google Scholar] [CrossRef]
  13. Calderon-Ramirez, S.; Yang, S.; Moemeni, A.; Elizondo, D.; Colreavy-Donnelly, S.; Chavarría-Estrada, L.; Molina-Cabello, M. Correcting Data Imbalance for Semi-Supervised Covid-19 Detection Using X-ray Chest Images. arXiv 2020, arXiv:2008.08496. [Google Scholar] [CrossRef] [PubMed]
  14. Ozturk, T.; Talo, M.; Yildirim, E.A.; Baloglu, U.B.; Yildirim, O.; Rajendra Acharya, U. Automated detection of COVID-19 cases using deep neural networks with Xray images. Comput. Biol. Med. 2020, 121, 103792. [Google Scholar] [CrossRef] [PubMed]
  15. Win, K.; Maneerat, N.; Sreng, S.; Hamamoto, K. Ensemble Deep Learning for the Detection of COVID-19 in Unbalanced Chest X-ray Dataset. Appl. Sci. 2021, 11, 10528. [Google Scholar] [CrossRef]
  16. Bridge, J.; Meng, Y.; Zhao, Y.; Du, Y.; Zhao, M.; Sun, R.; Zheng, Y. Introducing the GEV Activation Function for Highly Unbalanced Data to Develop COVID-19 Diagnostic Models. IEEE J. Biomed. Health Inform. 2020, 24, 2776–2786. [Google Scholar] [CrossRef]
  17. Bae, J.; Kapse, S.; Singh, G.; Gattu, R.; Ali, S.; Shah, N.; Marshal, C.; Pierce, J.; Phatak, T.; Gupta, A.; et al. Predicting Mechanical Ventilation and Mortality in COVID-19 Using Radiomics and Deep Learning on Chest Radiographs: A Multi-Institutional Study. Diagnostics 2021, 11, 1812. [Google Scholar] [CrossRef]
  18. Jiao, Z.; Choi, J.W.; Halsey, K.; Tran, T.M.L.; Hsieh, B.; Wang, D.; Eweje, F.; Wang, R.; Chang, K.; Wu, J.; et al. Prognostication of patients with COVID-19 using artificial intelligence based on chest x-rays and clinical data: A retrospective study. Lancet Digit. Health 2021, 3, e286–e294. [Google Scholar] [CrossRef]
  19. Varghese, B.A.; Shin, H.; Desai, B.; Gholamrezanezhad, A.; Lei, X.; Perkins, M.; Oberai, A.; Nanda, N.; Cen, S.; Duddalwar, V. Predicting clinical outcomes in COVID-19 using radiomics on chest radiographs. Br. J. Radiol. 2021, 94, 20210221. [Google Scholar] [CrossRef]
  20. An, C.; Lim, H.; Kim, D.; Chang, J.H.; Choi, Y.J.; Kim, S.W. Machine learning prediction for mortality of patients diagnosed with COVID-19: A nationwide Korean cohort study. Sci. Rep. 2020, 10, 18716. [Google Scholar] [CrossRef]
  21. Oladunni, T.; Tossou, S.; Haile, Y.; Kidane, A. COVID-19 County Level Severity Classification with Imbalanced Dataset: A NearMiss Under-sampling Approach. medRxiv 2021. [Google Scholar] [CrossRef]
  22. De Souza, F.S.H.; Hojo-Souza, N.S.; Dos Santos, E.B.; Da Silva, C.M.; Guidoni, D.L. Predicting the Disease Outcome in COVID-19 Positive Patients Through Machine Learning: A Retrospective Cohort Study with Brazilian Data. Front. Artif. Intell. 2021, 4, 2624–8212. [Google Scholar] [CrossRef] [PubMed]
  23. Shiri, I.; Salimi, Y.; Pakbin, M.; Hajianfar, G.; Avval, A.H.; Sanaat, A.; Mo-stafaei, S.; Akhavanallaf, A.; Saberi, A.; Mansouri, Z.; et al. COVID-19 Prognostic Modeling Using CT Radiomic Features and Machine Learning Algorithms: Analysis of a Mul-ti-Institutional Dataset of 14,339 Patients. Physica A 2021, 145, 105467. [Google Scholar] [CrossRef]
  24. Shiri, I.; Sorouri, M.; Geramifar, P.; Nazari, M.; Abdollahi, M.; Salimi, Y.; Khosravi, B.; Askari, D.; Aghaghazvini, L.; Hajianfar, G.; et al. Machine learning-based prognostic modeling using clinical data and quantitative radiomic features from chest CT images in COVID-19 patients. Comput. Biol. Med. 2021, 132, 104304. [Google Scholar] [CrossRef] [PubMed]
  25. Bottino, F.; Tagliente, E.; Pasquini, L.; Napoli, A.; Lucignani, M.; Figà-Talamanca, L.; Napolitano, A. COVID Mortality Prediction with Machine Learning Methods: A Systematic Review and Critical Appraisal. J. Pers. Med. 2021, 11, 893. [Google Scholar] [CrossRef] [PubMed]
  26. Liu, X.; Li, Y.; Qian, Z.; Sun, Z.; Xu, K.; Wang, K.; Liu, S.; Fan, X.; Li, S.; Zhang, Z.; et al. A radiomic signature as a non-invasive predictor of progression-free survival in patients with lower-grade gliomas. Neuroimage Clin. 2018, 20, 1070–1077. [Google Scholar] [CrossRef]
  27. Forghani, R.; Savadjiev, P.; Chatterjee, A.; Muthukrishnan, N.; Reinhold, C.; Forghania, B. Radiomics and Artificial Intelligence for Biomarker and Prediction Model Development in Oncology. Comput. Struct. Biotechnol. J. 2019, 17, 995–1008. [Google Scholar] [CrossRef]
  28. Bera, K.; Braman, N.; Gupta, A.; Velcheti, V.; Madabhushi, A. Predicting cancer outcomes with radiomics and artificial intelligence in radiology. Nat. Rev. Clin. Oncol. 2021, 19, 132–146. [Google Scholar] [CrossRef]
  29. Ahmed, S.; Yap, M.H.; Tan, M.; Hasan, M.K. ReCoNet: Multi-level Preprocessing of Chest X-rays for COVID-19 Detection Using Convolutional Neural Networks. medRxiv 2020. [Google Scholar] [CrossRef]
  30. Rahman, M.; Davis, D.N. Addressing the Class Imbalance Problem in Medical Datasets. Int. J. Mach. Learn. Comput. 2013, 3, 224. [Google Scholar] [CrossRef]
  31. Thabtah, F.; Hammoud, S.; Kamalov, F.; Gonsalves, A. Data imbalance in classification: Experimental evaluation. Inf. Sci. 2020, 513, 429–441. [Google Scholar] [CrossRef]
  32. Dorn, M.; Grisci, B.; Narloch, P.; Feltes, B.C.; Avila, E.; Kahmann, A.; Alho, C. Comparison of machine learning techniques to handle imbalanced COVID-19 CBC datasets. PeerJ Comput. Sci. 2021, 7, e670. [Google Scholar] [CrossRef] [PubMed]
  33. Xie, C.; Du, R.; Ho, J.; Pang, H.; Chiu, W.H.; Lee, E.; Vardhanabhuti, V. Effect of machine learning re-sampling techniques for imbalanced datasets in 18F-FDG PET-based radiomics model on prog-nostication performance in cohorts of head and neck cancer patients. Eur. J. Nucl. Med. Mol. Imaging 2020, 47, 2826–2835. [Google Scholar] [CrossRef]
  34. Nejatian, S.; Parvin, H.; Faraji, E. Using sub-sampling and ensemble clustering techniques to improve performance of imbalanced classification. Neurocomputing 2018, 276, 55–66. [Google Scholar] [CrossRef]
  35. Avanzo, M.; Trianni, A.; Botta, F.; Talamonti, C.; Stasi, M.; Iori, M. Artificial Intelligence and the Medical Physicist: Welcome to the Machine. Appl. Sci. 2021, 11, 1691. [Google Scholar] [CrossRef]
  36. Coppola, F.; Faggioni, L.; Gabelloni, M.; De Vietro, F.; Mendola, V.; Cattabriga, A.; Cocozza, M.A.; Vara, G.; Piccinino, A.; Lo Monaco, S.; et al. Human, All Too Human? An All-Around Appraisal of the “Artificial Intelligence Revolution” in Medical Imaging. Front. Psychol. 2021, 12, 4296. [Google Scholar] [CrossRef]
  37. Liang, C.; Liu, Y.; Wu, M.; Garcia-Castro, F.; Alberich-Bayarri, A.; Wu, F. Identifying pulmonary nodules or masses on chest radiography using deep learning: External validation and strategies to improve clinical practice. Clin. Radiol. 2019, 38–45. [Google Scholar] [CrossRef] [Green Version]
  38. ISS. Available online: https://www.iss.it/en/web/guest/home (accessed on 14 September 2021).
  39. Infn. Available online: https://covid19.infn.it/iss/ (accessed on 17 September 2021).
  40. Scotland, P.H. Scottish Intensive Care Society Audit Group Report on COVID-19. Available online: https://publichealthscotland.scot/media/11407/2022-02-02_sicsag_report.pdf (accessed on 14 September 2021).
  41. Carbonell, R.; Urgelés, S.; Rodriguez, A.; Bodí, M.; Martin-Loeches, I.; Violán, J.; Diaz, E.; Gómez, J.; Trefler, S.; Vallverdú, M.; et al. Mortality comparison between the first and second/third waves among 3795 critical COVID-19 patients with pneumonia admitted to the ICU: A multicentre retrospective cohort study. Lancet Reg. Health Eur. 2021, 11, 100243. [Google Scholar] [CrossRef]
  42. ISS. Available online: https://www.epicentro.iss.it/en/coronavirus/sars-cov-2-analysis-of-deaths (accessed on 14 September 2021).
  43. Armstrong, R.; Kane, A.; Cook, T. Outcomes from intensive care in patients with COVID-19: A systematic review and meta-analysis of observational studies. Anaesthesia 2020, 75, 1340–1349. [Google Scholar] [CrossRef]
  44. Grasselli, G.; Zangrillo, A.; Zanella, A.; Antonelli, M.; Cabrini, L.; Castelli, A.; Cereda, D.; Coluccello, A.; Foti, G.; Fumagalli, R.; et al. Baseline Characteristics and Outcomes of 1591 Patients Infected With SARS-CoV-2 Admitted to ICUs of the Lombardy Region, Italy. JAMA 2020, 323, 16. [Google Scholar] [CrossRef] [Green Version]
  45. Nardin, M.D. Available online: https://www.med4.care/covid-19-mortalita-in-terapia-intensiva (accessed on 17 September 2021).
  46. Tamal, M.; Alshammari, M.; Alabdullah, M.; Hourani, R.; Alola, H.; Hegazi, T. An integrated framework with machine learning and radiomics for accurate and rapid early diagnosis of COVID-19 from Chest X-ray. Expert Syst. Appl. 2021, 180, 115152. [Google Scholar] [CrossRef] [PubMed]
  47. Thanh Noi, P.; Kappas, M. Comparison of Random Forest, k-Nearest Neighbor, and Support Vector Machine Classifiers for Land Cover Classification Using Sentinel-2 Imagery. Sens. Basel 2017, 18, 18. [Google Scholar] [CrossRef] [PubMed] [Green Version]
  48. Donini, B.; Rivetti, S.; Lanconelli, N.; Bertolini, M. Free software for performing physical analysis of systems for digital radiography and mammography. Med. Phys. 2014, 41, 051903. [Google Scholar] [CrossRef] [PubMed] [Green Version]
  49. Nitrosi, A.; Bertolini, M.; Borasi, G.; Botti, A.; Barani, A.; Rivetti, S.; Pierotti, L. Application of QC_DR Software for Acceptance Testing and Routine Quality Control of Direct Digital Radiography Systems: Initial Experiences using the Italian Association of Physicist in Medicine Quality Control Protocol. J. Digit. Imaging 2009, 22, 656Y666. [Google Scholar] [CrossRef] [Green Version]
  50. Classifier, Q.C.X.R. Available online: https://quibim.com/biomarker/chest-xray-classifier/ (accessed on 30 November 2021).
  51. Awal, M.A.; Masud, M.; Hossain, M.S.; Bulbul, A.A.M.; Mahmud, S.M.H.; Bairagi, A.K. A Novel Bayesian Optimization-Based Machine Learning Framework for COVID-19 Detection From Inpatient Facility Data. IEEE Access 2021, 9, 10263–10281. [Google Scholar] [CrossRef]
  52. Matthew, S. Available online: https://towardsdatascience.com/guide-to-classification-on-imbalanced-datasets-d6653aa5fa23 (accessed on 1 November 2021).
  53. Laurikkala, J. Improving Identification of Difficult Small Classes by Balancing Class Distribution. In Proceedings of the Conference on Artificial Intelligence in Medicine in Europe, Cascais, Portugal, 1–4 July 2001; Volume 2101, pp. 63–66. [Google Scholar]
  54. Chawla, N.; Japkowicz, N.; Kołcz, A. Editorial: Special issue on learning from imbalanced data sets, SIGKDD Explorations Special Issue on Learning from Imbalanced Datasets. ACM SIGKDD Explor. Newsl. 2004, 6, 1–6. [Google Scholar] [CrossRef]
  55. Sun, Y.; Wong, A.; Kamel, M.S. Classification of imbalanced data: A review. Int. J. Pattern Recognit. Artif. Intell. 2009, 23, 687–719. [Google Scholar] [CrossRef]
  56. Van Hulse, J.; Khoshgoftaar, T.M.; Napolitano, A. An Empirical Comparison of Repetitive Undersampling Techniques. In Proceedings of the 2009 IEEE International Conference on Information Reuse & Integration, Las Vegas, NV, USA, 10–12 August 2009; pp. 29–34. [Google Scholar]
  57. An, C.; Park, Y.W.; Ahn, S.; Han, K.; Kim, H.; Lee, S.K. Radiomics machine learning study with a small sample size: Single random training-test set split may lead to unreliable results. PLoS ONE 2021, 16, e0256152. [Google Scholar] [CrossRef]
  58. Zhang, J.; Mani, I. KNN Approach to Unbalanced Data Distributions: A Case Study Involving Information Extraction. Proc. ICML 2003, 126, 1–7. [Google Scholar]
  59. Xie, Y.; Qiu, M.; Zhang, H.; Peng, L.; Chen, Z. Gaussian Distribution Based Oversampling for Imbalanced Data Classification. IEEE Trans. Knowl. Data Eng. 2022, 34, 667–679. [Google Scholar] [CrossRef]
  60. Du, G.; Zhang, J.; Jiang, M.; Long, J.; Lin, Y.; Li, S.; Tan, K.C. Graph-Based Class-Imbalance Learning with Label Enhancement. IEEE Trans. Neural Netw. Learn. Syst. 2021, 1–15. [Google Scholar] [CrossRef] [PubMed]
  61. Liu, Z.; Cao, W.; Gao, Z.; Bian, J.; Chen, H.; Chang, Y.; Liu, T.Y. Self-paced Ensemble for Highly Imbalanced Massive Data Classification. In Proceedings of the 2020 IEEE 36th International Conference on Data Engineering (ICDE), Dallas, TX, USA, 20–24 April 2020; pp. 841–852. [Google Scholar]
Figure 1. CXR’s AP acquisition of a COVID-19 positive patient. (A): original, (B): heatmap showing the level of influence of each region in the final abnormality score, (C): parametric map for texture analysis.
Applsci 12 03903 g001
Figure 2. Pipeline diagram.
Applsci 12 03903 g002
Figure 3. Distribution of the importance coefficients for the radiomic features selected by our three-step feature selection process. These features will feed the models (Random Forest, AdaBoost and Quadratic Discriminant Analysis) training process in order to predict the investigated outcome.
Applsci 12 03903 g003
Figure 4. ROC Curves obtained from the three investigated classifiers, for the two different Cases. (A): CASE 1, testing on balanced dataset; (B): CASE 2, testing on imbalanced dataset. All these plots have been randomly chosen among the 100 iterations.
Applsci 12 03903 g004
Table 1. Population features summary.
Population FeaturesNumber
Total patients1816
Survived patients1622 (89%)
Dead patients194 (11%)
Mean Age ± sd [min–max]63 ± 16 [18–100]
Mean Survived Age ± sd [min–max]61 ± 16 [18–99]
Mean Dead Age ± sd [min–max]80 ± 10 [45–100]
Women799 (44%)
Dead women60 (8%)
Men1017 (56%)
Dead men134 (13%)
Table 2. Performance Metrics and Confusion Matrix of the three investigated classifiers (RF, ADA, QDA) for CASE 1 (testing on balanced dataset), CASE 2 (testing on imbalanced dataset). The performance metrics are expressed as mean ± standard deviation obtained from 100 iterations; the values of the confusion matrix are expressed as percentages. Real values for Case 1 were TN = 50%, TP = 50%, real values for Case 2 were TN = 89%, TP = 11%. ACC: accuracy, AUC scores, AP: average precision, SENS: sensitivity and SPEC: specificity. TN = True Negative, FP = False Positive, FN = False Negative, TP = True Positive.
Case 1Case 2
Testing on BalancedTesting on Imbalanced
RFADAQDARFADAQDA
ACC0.72 ± 0.010.63 ± 0.010.71 ± 0.010.70 ± 0.040.64 ± 0.050.79 ± 0.04
AUC0.82 ± 0.020.64 ± 0.030.74 ± 0.030.79 ± 0.030.68 ± 0.050.78 ± 0.04
AP0.77 ± 0.060.58 ± 0.050.65 ± 0.050.27 ± 0.040.16 ± 0.050.22 ± 0.05
SENS0.84 ± 0.040.68 ± 0.060.65 ± 0.070.76 ± 0.060.58 ± 0.080.45 ± 0.08
SPEC0.60 ± 0.010.57 ± 0.010.75 ± 0.010.70 ± 0.060.65 ± 0.060.83 ± 0.06
TN (%)33.938.538.563.262.874.0
FN (%)12.315.421.62.33.03.3
TP (%)40.036.930.87.97.66.9
FP (%)13.99.29.226.626.615.8
Publisher’s Note: MDPI stays neutral with regard to jurisdictional claims in published maps and institutional affiliations.

