
COVID-19, Economic Policies and Public Debt Sustainability in Italy


1
The Belt and Road School, Beijing Normal University at Zhuhai, Zhuhai 519088, China
2
Department of Economics and Management, University of Brescia, 25121 Brescia, Italy
3
Department of Economics, University of Perugia, 06123 Perugia, Italy
*
Author to whom correspondence should be addressed.
Sustainability 2022, 14(8), 4691; https://doi.org/10.3390/su14084691
Submission received: 27 January 2022
/
Revised: 3 April 2022
/
Accepted: 10 April 2022
/
Published: 14 April 2022
/
Corrected: 10 June 2022
(This article belongs to the Special Issue Investment, Growth and Sustainability)
Abstract
:We analyze the conditions for public debt-to-GDP ratio stability extending the Domar’s approach by including the interaction between the government’s reaction function and the private sector’s reaction function, and considering the impact of 2020–2021 pandemic shock and the monetary and fiscal policy responses, with simulations applied to the Italian case. The outcomes of the numerical simulations show the crucial importance of ECB extraordinary monetary policies, of the NGEU and, to lesser extent, of national expansionary fiscal policies adopted during pandemic shock; both European wide monetary and fiscal policies actually increase the sustainability area avoiding the high risk of sovereign debt crisis in Italy (and other peripheral Eurozone countries). The stabilizing effect of GDP growth, hopefully resulting from the NGEU policy, is also simulated in the paper.
JEL:
E65; F34; F361. Introduction
The impact of the pandemic and the national policy responses have led to a huge increase in public deficits; this impact and fiscal effort has been supplemented by extraordinary monetary measures, also in order to avoid higher interest rates and preserve public debt sustainability. On this last crucial issue, the Eurozone can be particularly vulnerable to adverse scenarios as it demonstrated almost a decade ago—after the Great Recession—with a dramatic sovereign debt crisis in four countries (Greece, Ireland, Portugal and Cyprus) with contagions on other economies (Spain and Italy) sometimes considered as “too big to fail” but also “too big to be saved”, with some risks also for the survival of the Euro. In case of sudden increases of public debt, the role of the central bank is especially crucial in an incomplete monetary union like the Eurozone. It should be noted that in the 2020 pandemic recession the increase in national public debts of the Eurozone countries was larger (in both absolute sizes and in the ratios to GDP) than in the 2009 Great Recession. However, the absence of a sovereign debt crisis was mainly due to the timing and appropriate decisions of the ECB (European Central Bank), especially the Pandemic Emergency Purchase Program (PEPP), adding to the previous QE operations an overall amount of €1850 billion and deciding to keep rolling the public debt for many years to come (certainly at least until the end of 2024). The new mood of EU policymakers has been reinforced by the innovative decisions regarding the fiscal policy (with particular reference to the Next Generation EU plan).
In this paper we first discuss the COVID-19 real impact and the timing and features of the policy responses in the EU and Eurozone and, as an original contribution, we define a theoretical model capable of detecting some key public debt sustainability conditions, with simulations applied to the Italian case, accounting for the real pandemic impact and the several European policy decisions. More in detail, we analyze the conditions for public debt-to-GDP ratio stability using the approach initially formalized by Domar [1] and Pasinetti [2]. The same stability equation for public debt is considered in many other papers, including, to name a few, Collignon [3], Blanchard [4] and Blanchard, Gopinath and Rogoff [5].
Following Tamborini [6] and Della Posta [7], we have extended those models, in order to consider the interaction between the public and private sectors, thereby providing a richer approach and thus more robust conclusions.
Within that setting it is possible to analyze also the likely effects of the adoption of a debt quasi-monetization. Our approach is—to our knowledge—original and unique in addressing the complex economic context following the pandemic shock and the policies adopted; the key results would contribute to the assessment of the sustainability conditions for a big country with a high public debt, with some suggestions for the reform and completion of the Eurozone. Marelli and Signorelli [8] summarize the crucial reforms proposed in recent years to assure the survival of the euro area in the long run.
In summary, the main original contribution of our paper is based on an analytical model suitable to interpret the effects of the COVID-19 pandemic on the sustainability of public debt and the policy responses that have been given to diminish its negative consequences; our model focuses on the dynamics of the public debt-to-GDP ratio and on the interaction between the government’s reaction function and that of the private sector; furthermore, using this theoretical model, we carry out some numerical simulations referred to the Italian case, which are particularly interesting because of the high public debt existing before the shock and the significant increase due to the pandemic shock and the policy responses.
The numerical simulations refer to some scenarios, that have been conjectured considering the actual events and policy decisions following the Pandemic shock (see Section 2.2 about the general context referred to such decisions): (i) the pre-pandemic situation; (ii) the initial macroeconomic impact of the pandemic shock; (iii) the first policy reaction by the EU institutions, i.e., the suspension of the fiscal rules (i.e., the Stability and Growth Pact); (iv) the initial wrong reaction by the monetary policy (the so-called “Lagarde’s shock”, i.e., the statement by the President of the ECB that it is not responsibility of the latter institution to “close the spreads”); (v) the important decision by the ECB itself to launch an innovative instrument, the “Pandemic Emergency Purchase Program” (PEPP); (vi) the possible alternative monetary reaction, i.e., a straight debt monetization; (vii) the crucial fiscal policy instrument adopted by the EU: the Next Generation EU (NGEU); (viii) the increase of GDP growth, thanks to the new expansionary monetary and fiscal policies (with their positive effects on debt sustainability).
The general conclusions of these numerical simulations confirm that the individual countries of the Eurozone, especially those—like Italy—characterized by a pre-existing high level of public debt, cannot be left alone in facing a major macroeconomic shock that causes an enormous worsening of public accounts, and in their efforts to adopt necessary recovery policies.
The paper is structured as follows. Section 2 illustrates the relevant literature review and the key policy decisions undertaken after the pandemic shock; Section 3 contains the analytical model to interpret the effects of the COVID-19 pandemic on the sustainability of public debt and its policy responses; Section 4 presents some simulations and results for the theoretical model, focusing on the Italian case; Section 5 discusses such results and Section 6 concludes.
2. Literature Review
In the first part of this section, the key theories and models are briefly discussed while the second part illustrates the most relevant policies recently adopted to face the pandemic.
2.1. Theories and Models
Many different theories on sovereign debt sustainability have been designed by several economists of quite different visions. Here we first briefly recall the European debate and the decisions after the global financial crisis and second we discuss the literature on the costs and benefits of “debt monetization” also referring to the pandemic shock situation.
In general, the reduction of the debt-to-GDP ratio largely depends on the growth of nominal GDP; hence the situation of low inflation experienced in the past two decades made more difficult such reduction (this situation partly reversed in 2021–2022 because of the upsurge of inflation). Historically a key role for the stabilization of the public debt-to-GDP ratio has been played by the inflation rate. In condition of zero primary surplus, to have a GDP growth higher than the average interest rate is a necessary condition for reducing public debt to GDP ratio, often used as proxy of debt sustainability [3,7,9,10]. We should distinguish between debt stability and debt sustainability. While debt stability refers to the conditions that should apply to assure that public debt will not increase [3,9,10], debt sustainability refers to the feasibility of those conditions [6,7,11]; if it is not the case, a positive primary surplus is necessary to avoid debt to GDP ratio increases. However, as stated by Tamborini [6], the larger the primary surplus needed for debt stabilization, the larger the fraction of market participants who share the belief that such surplus nears the maximum level that a country can reasonably stand, from a social point of view; such a widespread belief reduces market’s heterogeneity and increases the interest rate (risk premium) on public debt.
After the 2009 Great Recession and the Greek crisis, in the European context prevailed a neoliberalist vision suggesting “austerity policies” to preserve or restore public debt sustainability. From a Keynesian point of view it was quite obvious that the reduction of public expenditure (especially investment) sometimes together with the increase of taxation, implemented soon after a huge economic crisis, resulted in pro-cyclical policies, aggravating the recession (as in the Greek case) or favoring a new recession (as for Italy and the whole Eurozone) or weakening the weak GDP growth [12,13].
The above mentioned wrong economic policy was mainly supported by largely incorrect values of the fiscal multipliers that—after better investigations in Keynesian specifications—resulted higher than one especially if calculated during a recession and when interest rates reach the zero-lower bound [14,15,16]. In particular, Saccone et al. [17] confirmed the higher values of public investment multipliers and showed differences according to government functions. As showed by Auerbach and Gorodnichenko [18], the real consequences of the above non-Keynesian policies are even worse when several countries consolidate at the same time.
As stated by Krugman [19], the paradox was that austerity measures adversely affected even the public accounts and the sustainability of public debt; he showed the “self-defeating” impact of non-Keynesian policies due to a fall in the denominator of the relevant ratios (the GDP) larger than the small reduction in the numerator. As later showed by several other authors [20,21] fiscal austerity was really a wrong approach in addressing the crisis in the old continent, especially in Eurozone. In addition, during crisis periods–especially if addressed with wrong or inadequate economic policies—sudden capital outflows may worsen the imbalances in the Eurozone’s payment system [22,23].
As for the Eurozone context, considering a formal interpretation of the ECB’s Statute prevailing till few years ago, the Central Bank is not a “lender of last resort” for states and, consequently, it has much less power to control the national interest rate levels and the spreads. However, especially considering the flexible PEPP and the decision on Next Generation EU, we can say that, in facing the COVID-19 crisis the mistakes that have been made in the 2010–2012 Eurozone crisis have not been repeated.
As for the literature on “debt monetization”, economists of different theoretical orientations [24,25,26,27] recently agreed in suggesting—although in different forms—a substantial “monetization” of the new public debt due to the pandemic. One of the key points of our paper is that public debt monetization, by reducing the need to run large primary surpluses, reduces the negative effects on the interest rate, thereby providing a further important channel for public debt stabilization, in addition to the one provided by the direct reduction of the size of the public debt-to-GDP ratio.
The specific features of the pandemic, in particular the exogenous and symmetric nature of the shock affecting government debt, suggest that the new debt (and specifically the sovereign debt in the hands of Central Banks) is frozen or cancelled with no significant effects on inflation or credibility. The substantial absence of the above negative effects is confirmed by several empirical studies on different historical periods [28,29,30]. Krugman [31] argues that debt cancellation should be made contingent on states of nature that the country cannot affect, and this is the case of a pandemic. In addition, inflation has been systematically below forecasts in the last years [32] and low in the past decades due to several reasons, like the growing price competition of emerging economies, not to mention the substantial impact of technological innovation [33]. So, as discussed also by Becchetti and Scaramozzino [34], the inflationary and credibility impact of an unique “monetization” of the debt due to pandemic will probably be null or very low. As for the Eurozone context, De Grauwe [27] wrote: “We must push to use our monetary sovereignty as Europeans and our common currency to avoid another recession… We must proceed in the same way as Britain, where the Bank of England simply provides the money the government needs to support its people without generating it. The central bank prints money and with it covers the necessary expenditure that the pandemic forces the government to make”.
In bad times Central Banks can often avoid catastrophic scenarios and, in specific cases like a pandemic, they can also act exceptionally and decide a public debt monetization without inflationary and credibility undesired effects. According to Watkins [35], during pandemic the Central Banks substantially followed the suggestions of the Modern Monetary Theory; however, this behaviour is likely to finish when the economic situation returns to normality. In any case, the impact on average real GDP growth of expansionary monetary policies is usually quite low and, following Blanchard and Summers [36], the key policy lesson from the Financial Crisis suggests the need for more aggressive and ambitious fiscal policies, not to mention Krugman [37] calling for a paradigm shift in fiscal policy.
2.2. Policy Responses to the Pandemic Shock
The COVID-19 pandemic caused in 2020 an unprecedented fall in GDP, as a consequence of the economic shock. A shock that occurred both on the supply-side (interruption of global value chains, lockdown of productive activities) and the demand-side (decrease of consumption in some industries: transports, hotels and restaurants, tourist services, retail trade, etc.) as a consequence of the contagion risk, the falling incomes (many workers have incurred in redundancies) and the increase in the propensity to save due to uncertainty ([38,39,40]). (By using a DSGE model, Cardani et al. [41] find that in the euro area the recession was chiefly caused by “lockdown shocks”, for exampl forced savings and labour hoarding). In 2021, despite further waves of COVID’S contagion, economic recovery became progressively more intense, also thanks to the vaccination campaigns. Despite this recovery, the economic consequences of the shock can be long lasting [42].
Differently from previous crises—in particular the global financial crisis and Europe’s sovereign debt crisis—policy responses have been prompt and huge all over the world. The central banks were the earliest policymakers to immediately react (a review of the measures undertaken by the four major central banks in the world is in Haas et al. [43]. The action of central banks was important not only to halt the recession, but also to guarantee public debt sustainability. Public debt sustainability, with specific reference to the Eurozone countries after the pandemic, has been assessed by Briceno and Perote [44]. In a different paper, the increased probability of default of sovereign debt has been estimated after the pandemic shock for many countries by making use of the Markov chain method [45]. In the United States, there was consensus on greater relevance of counter-cyclical fiscal policies and monetary policy, contributing to the growing role of the State [46]. In the Eurozone, previous austerity strategies have been overturned (thanks to the exceptional measures examined below) and the hope is that such changes should not be momentary [47]. As a matter of fact, it is now recognized that expansionary fiscal policies are important not only to sustain economic recovery, but also to better guarantee public debt sustainability. On the other hand, although it is true that high public debt levels may dampen economic growth, Butkus et al. [48] show that this effect appears with a relatively high debt-to-GDP ratio in countries where the expenditure multiplier is high (and vice-versa). On the whole, fiscal, monetary and macro-prudential policy interventions have substantially reduced the fall in output. There are also some econometric studies estimating the impact of the policy response, but most of them regard individual countries: see for example Conefrey et al. [49] in the case of Ireland; they use both a global and a domestic structural macroeconomic model. According to the most recent forecasts and announcements, although fiscal policies will remain expansionary in most countries in the world also in 2022, monetary policy will progressively correct the exceptionally accommodative stance, certainly in the case of the Fed and more gradually by the ECB; the key reason is the upsurge of inflation, that progressively increased in 2021 and reached in December 7% (on a yearly base) in the United States and 5% in the Eurozone.
We focus now, in this section, on the impact of the pandemic and the macroeconomic policies undertaken in the EU—more specifically the Eurozone as for monetary policy—with some hints about fiscal policies in Italy. For comparisons with policies adopted in other countries, see the specific page prepared by the IMF (https://www.imf.org/en/Topics/imf-and-covid19/Policy-Responses-to-COVID-19#U, accessed on 15 January 2022) and on the specific Central Banks’ web pages.
Most of EU countries will reach pre-pandemic production levels in an interval between the end of 2021 and the end of 2022 (some countries, namely the United States and, even before, China, already accomplished it). According to the European Economic Forecast (Autumn 2021, published in November) the growth of GDP of the EU will bounce back from −5.9% in 2020 to +5% in 2021. (The corresponding figures for the euro area are −6.4% and +5%; for individual countries: Germany −4.6% and +2.7%, France −7.9% and +6.5%, Italy −8.9% and +6.2%, Spain −10.8% and +4.6%. For comparison purposes: the United States: −3.4% and +5.8%, United Kingdom −9.7% and +6.9%).
Economic recovery was strengthened by the quick and huge policy response [50]. Monetary policy made use of both traditional and unconventional measures. Public expenditure increased, first of all, to reinforce the injured health systems and to compensate workers and firms hurt by the shock; then, also to uphold the recovery, in some cases by means of exceptional investment programs. Public deficits and debts blew up and, as a result, in some countries the situation of public accounts is becoming worrying.
A key role in guaranteeing the regular functioning of the economic system and calming the financial markets has been played by the European Central Bank (ECB). As traditional tools have already been fully exploited in the past (the main refinancing operations rate is zero since 2016 and the rate on overnight deposits is equal to −0.50%), monetary policy focused on providing the necessary liquidity to the system with unconventional measures, in particular with an augmented QE.
In addition to various measures (such as the extension of the pre-existing APP (Asset Purchase Program), the adoption of more favorable terms on existing targeted longer-term refinancing operations (TLTRO-III), the introduction of a new liquidity facility, named Pandemic Emergency Longer-Term Refinancing Operations (PELTRO). Further decisions by the ECB concerned facilitating existing bilateral swap and repo lines with other central banks, an expansion of the eligible assets under the corporate sector purchase program (CSPP), and the relaxation of collateral standards for Eurosystem refinancing operations. Credit easing decisions were also taken by the ECB Banking Supervision), adopted by the Governing Council on 12 March 2020, but also following the infamous statement of Christine Lagarde, ECB’s President (We are not here to close spreads, there are other tools and other actors to deal with these issues) on the same day—with immediate effects on the spreads of peripheral countries and also on stock exchange indices—the monetary policy became soon judicious and more accommodative. On 18 March, a new program was launched: the Pandemic Emergency Purchase Program (PEPP), consisting of asset purchases of private and public sector securities. The size of the PEPP was expanded twice, in June and December 2020, bringing the total to €1.85 trillion euro. The duration of the program has been extended to March 2022 (as confirmed by Governing Council in December 2021), but the ECB will reinvest maturing securities until at least the end of The new program is interesting because a certain flexibility in the management of monetary policy has been foreseen, namely the possibility to temporarily deviate from the capital key requirement in the allocation of purchases among countries. This PEPP is practically equivalent to a “temporary monetization” of the public debt increases consequent to the pandemic, thus—besides supporting economic growth (Some specific effects of PEPP on economic growth—more precisely through the transmission channel and on banking sector credit risk, financial distress, banking sector profitability, and solvency-have been investigated by Teresiené et al. [51]). It also favors sovereign debt sustainability and the persistence of extremely low interest rates (also in peripheral Eurozone countries); some studies have econometrically verified the impact of the Asset Purchases Program (APP), including PEPP, on the reduction of sovereign yields of euro area countries [52]; the decline in yields has been estimated in the range of 58–76 bps.; the analysis is based on time-varying coefficient methods applied to monthly panel data.). We also mention that in 2021 a change in the monetary policy strategy (already announced at the beginning of 2020) was realized. In particular, on 22 July 2021, the ECB decided, similarly to the decision by the FED one year earlier, a new quantitative definition of price stability, moving from “below but close to 2%” to “at an average value of 2% in the medium run and symmetrical”. This new strategy implies that an expansionary monetary policy will continue even if the Eurozone inflation rate would temporarily exceed the 2% target.
Moving now to review the fiscal decisions taken by the EU authorities, first of all the Commission quickly activated the “general escape clause” within the Stability and Growth Pact, which suspends the fiscal adjustment requirements for countries that are not at their medium-term objective and allows them to run deficits in excess of 3% of GDP. This decision was accompanied by the announcement of a flexible interpretation of EU State Aid rules, to support national support measures for critical sectors, thus enabling Member States to compensate companies for the damage directly caused by COVID-Besides some heterogeneous and less important measures adopted in Spring 2020, the EU Commission decided a package of different measures, initially worth about €540 bn. (4% of EU27 GDP): (i) allowing the European Stability Mechanism (ESM) to provide Pandemic Crisis Support up to 2% of GDP for each euro area country (up to €240 bn. in total) to finance health related spending (this facility has not yet been exploited by any country); (ii) providing €25 bn. in government guarantees to the European Investment Bank (EIB) to support up to €200 bn. to finance companies, with a focus on SMEs; (iii) creating a temporary loan-based instrument (SURE), of up to €100 bn., to protect workers and jobs, supported by guarantees from EU Member States.
The fourth measure is the most important one and was approved by the European Council on 21 July 2020: the “Next Generation EU”, a program worth €750 bn., of which €390 bn. transfers to countries most hit by the crisis and €360 bn. long-term loans at very low interest rate, which will be channeled principally through a special “Recovery and Resilience Facility” (RRF). High-debt countries hit hard by the pandemic (e.g., Italy, Spain) and Eastern European countries are the biggest net beneficiaries from the RRF. (More precisely, [53] investigate the allocation criteria to individual countries and find that, in addition to health criteria, RRF grants have been allocated as a function of populations’size, Gross Domestic Product (GDP) per capita and unemployment rates.) This plan will certainly increase economic growth in the medium run [54]; moreover, it has been weighed up because it represents—according to some interpretations—a first step toward a “fiscal union”, with the issue of a EU common debt, a temporary increase of the EU budget, new common expenses (accruing to countries according to their needs) and new EU-wide taxes (necessary in the coming years to reimburse the debt reaching maturity). The payments will be made by the Commission to the EU countries after rigorous checks of the national plans presented by individual countries (such as the “Piano nazionale di ripresa e resilienza”, PNRR, in Italy) and of periodic reports by the same countries. The first installments have been made in August 2021.
Finally, we consider here the fiscal packages decided by the Italian government, precisely by the Conte 2nd Government (in 2020) and the Draghi Government (in 2021). For example, the “Cura Italia” decree, adopted by the Italian Government on 17 March 2020, was worth €25 bn. (1.6% of GDP) and included: (i) funds to strengthen the Italian health care system and civil protection; (ii) measures to preserve jobs and support income of laid-off workers and self-employed; (iii) other measures to support businesses, including tax deferrals and postponement of utility bill payments in most affected municipalities; (iv) measures to support credit supply. Together with the subsequent decree-laws (i.e., the “Liquidity” Decree of 6 April, the “Relaunch” decree of 15 May and the “August” decree of 14 August), provision has been made for around 100 billion euro in 2020 in terms of net borrowing (corresponding to budget appropriations of more than EUR 210 billion euro). In Autumn 2020, several Decrees (called “Ristori”) were approved during the second pandemic wave, for a total intervention of more than €26 billion, concentrated mainly on non-repayable contributions, suspension of taxes, contributions and payments, new weeks of supplementary fund and two further months of emergency income.
The new Draghi Government approved in 2021 similar packages (from March to July, mostly called “Decreto sostegni”). The content of the recent decrees is similar to those approved in the previous year. It is more interesting to give some hints on the resulting evolution of public accounts, as documented in the official “Documento di eeconomia e finanza” (DEF) and the subsequent “Nota di Aggiornamento” (NADEF), presented by the Italian Government in April and September 2021, respectively. Well, according to the latter document, total public deficit, that in 2019 was 1.5% of GDP, has increased to 9.6% in 2020 and 9.4% in 2021, then it will decrease to 5.6% in 2022 (The corresponding primary surplus (or deficit) in the same years (2019–2022) is: +1.8%, −6.1%, −6%, −2.7%.); in the same years (2019–2022) the ratio between public debt and GDP is the following: 134.3%, 155.6%, 153.5% and 149.4%.
It is obvious that such a large increase in the debt/GDP ratio will not lead to an unsustainable situation only if the additional public expenditure, in particular that related to the investment program, leads to an increase of the growth path.
3. The Analytical Model to Interpret the Effects of the COVID-19 Pandemic on the Sustainability of Public Debt and Its Policy Responses
Following the seminal work of Tamborini [6], let us consider now the analytical model that we are going to use to interpret the effects of the COVID-19 pandemic on the sustainability of public debt and the policy responses that have been given to preserve it. In order to do that we will consider first the equation representing the dynamics of the public debt-to-GDP ratio (Section 3.1) from which the government’s reaction function will be derived. We will then analyze the private sector’s reaction function (Section 3.2).
3.1. The Dynamics of the Public Debt-to-GDP Ratio
In order to consider the effects of the pandemic shock on the sustainability of public debt, we can consider the standard equation representing the continuous time variation of the public debt-to-GDP ratio ) in the hands of the private sector [7,11]:
In Equation (1), is the time variation of the public debt-to-GDP ratio which is held by the private sector, the variable is the is the part of the new debt-to-GDP ratio held by the central bank, quantifying the central bank’s monetary intervention to prevent the growth of public debt-to-GDP in the hands of the private sector and is the financing coming from the government’s primary deficit, namely the structural primary public surplus-to-GDP ratio at time t, given by the difference between government revenues and non-interest government expenditure: (see Della Posta [7], to verify how is the stability condition reported above obtained.
The variable is the nominal interest rate on public debt and indicates the GDP rate of growth, that for the time being are both assumed to be constant. Variable is the existing public debt to GDP ratio at time , consequently the term is the growth-adjusted service on the debt as a ratio of GDP. Our model extended Domar, Arestis and Sawyer, and Hein and Detzer [1,55,56].
In order to analyze the stability conditions of public debt after the COVID-19 pandemic, however, in this paper we will consider the monetary and fiscal instruments as a single policy instrument, :
For public debt to GDP ratio to be stabilized, it must be that When that is the case, Equation (1), considering also Equation (2) becomes, then:
where the symbol * refers to the long term, steady state value of the variable on which it is applied. The value of the interest rate and of GDP growth are also assumed to be constant, long term values, respectively and . Any value of such that (3) is satisfied, will imply a stabilization of public debt to GDP ratio, so as to avoid a public debt crisis. Of course, if > , then the public debt-to-GDP ratio would be decreasing, so that even a given primary public deficit-to-GDP joint with the available monetary resources () might be fully compatible with a stable public debt-to-GDP ratio.
The equation above says that what matters for public debt stability is not just the size of the public debt-to-GDP ratio, but also the interest rate, the GDP growth and the possibility to run the primary surplus and/or the monetary availability to monetize—directly or indirectly, the public debt. The overall monetary and fiscal stabilizing resources may well be uncertain and when Lagarde (12 March 2020) made her declaration, it became clearer that there would be much less availability of them.
Equation (3) can be rewritten as:
The interpretation of such an equation is straightforward, namely for any given level of public debt-to-GDP ratio to be stable, , given the availability of monetary and fiscal resources to repay it , and given a certain GDP growth, , there is a highest interest rate level that can be resisted. If the current interest rate to be paid is higher, then, the public debt-to-GDP ratio is not sustainable anymore.
3.2. The Private Sector’s Reaction Function
Together with the government’s reaction function to guarantee the sustainability of public debt, we should consider the market reaction function, that can be represented as follows ([6,11] for further details and explanations):
This is a simple arbitrage equation with a risk premium attached to it. The interest rate () is assumed to depend on a risk-free interest rate , and on a risk premium. The latter depends on , which is the probability of public debt default. Considering the existence of heterogeneous agents, p changes with the percentage of agents who believe that the fiscal and monetary resources required for public debt stabilization, , cannot be increased beyond a given feasibility limit, .
The probability of public debt default, then, depends also on the degree of uncertainty as to its sustainability: we can plausibly assume that the higher is the degree of uncertainty, the higher is the heterogeneity of market expectations, in which case there is neither a large or prevailing fraction of market participants who think that is low, nor a large or prevailing fraction thinking that it is high.
Following Tamborini [6], the feasible upper limit for the available resources (that we are considering here as having both a fiscal and a monetary nature) is assumed to be normally distributed and to have a given mean () and standard deviation (). As a consequence, when increases, the percentage of agents who believe that the feasibility limit has been reached will also increase. So, the difference between and affects negatively the probability of default. The reduction of the market belief of public debt instability resulting from a reduction of would induce, for example, a reduction of the risk premium on the interest rate, thereby increasing the sustainability of public debt.
Similarly, the larger , the larger the interest rate, i, is going to be.
In conclusion, the probability of default can be considered as determined by the cumulative distribution function of , whose value is included between the lower and upper limits and t. So, the higher , the closer to 1 such a cumulative distribution function is, and the larger the fraction of people who believes that is getting closer to .
Equation (5) becomes, then:
where is the fraction of people believing that and increasing, then, with . This means that .
Equation (6) is the market’s reaction function to , facing the government’s reaction function to the value taken by i, given by Equation (3) above.
4. Simulations and Results: The Model at Work
Let us use the equations above to simulate the situation preceding the pandemic shock and the several phases that have been characterizing it, including those of the policy responses and the most recent ones, characterized by some economic recovery. Table 1 summarizes the values of the parameters used to simulate the different cases that we are going to consider.
4.1. The Pre-Pandemic Situation
The pre-pandemic situation is one that can be thought as being characterized by a relatively large area of public debt stability. In Figure 1, the vertical axis represents the interest rate and the horizontal axis the overall stabilizing resources required to guarantee public debt stability. The interaction between the market reaction function (continuous line) and the government reaction function (dotted line) show that the interest rate only incorporates a growing risk premium when the required stabilizing measures exceed approx. the value of 6%.
4.2. The Pandemic Shock
The COVID-19 pandemics can be thought as decreasing GDP growth (we can represent it with a stochastic shock that reduces , such that = ), thereby affecting the public debt dynamics. The equation becomes then:
This is sufficient to destabilize public debt and to make necessary a larger primary surplus, , to regain stability:
We can rewrite it as:
Figure 2 shows how the pandemic shock (v = 5%) makes public debt unsustainable (the straight continuous line never intersects the private sector’s reaction function).
4.3. Suspending Fiscal Rules and Allowing Public Debt to Grow
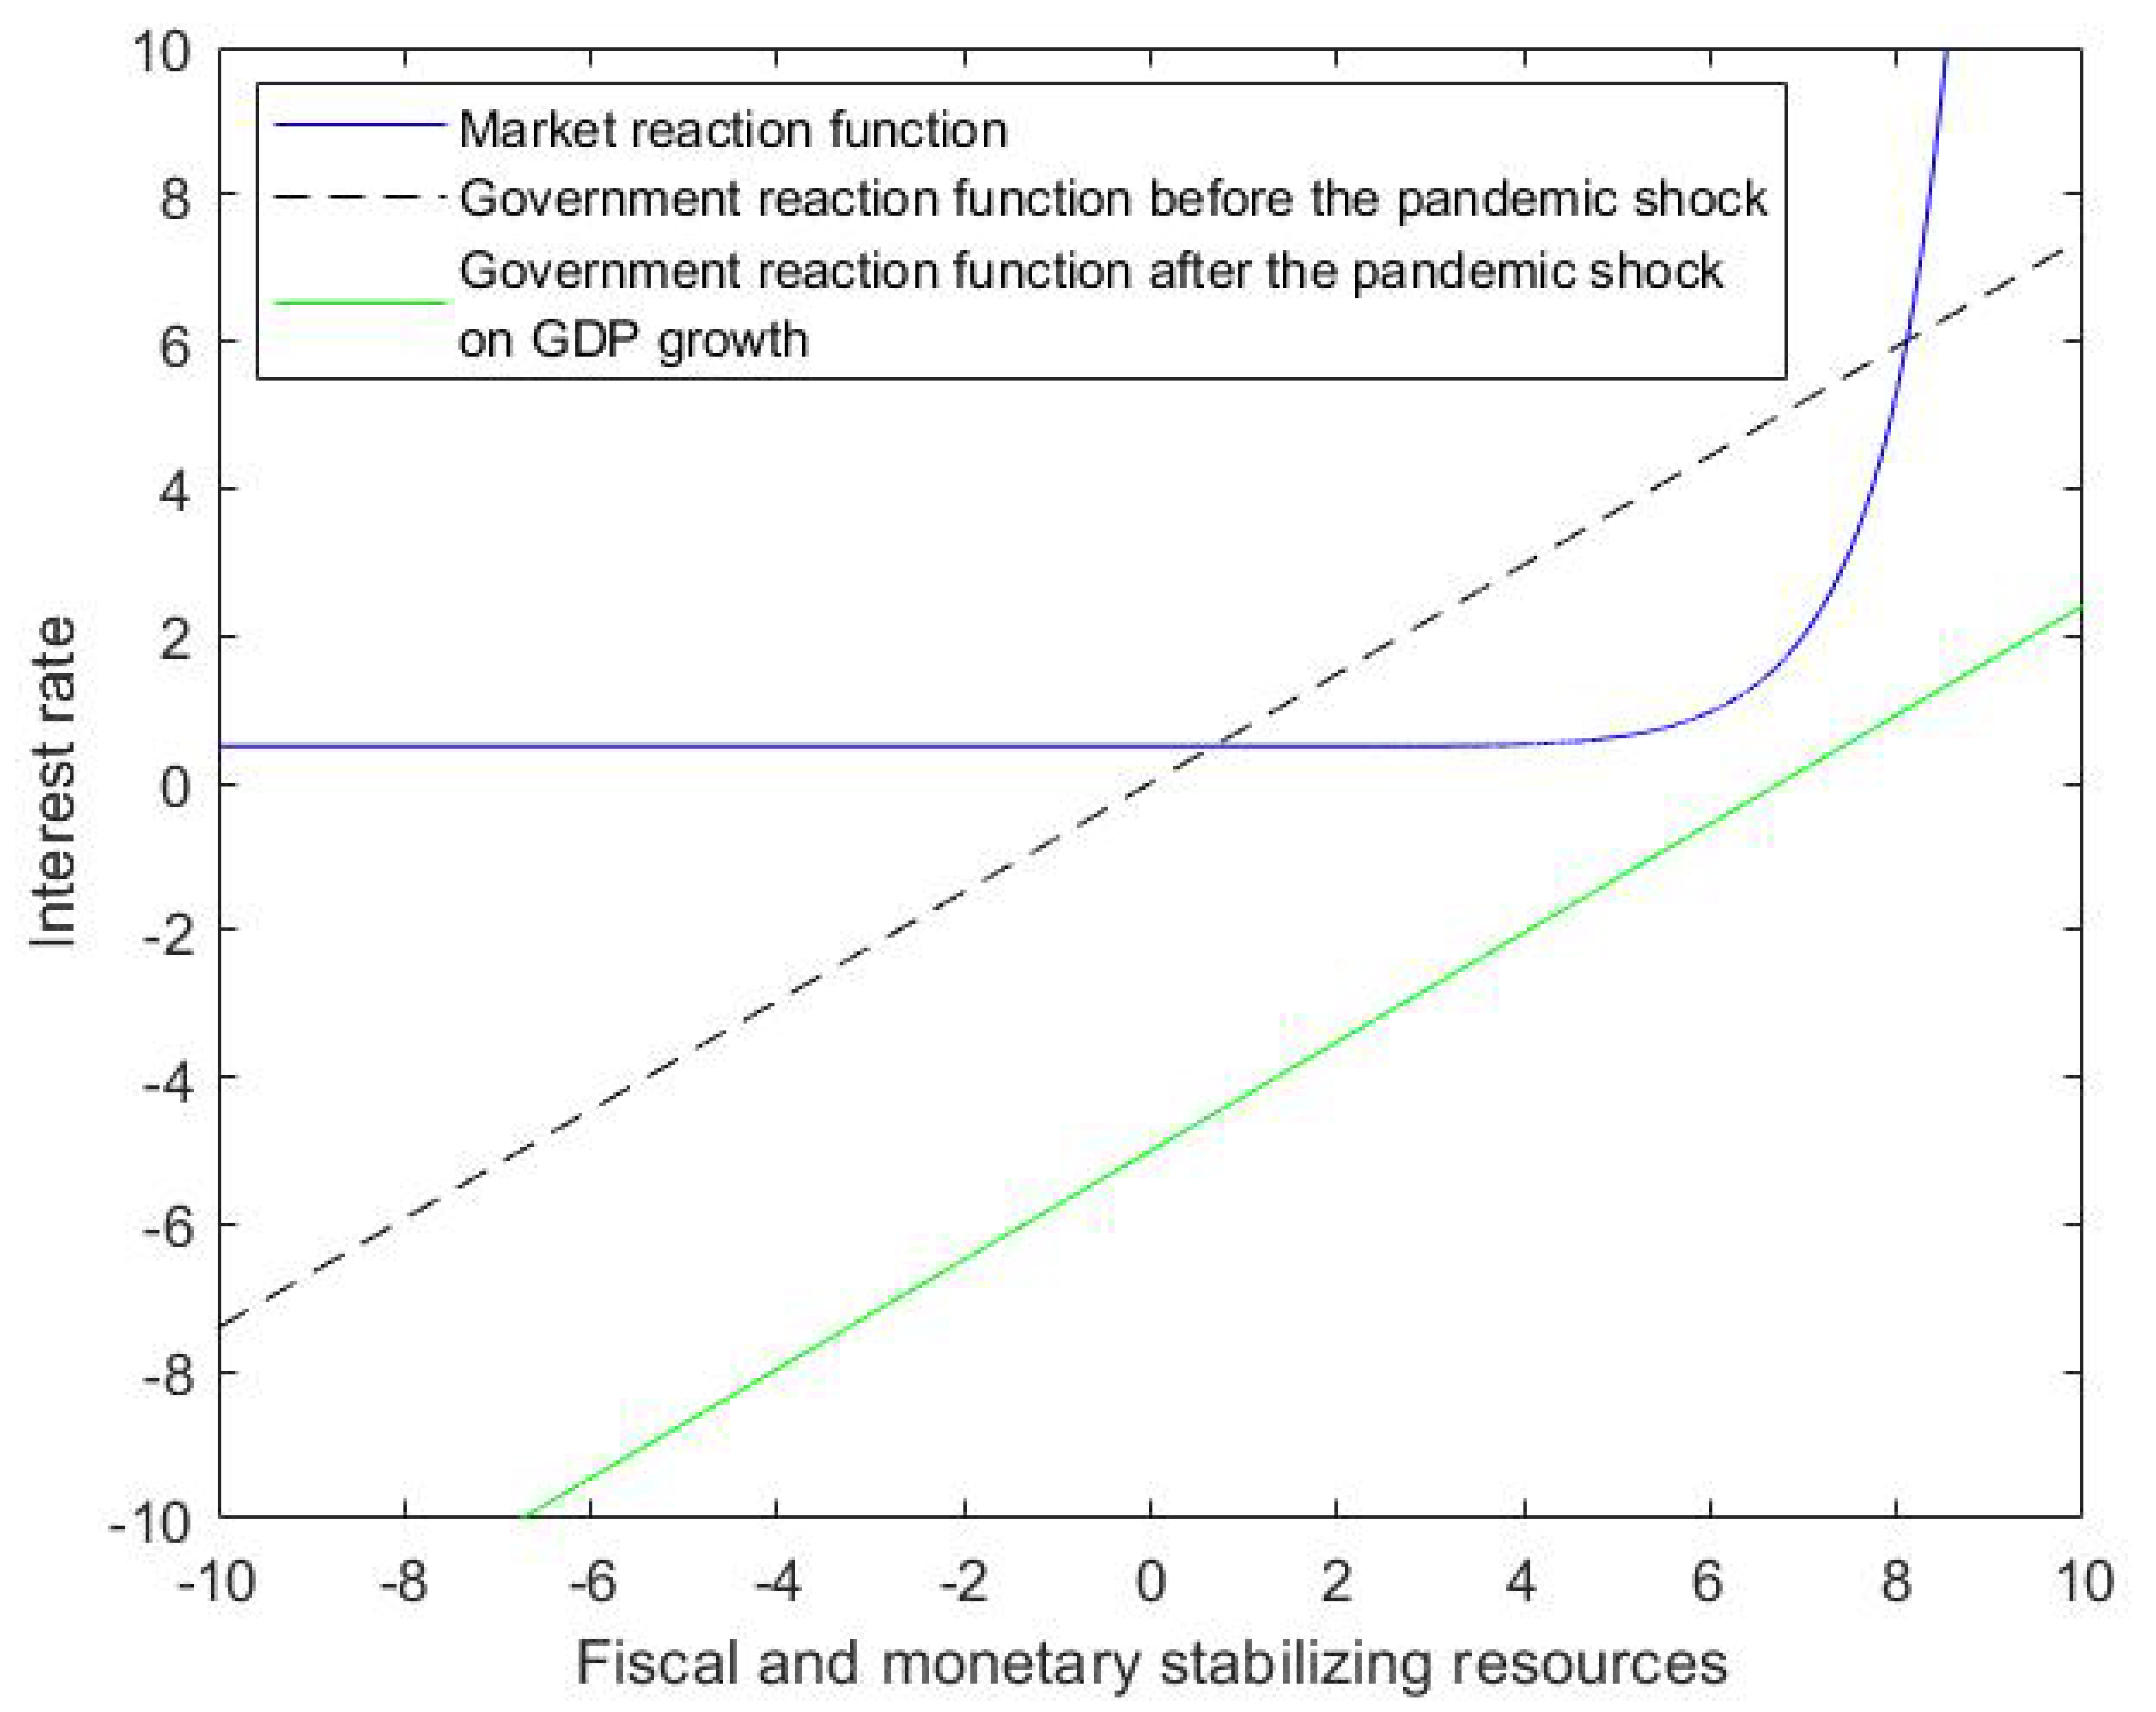
If the fiscal rules are suspended, as it was done in the EU with reference to the Stability and Growth Pact rules after the pandemic shock (in March 2020), so that public debt is allowed to increase, the government’s reaction function shifts up again and stability is regained, as it is shown in Figure 3, with the continuous straight line now overtaking to the left the dotted line and enlarging the area of stability.
4.4. The Lagarde Shock
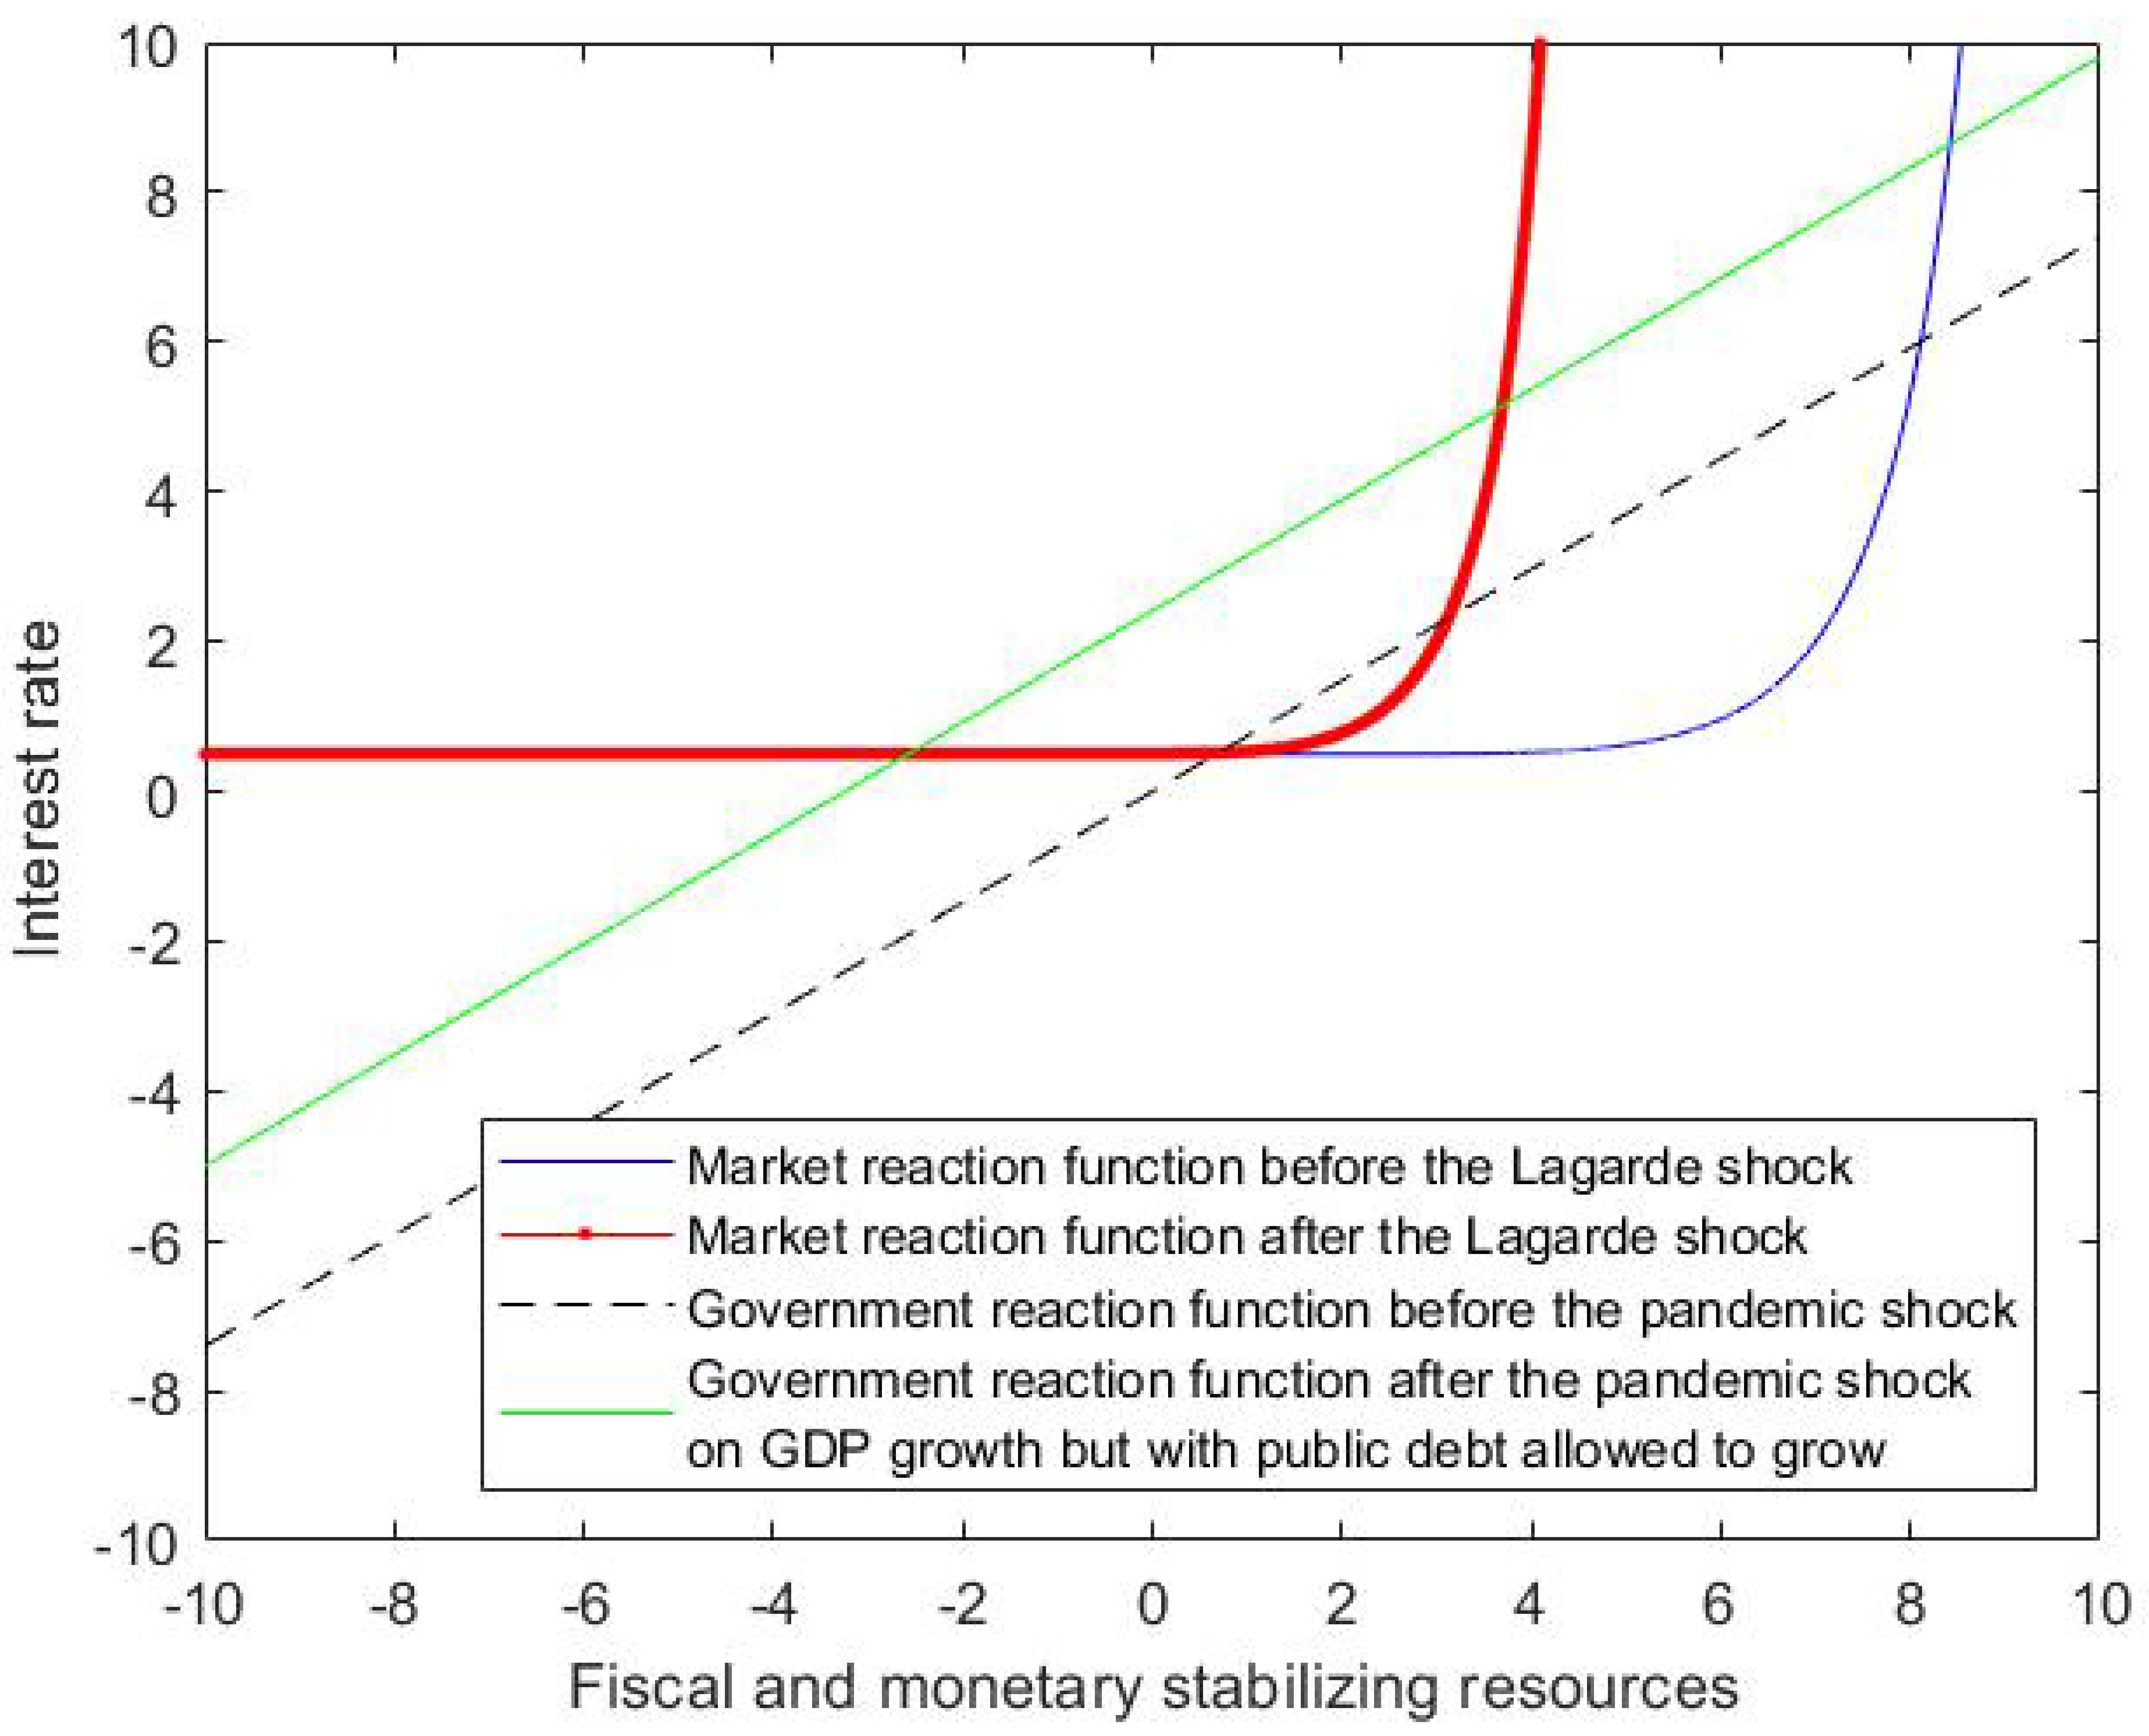
Unfortunately, in the middle of the pandemic shock, Ms. Christine Lagarde, President of the ECB, made on 12 March 2020, an inappropriate declaration relative to the unavailability of the ECB in “closing spreads” on sovereign bonds of Eurozone’s countries, in other words in playing a stabilizing role for public debt of EMU member states. As a result, the private sector’s reaction function exhibits a dramatic contraction that reduces significantly the area of public debt stability, as the continuous curve (resulting from Ms. Lagarde’s declaration) to the left of the pre-existing dotted curve in Figure 4 shows clearly.
The stable region gets reduced (see the red line) as a result of the fact that now a lower size of stabilizing resources (both fiscal and monetary) is available and this is even more certain than before.
4.5. The Pandemic Emergency Purchase Program (PEPP)
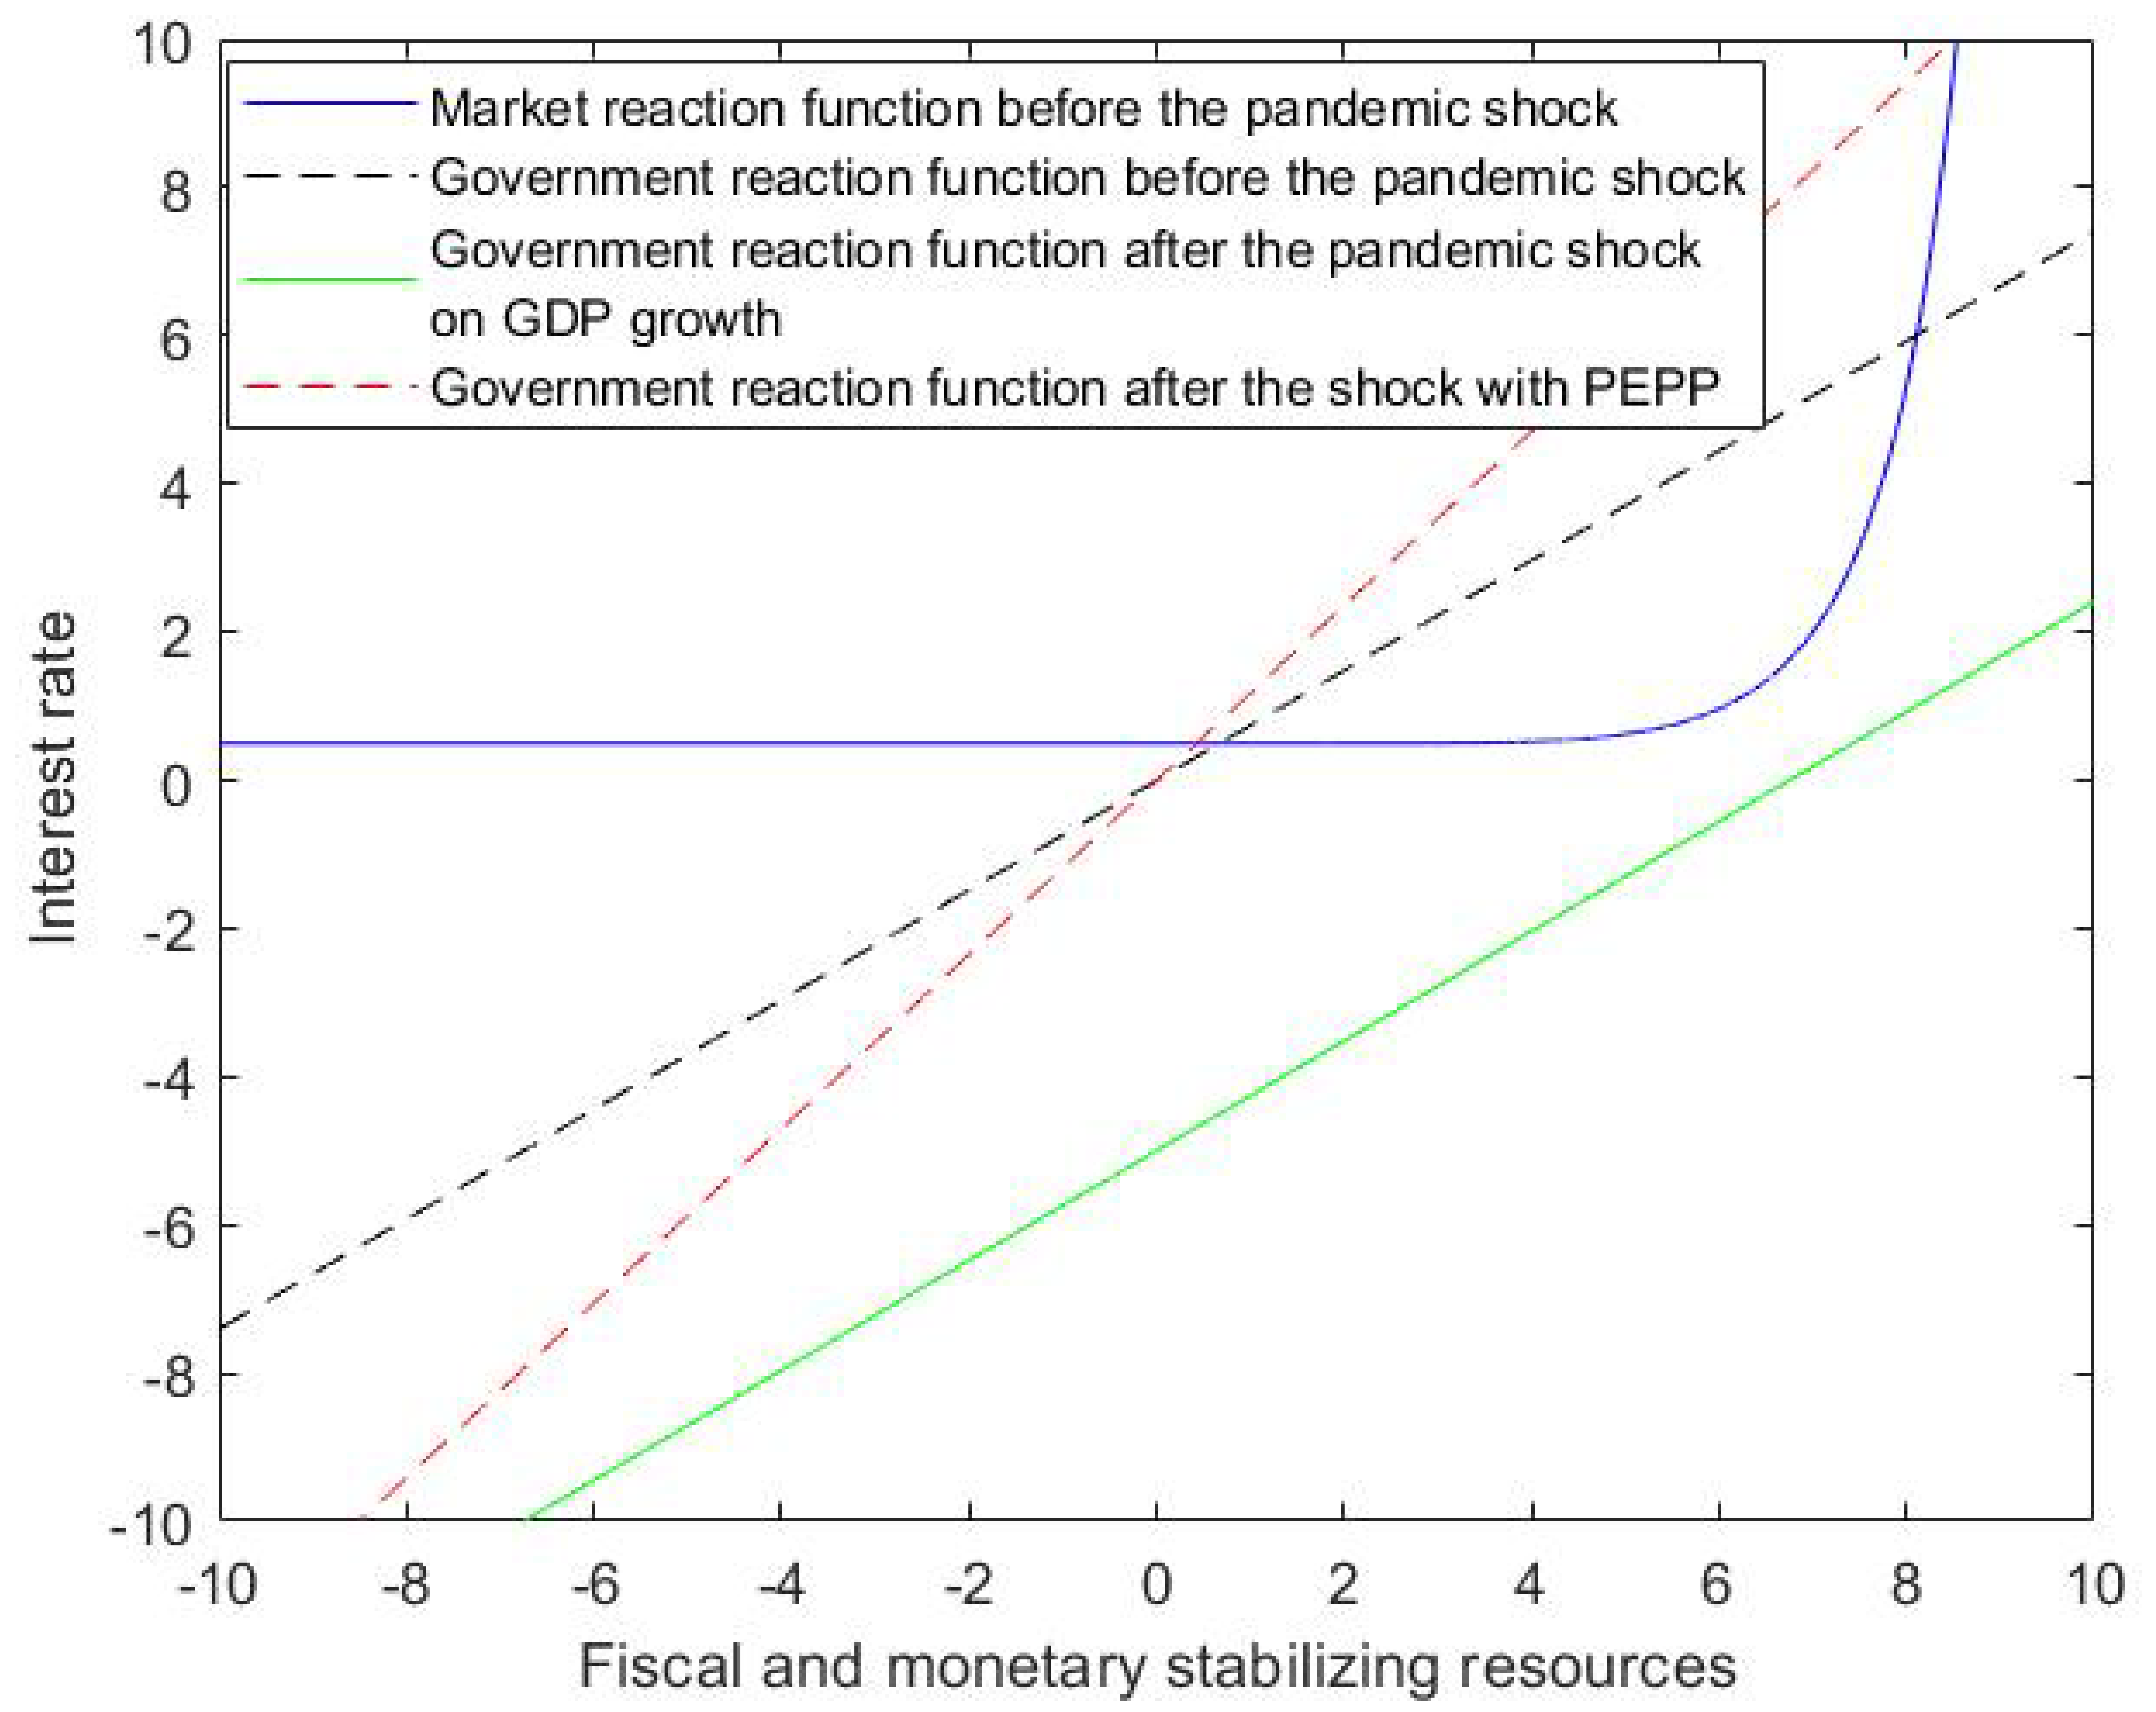
Once the pandemic shock had hit the economy (as represented by the parallel continuous line to the right of the dotted line representing the pre-pandemic situation, as already seen in Figure 2), stability could be regained, by reducing the quantity of public debt held by the market. With the PEPP the ECB buys a given fraction of national public debt, thereby removing it from the higher risk premium demanded by the market evaluation and charging on it, instead, a lower, plain vanilla, interest rate. This is represented by the dotted steeper line. Such a policy makes possible an enlargement of the public debt stability region (see Figure 5).
It should be observed that a similar result could have been obtained in the case of a proper debt monetization by the ECB, as shown in Figure 6 below:
4.6. Next Generation EU
4.7. Public Debt Stabilization to Be Obtained through GDP Growth
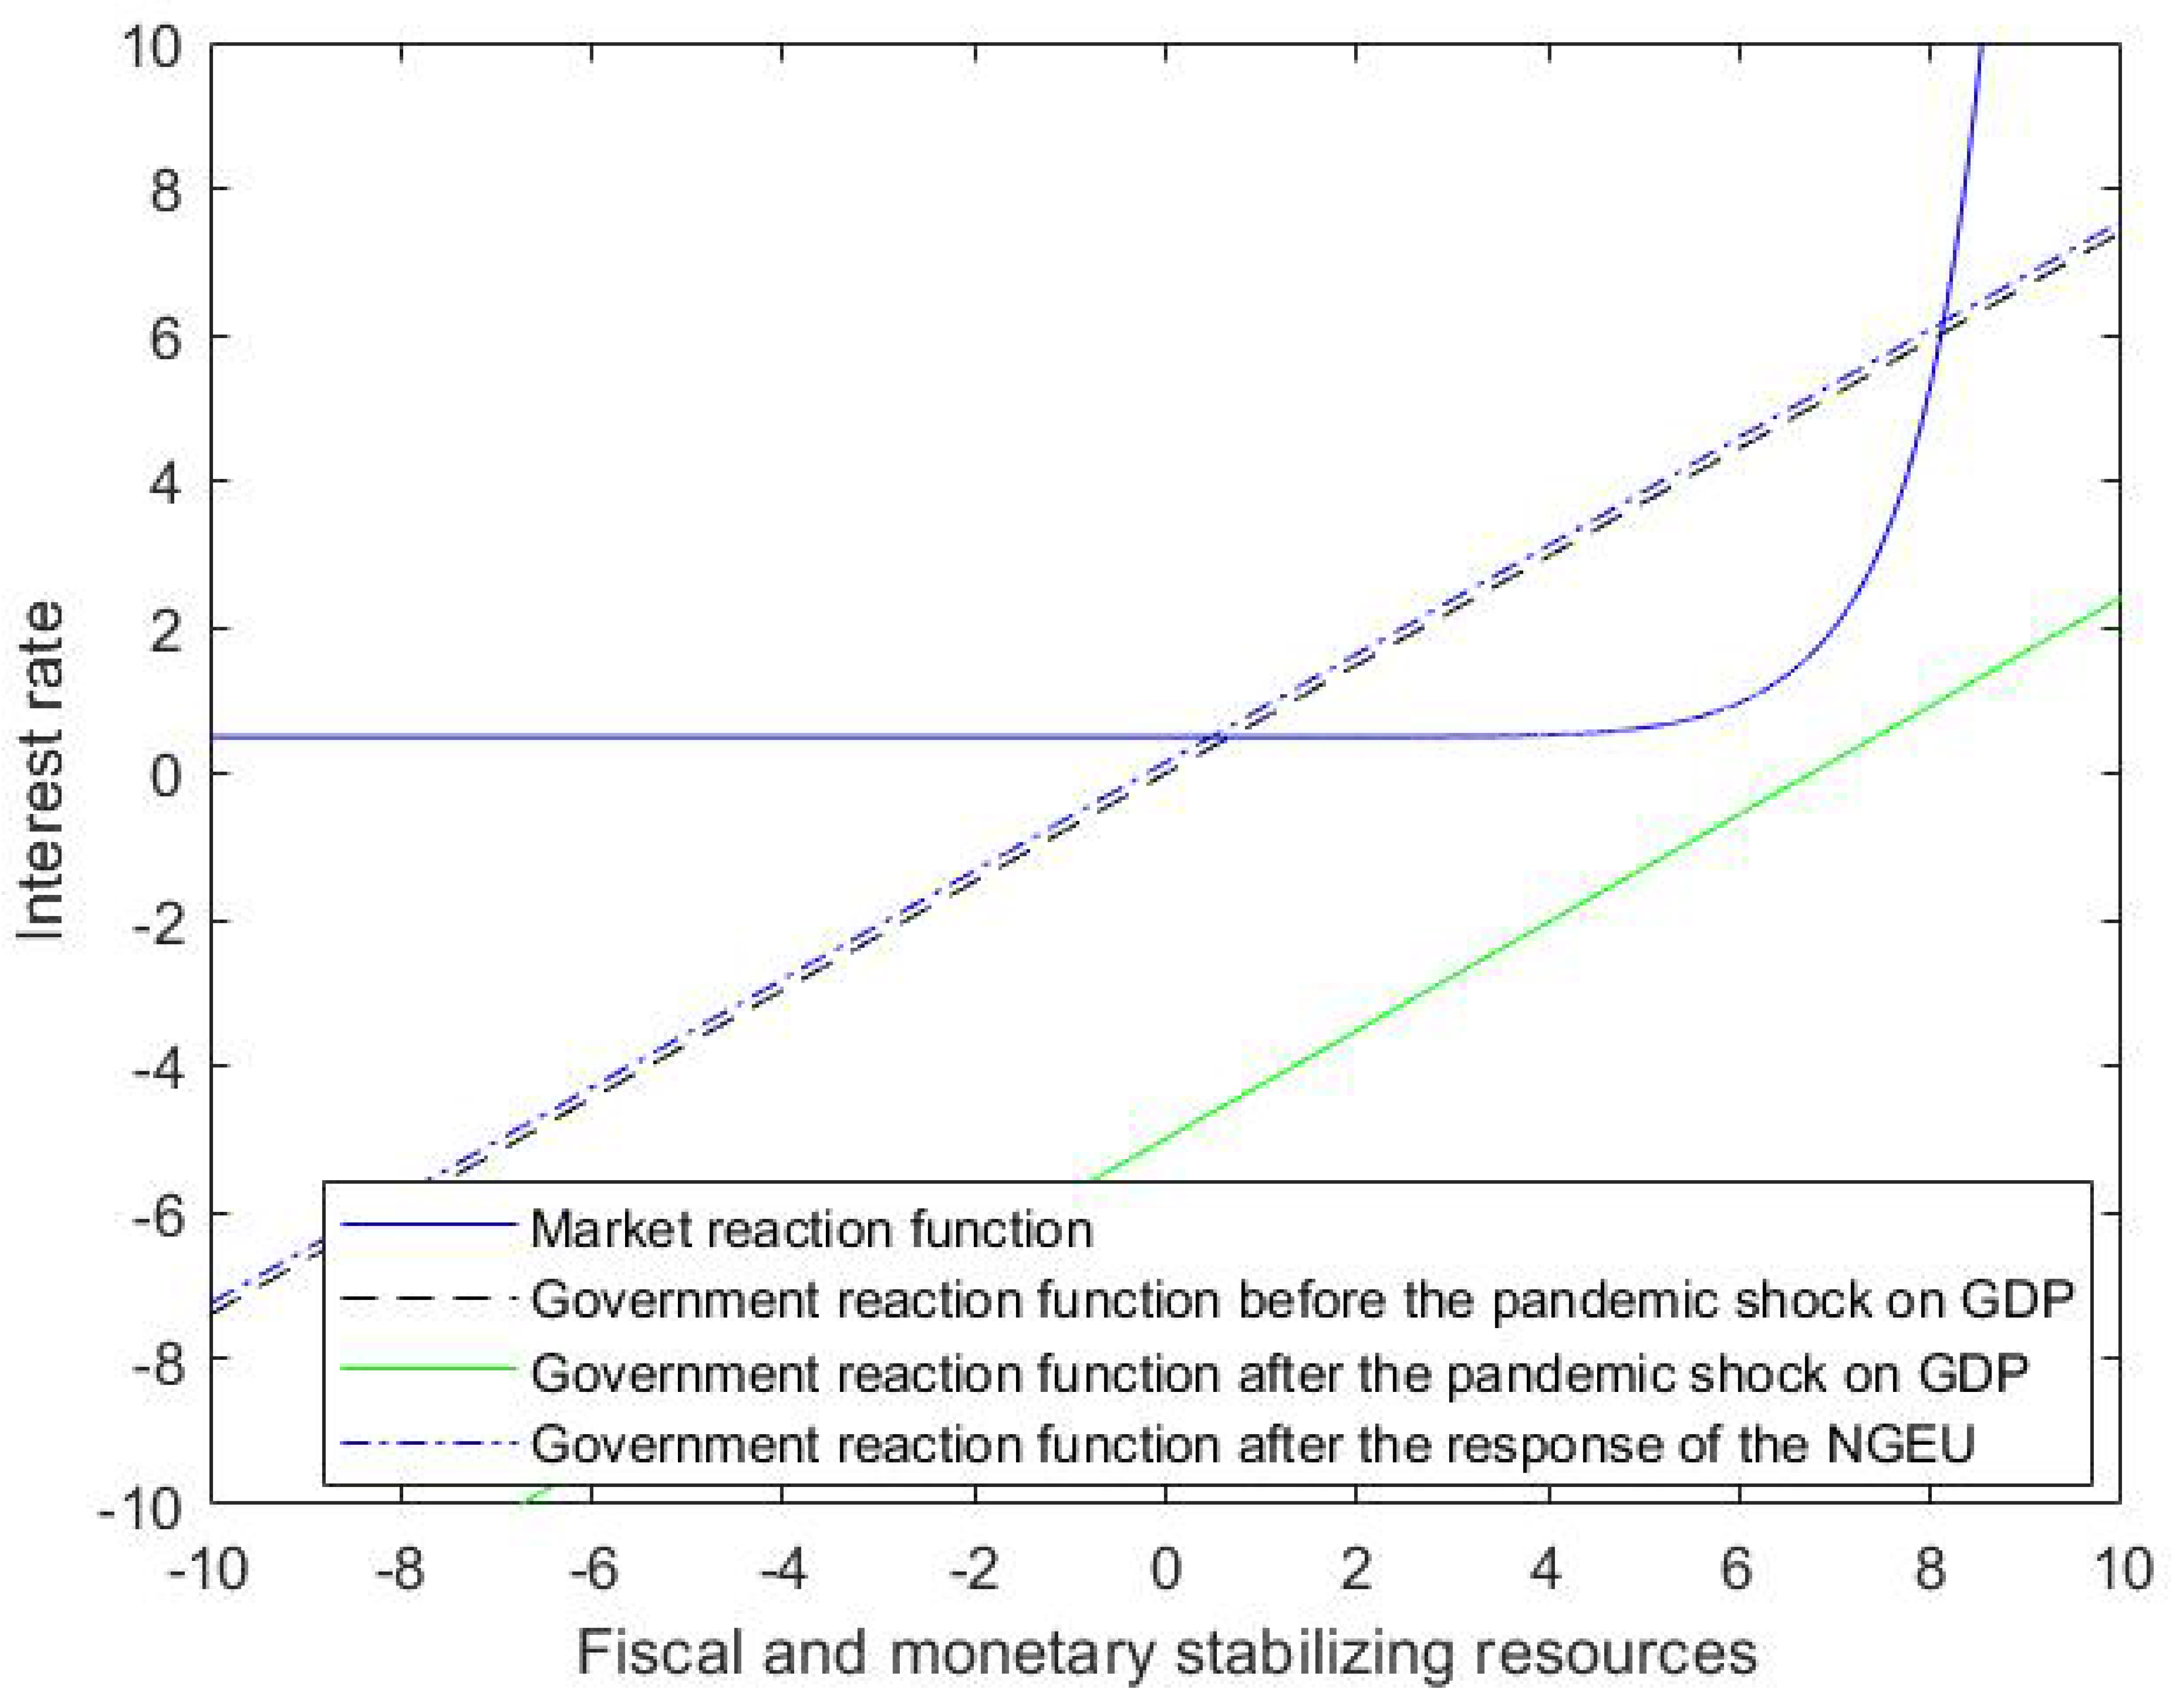
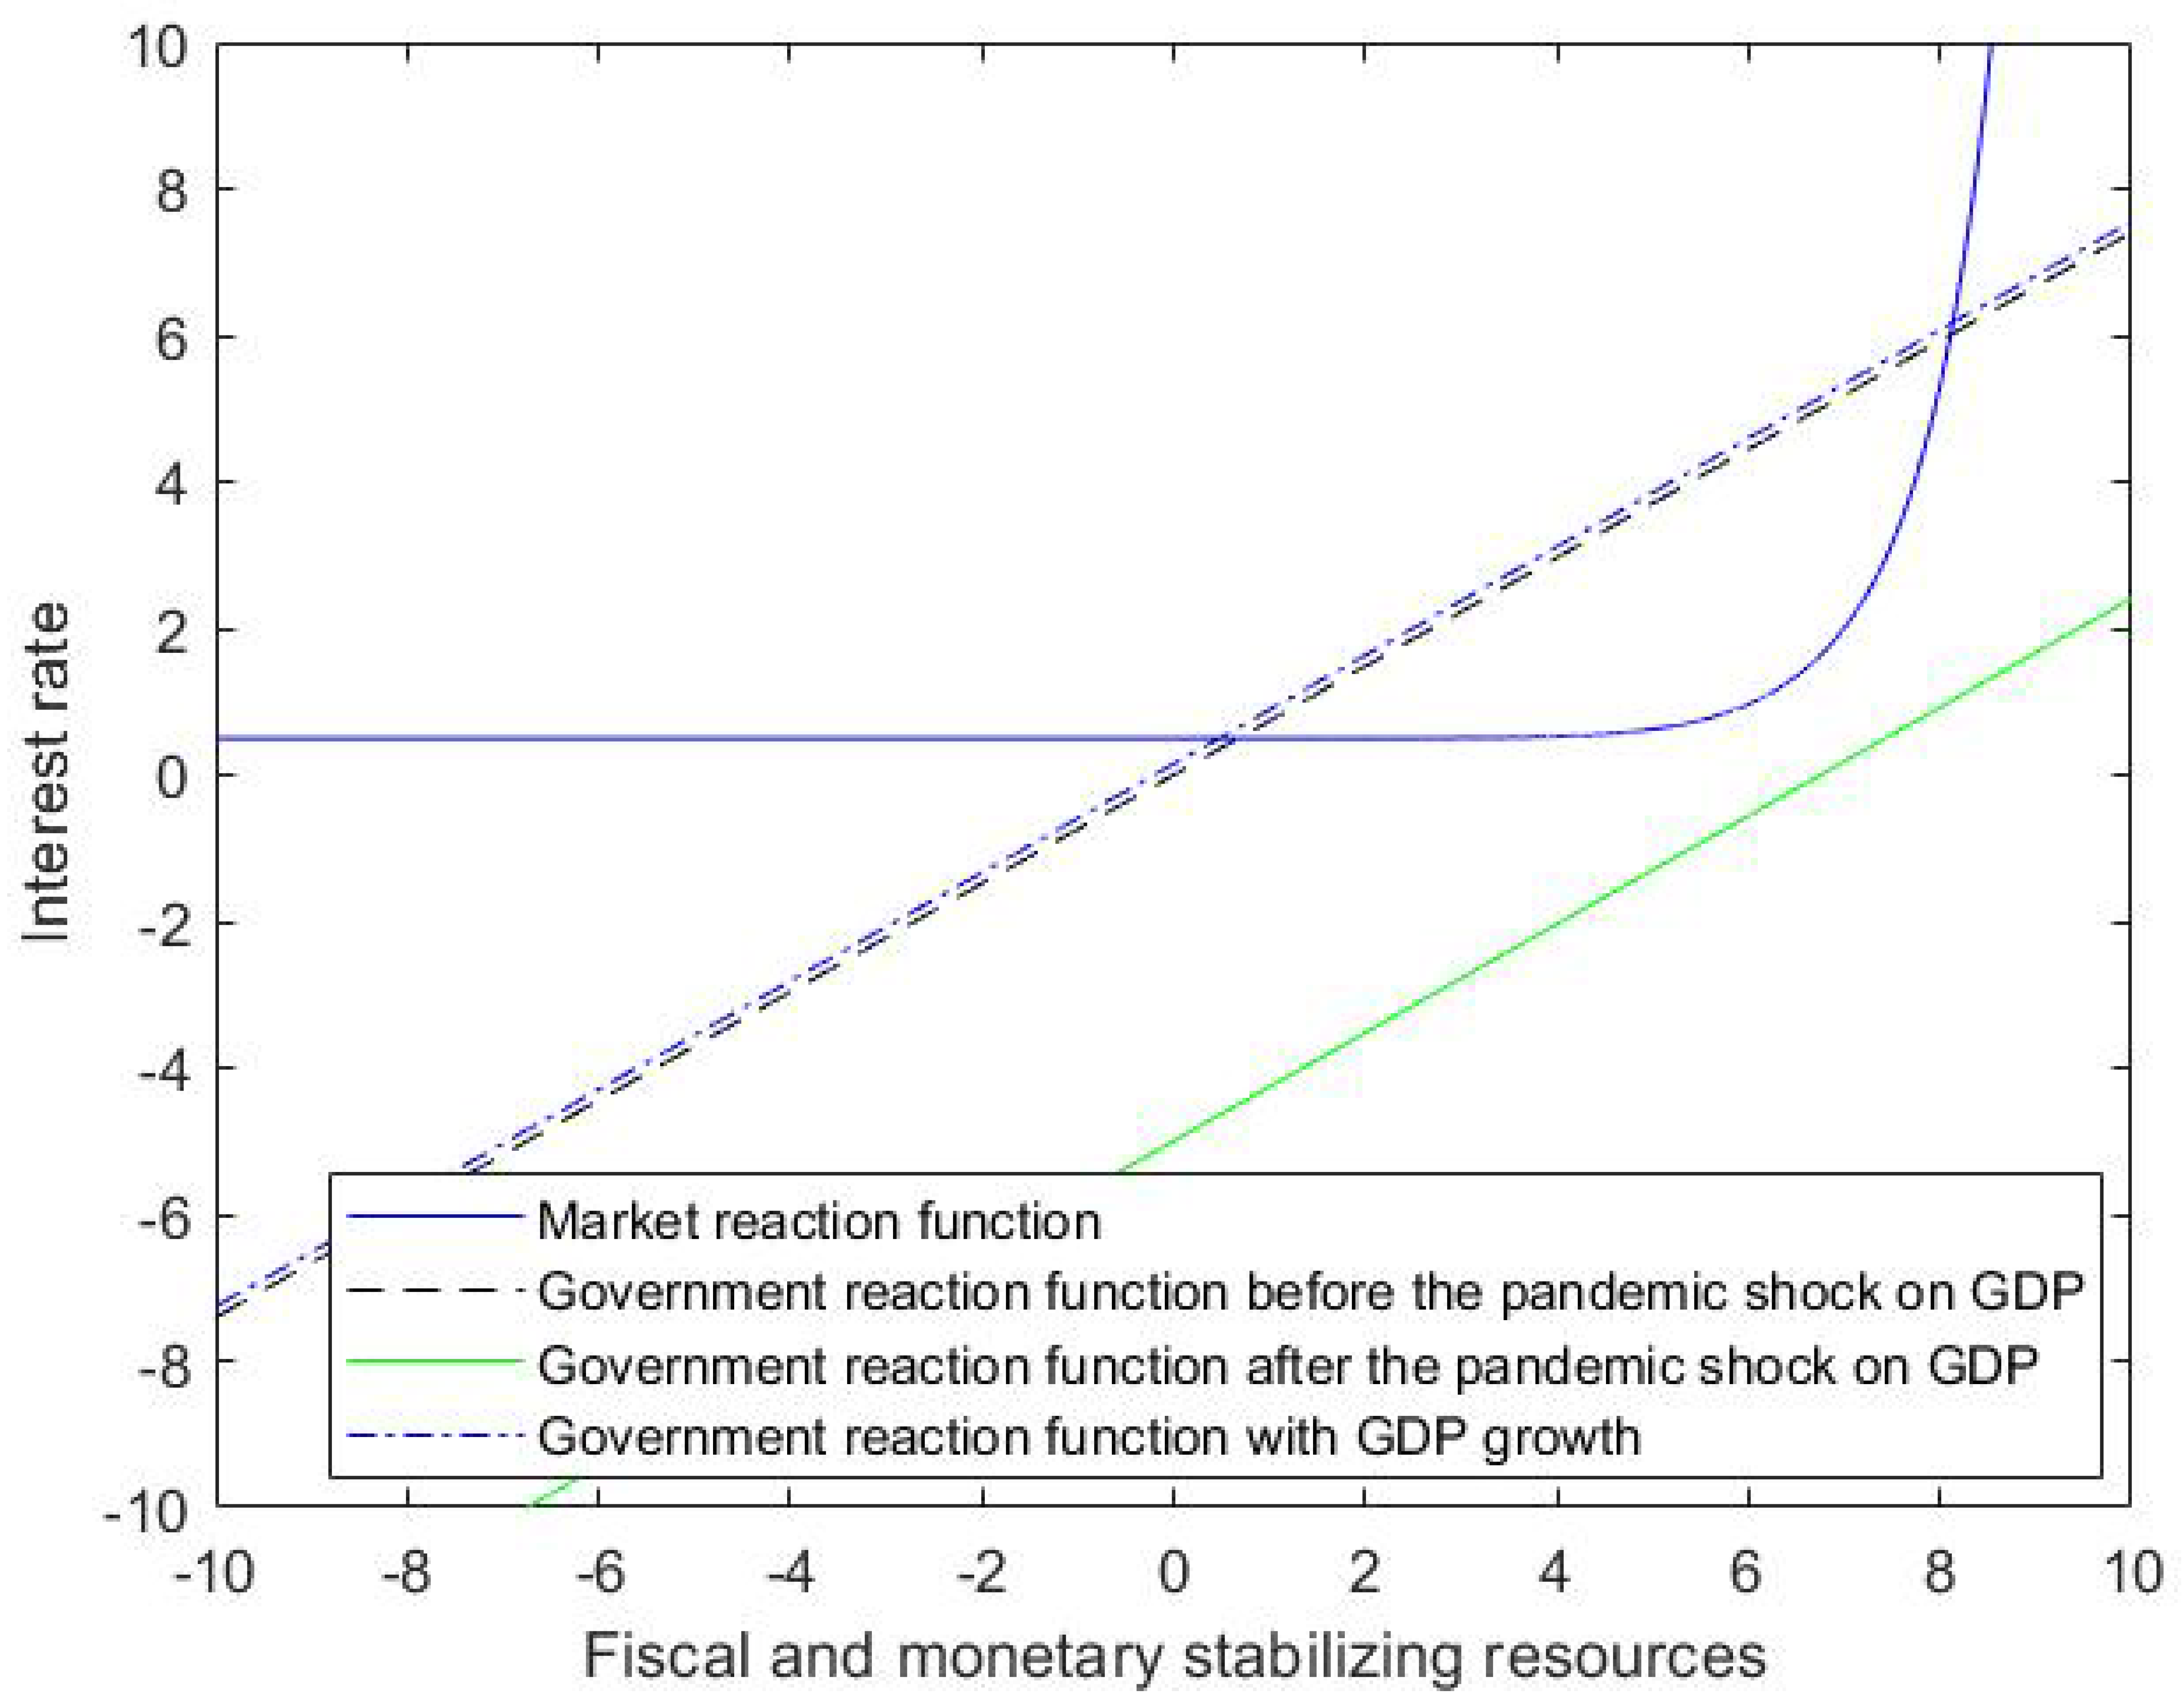
This is the case in which public debt stability is regained thanks to a robust GDP recovery, implying that the support of PEPP or NGEU is not necessary anymore and the shock is now absorbed by the economic recovery (see Figure 8). (As for a study focused on the role of public investment, see also Della Posta et al. [57]).
Favoring GDP growth would be precisely the objective of the temporary monetary and fiscal support respectively of both PEPP and NGEU.
5. Discussion
We now present a brief, but exhaustive, discussion of the meaning of our results regarding the numerical simulations for all eight scenarios we have considered.
The pre-pandemic situation shows the amount of overall stabilizing resources required to guarantee public debt stability and the corresponding interest rate (see Figure 1). The interaction between the market reaction function (continuous line) and the government reaction function (dotted line) shows that the interest rate only incorporates a growing risk premium when the required stabilizing measures exceed approximately the value of 6%.
The pandemic shock makes public debt unsustainable (in fact the straight continuous line in Figure 2 never intersects the private sector’s reaction function). The policy responses by the EU institutions have been important to make more sustainable public debts: this is particularly true for a highly-indebted country like Italy. In fact, a first important decision adopted by the EU policymakers was the suspension of the Stability and Growth Pact rules, that in our setting corresponds to re-establishing and even enlarging the area of stability (see Figure 3).
Unfortunately, the first reaction of monetary policy worked against sustainability: the Lagarde’s statement (12 March 2020) on a strict interpretation of the ECB mandate (“we are not here to close the spreads”) reduced significantly the area of public debt stability (by causing a dramatic contraction of private sector’s reaction function in Figure 4). Still regarding monetary policy, an opposite outcome came from the important decision (just six days later, 18 March 2020) by the ECB to adopt the “Pandemic Emergency Purchase Program” (PEPP), whereby the ECB decided new purchases of sovereign bonds and so was allowed to buy–de facto–the whole increase of national public debt. The PEPP was extended twice (on 4 June and 10 December 2020) and it is important to stress that “reinvestment” is foreseen until almost the end of This decision reduced the risk premium demanded by the market (see the steeper dotted line in Figure 5) and caused an enlargement of the public debt stability region. This outcome would have been alternatively (but similarly) obtained through a direct monetization of sovereign debt and, considering the “reinvestment” for a quite long period, it can be defined as “quasi-monetization” (see Figure 6).
On the fiscal side, the Next Generation EU—approved by the EU Council on 21 July 2020—can be interpreted, from the point of view of debt sustainability, in a similar way (Figure 7).
Finally, a future normal situation will be possibly achieved when public debt stability will be regained thanks to a robust GDP recovery (as shown in Figure 8), that is the medium term goal of both monetary (PEPP) and, especially, fiscal (NGEU) policy measures. Obviously, new negative shocks (like the Russian invasion in Ukraine and its consequences) create new difficulties to Italian public debt sustainability, including a worrysome increase of energy prices that could take us back to the stagflation days of the 1970s.
To conclude, we repeat that we have simulated our model with reference to the actual values of the parameters resulting from the Italian case, so the outcomes are of course also affected by the policies adopted at EMU and EU level (including PEPP, NGEU, Lagarde shocks and so on). A key result of our study is that robust GDP growth could be a reliable substitute for the policies followed at the EMU and EU level: these policies have been criticized by some scholars for the risks they create in leading, on the one hand, to high inflation and, on the other, to excessively high and unsustainable public debt, but our conclusion is that they remain the only ones capable of creating the conditions for GDP growth to occur.
6. Conclusions
The pandemic that struck the world in 2020 had an immediate and severe impact on the economic system, causing an unprecedented fall in GDP and a big rise in public deficits and debts. However, the policy reaction in most world countries has been swift and large. Even in the Eurozone, unlike the policy response that followed in 2008–12, it was rapid and substantial.
In this paper, we propose an analytical model suitable for interpreting the effects of the COVID-19 pandemic on the sustainability of public debt and the policy responses that were given to reduce its negative consequences. Following Tamborini and Della Posta et al. [6,11], the model focuses on the dynamics of the public debt-to-GDP ratio and on the interaction between the government’s reaction function and that of the private sector. Using this theoretical model, we performed some numerical simulations referring to the Italian case (see Figure 1, Figure 2, Figure 3, Figure 4, Figure 5, Figure 6, Figure 7 and Figure 8), which is particularly interesting because its debt/GDP ratio was already high before the shock (135% to GDP) and increased significantly to 155% of GDP.
Of course, the results depend on the specific numeral values assumed for the relevant macro-variables, that in any case coincide with the actual figures derived from the macroeconomic statistics and official documents. The simulations refer to a particular country, Italy, that is interesting for the mentioned reasons. However, a possible extension of this paper is to apply the same theoretical and analytical model to alternative countries, for example comparing the outcomes in other high-debt countries (Greece, Portugal or similar) and in low-debt ones (like Germany). This is a possible indication for future research.
As a general conclusion, we can say that even large economic shocks can be faced by using suitable economic policies; this holds also with reference to the impact on public debt sustainability. As for the monetary policy, if institutional or political constraints exclude some policy tools—such as straight monetization of public debts—also indirect measures, such as the PEPP with a long “reinvestment”, can temporarily lead to similar results; in any case, our simulations also confirm the importance of appropriate announcements, to avoid undesirable outcomes (as in the case of Lagarde’s statement). (We also recall the recent (constructive) ECB decision taken in 22 July 2021, concerning the new quantitative definition of “price stability”, moving from “below but close to 2%” to “at an average value of 2% in the medium run and symmetrical”. This clearly suggests that the expansionary policy will continue also in case of an inflation rate moderately higher than 2%). To conclude, it should be highlighted that fiscal policy should be used in a coordinated way, as accomplished with the NGEU plan, both to reinforce economic growth and improve public debt sustainability. As for future prospective policy changes and reforms, the completion of the Eurozone construction (including the creation of a significant centralized budget and a permanent European debt) is vital for improving the economic and social conditions in the EU and even for the euro survival itself. Many reforms were suggested by economists and policymakers soon after the euro’s sovereign debt crisis (a review of the key reforms is included in Marelli and Signorelli [8]). The feasibility of such reforms can be assessed after the completion of important actions, such as the “Conference on the future of Europe”, launched by the European Commission in March In the meanwhile, also “short-term” European decisions are crucial, for example the likely reform of the fiscal rules (Stability and Growth Pact), suspended until (at least) the end of 2022.) This would also avoid the continuation (or even acceleration) of the European economic and political decline in the global context.
As far as Italy is concerned, as suggested by the key result of our paper, public debt sustainability will depend mainly, for some years in the next future, on a prolonged ECB “quasi-monetization” of the Italian public debt (well after 2024, i.e., the current expected end of the PEPP reinvestments) combined with an adequate reform of the Stability and Growth Pact, in order to preserve the fiscal space for public investment expenditures and support economic growth. Also in the medium/long run the reduction of public debt over GDP should be achieved primarily through an increase of economic growth, that should be significantly augmented (compared to that achieved in the first two decades of this century); to this end, the ability to s use efficiently the NGEU resources for investments, accompanied by the necessary complementary reforms, will be crucial.
Further research could investigate: (i) the degree to which the PEPP is effective relative to the NGEU in stabilizing public debt, for example by bringing in the role played by inflation, which is ignored in this model; (ii) the conditions that must be met to produce the desired level of stabilizing GDP growth (for example by investigating what type of investment would produce the greatest fiscal multipliers); (iii) the optimal combination of fiscal and monetary policies in order to stabilize public debt while minimizing the inflation rate.
The main limitation of our study, especially in light of current events, is the role played by cost-driven inflation accompanied by the risk of a stagnant GDP (this paper was initially prepared in 2021 when inflation was rising but has not reached the peak of early 2022; the war in Ukraine (broken out at the end of February 2022), with the negative consequences, for a country like Italy, on the crucial supplies of energy, further exacerbated the risk of a new recession or at least of slashing down the recovery (GDP growth, after the 6% rise in 2021, was previously expected to be 4.7% in 2022, it is now around 3% in the best scenario), something that closely resembles the conditions that led to stagflation in the 1970s.
Author Contributions
Conceptualization, P.D.P., E.M. and M.S.; methodology, P.D.P.; software, P.D.P.; validation, P.D.P.; formal analysis, P.D.P.; investigation, P.D.P., E.M. and M.S.; resources, P.D.P., E.M. and M.S.; data curation, E.M. and M.S.; writing—original draft preparation, E.M. and M.S.; writing—review and editing, P.D.P., E.M. and M.S.; visualization, P.D.P., E.M. and M.S.; supervision, P.D.P., E.M. and M.S.; project administration, E.M. and M.S. All authors have read and agreed to the published version of the manuscript.
Funding
This research received no external funding.
Institutional Review Board Statement
Not applicable.
Informed Consent Statement
Not applicable.
Data Availability Statement
Not applicable.
Conflicts of Interest
The authors declare no conflict of interest.
References
- Domar, E.D. The “Burden of the debt” and the national income. Am. Econ. Rev. 1944, 34, 798–827. [Google Scholar]
- Pasinetti, L. The social burden of high interest rates. In Capital Controversy, Post-Keynesian Economics and the History of Economics: Essays in Honour of Geoff Harcourt; Arestis, P., Palma, G., Sawyer, M., Eds.; Routledge: London, UK, 1997; Volume 1. [Google Scholar]
- Collignon, S. Fiscal policy rules and the sustainability of public debt in Europe. Int. Econ. Rev. 2012, 53, 539–567. [Google Scholar] [CrossRef]
- Blanchard, O. Public debt and low interest rates. Am. Econ. Rev. 2019, 109, 1197–1229. [Google Scholar] [CrossRef] [Green Version]
- Blanchard, O.; Gopinath, G.; Rogoff, K. Discussion on public debt and fiscal policy. IMF Econ. Rev. 2021, 69, 258–274. [Google Scholar] [CrossRef]
- Tamborini, R. Heterogeneous market beliefs, fundamentals and the sovereign debt crisis in the Eurozone. Economica 2015, 82, 1153–1176. [Google Scholar] [CrossRef]
- Della Posta, P. Fiscal austerity and monetary easing: Which one is to be praised for ending the euro area crisis? Eur. J. Comp. Econ. 2018, 15, 165–189. [Google Scholar] [CrossRef]
- Marelli, E.; Signorelli, M. Europe and the Euro. Integration, Crisis and Policies; Palgrave: London, UK; Springer: New York, NY, USA, 2017. [Google Scholar]
- Bohn, H. The Sustainability of Budget Deficits in a Stochastic Economy. J. Money Crédit. Bank. 1995, 27, 257–271. [Google Scholar] [CrossRef]
- Bohn, H. The sustainability of fiscal policy in the United States. In Sustainability of Public Debt; Neck, R., Sturm, J., Eds.; MIT Press: Cambridge, MA, USA, 2008. [Google Scholar]
- Della Posta, P.; Marelli, E.; Signorelli, M. A market-financed and growth-enhancing investment plan for the Euro area. Metroeconomica 2020, 71, 604–632. [Google Scholar] [CrossRef]
- Blyth, M. Austerity: The History of a Dangerous Idea; Oxford University Press: Oxford, UK, 2015. [Google Scholar]
- Holland, S. Beyond Austerity: Alternatives for a Democratic Europe; Spokesman: Nottingham, UK, 2016. [Google Scholar]
- Blanchard, O.J.; Leigh, D. Growth Forecast Errors and Fiscal Multipliers. Am. Econ. Rev. 2013, 103, 117–120. [Google Scholar] [CrossRef] [Green Version]
- IMF. World Economic Outlook: Coping with High Debt and Sluggish Growth; October; International Monetary Fund: Washington, DC, USA, 2012. [Google Scholar]
- Deleidi, M.; Mazzucato, M. Putting austerity to bed: Technical progress, aggregate demand and the supermultiplier. Rev. Political Econ. 2019, 31, 315–335. [Google Scholar] [CrossRef]
- Saccone, D.; Della Posta, P.; Marelli, E.; Signorelli, M. Public investment multipliers by functions of government: An empirical analysis for European countries. Struct. Change Econ. Dyn. 2022, 60, 531–545. [Google Scholar] [CrossRef]
- Auerbach, A.J.; Gorodnichenko, Y. Output spillovers from fiscal policy. Am. Econ. Rev. Pap. Proc. 2013, 103, 141–146. [Google Scholar] [CrossRef] [Green Version]
- Krugman, P. Self-defeating Austerity. The New Yok Times, The Opinion Pages, The Conscience of a Liberal, 7 July 2010. [Google Scholar]
- Boyer, R. The four fallacies of contemporary austerity policies: The lost Keynesian legacy. Camb. J. Econ. 2012, 36, 283–312. [Google Scholar]
- Konzelmann, S.J. The political economics of austerity. Camb. J. Econ. 2014, 38, 701–741. [Google Scholar] [CrossRef]
- Beker, V.; Moro, B. The European crisis. In World Economic Association Books Conference Series; World Economics Association: Bristol, UK, 2016. [Google Scholar]
- Acocella, N. Signalling imbalances in the EMU. In A Global Perspective on the European Economic Crisis; Dallago, B., Guri, G., McGowan, J., Eds.; Routledge: London, UK, 2016. [Google Scholar]
- Blanchard, O.; Pisani-Ferry, J. Monetisation: Do Not Panic. VoxEU.org. 10 April. Available online: https://voxeu.org/article/monetisation-do-not-panic (accessed on 22 March 2022).
- Giavazzi, F.; Tabellini, G. COVID perpetual bonds: Jointly guaranteed and supported by the ECB. CEPR Policy Portal. Available online: https://voxeu.org/article/covid-perpetual-eurobonds (accessed on 24 March 2021).
- Galí, J. The effects of a money-financed fiscal stimulus. J. Monet. Econ. 2020, 115, 1–19. [Google Scholar] [CrossRef] [Green Version]
- De Grauwe, P. The ECB must finance COVID-19 deficits. Proj. Synd. 2020. Available online: https://www.project-syndicate.org/commentary/ecb-needs-to-embrace-covid19-monetary-financing-by-paul-de-grauwe-2020-03 (accessed on 18 March 2020).
- Reinhart, R.; Carmen, M.; Trebesch, C. Sovereign debt relief and its aftermath. J. Eur. Econ. Assoc. 2016, 14, 215–251. [Google Scholar] [CrossRef] [Green Version]
- Forni, L.; Palomba, G.; Pereira, J.; Richmond, C. Sovereign Debt Restructuring and Growth; IMF Working Paper; International Monetary Fund: Washington, DC, USA, 2016. [Google Scholar]
- Hatchondo, J.C.; Martinez, L.; Padilla, C.S. Voluntary sovereign debt exchanges. J. Monet. Econ. 2014, 61, 32–50. [Google Scholar] [CrossRef] [Green Version]
- Krugman, P. Financing vs. Forgiving a debt overhang. J. Dev. Econ. 1988, 29, 253–268. [Google Scholar] [CrossRef] [Green Version]
- Ciccarelli, M.; Osbat, C. Low Inflation in the Euro Area: Causes and Consequences; ECB Occasional Paper No. 181; Elsevier: New York, NY, USA, 2017. [Google Scholar]
- Nordhaus, W.D. Quality changes in price indexes. J. Econ. Perspect. 1998, 12, 59–68. [Google Scholar] [CrossRef] [Green Version]
- Becchetti, L.; Scaramozzino, P. COVID-19 debt relief. Sci. E Pace 2021, 12, 2. [Google Scholar] [CrossRef]
- Watkins, J.P. The policy response to COVID-19: The implementation of modern monetary theory. J. Econ. Issues 2021, 55, 484–491. [Google Scholar] [CrossRef]
- Blanchard, O.J.; Summers, L.-H. Rethinking stabilization policy: Evolution or revolution? NBER Work. Pap. Ser. 2017, 24179. [Google Scholar]
- Krugman, P. Learn to stop worrying and love debt. The New York Times, 3 December 2020. [Google Scholar]
- Andreosso-O’Callaghan, B.; Moon, W.; Sohn, W. Economic Policy and the COVID-19 Crisis: The Macroeconomic Response in the US, Europe and East Asia; Routledge: London, UK, 2021. [Google Scholar]
- Baqaee, D.R.; Farhi, E. Supply and Demand in Disaggregated Keynesian Economies with an Application to the COVID-19 Crisis; NBER Working Paper No. 27152; National Bureau of Economic Research: Cambridge, MA, USA, 2020. [Google Scholar]
- Islam, A.M. Impact of COVID-19 pandemic on global output, employment and prices: An assessment. Transnatl. Corp. Rev. 2021, 13, 189–201. [Google Scholar] [CrossRef]
- Cardani, R.; Croitorov, O.; Giovannini, M.; Pfeiffer, P.; Ratto, M.; Vogel, L. The Euro Area’s Pandemic Recession: A DSGE Interpretation; European Commission: Ispra, Italy, 2021; p. JRC126311. [Google Scholar]
- Jordà, O.; Singh, S.R.; Taylor, A.M. Longer-Run Economic Consequences of Pandemics; NBER Working Paper 26934; MIT Press Direct: Cambridge, MA, USA, 2020. [Google Scholar]
- Haas, J.; Neely, C.J.; Emmons, W.R. Responses of international central banks to the COVID-19 crisis. Fed. Reserve Bank St. Louis Rev. 2020, 102, 339–384. [Google Scholar] [CrossRef]
- Briceño, H.R.; Perote, J. Determinants of the public debt in the Eurozone and its sustainability amid the COVID-19 pandemic. Sustainability 2020, 12, 6456. [Google Scholar] [CrossRef]
- Kristóf, T. Sovereign Default Forecasting in the Era of the COVID-19 Crisis. J. Risk Fin. Man. 2021, 14, 494. [Google Scholar] [CrossRef]
- Vernengo, M.; Nadar-Bhadurib, S. The Economic Consequences of COVID-19: The Great Shutdown and the Rethinking of Economic Policy. Int. J. Political Econ. 2020, 49, 265–277. [Google Scholar] [CrossRef]
- Ehnts, D.; Paetz, M. COVID-19 and its economic consequences for the Euro area. Eurasian Econ. Rev. 2021, 11, 227–249. [Google Scholar] [CrossRef]
- Butkus, M.; Cibulskiene, D.; Garsviene, L.; Seputiene, J. The heterogeneous public debt—Growth relationship: The role of the expenditure multiplier. Sustainability 2021, 13, 4602. [Google Scholar] [CrossRef]
- Conefrey, T.; McInerney, N.; O’Reilly, G.; Walsh, G. Easing the Pain? Estimating the economic impact of domestic and global policy responses to the COVID-19 Pandemic. Econ. Soc. Rev. 2021, 52, 161–191. [Google Scholar]
- Pfeiffer, P.; Werner, R.; Veld, J. The COVID19-Pandemic in the EU: Macroeconomic Transmission & Economic Policy Response; Discussion Paper 127; European Commission: Brussels, Belgium, 2020. [Google Scholar]
- Teresiené, D.; Keliuotyté-Staniuléniené, G.; Kanapickiené, R. Sustainable economic growth support through credit transmission channel and financial stability: In the context of the COVID-19 pandemic. Sustainability 2021, 13, 2692. [Google Scholar] [CrossRef]
- Hondroyiannis, G.; Papaoikonomou, D. The effect of Eurosystem asset purchase programs on euro area sovereign bond yields during the COVID-19 pandemic. In Working Paper, Bank of Greece; SUERF: Vienna, Austria, 2021. [Google Scholar]
- Guillamón, M.D.; Ríos, A.M.; Benito, B. An assessment of post-COVID-19 EU recovery funds and the distribution of them among member states. J. Risk Financ. Manag. 2021, 14, 549. [Google Scholar] [CrossRef]
- Arestis, P.; Sawyer, M. The Intertemporal Budget constraint and the Sustainability of Budget Deficits. In Current Issues in Fiscal Policy; Creel, J., Sawyer, M., Eds.; Palgrave Macmillan: Basingstoke, UK, 2008. [Google Scholar]
- Bankowski, K.; Ferdinandusse, M.; Hauptmeier, S.; Jaquinot, P.; Valenta, V. The Macroeconomic Impact of the Next Generation EU Instrument on the Euro Area; Occasional Paper No. 255; European Central Bank: Frankfurt, Germany, 2021. [Google Scholar]
- Hein, E.; Detzer, D. Post-Keynesian Alternative Policies to Curb Macroeconomic Imbalances in the Euro Area. Panoeconomicus 2015, 62, 217–223. [Google Scholar] [CrossRef]
- Della Posta, P.; Marelli, E.; Signorelli, M. An immediate solution for the euro area crisis: A grand European investment plan. In Yearning for Inclusive Growth and Development, Good Jobs and Sustainability; Paganetto, L., Ed.; Springer Nature: Cham, Switzerland, 2019. [Google Scholar]
Figure 1.
Government and market reaction function before the pandemic. Legend: in Figure 1, the black dotted line represents the government reaction function and the blue continuous line represents the market reaction function. Public debt stability is granted up to an interest rate value of 6%.
Figure 1.
Government and market reaction function before the pandemic. Legend: in Figure 1, the black dotted line represents the government reaction function and the blue continuous line represents the market reaction function. Public debt stability is granted up to an interest rate value of 6%.

Figure 2.
The effect of the pandemic shock, v, on the stability of public debt/GDP. Legend: in Figure 2 the green continuous line represents the government reaction function when a 5% pandemic shock hits the economy, thereby making public debt unsustainable. As for blue and black lines see Legend in Figure 1.

Figure 3.
Government and market reaction function before and after the pandemic—a negative shock, v, on GDP growth, with public debt allowed to grow. Legend: in Figure 3 the green continuous line represents the government reaction function when a 5% pandemic shock hits the economy, and the public debt is allowed to grow at a higher level. As for blue and black lines see Legend in Figure 1.

Figure 4.
The Lagarde shock. Legend: in Figure 4 the red continuous line represents the market reaction function resulting from the ‘Lagarde shock’, making the interest rate more reactive to given fiscal and monetary resources. As for blue and black lines see Legend in Figure 1. As for green line see Legend in Figure 3.

Figure 5.
Government and market reaction function with the PEPP. Legend: in Figure 5 the red dotted line represents the government reaction function when the 5% pandemic shock has hit the economy and a PEPP is introduced thereby reducing the share of debt which is subject to the higher risk premium charged by the market. As a result, an even larger area of public debt stability is gained, for levels of the interest rate lower than 10%. As for blue and black lines see Legend in Figure 1. As for green line see Legend in Figure 3.

Figure 6.
Government and market reaction function with debt monetization. Legend: Figure 6 shows that the situation preceding the pandemic shock can be regained by adopting a full monetization of the public debt (the continuous red line representing the monetization brings the government’s reaction function back to its original position). As for blue and black lines see Legend in Figure 1. As for green line see Legend in Figure 3.

Figure 7.
Government and market reaction function with Next Generation EU. Legend: Figure 7 shows that the situation preceding the pandemic shock can be also regained by thanks to a NGEU program that removes from the country the burden of the public debt caused by the pandemic shock (dotted blue line representing the size of the NGEU brings the government’s reaction function back to its original position). As for blue and black lines see Legend in Figure 1. As for green line see Legend in Figure 3.

Figure 8.
Government and market reaction function with GDP growth. Legend: Figure 8 shows that the situation preceding the pandemic shock can be regained not only by adopting a full monetization of the public debt (Figure 6) or by adopting a NGEU (Figure 7), but also thanks to a GDP growth (as represented by the dotted black line). As for blue and black lines see Legend in Figure 1. As for green line see Legend in Figure 3.


Table 1.
The parameters used for the Matlab simulations.
| Case | Pre-Pandemic | Pandemic Shock | Fiscal Rules Suspension | Lagarde’s Shock |
|---|---|---|---|---|
| Market’s reaction function | im = [(1 + icb)./(1 − y1)] − 1 | im1 = [(1 + icb)./1 − y2)] − 11 | ||
| Government’s reaction function | ig = (s./b) + g | ig1 = (s./b) + g − v | ig2 = ((dd + s)./b) + g − v | |
| S | (−10:0.001:10) | |||
| icb | 0.5 | |||
| y1 | Normcdf (s, 7, 1.4) | |||
| B | 1.35 | |||
| G | 0. | |||
| v | 5 | |||
| dd | 10 | |||
| y2 | Normcdf (s, 3, 1) | |||
| Case | PEPP | Debt monetization | NGEU | GDP growth |
| Government’s reaction function | ig3 = (s + g * b)/(b − dc) | ig4 = [(m + s)/b] + g | ig5 = [(s + x)/b] + g | ig6 = [(s)/b] + g′ |
| dc | 0.5 | |||
| m | 0.2 | |||
| x | 0.2 | |||
| g′ | 0.2 |
Publisher’s Note: MDPI stays neutral with regard to jurisdictional claims in published maps and institutional affiliations. |
© 2022 by the authors. Licensee MDPI, Basel, Switzerland. This article is an open access article distributed under the terms and conditions of the Creative Commons Attribution (CC BY) license (https://creativecommons.org/licenses/by/4.0/).
Share and Cite
MDPI and ACS Style
Della Posta, P.; Marelli, E.; Signorelli, M. COVID-19, Economic Policies and Public Debt Sustainability in Italy. Sustainability 2022, 14, 4691. https://doi.org/10.3390/su14084691
AMA Style
Della Posta P, Marelli E, Signorelli M. COVID-19, Economic Policies and Public Debt Sustainability in Italy. Sustainability. 2022; 14(8):4691. https://doi.org/10.3390/su14084691
Chicago/Turabian StyleDella Posta, Pompeo, Enrico Marelli, and Marcello Signorelli. 2022. "COVID-19, Economic Policies and Public Debt Sustainability in Italy" Sustainability 14, no. 8: 4691. https://doi.org/10.3390/su14084691
Note that from the first issue of 2016, this journal uses article numbers instead of page numbers. See further details here.