
How the COVID-19 Pandemic Impacts Green Inventions: Evidence from a Quasi-Natural Experiment in China

1
School of Statistics and Mathematics, Shandong University of Finance and Economics, Jinan 250014, China
2
College of Industry and Commerce, Shandong Management University, Jinan 250014, China
3
School of Economic and Management, Harbin Engineering University, Harbin 150009, China
*
Authors to whom correspondence should be addressed.
Sustainability 2022, 14(16), 10385; https://doi.org/10.3390/su141610385
Submission received: 12 July 2022
/
Revised: 17 August 2022
/
Accepted: 18 August 2022
/
Published: 20 August 2022
(This article belongs to the Special Issue Economic and Social Consequences of the COVID-19 Pandemic)
Abstract
:This paper investigates whether the COVID-19 (coronavirus disease 2019) pandemic affects the green inventions of firms, universities, and firm–university collaborations (FUCs) differently. Our identification used provincial-level monthly data from China. Results from the difference-in-differences (DID) model showed that the COVID-19 pandemic has prompted the output of three types of green invention patents. After the parallel-trend test, placebo test, and triple-difference estimation, our conclusion has good robustness. However, the COVID-19 pandemic also influences the role of other policies, such as the SO2-emissions-trading pilot policy for universities’ green inventions. There has been a slight change in the effect of dual carbon targets on green inventions since the start of the pandemic. The positive effect of the COVID-19 pandemic has been weaker for provinces where the pandemic has been more severe than in other provinces. The results of this study are compared with the results and empirical evidence of other related studies and the theoretical logic of COVID-19 crisis-promoted green inventions are discussed.
1. Introduction
Humans are facing severe climate and environmental problems. We have to change the energy use structure and realize sustainable production and lifestyle. Solving these problems requires continued progress in green technology [1]. Countries worldwide are in the process of achieving this goal [2]. However, since December 2019, the COVID-19 pandemic has disrupted various development plans [3]. Therefore, the core question of this study was whether the COVID-19 pandemic has affected the progress of green technologies.
There are two opposing views on the impact of the COVID-19 pandemic on technological innovation [4]. One is that the COVID-19 pandemic is promoting technological innovation, and another is that the COVID-19 pandemic is suppressing it. On the one hand, one of the main pieces of evidence for the facilitation theory is the Global Innovation Index Report published in September 2021 [5]. This report shows that many parts of the world have scaled up their investments in innovation during the COVID-19 pandemic. Moreover, global scientific and technological innovation efficiency has been significantly higher than the average level over the past ten years [5]. Some studies suggest that the superposition of the pandemic, economic downturn, and prevalence of trade protectionism contains opportunities for technological innovation [6]. These opportunities provide innovation demand for global technological development. On the other hand, the inhibition theory’s primary basis comes from micro-level research. The pandemic has hit many companies hard [7], and entrepreneurs generate evident anxiety [8].
There is still not much quantitative research on the impact of the COVID-19 pandemic on green technological innovation. However, both positive and negative effects exist in these studies. On the one hand, some studies argue that the COVID-19 pandemic is expected to boost green technology. For example, technology such as waste disinfection in the health system [9] and in food supply chains [10] is expected to improve significantly. Throughout the pandemic, investment in smart-city projects in China has reduced the virus’s infection rate and promoted urban sustainable technologies [11]. Additionally, the COVID-19 pandemic is an important vector in people’s behavioral change, reflecting environmental sustainability and social responsibility [12].
On the other hand, some studies support the view that the COVID-19 pandemic negatively affects green technological innovation. An investigation of 526 manufacturing firms in Norway revealed that overall, the conduction of environmental innovation decreased during the pandemic [13]. Other research found that the COVID-19 pandemic has severely disrupted plastic-reduction policies at the regional and national levels and induced significant changes in plastic-waste management.
In a philosophical discussion, Dempster says, “Causal analyses are guides to higher understanding” [14]. In the relationship between the COVID-19 pandemic and green innovation, the pandemic is usually used as an exogenous cause. However, we still lack empirical evidence that the causality exists and, if so, whether that causality from the COVID-19 crisis to green inventions is positive or negative. We note that some previous research was aimed at theory and methods of responding to the pandemic. However, these studies have somewhat ignored the rigorous empirical testing for their premise position, which may lead to delayed or advanced policy recommendations due to misjudgment of the situation. Therefore, our study aimed to complement other studies using new data and methods and a new perspective. The specific goals and supposed contributions of this study were as follows:
First, this study tested the impact of the COVID-19 pandemic on monthly green-invention-patent-applications data of firms and universities, and their cooperation at the regional level. Patent statistics are a common indicator of innovation [15,16]. China’s patent system started later than those of developed countries, but in just a few decades, the number of patents has jumped to the forefront of the world, so the growth pattern of Chinese patents is different from that other countries [17]. On the one hand, this different growth model means that previous patent-innovation-research results based on other countries’ experiences have applicability problems, and on the other hand, it also creates new material for technological-innovation research based on patent data [18].
Second, this study conducted a DID model to estimate the COVID-19 pandemic’s effect. We took December 2019, when the pandemic started, as the event point. The data 12 months before and 24 months after the event point constituted the treatment group. The data 12 months before and 24 months after December 2017 constituted the control group. Moreover, the main drivers of technological innovation included demand-pull [19], supply-push [20], and environmental regulation incentives [21]. The model of this study included indicators of these three factors. Therefore, in a theoretical sense, this model combined perspectives from economic theory, environmental theory, public management theory, and technological innovation theory.
Third, this study examined the impact of the pandemic on effects of other environmental regulatory policies and scenario factor, including two emissions-trading pilot policies and China’s dual carbon targets (carbon-peaking and carbon-neutrality goals). Moreover, we identified the heterogeneous impact of the COVID-19 pandemic on the output of green invention patents in different regions and organizations.
The remainder of this paper is organized as follows: Section 2 is a literature review. The data, estimation specifications, and variables are described in Section 3 and the results of empirical models are presented in Section 4. Section 5 is a discussion to explore the significance of the results. Section 6 gives the conclusions and prospects.
2. Literature Review
2.1. Green Inventions
In a narrow sense, inventions can be explained as a new or improved idea, product, or process [22] or, in a broad sense the production of knowledge [23]. The number of previous studies on technological inventions is large. However, in academic research, the green invention is still a new notion. There are some similar but different concepts such as green creativity [24], environmental patents [25], and green technological design [26]. Combined with studies on inventions, technological innovation, and environmental technologies, this study found that inventions can be a “bridge” between green technologies and green innovation.
First, green inventions are an important source of green innovation. Green innovation is a technological innovation process aimed at sustainable development. It is similar to the concept of eco-innovation [27] and environmental sound innovation [28]. The innovation process is a high-risk activity [29]. Therefore, previous studies suggest that innovators should enhance their innovation capabilities through the accumulation of technological inventions [30].
Second, the direct source of the green invention is R&D activities at the base of previous green technologies [31]. The three types driving forces of R&D activities on green inventions can be summarized as follows: the institution factors, the demand-pull, and the technology-push [32]. Porter and Van der Linde [21] put forward the Porter hypothesis, i.e., institutional factors such as environmental regulation can influence the effects of R&D activities on green inventions through reducing innovation offsets. The main institutional factors include abatement pressure [25], pressure of environmental regulation [33], and government’s green grip [34]. The technology-push view’s factors include self-development of the innovation system [20] and knowledge transfer/diffusion [35]. The demand-pull view’s factors include industry concentration [25], consumer environmental awareness [36], and pressure of the environmentalism of investors and clients [33].
2.2. Impact of the COVID-19 Pandemic on Green Inventions
About two years ago, Hanna, Xu and Victor [4] judged that there were different views on how the COVID-19 pandemic stimulates respect for science and global engagement on climate change. This contradictory view is still prevalent in current research. For example, optimists believe that the COVID-19 pandemic has awakened green investment to protect prosperity [37], however, conservatives believe that COVID-19 has severely set back the original green-technology trend because economies rarely bounce right back to their pre-shock state [38].
We screened studies that could match the query formula “COVID-19 + (green, environment + sustainability + pollution) + (invention + patent + innovation + new product + R&D)”. Ten studies that quantified the relationship between the COVID-19 pandemic and related variables were filtered out to compare with our study. Appendix A Table A1 lists these studies’ basic results. From the perspective of the individual, Xia, et al. [39], Ruiu, et al. [40], and Mouratidis and Peters [41] tested the impacts of the COVID-19 pandemic on new-product-purchase intentions, eco-friendly lifestyle, and frequency of teleactivities and general online activities. The conclusions of this research implied a positive effect of the COVID-19 pandemic on individuals’ green technology acceptance. From the perspective of the firm, Zhang and Fang [42], Hermundsdottir, Haneberg and Aspelund [13], Al-Omoush, et al. [43], Xiao and Su [44], and Pilloni, et al. [45] tested the impacts of the COVID-19 pandemic on firms’ performance change, adoption of environmental innovations, and R&D expenditure. The conclusions were contradictory, and seemed to be different from different data sources. When the data sources were surveyed by authors, the results tended to be negative. When the data source was public data, the results tended to be positive or non-significant, given the small sample size of the data investigated by authors and possible presupposition issues. We tend to believe that subjective factors may influence studies based on author surveys. In addition, from the perspective of the region, the conclusions of Norouzi, et al. [46] and Zhao, et al. [47] implied a reduced effect on pollution by the COVID-19 pandemic.
3. Materials and Methods
3.1. Data
3.1.1. Green Invention Patent Applications
There are three types of patents in China: invention, utility, and design. The term “invention” refers to any new technical solution relating to a product, a process, or an improvement thereof; the term “utility” refers to any new technical solution relating to a product’s shape, structure, or a combination thereof, which is fit for practical use; “design” means a new design of the shape, pattern, or a combination thereof, as well as a combination of the color, shape and pattern, of the entirety or a portion of a product, which creates an aesthetic feeling and is fit for industrial application [48]. This study selected the number of green invention patent applications as the indicator for green inventions. The reason for choosing the invention patent was that compared with the other two types of patents, the invention patent has higher requirements for novelty and creativity and is more in-line with the definition of technological innovation [49]. The reason for choosing the number of applications is that it has better timeliness and stability than the number of authorized patents. The data source of the invention patent applications was the Patsnap database (https://www.patsnap.com/, accessed on 31 May 2022). Green technologies also can be explained as environmentally sound technologies which means technologies that have the potential for significantly improved environmental performance relative to other technologies [50]. We screened the green patents using the International Green Patent Inventory published by the World Intellectual Property Organization. Patent data generally has the problem of duplicate data from the same application with different publication numbers. This study deleted duplication data according to the same application documents and counted them according to the oldest application date. The data was monthly from January 2016 to January 2021. Data from 2016–2018 was set as the control group, and data from 2019–2021 was set as the treatment group. Each group contained data from 36 periods and 27 provinces. Data collection took place in May 2022; therefore, the undisclosed problem of invention patents applied in 2021 can be ignored.
3.1.2. Provincial-Level Data in China
Provincial-level data mainly came from the annual and quarterly provincial data on the National Bureau of Statistics of China website. Due to the problem of missing data, data from Tibet, Qinghai, Hainan, Hong Kong, Taiwan, and Macau were not included. The time interval of the regional-level data was 2015–2020, which meant there was a one-year lag between the independent and dependent variables.
3.2. Estimation Strategy
In economics, a quasi-natural experiment is not quite an experiment [51]. A quasi-natural experiment occurs when some exogenous event changes the environment in which individuals, firms, or regions operate [52]. The outbreak of the COVID-19 pandemic was an exogenous random event. Before and after the pandemic, the green technological innovation environment in which regions operate has been heterogeneous. Therefore, the impact of the COVID-19 pandemic on green innovation can be studied as a quasi-natural experiment. The DID method was used to evaluate the impact because this method can not only make use of the exogeneity of the explanatory variables but also control the influence of unobtrusively individual heterogeneity on the explanatory variables [53].
The premise of our research was that green technological innovation has changed significantly during the COVID-19 pandemic compared with the control group. This research examined the level of green technological innovation from the monthly number of green invention patent applications from three dimensions: firms, universities, and firm–university collaborations. Based on the identification strategy of DID, the baseline regression model of this study was as Equation (1):
In Equation (1):
The subscript i and t represent individual and time, respectively.
The independent variables firm, univer, and firmuniver represent monthly new green invention patent applications of firms, universities, and their cooperation. For t, taking December 2016 and December 2019 as the event points, respectively, with −12, −11, …, −1, indicating the 12th, 11th, …, first months before the event point, 1, 2, …, 24 represent the 1st, 2nd, …, 24th after the event point.
The dependent variables treat and after are dummy variables. When the year is between 2019 and 2021, treat takes 1, otherwise it takes 0. When t > 0, after takes 1, otherwise it takes 0.
Control is a vector that contains a set of control variables. According to the theoretical analysis in Section 2.1, the main influencing factors are controlled from three dimensions, including supply-driven factors (total number of firms (TNF), total number of universities (TNU), government spending on science and technology (GS&T), number of research and development persons (R&D person)), demand-pull factors (gross domestic product (GDP), population, and urban area), and environmental regulatory factors (NOx emissions (airplu) and industrial water consumption (induswater)).
Individual fixed effects μi control the characteristics of each region that do not change with events, such as natural endowments and climatic conditions. The time-fixed effect γi controls time factors common to all regions, such as technological paradigm changes, macroeconomic cycles, and related policy changes.
4. Results
4.1. Main Results
4.1.1. Graphical Results
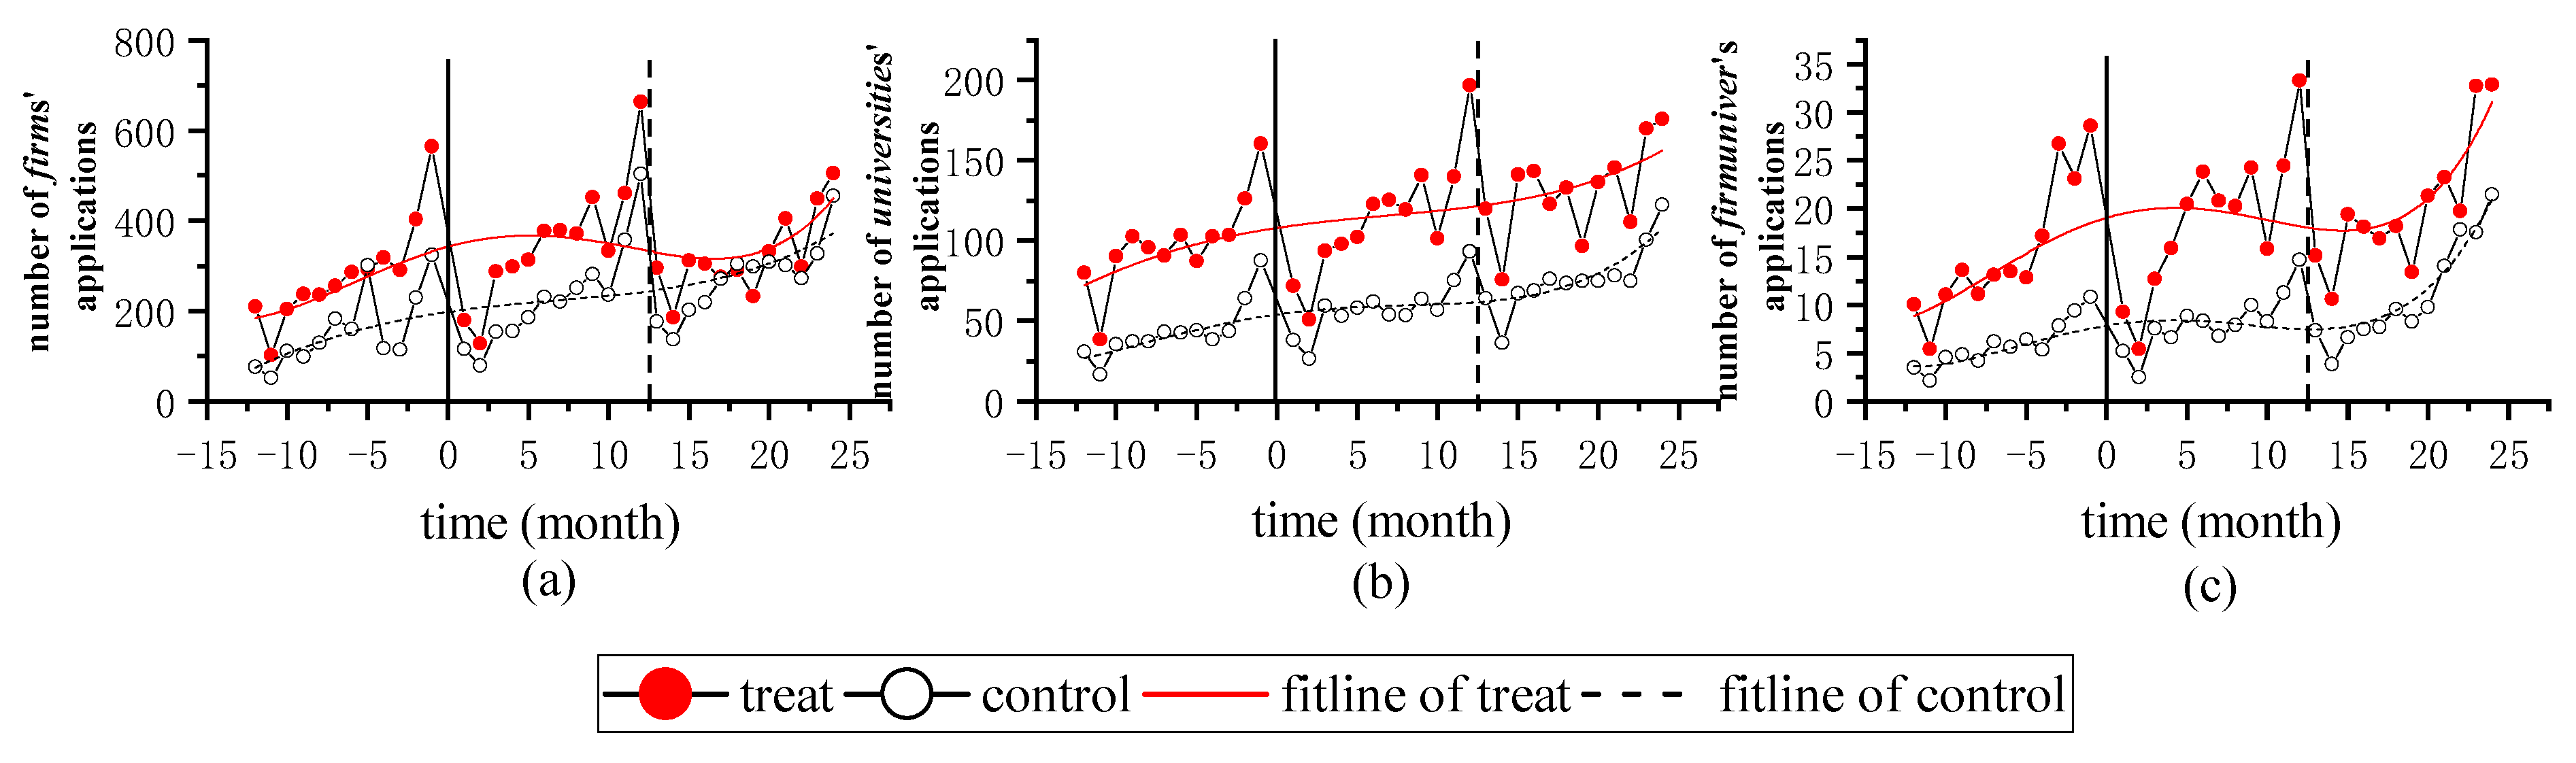
Figure 1 shows the time trend of the output of green invention patent applications for all provinces in the treatment and control groups. The trend in Figure 1 can provide information as to whether there is a difference in green inventions before and after the event point. The ordinates of Figure 1a–c represent the output of green invention patent applications for firms, universities, and firm–university collaborations, respectively. Therefore, the trend difference before and after the pandemic between the treatment and control groups can be visually displayed. From the dotted-line graph, it can be seen that the parallel trends in all three sub-figures are changed significantly after the event point (t = 0). From the trend-fitting line of Figure 1, the parallel trend of the two fitted lines is more obvious before the event point than after that. After the event point, the change of parallel trend in Figure 1a is more significant than the other two sub-figures. However, it can be seen that the parallel trend in all sub-figures changed significantly about 12 months after the event point. Overall, after the outbreak of the COVID-19 pandemic, the difference in green-invention-patent output between the treatment group and the control group shows a trend from increasing to decreasing. Compared with the university, the change of this difference is more obvious in the green invention patent application of firms and firm–university collaborations. Therefore it meaningful to further analyze the impact of the pandemic on green inventions and the difference of this impact on firms, universities, and firm–university collaborations.
4.1.2. Regression Results
The baseline model estimation results are presented in Table 2. The dependent variables in models (1), (3), and (5) are firm, university, and firmuniver, respectively. We included individual and time effects in these models. We further added other control variables in models (2), (4), and (6), in which the dependent variables were firm, university, and firmuniver, respectively. In all models, the coefficient of treat × after was significantly positive. This result shows that the COVID-19 pandemic has significantly promoted green invention. The coefficient values of treat × after in models (2), (4), and (6) showed a decreasing trend. This result is consistent with the decreasing scale of green invention patents of firms, universities, and their collaborations based on Table 1. It shows that the model has good economic significance.
4.2. Robustness Tests
4.2.1. Parallel-Trend Test
The validity of the DID model results requires several preconditions. One primary condition is whether there is a significant change in the difference between the treatment group and the control group before and after the event point. This study used the event-analysis method to explore the dynamic effects of the impact of the pandemic. Specifically, the after in Equation (1) is replaced with dummy variables of different periods. This study used dummy variables of different quarters before and after the event point. The model was constructed as Equation (2):
In Equation (2):
The subscript i and t represent individual and time, respectively.
The independent variables firm, univer, and firmuniver represent monthly new green invention patent applications of firms, universities, and their collaborations. For t, taking December 2016 and December 2019 as the event points, respectively, with −12, −11, …, −1, indicating the 12th, 11th, …, first months before the event point, 1, 2, …, 24 represent the 1st, 2nd, …, 24th after the event point.
The dependent variable treat is the dummy variable. When the year is between 2019–2021, treat takes 1, otherwise it takes 0. period0 is the fourth quarter of 2019 corresponding to the event point. If subscript s is a negative number (−4 < s < 0), it means the period corresponding to the s-th quarter before the pandemic outbreak, and a positive number (0 < s < 9) means the period corresponding to the s-th quarter after the outbreak.
Control is a vector that contains a set of control variables which are same as those in Equation (1).
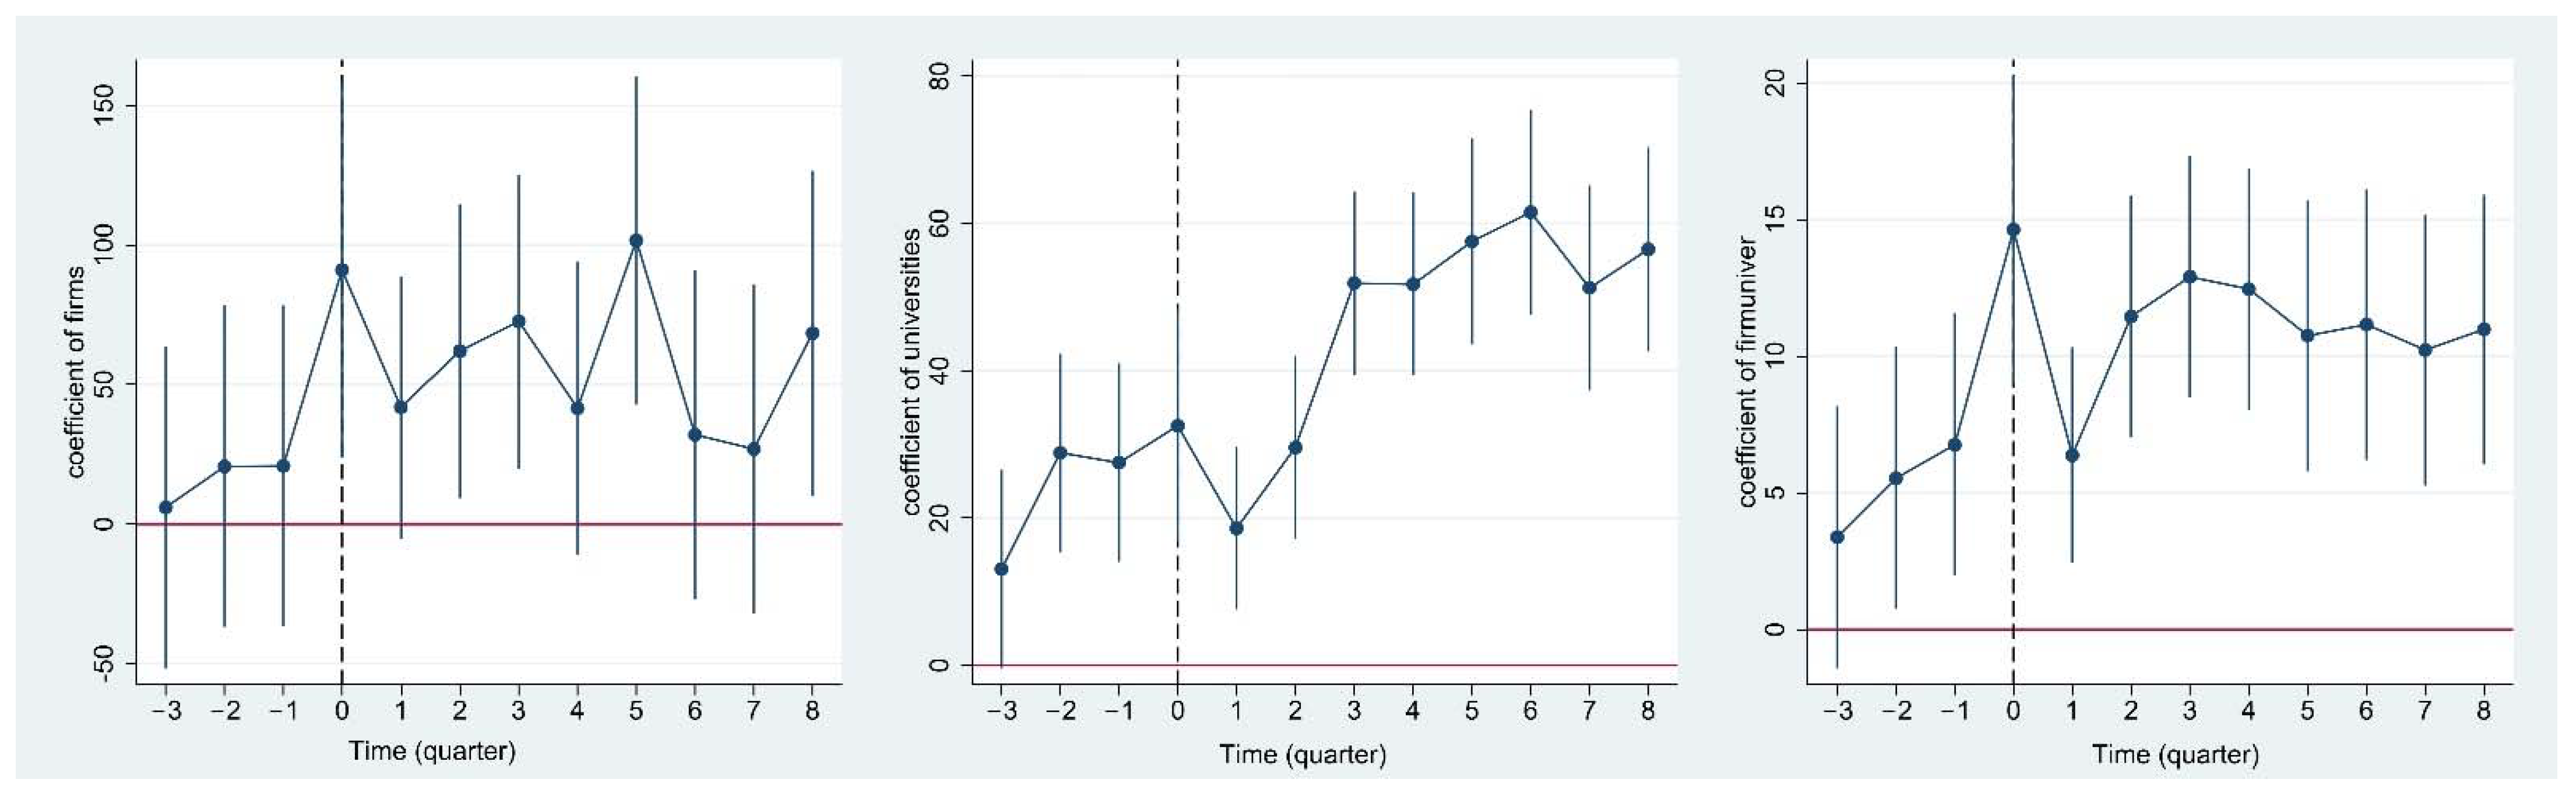
The results in Figure 2 show that the parallel trend hypothesis can be completely passed when firms’ green invention patents is the dependent variable. When the universities and firm–university collaboration’s green invention patents are dependent variables, the parallel trend is a little bit poor, but the coefficients have a significant difference before and after the pandemic outbreak, proving that the estimation satisfies the parallel trend assumption [55,56].
4.2.2. Placebo Tests
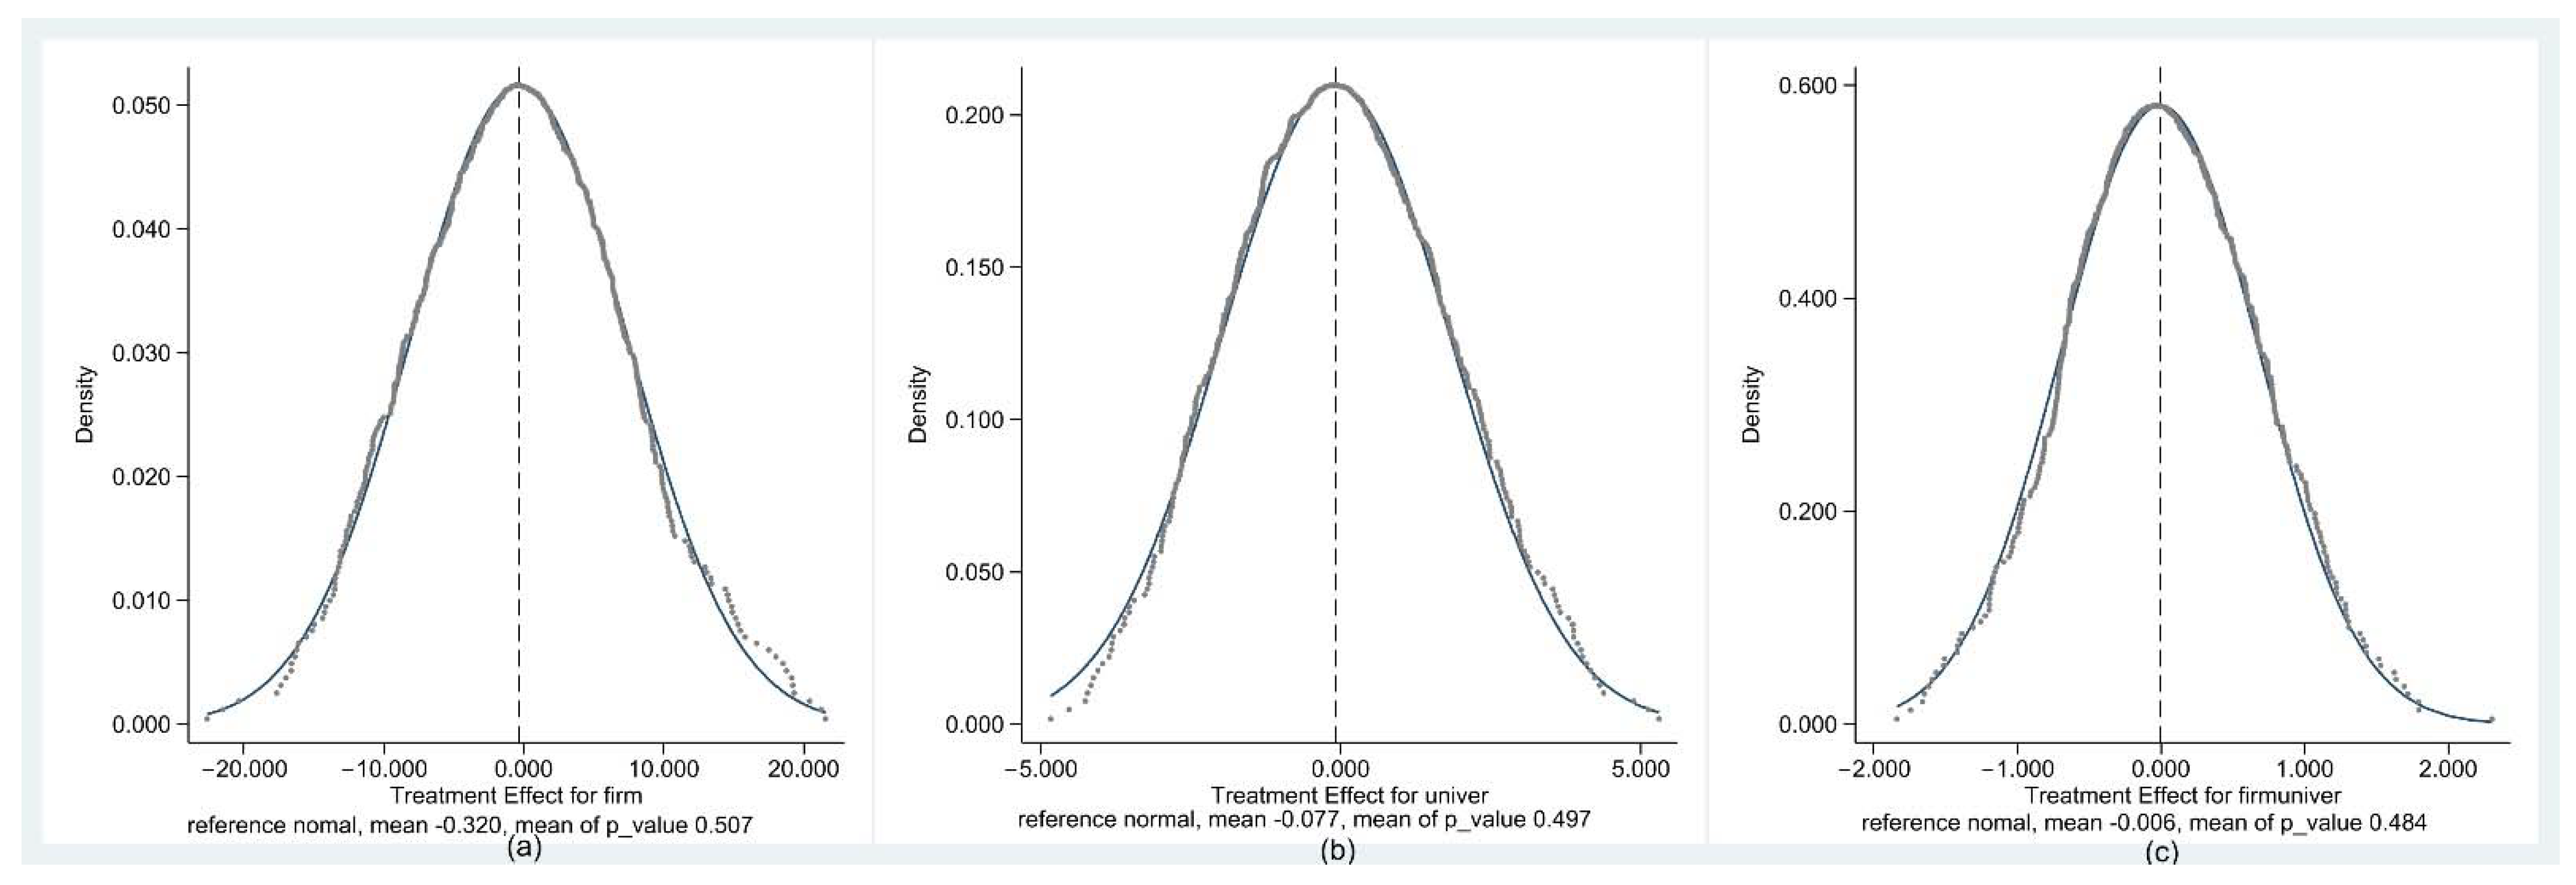
The promotion effect of the COVID-19 pandemic on green invention patents may be interfered with by other non-observed omitted variables. A placebo test is conducted to exclude this interference. The specific idea is to make the impact of the core independent variables on the dependent variables random and then repeat this process 500 times. Figure 3 shows the probability density distribution of the estimated coefficients. The dependent variables of the corresponding models in Figure 3a–c are the green invention patent output of firms, universities, and firm–university collaborations. The mean values of the randomly processed estimates in the three sub-graphs of Figure 3 are −0.320, −0.077, and −0.006, respectively. These values are very close to 0, and the mean p-values are insignificant. The estimated results of the baseline regression model in Table 2 are far outside the entire distribution. Therefore, the hypothesis that there is interference from other non-observed missing variables should be rejected. This result shows that the promotion of the COVID-19 pandemic on green technology innovation is real.
4.2.3. Triple-Difference Estimation
The green invention patents of different organizations may also be affected by other policies or scenario factors, which may bias the estimation results. This study used the triple-difference method to test the impact of other policies or factors. The triple-difference method requires that other policies selected were not affected by the pandemic. This study selected policies that may have had an impact from two perspectives. The first perspective was the policy factors before the outbreak of the COVID-19 pandemic. This study used two policies, the carbon- and SO2-emissions-trading pilot policies, which have been proven to significantly impact the green economy in previous research [57]. The second perspective was the scenario factors after the outbreak of the COVID-19 pandemic. This study used the dual carbon targets, which are the basis of the policy background, as the scenario factor [58]. The estimated model for triple-difference was as follows:
where DVl represents the l-th indicator of policy or factor, l = 1, 2, 3. When or where the l-th policy or factor has taken effect, DVl =1; otherwise, DVl = 0. Table 3 and Table 4 show the results of the triple-difference model with the pilot policy of emissions rights and the dual-carbon targets as the indicator, respectively.
In Table 3, the indicators of the policy in models (1)–(3) are dummy variables for the pilot policy of SO2-emissions-trading rights (SO2), and the indicators of the policy in models (4)–(6) are the pilot policies for carbon emissions-trading-rights dummy variable (CO2).
It can be seen from model (2) in Table 3 that the coefficient of treat × SO2 × after is significantly negative, while the coefficients of SO2 × after and SO2 × treat are both significantly positive. The positive coefficient of SO2 × after indicates that provinces that pilot the SO2-emissions-rights policy have a significantly higher green-invention-patent output after the event point than provinces not implementing the policy. The positive coefficient of SO2 × treat indicates that provinces that pilot the SO2-emissions-rights policy have a significantly higher green invention patent output after 2019 than provinces not implementing the policy. The negative coefficient of treat × SO2 × after indicates that the green invention patent output of universities in the pilot provinces of the sulfur-emissions-trading policy was significantly lower than the average output of other provinces after the COVID-19 pandemic outbreak. This result shows that the COVID-19 pandemic has weakened the implementation effect of the sulfur-emissions-trading policy.
Similarly, it can be seen from model (6) in Table 3 that the coefficient of treat × CO2 × after is significantly negative, while the coefficients of CO2 × after and CO2 × treat are both positive. This result shows that the outbreak of the COVID-19 pandemic has weakened the implementation effect of the carbon-emissions-trading policy.
In Table 4, the indicator carbon in models (1)–(3) is a dummy variable for the scenario factor dual carbon targets. When t > 8, carbon = 1. Otherwise, carbon = 0, as the dual carbon targets were public in September 2020. This dummy variable has complete collinearity with treat × carbon, carbon × after, and treat × after. Therefore, only the coefficient of treat × carbon × after is displayed. The result is no significant difference from the results in the baseline regression model. The dual carbon targets before 2021 did not have a significant impact on the influence of the COVID-19 pandemic.
4.3. Heterogenous Effect
Parallel-Trend Test
The triple-difference model has shown that the impact of the COVID-19 pandemic has a heterogeneous impact on the output of different types of green invention patents in different regions under different policy scenarios. This section further studies the heterogeneous impact of the severity of the pandemic on the output of green invention patents from the perspective of geographic latitude. The initial outbreak area in China was Hubei Province. Prevention and control measures were not in place when the pandemic first broke out. Therefore, the impact of the COVID-19 pandemic in Hubei Province and surrounding areas was originally different from other areas. Therefore, we divided the sample into two parts, one was the data from Hubei Province and its surrounding areas, and the other was the data of other regions. The regression models were estimated separately for these two parts of the data. Table 5 shows the estimated results. The coefficient value of treat × covid in non-Hubei surrounding areas was significantly higher than that in Hubei and surrounding areas, indicating that the pandemic’s severity significantly impacted the promotion effect on green invention patents.
5. Discussion
This study took the impact of the COVID-19 pandemic on green inventions as a quasi-natural experiment. A DID model was used to evaluate the causality from the pandemic on green inventions. The literature review in Section 2.2 shows that previous studies found that there are two contradictory views on the impact from the COVID-19 pandemic on green inventions: one view is optimistic and another view is conservative. The results of this study suggest that in terms of the number of green technology inventions, we can support the first view. However, this result is still disturbing, and readers may wonder if there is a contingency of this result, or they may still guess that other factors may have caused the increase in green inventions. Therefore, we will try to discuss this result by comparing it with other research results and the theoretical background.
First, the main theoretical contribution of this study is that we evaluated the impact of a new exogenous factor on green inventions. The results indicate that there was a significant difference of the green inventions before and after the outbreak of the COVID-19 pandemic. Many previous studies have paid attention on the uncertainty of the process of R&D and innovation. For example, Joseph Schumpeter, who constructed the earlier innovation theory, proposed that crisis, which is defined as the result of external things acting on the economic field and causing interference, can breed innovation and development [22]. The mechanism of exogenous factors such as a pandemic on green inventions can reference to the theory of emergency administration. There are several types of the emergencies in this theory [59]. Some of these, such as war or terrorism activities, have been proven to have impact on the development of green technologies [60]. In this study, we found that a public-health emergency can also influence green technologies that are evaluated by technological inventions.
Second, although the impact of the COVID-19 pandemic on green inventions of firms, universities, and firm–university collaborations is heterogeneous, this study found that, on average, there is a promotion effect. The results were robust after the parallel trend, placebo, and triple-difference tests. During this pandemic, Christopher Freeman’s theory on the relationship between crisis and innovation was again in the spotlight [61]. Studies based on this theory show that crisis can be both “opportunity” and “disaster” [62]. This study’s positive results do not mean we need not worry about the negative impact of the COVID-19 pandemic. However, the logic that green innovation is expected to grow during and post the COVID-19 pandemic is, as Stern and Valero [63] said: “the potential global impacts of the climate crisis are slower to materialize, but much graver than those from COVID-19”, “the economic disruption caused by the pandemic, and the largescale government interventions that have resulted from it, give rise to an opportunity for a green recovery.”
Third, the precise reasons for and mechanisms by which the pandemic can promote green inventions need more study. In this study, we find that the COVID-19 pandemic can influence the role of other policies, such as the SO2-emissions-trading-pilot policy for the universities’ green inventions. The results also showed that the dual-carbon goals have had a slight effect on the change in green inventions. These results may provide evidence for why and how the pandemic can promote green inventions. More studies are needed to make the mechanism clearer.
Therefore, using a new data source and a quasi-natural experiment method, this study effectively complements the existing empirical research on the impact of the COVID-19 pandemic on green inventions. At the same time, it also provides evidence for the theoretical logic of addressing the climate change crisis by responding to the destruction of the pandemic.
6. Conclusions
In this paper, based on Chinese green-invention-patent data of firms, universities, and firm–university collaborations in different provinces, we investigated whether the COVID-19 pandemic significantly has impacted green technological innovation. A DID model was used to estimate the impact. The study found that the COVID-19 pandemic has promoted the green invention patent output of firms, universities, and firm–university collaborations. The conclusion has good robustness after the parallel trend, placebo, and triple-difference tests. The results of the triple-difference model and the heterogeneous-effect analysis also showed that the COVID-19 pandemic has had a heterogeneous impact on green-invention patents under different policy scenarios and the severity of the pandemic. In summary, this study makes theoretical implications by evaluating the impact of a new exogenous factor on green inventions.
The results of this study also provide practice implications. First, the way to cope up with the pandemic should be different for different types of organizations. Firms’ green invention activities seem more efficient because of the pandemic. This may increase the industry’s competence. We suggest that managers of firms should consider the situation and decide whether they need a change in strategy. Second, our results show that the outbreak of the COVID-19 can influence the role of other government policies in green inventions. That implies that policy-makers should judge the relationship between the role of the pandemic and other policies, and they should make a policy system such that they can take the “opportunity” of the pandemic and avoid the “damage” of the pandemic.
There are also limitations of this study. First, the main purpose of the DID model is to test whether an exogenous event makes difference for the treatment objective at an average level, although it hardly captures the time-lag of the impact. Second, the precise reason and mechanism for why and how the pandemic can promote green inventions is still not clear. Problems resulting from these limitations are also our future research emphasis.
Author Contributions
Conceptualization, X.W. and W.C.; methodology, X.W. and R.L.; software, X.W.; validation, R.L., W.C. and X.W.; formal analysis, X.W.; investigation, X.W.; resources, R.L.; data curation, R.L.; writing—original draft preparation, X.W.; writing—review and editing, X.W.; visualization, X.W.; supervision, W.C.; project administration, X.W.; funding acquisition, X.W. All authors have read and agreed to the published version of the manuscript.
Funding
This research is funded by the National Science Foundation of China (Project No. 72102121).
Institutional Review Board Statement
Not applicable.
Informed Consent Statement
Not applicable.
Data Availability Statement
Not applicable.
Acknowledgments
The Authors are grateful for contributions results from comments that were received from the anonymous referees. Ranran Liu and Xuan Wei contributed equally to this work.
Conflicts of Interest
The authors declare no conflict of interest.
Appendix A

Table A1.
Other quantify studies on the impact of the COVID-19 pandemic.
| Perspective | Reference | Dependent Variable | Independent Variable | Data Source and Sample Size | Conclusion | Intermediate Variables |
|---|---|---|---|---|---|---|
| Induvidual | [39] | New product purchase intentions | Perceived severity of COVID | Survey by authors (459) | Positive | Nostalgia, search for meaning |
| Induvidual | [40] | Eco-friendly lifestyle | Perception of the pandemic | Survey by authors (1103) | Positive | Digital skills, education level |
| Induvidual | [41] | Frequency of teleactivities and general online activities | Before and during the COVID-19 pandemic | Survey by authors (1796) | Positive | Local facilities |
| Firm | [42] | Performance change differs between eco-friendly firms and conventional firms | Severity of damage caused by COVID-19 | Public data of World Bank Enterprise (4888) | Positve | Firm size |
| Firm | [13] | The adoption environmental innovations | The COVID-19 crisis | Survey by authors (526) | Negative | Strategic responses |
| Firm | [43] | Enterprise innovation (R&D expenditure) | Epidemic shocks (COVID-19 and SARS) | Public data of listed firms (more than 20000) | Negative | Information asymmetry, financing constraints, economic policy uncertainty |
| Firm | [44] | SMEs performance | The COVID-19 pandemic | Survey by authors (313) | Negative | Access to finance, mergers and acquisition, profitability, remote work |
| Firm | [45] | Performance of renewable energy start-up companies | The COVID-19 pandemic | Survey by authors (3) | Negative | Global financial crisis |
| Region | [46] | Oil and electricity demand | Epidemic status (infected people) | Public data (365) | Negative | Export income, GDP growth, etc. |
| Region | [47] | Pollutant concentration | The outbreak of the COVID-19 pandemic | Public data (7810) | Negative | Remaining pollution sources during the Level I Response period |
References
- Swinbanks, D. Going for ‘green technology’. Nature 1991, 350, 266–267. [Google Scholar] [CrossRef] [Green Version]
- Beck, S.; Mahony, M. The IPCC and the new map of science and politics. Wiley Interdiscip. Rev. Clim. Chang. 2018, 9, e547. [Google Scholar] [CrossRef] [Green Version]
- Rosenbloom, D.; Markard, J. A COVID-19 recovery for climate. Science 2020, 368, 447. [Google Scholar] [CrossRef]
- Hanna, R.; Xu, Y.; Victor, D.G. After COVID-19, Green Investment Must Deliver Jobs to Get Political Traction; Nature Publishing Group: Berlin, Germany, 2020. [Google Scholar]
- WIPO. Global Innovation Index 2021: Tracking Innovation through the COVID-19 Crisis; World Intellectual Property Organization: Geneva, Switzerland, 2021. [Google Scholar]
- Junlin, L.; Jiayong, H.; Ming, X.; Ran, L.; Xiaoqiong, W.; Ni, Z.; Xueying, Z.; Hui, X. Analysis of research hotspots in China’s economics and management in 2020. Econ. Dyn. 2021, 3, 24–37. (In Chinese) [Google Scholar]
- Lan, L.; Weiguo, Z.; Siqing, P.; Dahai, H.; Yunfeng, W. Corporate Resilience and Entrepreneurship in the Crisis of the New Coronary Pneumonia Epidemic—2021. Nankai Manag. Rev. 2022, 25, 50–64. (In Chinese) [Google Scholar]
- Xiaobo, Z. Enterprise Survey for Innovation and Entrepreneurship in China. 2018. Available online: https://opendata.pku.edu.cn/dataset.xhtml?persistentId=doi:10.18170/DVN/DLBWAK&language=en (accessed on 31 May 2022).
- Wang, J.; Shen, J.; Ye, D.; Yan, X.; Zhang, Y.; Yang, W.; Li, X.; Wang, J.; Zhang, L.; Pan, L. Disinfection technology of hospital wastes and wastewater: Suggestions for disinfection strategy during coronavirus Disease 2019 (COVID-19) pandemic in China. Environ. Pollut. 2020, 262, 114665. [Google Scholar] [CrossRef]
- Kumar, A.; Mangla, S.K.; Kumar, P.; Song, M. Mitigate risks in perishable food supply chains: Learning from COVID-19. Technol. Forecast. Soc. Change 2021, 166, 120643. [Google Scholar] [CrossRef]
- Yang, S.; Chong, Z. Smart city projects against COVID-19: Quantitative evidence from China. Sustain. Cities Soc. 2021, 70, 102897. [Google Scholar] [CrossRef]
- Severo, E.A.; De Guimarães, J.C.F.; Dellarmelin, M.L. Impact of the COVID-19 pandemic on environmental awareness, sustainable consumption and social responsibility: Evidence from generations in Brazil and Portugal. J. Clean. Prod. 2021, 286, 124947. [Google Scholar] [CrossRef]
- Hermundsdottir, F.; Haneberg, D.H.; Aspelund, A. Analyzing the impact of COVID-19 on environmental innovations in manufacturing firms. Technol. Soc. 2022, 68, 101918. [Google Scholar] [CrossRef]
- Liang, X. Unraveling the cause-effect relation between time series. Phys. Rev. E 2014, 90, 052150. [Google Scholar] [CrossRef] [PubMed] [Green Version]
- Dziallas, M.; Blind, K. Innovation indicators throughout the innovation process: An extensive literature analysis. Technovation 2019, 80, 3–29. [Google Scholar] [CrossRef]
- Griliches, Z. Patent Statistics as Economic Indicators: A Survey. J. Econ. Lit. 1990, 28, 1661–1707. [Google Scholar]
- Schmoch, U.; Gehrke, B. China’s technological performance as reflected in patents. Scientometrics 2022, 127, 299–317. [Google Scholar] [CrossRef]
- Hu, A.G.; Jefferson, G.H. A great wall of patents: What is behind China’s recent patent explosion? J. Dev. Econ. 2009, 90, 57–68. [Google Scholar] [CrossRef]
- Schmookler, J. Invention and economic growth. In Invention and Economic Growth; Harvard University Press: Cambridge, MA, USA, 2013. [Google Scholar]
- Dosi, G. Technological paradigms and technological trajectories: A suggested interpretation of the determinants and directions of technical change. Res. Policy 1982, 11, 147–162. [Google Scholar] [CrossRef]
- Porter, M.E.; Van der Linde, C. Toward a new conception of the environment-competitiveness relationship. J. Econ. Perspect. 1995, 9, 97–118. [Google Scholar] [CrossRef] [Green Version]
- Schumpeter, J.A. Socialism, Capitalism and Democracy; Harper & Brothers: London, UK, 1942. [Google Scholar]
- Arrow, K. Economic welfare and the allocation of resources for invention. In The Rate and Direction of Inventive Activity: Economic and Social Factors; Princeton University Press: Princeton, NJ, USA, 1962; pp. 609–626. [Google Scholar]
- Chen, Y.-S.; Chang, C.-H. The determinants of green product development performance: Green dynamic capabilities, green transformational leadership, and green creativity. J. Bus. Ethics 2013, 116, 107–119. [Google Scholar] [CrossRef]
- Brunnermeier, S.B.; Cohen, M.A. Determinants of environmental innovation in US manufacturing industries. J. Environ. Econ. Manag. 2003, 45, 278–293. [Google Scholar] [CrossRef]
- Zhu, W.; He, Y. Green product design in supply chains under competition. Eur. J. Oper. Res. 2017, 258, 165–180. [Google Scholar] [CrossRef]
- Rennings, K. Redefining innovation—Eco-innovation research and the contribution from ecological economics. Ecol. Econ. 2000, 32, 319–332. [Google Scholar] [CrossRef]
- Chen, Y.-S.; Lai, S.-B.; Wen, C.-T. The influence of green innovation performance on corporate advantage in Taiwan. J. Bus. Ethics 2006, 67, 331–339. [Google Scholar] [CrossRef]
- Rothwell, R.; Freeman, C.; Horlsey, A.; Jervis, V.; Robertson, A.; Townsend, J. SAPPHO updated-project SAPPHO phase II. Res. Policy 1974, 3, 258–291. [Google Scholar] [CrossRef]
- Wong, S.K.S. The influence of green product competitiveness on the success of green product innovation: Empirical evidence from the Chinese electrical and electronics industry. Eur. J. Innov. Manag. 2012, 15, 468–490. [Google Scholar] [CrossRef]
- Berrone, P.; Fosfuri, A.; Gelabert, L.; Gomez-Mejia, L.R. Necessity as the mother of ‘green’inventions: Institutional pressures and environmental innovations. Strateg. Manag. J. 2013, 34, 891–909. [Google Scholar] [CrossRef]
- Chen, Y.-S. The driver of green innovation and green image–green core competence. J. Bus. Ethics 2008, 81, 531–543. [Google Scholar] [CrossRef]
- Chen, Y.S.; Chang, C.H.; Wu, F.S. Origins of green innovations: The differences between proactive and reactive green innovations. Manag. Decis. 2012, 50, 368–398. [Google Scholar] [CrossRef]
- Wang, R.; Wijen, F.; Heugens, P.P. Government’s green grip: Multifaceted state influence on corporate environmental actions in China. Strateg. Manag. J. 2018, 39, 403–428. [Google Scholar] [CrossRef]
- Hsu, M.J.; Hsieh, M.C.; Opoku, E.K. Knowledge Co-Creation during the COVID-19 Pandemic: A Dual-Regulated Learning Model in Virtual Hospitality Communities. Sustainability 2022, 14, 4664. [Google Scholar] [CrossRef]
- Liu, Z.L.; Anderson, T.D.; Cruz, J.M. Consumer environmental awareness and competition in two-stage supply chains. Eur. J. Oper. Res. 2012, 218, 602–613. [Google Scholar] [CrossRef]
- Geels, F.W.; Pereira, G.I.; Pinkse, J. Moving beyond opportunity narratives in COVID-19 green recoveries: A comparative analysis of public investment plans in France, Germany, and the United Kingdom. Energy Res. Soc. Sci. 2022, 84, 102368. [Google Scholar] [CrossRef]
- Sarkis, J. Supply chain sustainability: Learning from the COVID-19 pandemic. Int. J. Oper. Prod. Manag. 2021, 41, 63–73. [Google Scholar] [CrossRef]
- Xia, L.; Wang, J.; Santana, S. Nostalgia: Triggers and its role on new product purchase intentions. J. Bus. Res. 2021, 135, 183–194. [Google Scholar] [CrossRef]
- Ruiu, G.; Ruiu, M.L.; Ragnedda, M. How the COVID-19 Pandemic Impacted the Perception of Climate Change in the UK. Am. Behav. Sci. 2022, 66, 1–26. [Google Scholar] [CrossRef]
- Mouratidis, K.; Peters, S. COVID-19 impact on teleactivities: Role of built environment and implications for mobility. Transp. Res. Part A-Policy Pract. 2022, 158, 251–270. [Google Scholar] [CrossRef] [PubMed]
- Zhang, D.; Fang, Y. Are environmentally friendly firms more vulnerable during the COVID-19 pandemic? J. Clean. Prod. 2022, 355, 131781. [Google Scholar] [CrossRef]
- Al-Omoush, K.S.; Ribeiro-Navarrete, S.; Lassala, C.; Skare, M. Networking and knowledge creation: Social capital and collaborative innovation in responding to the COVID-19 crisis. J. Innov. Knowl. 2022, 7, 100181. [Google Scholar] [CrossRef]
- Xiao, D.Y.; Su, J.X. Macroeconomic lockdown effects of COVID-19 on small business in China: Empirical insights from SEM technique. Environ. Sci. Pollut. Res. 2022, 29, 1–13. [Google Scholar] [CrossRef]
- Pilloni, M.; Kadar, J.; Abu Hamed, T. The Impact of COVID-19 on Energy Start-Up Companies: The Use of Global Financial Crisis (GFC) as a Lesson for Future Recovery. Energies 2022, 15, 3530. [Google Scholar] [CrossRef]
- Norouzi, N.; de Rubens, G.Z.; Choupanpiesheh, S.; Enevoldsen, P. When pandemics impact economies and climate change: Exploring the impacts of COVID-19 on oil and electricity demand in China. Energy Res. Soc. Sci. 2020, 68, 101654. [Google Scholar] [CrossRef]
- Zhao, L.J.; Wang, Y.; Zhang, H.H.; Qian, Y.; Yang, P.L.; Zhou, L.X. Diverse spillover effects of COVID-19 control measures on air quality improvement: Evidence from typical Chinese cities. Environ. Dev. Sustain. 2022. [Google Scholar] [CrossRef] [PubMed]
- Lawinfochina Patent Law of the People’s Republic of China (2020 Amendment) [Effective]. Available online: https://lawinfochina.com/display.aspx?id=34138&lib=law (accessed on 31 May 2022).
- Yang, D.L. Pendency and grant ratios of invention patents: A comparative study of the US and China. Res. Policy 2008, 37, 1035–1046. [Google Scholar] [CrossRef]
- UNEP Environmentally Sound Technologies. Available online: https://www.unep.org/regions/asia-and-pacific/regional-initiatives/supporting-resource-efficiency/environmentally-sound (accessed on 31 May 2022).
- Meyer, B.D. Natural and quasi-experiments in economics. J. Bus. Econ. Stat. 1995, 13, 151–161. [Google Scholar]
- Wooldridge, J.M. Introductory Econometrics: A Modern Approach; Cengage Learning: Boston, MA, USA, 2015. [Google Scholar]
- Yang, X.; Zhang, J.; Ren, S.; Ran, Q. Can the new energy demonstration city policy reduce environmental pollution? Evidence from a quasi-natural experiment in China. J. Clean. Prod. 2021, 287, 125015. [Google Scholar] [CrossRef]
- StataCorp. Stata Statistical Software: Release 17; StataCorp LLC: College Station, TX, USA, 2021. [Google Scholar]
- Zhang, H.; Xu, T.; Feng, C. Does public participation promote environmental efficiency? Evidence from a quasi-natural experiment of environmental information disclosure in China. Energy Econ. 2022, 108, 105871. [Google Scholar] [CrossRef]
- Gao, Y.; Li, M.; Xue, J.; Liu, Y. Evaluation of effectiveness of China’s carbon emissions trading scheme in carbon mitigation. Energy Econ. 2020, 90, 104872. [Google Scholar] [CrossRef]
- Hu, J.; Huang, Q.; Chen, X. Environmental regulation, innovation quality and firms’ competitivity? Quasi-natural experiment based on China’s carbon emissions trading pilot. Econ. Res.-Ekon. Istraz. 2020, 33, 3307–3333. [Google Scholar] [CrossRef]
- Jia, Z.; Lin, B. How to achieve the first step of the carbon-neutrality 2060 target in China: The coal substitution perspective. Energy 2021, 233, 121179. [Google Scholar] [CrossRef]
- Lindell, M.K.; Perry, R.W.; Prater, C.; Nicholson, W.C. Fundamentals of Emergency Management; FEMA: Washington, DC, USA, 2006.
- Zheng, M.; Feng, G.-F.; Jang, C.-L.; Chang, C.-P. Terrorism and green innovation in renewable energy. Energy Econ. 2021, 104, 105695. [Google Scholar] [CrossRef]
- Dosi, G.; Soete, L. On the syndemic nature of crises: A Freeman perspective. Res. Policy 2022, 51, 104393. [Google Scholar] [CrossRef]
- George, G.; Lakhani, K.; Puranam, P. What has changed? The impact of Covid pandemic on the technology and innovation management research agenda. J. Manag. Stud. 2020, 57, 1754–1758. [Google Scholar] [CrossRef]
- Stern, N.; Valero, A. Innovation, growth and the transition to net-zero emissions. Res. Policy 2021, 50, 104293. [Google Scholar] [CrossRef]
Figure 1.
Time trends of different types of green invention patent applications: (a) firms, (b) universities, (c) firm–university collaborations.
Figure 1.
Time trends of different types of green invention patent applications: (a) firms, (b) universities, (c) firm–university collaborations.

Figure 2.
The results of the parallel-trend test.

Figure 3.
Kernel density of 500 estimates.

Table 1.
The descriptive statistics of each variable.
| Variable | Description | Units | N | Mean | SD | Min | Max |
|---|---|---|---|---|---|---|---|
| firm | The monthly number of firms’ green invention patent applications in a province | 1 | 1944 | 280.3 | 409.9 | 1 | 3405 |
| university | The monthly number of universities’ green invention patent applications in a province | 1 | 1944 | 89.92 | 99.71 | 0 | 688 |
| firmuniver | The monthly number of firm–university collaborations’ green invention patent applications in a province | 1 | 1944 | 13.75 | 24.50 | 0 | 438 |
| TNF | The yearly number of firms in a province | 100 | 1944 | 361.6 | 300.0 | 33.14 | 1501 |
| TNU | The yearly number of universities in a province | 1 | 1944 | 94.32 | 35.52 | 18 | 167 |
| GS&T | The yearly government spending on science and technology in a province | 100 million yuan | 1944 | 174.0 | 194.1 | 17.25 | 1169 |
| R&D person | The yearly number of research and development persons in a province | 10000 persons | 1944 | 15.12 | 12.90 | 1.300 | 71.70 |
| GDP | The monthly GDP of a province | 1000 million yuan | 1944 | 312.7 | 227.0 | 25.79 | 1112 |
| population | The yearly population of a province | 10000 persons | 1944 | 5015 | 2807 | 684 | 12624 |
| urban area | The yearly urban area of a province | 100 sq. km. | 1944 | 70.56 | 53.91 | 9.510 | 239.5 |
| airpolu | The yearly NOx emissions of a province | 10000t | 1944 | 42.59 | 41.84 | 3.780 | 175.8 |
| induswater | The yearly industrial water consumption | 100 million cubic meters | 1944 | 44.97 | 48.71 | 3 | 255.2 |
Table 2.
The regression results.
| (1) firm | (2) firm | (3) university | (4) university | (5) firmuniver | (6) firmuniver | |
|---|---|---|---|---|---|---|
| treat × after | 96.316 *** (9.546) | 51.222 *** (3.978) | 58.181 *** (23.679) | 37.846 *** (12.281) | 10.636*** (13.799) | 8.727 *** (8.071) |
| GDP | −0.134 (−1.340) | 0.110 *** (4.596) | 0.004 (0.437) | |||
| TNF | 0.507 *** (3.987) | 0.189 *** (6.192) | −0.009 (−0.862) | |||
| airpolu | −0.420 ** (−2.889) | −0.197 *** (−5.661) | −0.040 ** (−3.286) | |||
| GS&T | 1.335 *** (11.182) | 0.320 *** (11.196) | 0.062 *** (6.150) | |||
| urban area | 2.047 ** (2.598) | 1.991 *** (10.558) | 0.415 *** (6.267) | |||
| induswater | 6.690 *** (6.180) | 0.627 * (2.422) | −0.009 (−0.104) | |||
| population | 20.119 * (2.518) | −9.616 *** (−5.027) | −2.165 ** (−3.225) | |||
| TNU | −5.404 ** (−3.285) | −0.788 * (−2.002) | −0.055 (−0.396) | |||
| R&D person | 4.784 * (2.284) | −0.907 * (−1.809) | 0.928 *** (5.275) | |||
| γi | Yes | Yes | Yes | Yes | Yes | Yes |
| μi | Yes | Yes | Yes | Yes | Yes | Yes |
| N | 1944 | 1944 | 1944 | 1944 | 1944 | 1944 |
| adj. R2 | 0.796 | 0.847 | 0.795 | 0.852 | 0.666 | 0.699 |
Note: t statistics in parentheses; * p < 0.1, ** p < 0.01, *** p < 0.001
Table 3.
Results of triple-difference estimation using the indicator of pre-policies.
| SO2 | CO2 | |||||
|---|---|---|---|---|---|---|
| (1) firm | (2) university | (3) firmuniver | (4) firm | (5) university | (6) firmuniver | |
| SO2 × after | 16.592 (0.765) | 17.052 *** (3.317) | 2.971 (1.636) | |||
| SO2 × treat | 16.543 (0.717) | 32.716 *** (5.987) | 5.548 ** (2.875) | |||
| treat×SO2 × after | −32.088 (−1.097) | −26.317 *** (−3.796) | −2.442 (−0.997) | |||
| CO2 × after | 83.595 ** (3.120) | 4.407 (0.697) | 2.748 (1.213) | |||
| CO2 × treat | 123.309 *** (3.999) | 34.776 *** (4.778) | 9.865 *** (3.786) | |||
| treat×CO2 × covid | −26.402 (−0.706) | 12.127 (1.374) | −5.438 * (−1.721) | |||
| treat × after | 58.321 *** (3.895) | 36.258 *** (10.220) | 7.601 *** (6.066) | 33.885 * (2.410) | 27.985 *** (8.431) | 8.168 *** (6.873) |
| time effect | Yes | Yes | Yes | Yes | Yes | Yes |
| γi | Yes | Yes | Yes | Yes | Yes | Yes |
| μi | Yes | Yes | Yes | Yes | Yes | Yes |
| N | 1944 | 1944 | 1944 | 1944 | 1944 | 1944 |
| adj. R2 | 0.847 | 0.855 | 0.700 | 0.851 | 0.859 | 0.701 |
| ll | −12,588.558 | −9789.558 | −7766.281 | −12567.231 | −9760.710 | −7763.887 |
Note: t statistics in parentheses; * p < 0.1, ** p < 0.01, *** p < 0.001
Table 4.
Results of triple-difference estimation using the indicator of post-factor.
| (1) firm | (2) university | (3) firmuniver | |
|---|---|---|---|
| treat × carbon × after | 46.947 ** (2.963) | 49.392 *** (13.114) | 9.160 *** (6.864) |
| γi | Yes | Yes | Yes |
| μi | Yes | Yes | Yes |
| Control | Yes | Yes | Yes |
| N | 1944 | 1944 | 1944 |
| adj. R2 | 0.847 | 0.854 | 0.696 |
| ll | −12,592.850 | −9799.556 | −7782.687 |
Note: t statistics in parentheses; ** p < 0.01, *** p < 0.001
Table 5.
Heterogeneous effect of the COVID-19 pandemic.
| Hubei and Surrounding Areas | Non-Hubei Surrounding Areas | |||||
|---|---|---|---|---|---|---|
| (1) firm | (2) university | (3) firmuniver | (4) firm | (5) university | (6) firmuniver | |
| treat × covid | 56.012 * (2.512) | 31.478 *** (5.858) | 6.003 *** (4.836) | 65.124 *** (4.164) | 38.318 *** (10.209) | 9.031 *** (6.605) |
| γi | Yes | Yes | Yes | Yes | Yes | Yes |
| μi | Yes | Yes | Yes | Yes | Yes | Yes |
| Control | Yes | Yes | Yes | Yes | Yes | Yes |
| N | 504 | 504 | 504 | 1440 | 1440 | 1440 |
| adj. R2 | 0.702 | 0.791 | 0.574 | 0.860 | 0.862 | 0.706 |
| ll | −2992.029 | −2274.782 | −1536.240 | −9428.877 | −7373.892 | −5919.670 |
Note: t statistics in parentheses; * p < 0.1, *** p < 0.001
Publisher’s Note: MDPI stays neutral with regard to jurisdictional claims in published maps and institutional affiliations. |
© 2022 by the authors. Licensee MDPI, Basel, Switzerland. This article is an open access article distributed under the terms and conditions of the Creative Commons Attribution (CC BY) license (https://creativecommons.org/licenses/by/4.0/).
Share and Cite
MDPI and ACS Style
Wei, X.; Liu, R.; Chen, W. How the COVID-19 Pandemic Impacts Green Inventions: Evidence from a Quasi-Natural Experiment in China. Sustainability 2022, 14, 10385. https://doi.org/10.3390/su141610385
AMA Style
Wei X, Liu R, Chen W. How the COVID-19 Pandemic Impacts Green Inventions: Evidence from a Quasi-Natural Experiment in China. Sustainability. 2022; 14(16):10385. https://doi.org/10.3390/su141610385
Chicago/Turabian StyleWei, Xuan, Ranran Liu, and Wei Chen. 2022. "How the COVID-19 Pandemic Impacts Green Inventions: Evidence from a Quasi-Natural Experiment in China" Sustainability 14, no. 16: 10385. https://doi.org/10.3390/su141610385
Note that from the first issue of 2016, this journal uses article numbers instead of page numbers. See further details here.