


Abstract
Severe acute respiratory syndrome coronavirus 2 (SARS-CoV-2) continues to spread globally and cause significant morbidity and mortality. Antispike protein monoclonal antibody (mAb) therapy has been shown to prevent progression to severe coronavirus disease 2019 (COVID-19). The objective of this study was to report the outcomes of high-risk, SARS-CoV-2-positive patients infused with 1 of the 3 mAb therapies available through Food and Drug Administration Emergency Use Authorization (EUA).
A total of 4328 SARS-CoV-2-positive patients who satisfied EUA criteria for eligibility for receiving mAb therapy were infused with bamlanivimab or the combination therapies bamlanivimab-etesevimab or casirivimab-imdevimab from November 22, 2020, to May 31, 2021, at 6 infusion clinics and multiple emergency departments within the 8 Houston Methodist Hospitals in Houston, Texas. The primary outcome of hospital admission within 14 and 28 days postinfusion was assessed relative to a propensity score–matched cohort, matched based on age, race/ethnicity, median income by zip code, body mass index, comorbidities, and positive polymerase chain reaction date. Secondary outcomes included intensive care unit admission and mortality.
A total of 2879 infused patients and matched controls were included in the analysis, including 1718 patients infused with bamlanivimab, 346 patients infused with bamlanivimab-etesevimab, and 815 patients infused with casirivimab-imdevimab. Hospital admission and mortality rates were significantly decreased overall in mAb-infused patients relative to matched controls. Among the infused cohort, those who received casirivimab-imdevimab had a significantly decreased rate of admission relative to the other 2 mAb therapy groups (adjusted risk ratio,0.51; P=.001).
Treatment with bamlanivimab, bamlanivimab-etesevimab, or casirivimab-imdevimab significantly decreased the number of patients who progressed to severe COVID-19 disease and required hospitalization.
Severe acute respiratory syndrome coronavirus 2 (SARS-CoV-2), the etiologic agent of coronavirus disease 2019 (COVID-19), continues to spread and cause significant morbidity and mortality globally [1]. The clinical outcomes of SARS-CoV-2 infection vary widely. Although the majority of those infected have mild symptoms, some patients progress to severe or critical disease and require hospitalization [2].
Studies of COVID-19 patients treated with convalescent plasma have shown a significant beneficial effect when plasma with high anti-SARS-CoV-2 IgG antibody levels is administered early in disease progression [3–5]. Building on this concept, several neutralizing monoclonal antibodies (mAbs) have been developed as potential therapies for SARS-CoV-2 infection. Four commercially available mAb treatments that bind to the SARS-CoV-2 spike protein have received Emergency Use Authorization (EUA) from the Food and Drug Administration (FDA) since November 2020: bamlanivimab (LY-CoV555, Eli Lilly), bamlanivimab and etesevimab (Eli Lilly), casirivimab and imdevimab (REGEN-COV, Regeneron), and sotrovimab (VIR-7831, GSK). The EUAs are for infusion in nonhospitalized SARS-CoV-2-positive patients at increased risk of progressing to severe disease, including older adults and those with comorbidities.
Early mAb treatment in this high-risk population has been shown to reduce viral load and prevent hospitalizations in clinical trials [6–9]. The Blocking Viral Attachment and Cell Entry with SARS-CoV-2 Neutralizing Antibodies (BLAZE-1) clinical trial assessed bamlanivimab alone and bamlanivimab and etesevimab, with reduction of viral load being the primary end point [6, 7]. Patients receiving mAb combination therapy saw a significant reduction in viral load that was not observed with bamlanivimab alone. The recent data from the REGEN-COV trials with 799 patients showed that REGN-COV2 was effective at reducing viral load and preventing COVID-related hospitalizations [8].
Investigator-initiated studies have also shown that mAb infusion reduces hospitalizations and mortality. A study from Mayo assessed bamlanivimab transfusion in 2335 patients compared with a propensity-matched control group of 2335 untreated patients [10]. They found that infusion reduced hospitalization, intensive care unit (ICU) utilization, and all-cause mortality. Kumar et al. performed a retrospective case–control study with bamlanivimab on 218 infused patients and 185 controls [11]. They found that the 30-day hospitalization rate was reduced in the infused cohort, but the sample size did not allow assessment of mortality. Finally, Jenks et al. assessed 617 patients (175 received mAb; 442 did not), and the majority (83.4%) of the infused patients received casirivimab and imdevimab. They observed a significant reduction in hospitalizations and mortality [12].
Here we present data on the outcomes of 2879 patients infused with 1 of 3 neutralizing mAbs from November 22, 2020, to May 31, 2021, in Houston Methodist Hospitals relative to a propensity score–matched cohort of 2879 patients who did not receive mAb. Our findings show that administration of mAbs reduced hospital admissions at 28 days post-transfusion by 55% compared with the control cohort. This is the largest propensity-matched study conducted to date that assesses 3 of the 4 authorized mAbs for COVID-19.
METHODS
Study Design and Patient Population
The study was reviewed and approved by the Houston Methodist Research Institute Institutional Review Board (IRB PRO00029666). Verbal and written education was provided to all patients to ensure that they understood the EUA language. Patients were consented to receive the therapy before scheduling.
Houston Methodist developed dedicated infusion facilities and assembled multidisciplinary teams to coordinate mAb infusions for eligible patients in the outpatient setting [13]. Patients were referred for EUA mAb infusion by primary care physicians, virtual care physicians, and emergency departments (EDs) based on the following inclusion criteria: adults>18 years of age with a positive SARS-CoV-2 viral test, body weight of at least 40kg, and with at least 1 comorbidity (age≥65, body mass index [BMI]≥35, diabetes, chronic kidney disease, immunosuppressive disease or treatment, or patients who were ≥55 years of age with cardiovascular disease, hypertension, chronic obstructive pulmonary disease, or other chronic lung disease). Referred patients were excluded if they were hospitalized for COVID-19 or developed increased supplemental oxygen requirement from baseline due to COVID-19. Patients were included in the control cohort if they tested positive for SARS-CoV-2 at a Houston Methodist facility within the study time frame but were not treated with mAb therapy.
The start date (November 22, 2020) for the cohort represents the time of earliest mAb infusion, and May 31, 2021, was selected as the most recent date with 28-day postinfusion data available. Qualified patients received mAb formulations interchangeably based on infusion site and product availability. Three formulations were included in the study: bamlanivimab (Eli Lily, FDA EUA #90) [14], bamlanivimab and etesevimab (Eli Lily, FDA EUA #094; www.fda.gov/media/145802/download), and casirivimab and imdevimab (REGN-COV2, FDA EUA #000091) [15]. Upon arrival at a Houston Methodist infusion facility, as directed by the FDA, each participant was informed of their assigned formulation. Bamlanivimab was administered at a dose of 700mg and infused at a rate of 270mL/h; bamlanivimab + etesevimab was administered at 700mg/1400mg and infused at 220mL/h; and casirivimab + imdevimab was administered at 1200mg/1200mg and infused at 250mL/h. Infusions took approximately 30 minutes to 1 hour, followed by a 1-hour postinfusion observation period.
Data Collection and Storage
Infusion records and patient metadata were acquired from the electronic medical record by standard informatics methods. As needed, manual electronic chart review was performed to obtain more detailed patient information. In addition, all treated patients were enrolled in CareSense (Conshohocken, PA, USA), an interactive digital care navigation and data collection system that captured postinfusion health care use at specific time intervals. CareSense automatically delivers reporting metrics in an Excel format, which were integrated with the EMR for analyses. Patients hospitalized outside the Houston Methodist system were validated and included in this analysis.
Statistical Analysis
Patient characteristics and outcomes were reported as frequencies and proportions for categorical variables and medians and interquartile ranges (IQRs) for continuous variables, as appropriate. Differences between patients who received mAb infusion (“infusion” group) and patients who did not receive mAb infusion (“no infusion” group) were determined by the Wilcoxon rank-sum or Kruskal Wallis test for continuous variables and by the chi-square or Fisher exact test for categorical variables, as appropriate. Nearest propensity score matching (without replacement, ratio 1:1, caliper=0.01) between the infusion and no infusion groups was conducted based on (i) patient age (continuous, per years), (ii) race/ethnicity, (iii) quartiles of median income by zip code, (iv) BMI (categorical, <24, 25–34 and ≥35kg/m2), (v) comorbidities (chronic lung disease, chronic kidney disease, chronic heart disease, hypertension, diabetes), and (vi) positive polymerase chain reaction (PCR) date (±7 days). Positive PCR date was included in the matching criteria to control for the pandemic epoch and take into account in the matching algorithm. The balance of covariates in the matched cohort was evaluated using the standardized percentage bias (standardized mean differences) [16, 17].
Generalized linear models (GLMs; for binary and continuous dependent variables) were conducted to compare the difference in the primary outcome (28-day hospital admission) and secondary outcomes (14-day hospital admission, 28-day mortality, hospital length of stay, ICU admission, and ICU length of stay). The multivariable GLM models were adjusted for age, gender, race/ethnicity, BMI, quartiles of median income by zip code, body mass index, comorbidities (chronic lung disease, chronic kidney disease, chronic heart disease, hypertension, diabetes), and SARS-CoV-2 variant type. Adjusted risk ratio (aRR; for binary/categorical dependent variables) and beta coefficient (for continuous dependent variables) with 95% confidence interval were reported. Subanalyses with similar approaches were conducted in subgroups of patients who were stratified by age (<55, 55–64, and ≥65 year), BMI (<24, 25–34, and ≥35kg/m2) and treatment received (infusion group only).
Fine and Gray competing risk (subdistribution hazard) modeling was also conducted to compare the difference in the hospital admission within 28 days from PCR date between the infusion and no infusion groups [18]. The subdistribution hazard ratio and the cumulative incidence curves were presented. For the mortality, Kaplan-Meier curves were used to compare the difference between groups using the log-rank test. The analyses were repeated in both the prematched and propensity score–matched cohorts.
Among covariates, only ethnicity and BMI had missing data (4.5% and 12.9%, respectively). For ethnicity, missing values were categorized as “unknown.” For BMI, multiple imputations by chained equations were used to impute the missing values. The analyses were conducted on both the complete and imputed data set. Because similar results were obtained from the 2 analyses, only the results from the complete data were reported. All the analyses were performed on Stata, version 17.0 (StataCorp LLC, College Station, TX, USA). A P value <.05 was considered significant.
SARS-CoV-2 Genome Sequencing
SARS-CoV-2 genome sequencing was performed as previously described using Illumina sequencing instruments [19, 20].
RESULTS
Patient Population
In total, 14986 patients with a positive SARS-CoV-2 PCR test were evaluated for inclusion, and of these, 2404 were excluded from the analysis (Figure 1). We administered mAb therapy to 4048 patients during the study interval, and propensity score matching resulted in 2879 COVID-19 patients in both cohorts (infused and noninfused). The median age of participants (IQR) was 60 (48–69) years, and 45.1% were male. The demographics and comorbidity data are summarized in Table 1.
Patient Characteristics
| All Patients (Prematched Cohort) | Propensity Score–Matched Cohort | ||||||||
|---|---|---|---|---|---|---|---|---|---|
| Total | No Infusion | Infusion | P Value | Total | No Infusion | Infusion | Standardized % | P Value | |
| (N=12582) | (n=8534) | (n=4048) | (N=5758) | (n=2879) | (n=2879) | Bias | |||
| Age, median (IQR), y | 52.0 (38.0–65.0) | 47.0 (34.0–60.0) | 62.0 (50.0–70.0) | <.001 | 60.0 (48.0–69.0) | 60.0 (49.0–69.0) | 60.0 (48.0–69.0) | –0.04 | .13 |
| Age, y | <.001 | ||||||||
| <55 | 6761 (53.7) | 5533 (64.8) | 1228 (30.3) | 2015 (35.0) | 979 (34.0) | 1036 (36.0) | 0.04 | .12 | |
| 55–64 | 2487 (19.8) | 1402 (16.4) | 1085 (26.8) | 1513 (26.3) | 777 (27.0) | 736 (25.6) | –0.03 | .22 | |
| ≥65 | 3334 (26.5) | 1599 (18.7) | 1735 (42.9) | 2230 (38.7) | 1123 (39.0) | 1107 (38.5) | –0.01 | .67 | |
| Gender | <.001 | ||||||||
| Female | 6906 (54.9) | 4774 (55.9) | 2132 (52.7) | 3159 (54.9) | 1609 (55.9) | 1550 (53.8) | –0.04 | .12 | |
| Male | 5676 (45.1) | 3760 (44.1) | 1916 (47.3) | 2599 (45.1) | 1270 (44.1) | 1329 (46.2) | 0.04 | .12 | |
| Ethnicity | <.001 | ||||||||
| Caucasian | 6150 (48.9) | 3728 (43.7) | 2422 (59.8) | 3308 (57.5) | 1646 (57.2) | 1662 (57.7) | 0.02 | .51 | |
| Black | 2045 (16.3) | 1631 (19.1) | 414 (10.2) | 747 (13.0) | 390 (13.5) | 357 (12.4) | –0.03 | .22 | |
| Hispanic or Latino | 3153 (25.1) | 2366 (27.7) | 787 (19.4) | 1216 (21.1) | 600 (20.8) | 616 (21.4) | 0.02 | .54 | |
| Asian | 602 (4.8) | 387 (4.5) | 215 (5.3) | 271 (4.7) | 141 (4.9) | 130 (4.5) | –0.02 | .52 | |
| Other | 65 (0.5) | 48 (0.6) | 17 (0.4) | 28 (0.5) | 15 (0.5) | 13 (0.5) | 0.00 | .99 | |
| Unavailable | 567 (4.5) | 374 (4.4) | 193 (4.8) | 188 (3.3) | 87 (3.0) | 101 (3.5) | 0.03 | .30 | |
| Median income by zip code, by quartiles | <.001 | ||||||||
| <56000 | 3076 (24.7) | 2155 (25.6) | 921 (23.0) | 1388 (24.1) | 704 (24.5) | 684 (23.8) | –0.02 | .54 | |
| 56000–72999 | 3137 (25.2) | 2246 (26.7) | 891 (22.2) | 1356 (23.5) | 688 (23.9) | 668 (23.2) | –0.02 | .53 | |
| 73000–99999 | 2931 (23.6) | 1934 (23.0) | 997 (24.9) | 1402 (24.3) | 686 (23.8) | 716 (24.9) | 0.02 | .36 | |
| ≥100000 | 3289 (26.5) | 2089 (24.8) | 1200 (29.9) | 1612 (28.0) | 801 (27.8) | 811 (28.2) | 0.01 | .77 | |
| Body mass index, median (IQR), kg/m2 | 29.8 (25.8–35.1) | 29.3 (25.6–34.1) | 31.0 (26.6–36.8) | <.001 | 30.9 (26.8–36.6) | 30.7 (26.8–36.6) | 31.1 (26.9–36.6) | 0.06 | .12 |
| Body mass index, kg/m2 | <.001 | ||||||||
| <25 | 1620 (15.5) | 1183 (17.1) | 437 (12.4) | 772 (13.4) | 393 (13.7) | 379 (13.2) | –0.01 | .59 | |
| 25–34 | 6041 (57.9) | 4146 (60.0) | 1895 (53.8) | 3177 (55.2) | 1571 (54.6) | 1606 (55.8) | 0.02 | .35 | |
| ≥35 | 2776 (26.6) | 1583 (22.9) | 1193 (33.8) | 1809 (31.4) | 915 (31.8) | 894 (31.1) | –0.02 | .55 | |
| Chronic lung disease | 1407 (11.2) | 781 (9.2) | 626 (15.5) | <.001 | 811 (14.1) | 403 (14.0) | 408 (14.2) | 0.01 | .85 |
| Chronic kidney disease | 787 (6.3) | 400 (4.7) | 387 (9.6) | <.001 | 539 (9.4) | 272 (9.4) | 267 (9.3) | –0.01 | .82 |
| Chronic heart disease | 5126 (40.7) | 2859 (33.5) | 2267 (56.0) | <.001 | 3188 (55.4) | 1622 (56.3) | 1566 (54.4) | –0.04 | .14 |
| Hypertension | 4787 (38.0) | 2603 (30.5) | 2184 (54.0) | <.001 | 3054 (53.0) | 1550 (53.8) | 1504 (52.2) | –0.03 | .23 |
| Diabetes | 2307 (18.3) | 1169 (13.7) | 1138 (28.1) | <.001 | 1509 (26.2) | 769 (26.7) | 740 (25.7) | –0.02 | .39 |
| Treatment received | |||||||||
| Bam alone | 2427 (60.0) | — | 2427 (60.0) | — | 1718 (59.7) | — | 1718 (59.7) | — | — |
| Bam/ete | 473 (11.7) | — | 473 (11.7) | — | 346 (12.0) | — | 346 (12.0) | — | — |
| Cas/imd | 1148 (28.4) | — | 1148 (28.4) | — | 815 (28.3) | — | 815 (28.3) | — | — |
| Time from PCR to infusion (No. with available data), median (IQR), d | 2.0 (1.0–3.0) | — | 2.0 (1.0–3.0) | — | 2.0 (1.0–3.0) | — | 2.0 (1.0–3.0) | — | — |
Values are in median (interquartile range) for continuous variables and No. (%) for categorical variables. Differences between groups in the prematched cohort were compared using the Wilcoxon rank-sum test for continuous variables and the chi-square or Fisher exact test for categorical variables, as appropriate. The balance of covariates in the matched cohort was evaluated using the standardized percentage bias (standardized mean differences). Propensity score matching between infused vs not infused was based on age (continuous, per years), gender, race/ethnicity, quartiles of median income by zip code, body mass index (categorical, <24, 25–34, and ≥35kg/m2), comorbidities (chronic lung disease, chronic kidney disease, chronic heart disease, hypertension, diabetes), and PCR date (±7 days).
Abbreviations: BMI, body mass index; Bam, bamlanivimab; ete, etesevimab; Cas, casirivimab; imd, imdevimab; IQR, interquartile range; PCR, polymerase chain reaction.
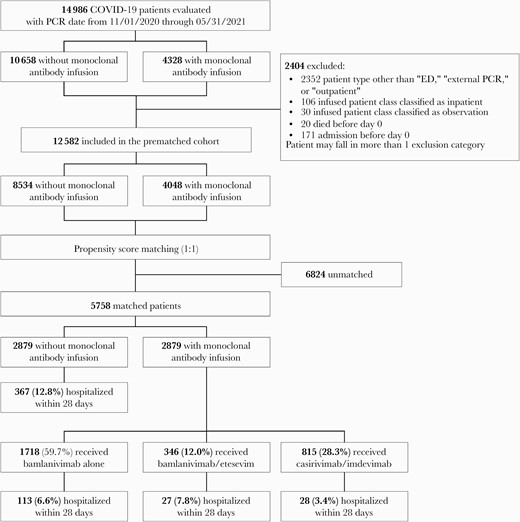
Flowchart of the study population. Nearest propensity score matching (without replacement, ratio 1:1, caliper=0.01) between the infusion and no infusion groups was conducted based on (i) patient age (continuous, per years), (ii) race/ethnicity, (iii) quartiles of median income by zip code, (iv) body mass index (categorical, <24, 25–34, and ≥35kg/m2), (v) comorbidities (chronic lung disease, chronic kidney disease, chronic heart disease, hypertension, diabetes), and (vi) positive polymerase chain reaction date (±7 days). Abbreviations: COVID-19, coronavirus disease 2019; ED, emergency department; PCR, polymerase chain reaction.
Primary Outcomes
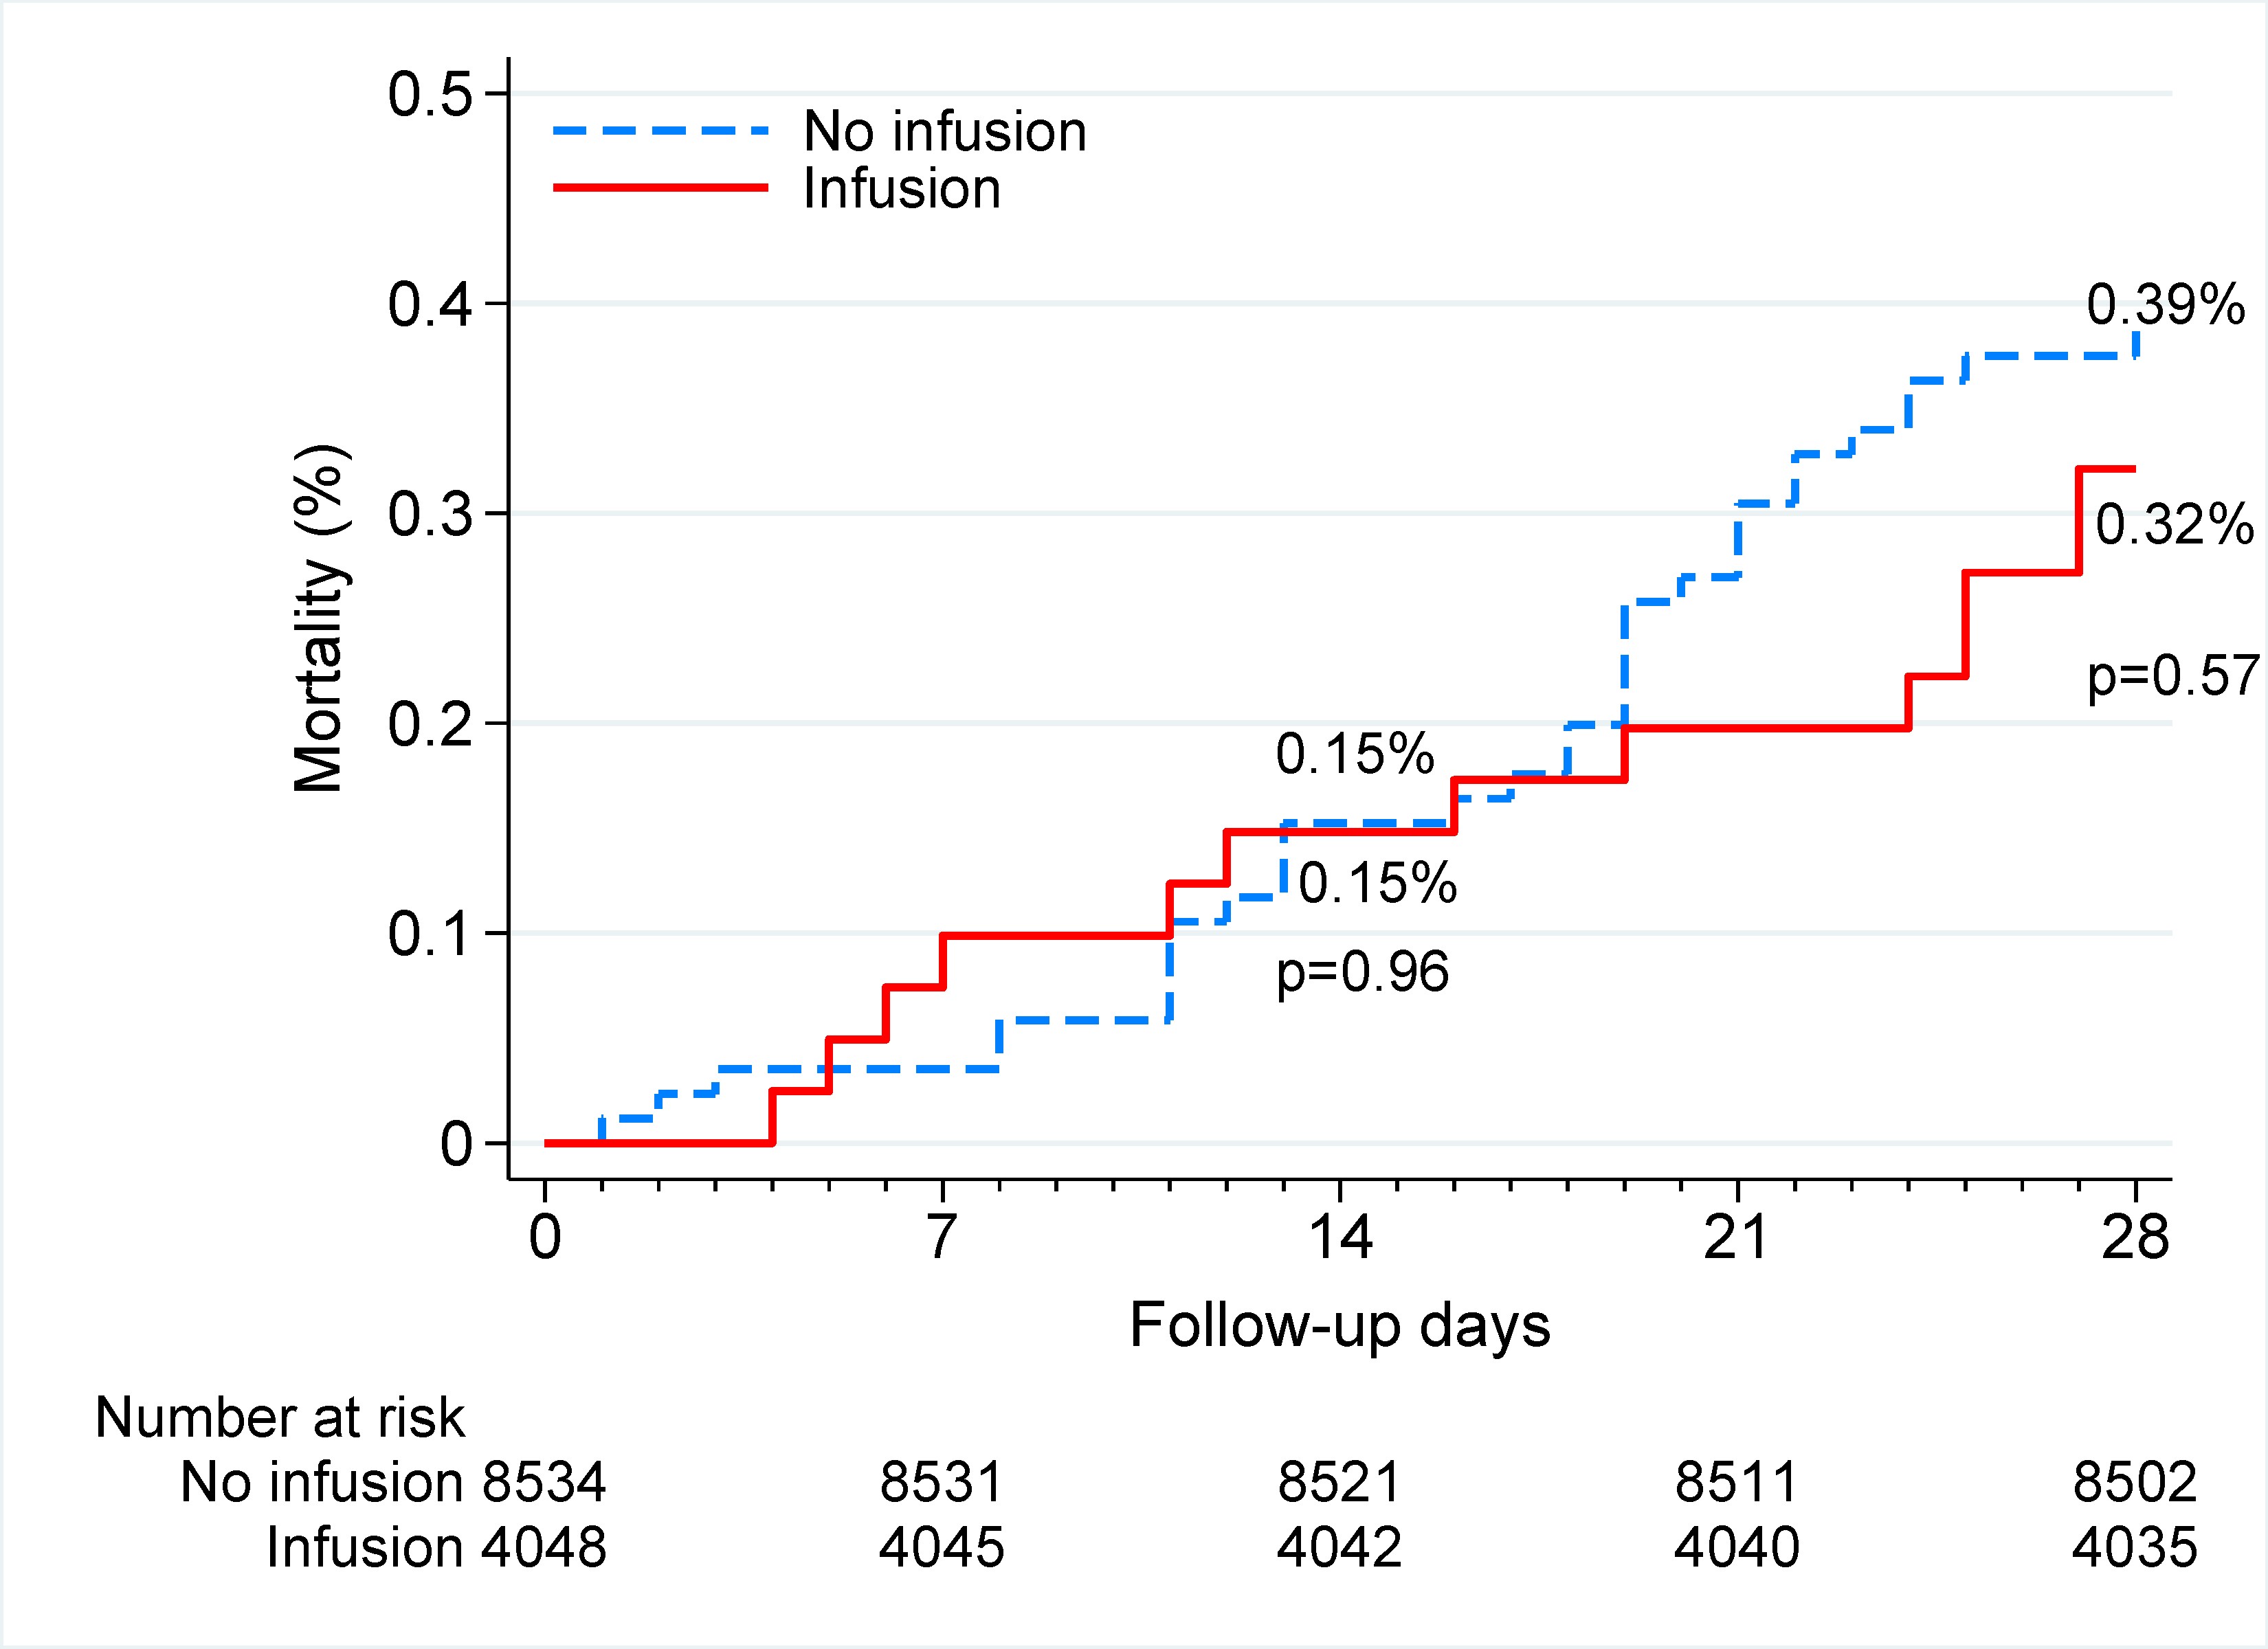
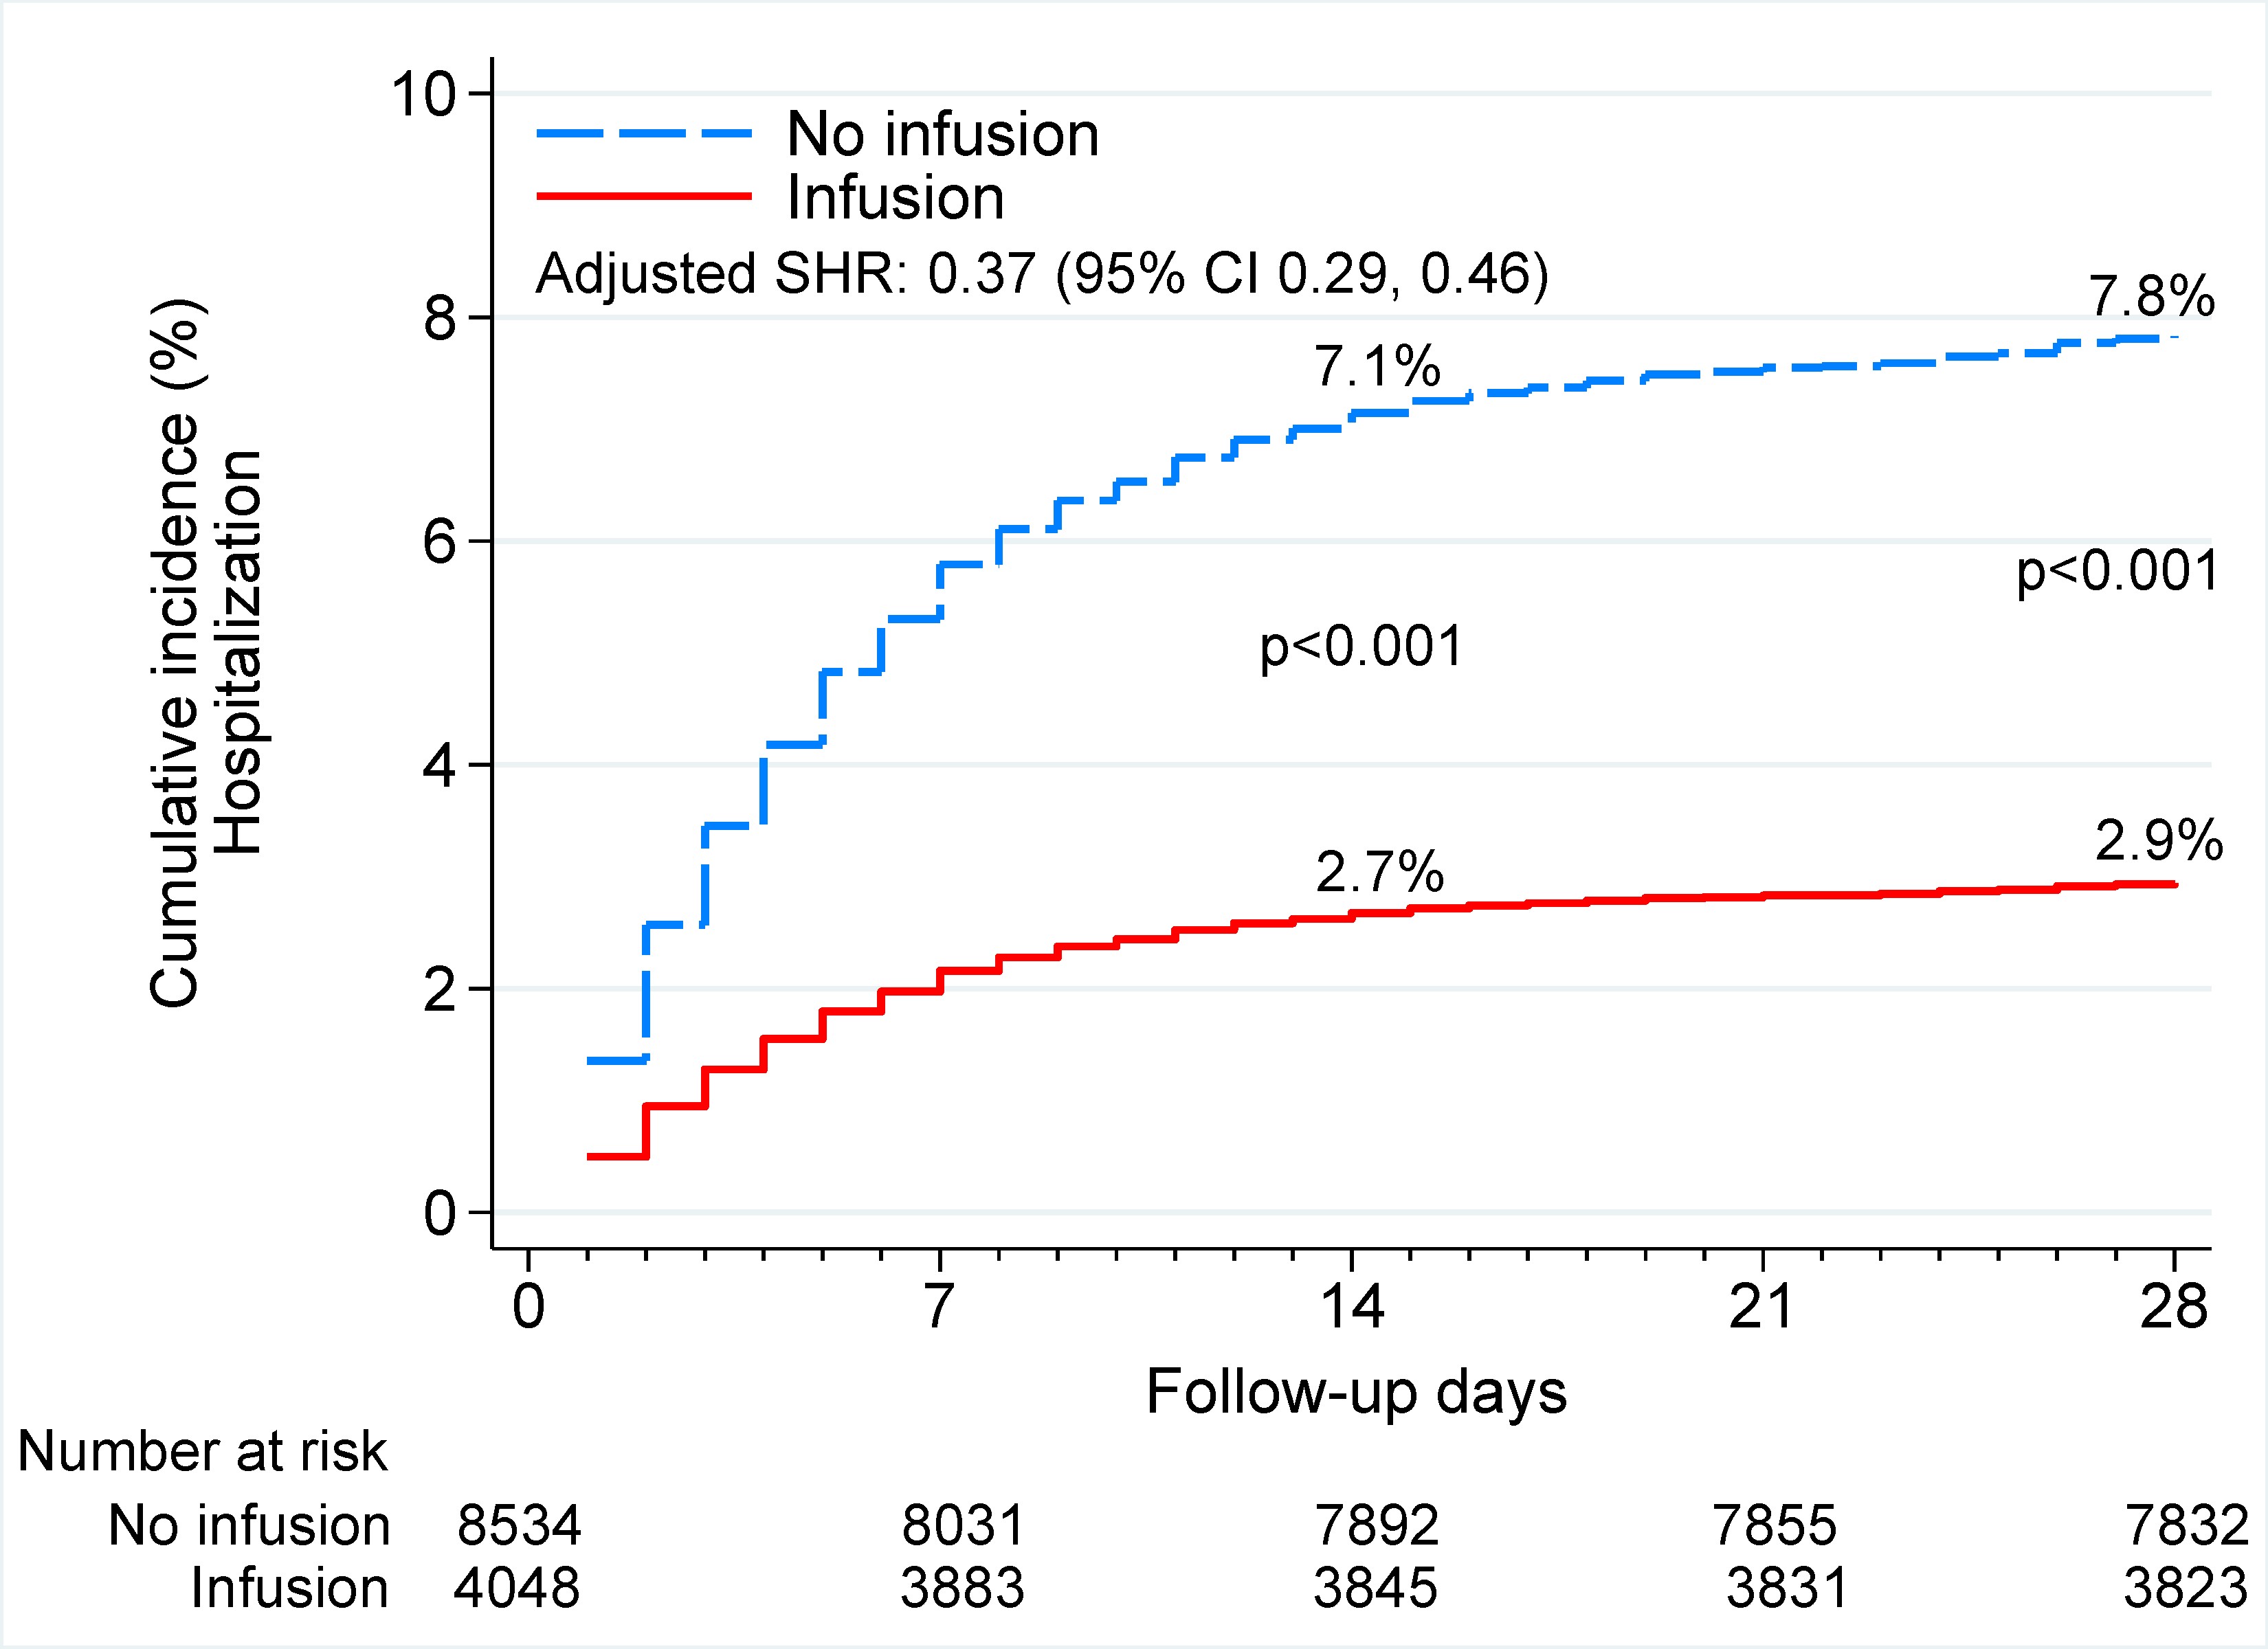
Hospitalization rates were significantly lower in the infused patient groups vs the propensity-matched cohort at day 14 postinfusion (5.3% vs 12.0%; aRR, 0.44; 95% CI, 0.34–0.56; P<.001) and at day 28 postinfusion (5.8% vs 12.7%; aRR, 0.45; 95% CI, 0.36–0.57; P<.001) (Table 2). The infused cohort also had significantly lower hospitalization incidence than the noninfused cohort within 14 (4.3% vs 9.4%; P<.001) and 28 days of the positive PCR date (4.6% vs 10.1%; P<.001) (Figure 2A). Infused patients also had lower risk of mortality within 28 days (aRR, 0.29; 95% CI, 0.09–0.90; P=.03) and lower ICU admission (aRR, 0.30; 95% CI, 0.15–0.61; P=.001) (Table 2). Survival analysis indicated that the infused cohort had lower mortality at 28 days compared with the noninfused cohort (0.28% vs 0.66%; P=.04). Mortality was not significantly different at 14 days between the 2 cohorts (Figure 2B). No difference was found in the median hospital length of stay or ICU length of stay (data not shown). Hospitalization rates were also significantly lower in the infused patients vs all noninfused COVID-19 patients, independent of propensity score matching (Supplementary Figures 1 and 2).
Multivariable Risk for Hospitalizations, Intensive Care Unit Admissions, and Mortality
| All Patients (Prematched Cohort) | Propensity Score Matched Cohort | |||||||||
|---|---|---|---|---|---|---|---|---|---|---|
| Total | No Infusion | Infusion | aRR | P Value | Total | No Infusion | Infusion | aRR | P Value | |
| (N=12582) | (n=8534) | (n=4048) | (95% CI) | (N=5758) | (n=2879) | (n=2879) | (95% CI) | |||
| 28-d hospital admission | ||||||||||
| No | 11653 (92.6) | 7831 (91.8) | 3822 (94.4) | (reference) | 5223 (90.7) | 2512 (87.3) | 2711 (94.2) | (reference) | ||
| Yes | 929 (7.4) | 703 (8.2) | 226 (5.6) | 0.43 (0.36–0.52) | <.001 | 535 (9.3) | 367 (12.7) | 168 (5.8) | 0.45 (0.36–0.57) | <.001 |
| 14-d hospital admission | ||||||||||
| No | 11723 (93.2) | 7882 (92.4) | 3841 (94.9) | (reference) | 5259 (91.3) | 2533 (88.0) | 2726 (94.7) | (reference) | ||
| Yes | 859 (6.8) | 652 (7.6) | 207 (5.1) | 0.42 (0.35–0.51) | <.001 | 499 (8.7) | 346 (12.0) | 153 (5.3) | 0.44 (0.34–0.56) | <.001 |
| 28-d mortality | ||||||||||
| No | 12536 (99.6) | 8501 (99.6) | 4035 (99.7) | (reference) | 5731 (99.5) | 2860 (99.3) | 2871 (99.7) | (reference) | ||
| Yes | 46 (0.4) | 33 (0.4) | 13 (0.3) | 0.32 (0.14–0.70) | .004 | 27 (0.5) | 19 (0.7) | 8 (0.3) | 0.29 (0.09–0.90) | .03 |
| ICU admission, in patients who were admitted | ||||||||||
| No | 871 (88.3) | 664 (88.7) | 207 (87.3) | (reference) | 496 (87.2) | 339 (86.7) | 157 (88.2) | (reference) | ||
| Yes | 115 (11.7) | 85 (11.3) | 30 (12.7) | 0.47 (0.34–0.65) | <.001 | 73 (12.8) | 52 (13.3) | 21 (11.8) | 0.45 (0.31–0.67) | <.001 |
| ICU admission, in all patients | ||||||||||
| No | 12467 (99.1) | 8449 (99.0) | 4018 (99.3) | (reference) | 5685 (98.7) | 2827 (98.2) | 2858 (99.3) | (reference) | ||
| Yes | 115 (0.9) | 85 (1.0) | 30 (0.7) | 0.31 (0.19–0.51) | <.001 | 73 (1.3) | 52 (1.8) | 21 (0.7) | 0.30 (0.15–0.61) | .001 |
Values are presented as No. (%). Adjusted risk ratios (comparing the infusion group with the no infusion group) were obtained from the multivariable generalized linear models for binary dependent variables. The models were adjusted for age, gender, race/ethnicity, quartiles of median income by zip code, body mass index, and comorbidities (chronic lung disease, chronic kidney disease, chronic heart disease, hypertension, diabetes).
Abbreviations: aRR, adjusted risk ratio; ICU, intensive care unit.
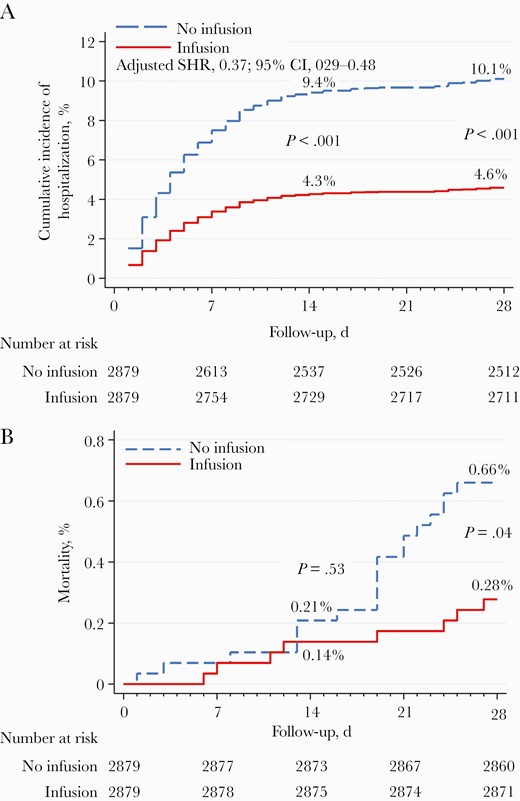
Hospitalization and mortality in the infused cohort vs the noninfused cohort. A, There were significant differences in day-14 and day-28 hospitalization rates in the propensity score-matched cohort using an adjusted cumulative incidence of hospitalization, competing risk model. B, Kaplan-Meier curves for mortality in the propensity score–matched cohort show a significant difference in mortality between the 2 groups at 28 days but not at 14 days. Abbreviation: SHR, subdistribution hazard ratio.
Hospitalizations Based on Age and BMI
When the infused and noninfused cohorts were stratified by age (<55, 55–64, and ≥65 years) and 28-day hospitalization was assessed, the mAb infusions were shown to be effective across all age groups (Supplementary Table 1); the effects were most pronounced in patients ≥65 years of age. Similarly, when patients were stratified by BMI (<25, 25–34, ≥35kg/m2), we found significant differences in 28-day hospitalizations in the groups with higher BMIs (25–34, ≥35kg/m2) (Supplementary Table 1).
Patient characteristics of the infused cohort have been stratified by the mAb treatments in Supplementary Table 2. Patients who received bamlanivimab and etesevimab appeared to be younger than patients in the other 2 mAb treatment groups.
Comparisons of Efficacy of mAb Treatments
We assessed the 14- and 28-day hospitalization rates, 28-day mortality, and ICU admissions based on the mAb infused: bamlanivimab alone, bamlanivimab and etesevimab, or casirivimab and imdevimab (Table 3). There were significantly fewer 14- and 28-day hospitalizations in the group receiving casirivimab and imdevimab vs those who received bamlanivimab alone or bamlanivimab and etesevimab (Table 3); there were no significant differences between bamlanivimab alone or bamlanivimab and etesevimab. Similar to the overall data, we observed no significant differences in ICU utilization or 28-day mortality among the 3 mAb formulations (data not shown).
Proportions of Hospitalizations by Treatment Received
| All Patients (Prematched Cohort) | |||||||
|---|---|---|---|---|---|---|---|
| Bam [1] | Bam/Ete [2] | Cas/Imd [3] | P Value | ||||
| (N=2427) | (n=473) | (n=1148) | Overall | [1] vs [2] | [2] vs [3] | [1] vs [3] | |
| 28-d hospital admission | 144 (5.9) | 37 (7.8) | 45 (3.9) | .004 | .12 | .001 | .01 |
| 14-d hospital admission | 129 (5.3) | 35 (7.4) | 43 (3.7) | .01 | .07 | .002 | .04 |
| Propensity Score–Matched Cohort | |||||||
| Bam [1] | Bam/Ete [2] | Cas/Imd [3] | P Value | ||||
| (N=1718) | (n=346) | (n=815) | Overall | [1] vs [2] | [2] vs [3] | [1] vs [3] | |
| 28-d hospital admission | 113 (6.6) | 27 (7.8) | 28 (3.4) | .003 | .41 | .002 | .002 |
| 14-d hospital admission | 102 (5.9) | 25 (7.2) | 26 (3.2) | .01 | .36 | .003 | .004 |
Values are presented as No. (%). Comparisons in the prematched cohort were conducted by the chi-square test. Comparisons in the propensity score–matched cohort were obtained from the GLM analysis weighted for the matched sample.
Abbreviations: Bam, bamlanivimab; Ete, etesevimab; Cas, casirivimab; Imd, imdevimab.
The multivariable subdistribution hazard model confirmed that the infused cohort had lower risk of hospitalization at 28 days (subdistribution hazard ratio, 0.37; 95% CI, 0.29–0.48; P<.001). Age, Hispanic and Asian ethnicity, body mass index, chronic lung disease, chronic kidney disease, and diabetes were associated with hospitalization risk (Supplementary Table 3). Additional data on patient characteristics for patients who hospitalized, admitted to the ICU, or died within 28 days are presented in Supplementary Table 4. Differences in the demographics, comorbidities, and outcomes between patients who were included in the propensity score matching and patients who were not matched are presented in Supplementary Table 5.
DISCUSSION
In this large, retrospective, propensity-matched control study, we found that rapid implementation of mAb infusion resulted in significantly decreased rates of hospital admission at 14 and 28 days and mortality at 28 days postinfusion. The greatest benefit was observed among patients 65 years and older with BMI≥35kg/m2. The overall results confirm the findings of clinical trials and other published data on the efficacy of early administration of passive immune therapy for COVID-19 [7–12].
From very early in the pandemic, widespread efforts focused on passive immune therapy as a therapeutic option [4, 5, 21, 22]. When antispike protein mAbs received EUA for the treatment of high-risk outpatients, our system of hospitals rapidly implemented a process to treat patients throughout the Houston Metropolitan area. This was a multidisciplinary effort and resulted in a model that can be replicated by other academic medical centers throughout the country [13]. Since the inception of the infusion program, Houston Methodist has treated 11835 COVID-19 outpatients with mAbs. Our study results show that infusion results in a 55% reduction in the rate of hospitalization at 28 days postinfusion (Table 2). We also saw a significant reduction in mortality and ICU admissions for the mAb-treated group, which is similar to the outcomes reported by Ganesh et al. [10].
This is the first study to perform a large-cohort comparison of 3 of the 4 mAb treatments available. Our results indicate that infusion with casirivimab and imdevimab resulted in better outcomes. This finding could be due to a number of factors. These include the limited sample size compared with the other 2 formulations, changes in the patient cohorts as the EUA criteria evolved and became more inclusive, the increased vaccination of high-risk populations, and/or changes in circulating variants that could have affected efficacy. Unfortunately, due to sample size limitations among the variants other than B.1.1.7, it was not possible to specifically determine whether mAb therapies were less efficacious in patients infected with certain variants. Of note, only 2 patients within this cohort were identified to have the B.1.617.2 variant.
Adding real-world data to that collected in randomized controlled trials is critical in addressing treatment efficacy in a rapidly evolving pandemic. Patients included in this study had a wider age range and more comorbidities than patients included in previously published clinical trials [7, 9, 23]. Additionally, the number of treated patients was much higher than that of the clinical trials or other published cohorts [6, 10–12]. Because of the size of and variation within the cohorts and the novel patient populations included, this study is unique and critical to the emerging literature regarding mAb therapy.
We acknowledge that our study has several limitations. This was a retrospective observational study with propensity score–matched controls reflecting real-world experiences and outcomes. We chose to match our cohorts based on readily available, objective measures known to affect outcomes; potentially relevant covariates may have been omitted unintentionally from the matching algorithm. Our mAb infusion program was limited by the available treatment options, and most patients received bamlanivimab infusion. The outcomes likely reflect susceptibility of the local circulating SARS-CoV-2 variants to the mAbs in use at the time of infusion. Our findings may not apply to all COVID-19 patients because of regional heterogeneity in circulating variants or heterogeneity in medical care. For example, in the metropolitan Houston region, Delta variants accounted for 85% of all COVID-19 cases as of July 12, 2021 (data not shown). Additionally, COVID-19 vaccine status was not accounted for within the study population due to inconsistencies in reporting for those vaccinated outside of our hospital system. We note that the results reflect the experience of 1 system of 8 hospitals in the Houston metropolitan region that has a relatively uniform approach to patient care and COVID-19 patient admission criteria. Despite these limitations, our data may help to inform the science and logistics of future efforts to use mAb therapy for other emerging and rapidly disseminating infectious diseases and can provide a roadmap for rapid implementation of this life-saving therapy.
Monoclonal antibodies are susceptible to the evolution of viral resistance mutations in target epitopes, and the EUA for bamlanivimab was revoked due to demonstrated resistance of emerging variants (https://www.fda.gov/media/147629/download). Similarly, the EUA for bamlanivimab and etesevimab was recently revoked (June 25, 2021), due to the increasing prevalence of the P.1 and B.1.351 variants (www.covid19.lilly.com/bam-ete), which have been shown to escape certain mAbs [24, 25]. Combination mAbs that bind nonoverlapping epitopes reduce the risk of resistance and have a clear advantage, and continued monitoring and assessment of emerging variants and their susceptibility to natural or induced immunity and therapeutic antibodies remains crucial.
In summary, our propensity score–matched analysis confirms that early infusion of neutralizing mAbs to COVID-19 patients significantly reduced hospitalization and mortality among a large cohort of high-risk individuals. These data support continued widespread efforts to make early passive immune therapy available to COVID-19 patients.
Supplementary Data
Supplementary materials are available at Open Forum Infectious Diseases online. Consisting of data provided by the authors to benefit the reader, the posted materials are not copyedited and are the sole responsibility of the authors, so questions or comments should be addressed to the corresponding author.
Acknowledgments
The authors acknowledge Vicki Brownewell, RN, Jennifer Berry, RN, Pauline Todd, RN, Pablo Vasquez, RN, Samantha McBroom, RN, Amy Sebastian-Deutsch, RN, Miguel Casas, RN, Laduska James, RN, Jennifer Vera, RN, and Serenity Glazer, RN, who were essential to establishing and staffing the infusion sites and were key members of this team. Pharmacy administrative specialists Isha Rana, PharmD, and Elsie Rizk, PharmD, pharmacy residents Taryn Eubank, PharmD, Abdullah Alshehry, PharmD, Hala Halawi, PharmD, Jingshi “Iris” Chen, PharmD, and Wenfei Wei, PharmD, and pharmacy student Hokil Hwang were critical in managing the referral volumes and educating patients. Our operations and inventory pharmacy teams were instrumental in managing timely medication delivery. Jane Povey and the HMH infusion scheduling team were also an important part of the team and worked to ensure timely scheduling of patients. Courtenay Bruce and the CareSense team established important digital patient interactions through CareSense, allowing us to monitor the patients’ outcomes and experience following infusions. Debbi Garbade, RN, and the system patient safety RNs were key in conducting postinfusion phone calls. Roberta Schwartz, PhD, Marc Boom, MD, Dirk Sostman, MD, and Edward A. Jones provided vision and institutional resolve to this initiative. Noemi Garcia, RN, and the EPIC team were essential to starting the program. Key clinical leaders who helped to establish the referral process early on include Denise McCall, RN, Sarah Pletcher, MD, Rachel Bishop, MD, and Joshua Septimus, MD, who continue to be important partners.
Patient consent. The study was reviewed and approved by the Houston Methodist Research Institute Institutional Review Board (IRB PRO00029666). Given the study design, patients’ written consent was not required. However, verbal and written education was provided to all patients to ensure that they understood the EUA language. Patients were consented to receive the mAb therapy before scheduling.
Financial support. This study did not receive financial support from an outside source.
Potential conflicts of interest. All authors: no reported conflicts of interest. All authors have submitted the ICMJE Form for Disclosure of Potential Conflicts of Interest. Conflicts that the editors consider relevant to the content of the manuscript have been disclosed.


Comments