
A Data-Driven Clustering Analysis for the Impact of COVID-19 on the Electricity Consumption Pattern of Zhejiang Province, China


1
Department of Architecture and Built Environment, University of Nottingham Ningbo China, Ningbo 315100, China
2
The Network for Education and Research on Peace and Sustainability (NERPS), Hiroshima University, Hiroshima 739-8511, Japan
3
School of Computer Science, University of Nottingham Ningbo China, Ningbo 315100, China
*
Author to whom correspondence should be addressed.
Energies 2021, 14(23), 8187; https://doi.org/10.3390/en14238187
Submission received: 28 October 2021
/
Revised: 30 November 2021
/
Accepted: 2 December 2021
/
Published: 6 December 2021
(This article belongs to the Special Issue COVID-19 Pandemics: Energy, Economic, Environmental, Social, Policy and Health Impacts)
Abstract
:The COVID-19 pandemic has impacted electricity consumption patterns and such an impact cannot be analyzed by simple data analytics. In China, specifically, city lock-down policies lasted for only a few weeks and the spread of COVID-19 was quickly under control. This has made it challenging to analyze the hidden impact of COVID-19 on electricity consumption. This paper targets the electricity consumption of a group of regions in China and proposes a new clustering-based method to quantitatively investigate the impact of COVID-19 on the industrial-driven electricity consumption pattern. This method performs K-means clustering on time-series electricity consumption data of multiple regions and uses quantitative metrics, including clustering evaluation metrics and dynamic time warping, to quantify the impact and pattern changes. The proposed method is applied to the two-year daily electricity consumption data of 87 regions of Zhejiang province, China, and quantitively confirms COVID-19 has changed the electricity consumption pattern of Zhejiang in both the short-term and long-term. The time evolution of the pattern change is also revealed by the method, so the impact start and end time can be inferred. Results also show the short-term impact of COVID-19 is similar across different regions, while the long-term impact is not. In some regions, the pandemic only caused a time-shift in electricity consumption; but in others, the electricity consumption pattern has been permanently changed. The data-driven analysis of this paper can be the first step to fully interpret the COVID-19 impact by considering economic and social parameters in future studies.
1. Introduction
The ongoing COVID-19 pandemic has highlighted some major energy implications [1,2,3] with tangible impacts on trends of production and consumption. While it may be too early to consider the relationship between the pandemic and energy transitions [4], there could be the possibility of energy crises [5], wider effects due to energy insecurity [6], and changes in energy demand and consumption [7].
With regards to energy demand, in particular, we see larger impacts on electricity consumption trends [8] connecting to a larger chain of energy use, business operations, trades, productions, etc. According to the reports from the International Energy Agency (IEA) [9] and Electric Power Research Institute (EPRI) [10], there was a rapid decline in electricity consumption of between 15 and 30% compared to the 2019 level across Europe and India during the initial outbreak of COVID-19 in the spring of 2020. In China, this number is approximately 10% [9]. However, the impact is not just on the absolute change of the electricity consumption level. It also impacts the behavior patterns of electricity consumption. For example, studies in [8,11,12,13] show that the pandemic has changed the daily peak electricity consumption time in homes and hospitals in some areas such as Canada and European countries because of the “stay-at-home” confinement measures and the treatment of COVID-19 patients. While the above studies prove the short-term impacts of the pandemic on electricity consumption, some other impacts may have a longer-term effect [14] and make irreversible changes to energy demand, generation, pricing, and grid stability [15]. Partially, this is because the pandemic may permanently change people’s energy-use behaviors; hence, the electricity consumption patterns may be permanently changed [2,14,16,17]. There are also tangible changes in sectoral energy consumption and demand [18,19]. For example, during the pandemic, the weekday electricity consumption in Europe was minimized, and the weekend consumption was similar to the pre-COVID-19 period [19,20] because of the different impacts of the pandemic on different sectors. Krarti and Aldubyan [17] also find that, in major European, Asian, and North American countries, the residential electric energy consumption has increased by as much as 30%. Still, evidence shows that industrial and commercial energy consumption has significantly reduced.
The change in electricity consumption patterns has also impacted the supply and distribution of electricity. For example, in Europe and the UK, a larger proportion of electricity is generated by renewables, and the coal-fired generation share is reduced [12,21,22]. In the U.S., the change in the electricity generation pattern is different in different independent service operators. The Pennsylvania-New Jersey-Maryland Interconnection (PJM) and Midcontinent ISO (MISO) observe a reduction in coal-fired generation and an increase in renewable generations [23]. In Europe, the pandemic does not affect grid stability as the European grid balances the change in electricity demand [12,22]. However, based on simulations, Mahfuz Alam and Ali [24] find that changes in electric energy usage patterns will even negatively impact electricity facilities such as distribution transformers.
As the existing literature highlights, there are some disruptions in electricity systems, demand, and generation [12], which means that the electricity sector is currently facing significant challenges [25]. Industrial production change is one significant factor to impact electricity consumption patterns, indicating the significance of exogenous factors [11], such as the pandemic, its lockdown measures, and correlated changes to electricity consumption behaviors. While confinement measures in some places restricted industrial productions during the pandemic, later compensatory measures then pushed some of the industrial production levels even higher to reduce the negative impacts on the global economy. However, this matter is not ubiquitous but related to specific contexts, types of production, and types of economic patterns. In particular, for the lockdown case, we see changes in production activities that were either suspended or reversed at first [26]. Thus, there were temporary effects that led to later readjustments, followed by faster and larger production levels and then the immediate increase in electricity demand trends. In this study, we aim to expand on this matter by evaluating the electricity consumption data of specific regions, investigating the impacts of the COVID-19 on the electricity consumption patterns in the context of China. We investigate this from a holistic perspective but focus on a specific context with a range of industries and a relatively higher industrial production level. In this context, the initial shock from the pandemic was short-lived, but the later impacts of the pandemic are expected to be long-term.
The pandemic impacts on electricity consumption patterns are convoluted and sometimes cannot be fully revealed by simple data comparison. Therefore, many studies use statistical and machine learning methods to obtain statistically valid conclusions. For example, to confirm the electricity consumption change in a residential building, Rouleau and Gosselin [13] performed a Z-test and concluded that the electricity consumption increased with statistical significance in the first month of the pandemic. Similarly, Alasali et al. [27] performed a time-series analysis on the 5-year electricity consumption data of Jordan and concluded that the pandemic has changed not only the consumption level but the seasonal trend and time-series correlation in electricity consumption. Delgado et al. [28] use the joinpoint regression method and find COVID-19 has created a trend change in the electricity consumption in Brazil with strong statistical significance. A similar study in [29] also confirms the change of electricity consumption behaviors in the U.S. by using a data-driven load forecast method.
To summarize, the existing studies find COVID-19 has produced fundamental changes to electricity consumption in many countries throughout the world. The changes are reflected not only in the level of electricity consumption but also in electricity consumption patterns. The changes in different sectors can be dramatically different, so analysis must be performed in a context. In addition, statistical and machine learning methods can better reveal the impacts of the pandemic to obtain statistically solid conclusions. Some research gaps are found in the existing studies. Firstly, most analyses are based on the electricity consumption data of a single region. Secondly, many studies focus on the analysis of electricity consumption in Europe and the U.S. The impact of COVID-19 on electricity consumption in China has not been adequately studied. Clustering is a powerful tool to reveal hidden interrelationships in a large dataset. Therefore, this study aimed to use clustering to analyze the impact of COVID-19 on the time-series industrial-driven electricity consumption of a group of regions in China.
The contributions of this paper include (1) a proposal for a new method to use clustering to quantifiably analyze the impact of COVID-19 on the electricity consumption of a group of regions; (2) a quantifiable analysis of the impact of COVID-19 on China’s electricity consumption pattern. This paper is organized as follows: Section 2 will describe the electricity consumption dataset used in this paper; Section 3 will describe the clustering-based method and analysis workflow; Section 4 will present the analysis results using the clustering-based method; Section 5 will discuss the findings; Section 6 concludes this study.
2. Industrial-Driven Electricity Consumption Dataset
This study was performed based on the electricity consumption data of the administrative regions in the Zhejiang Province of China. Zhejiang Province is located on the east coast of China, approximately 650 Km away from Wuhan, the initial epicenter of the COVID-19 outbreak in late 2019/early 2020. The Zhejiang Province is one of the industrial centers of China. In 2019, Zhejiang was ranked as 4th in industrial added value among 31 provincial administrative districts in mainland China, and its GPD reaches 6235 billion RMB [30]. Due to the fast lockdown policy in China, most cities in China, except Wuhan, have not experienced large numbers of COVID-19 cases, and this includes the Zhejiang province. The total number of COVID-19 cases in the Zhejiang province is 1499, while this number in the Hubei province (where Wuhan is located) is 68,311 (up to the 3rd of November 2021) [31], even though Zhejiang was ranked as third among 34 provincial-level districts in China in terms of confirmed COVID-19 cases at the beginning of the COVID-19 pandemic [31], and strict city lock-down policies were enforced. Therefore, as an industrial center that was not directly affected by the initial outbreak of COVID-19 in Wuhan, the data of the Zhejiang province is a good sample to reveal the impact of the pandemic on the electricity consumption pattern in other similar industrial cities in China.
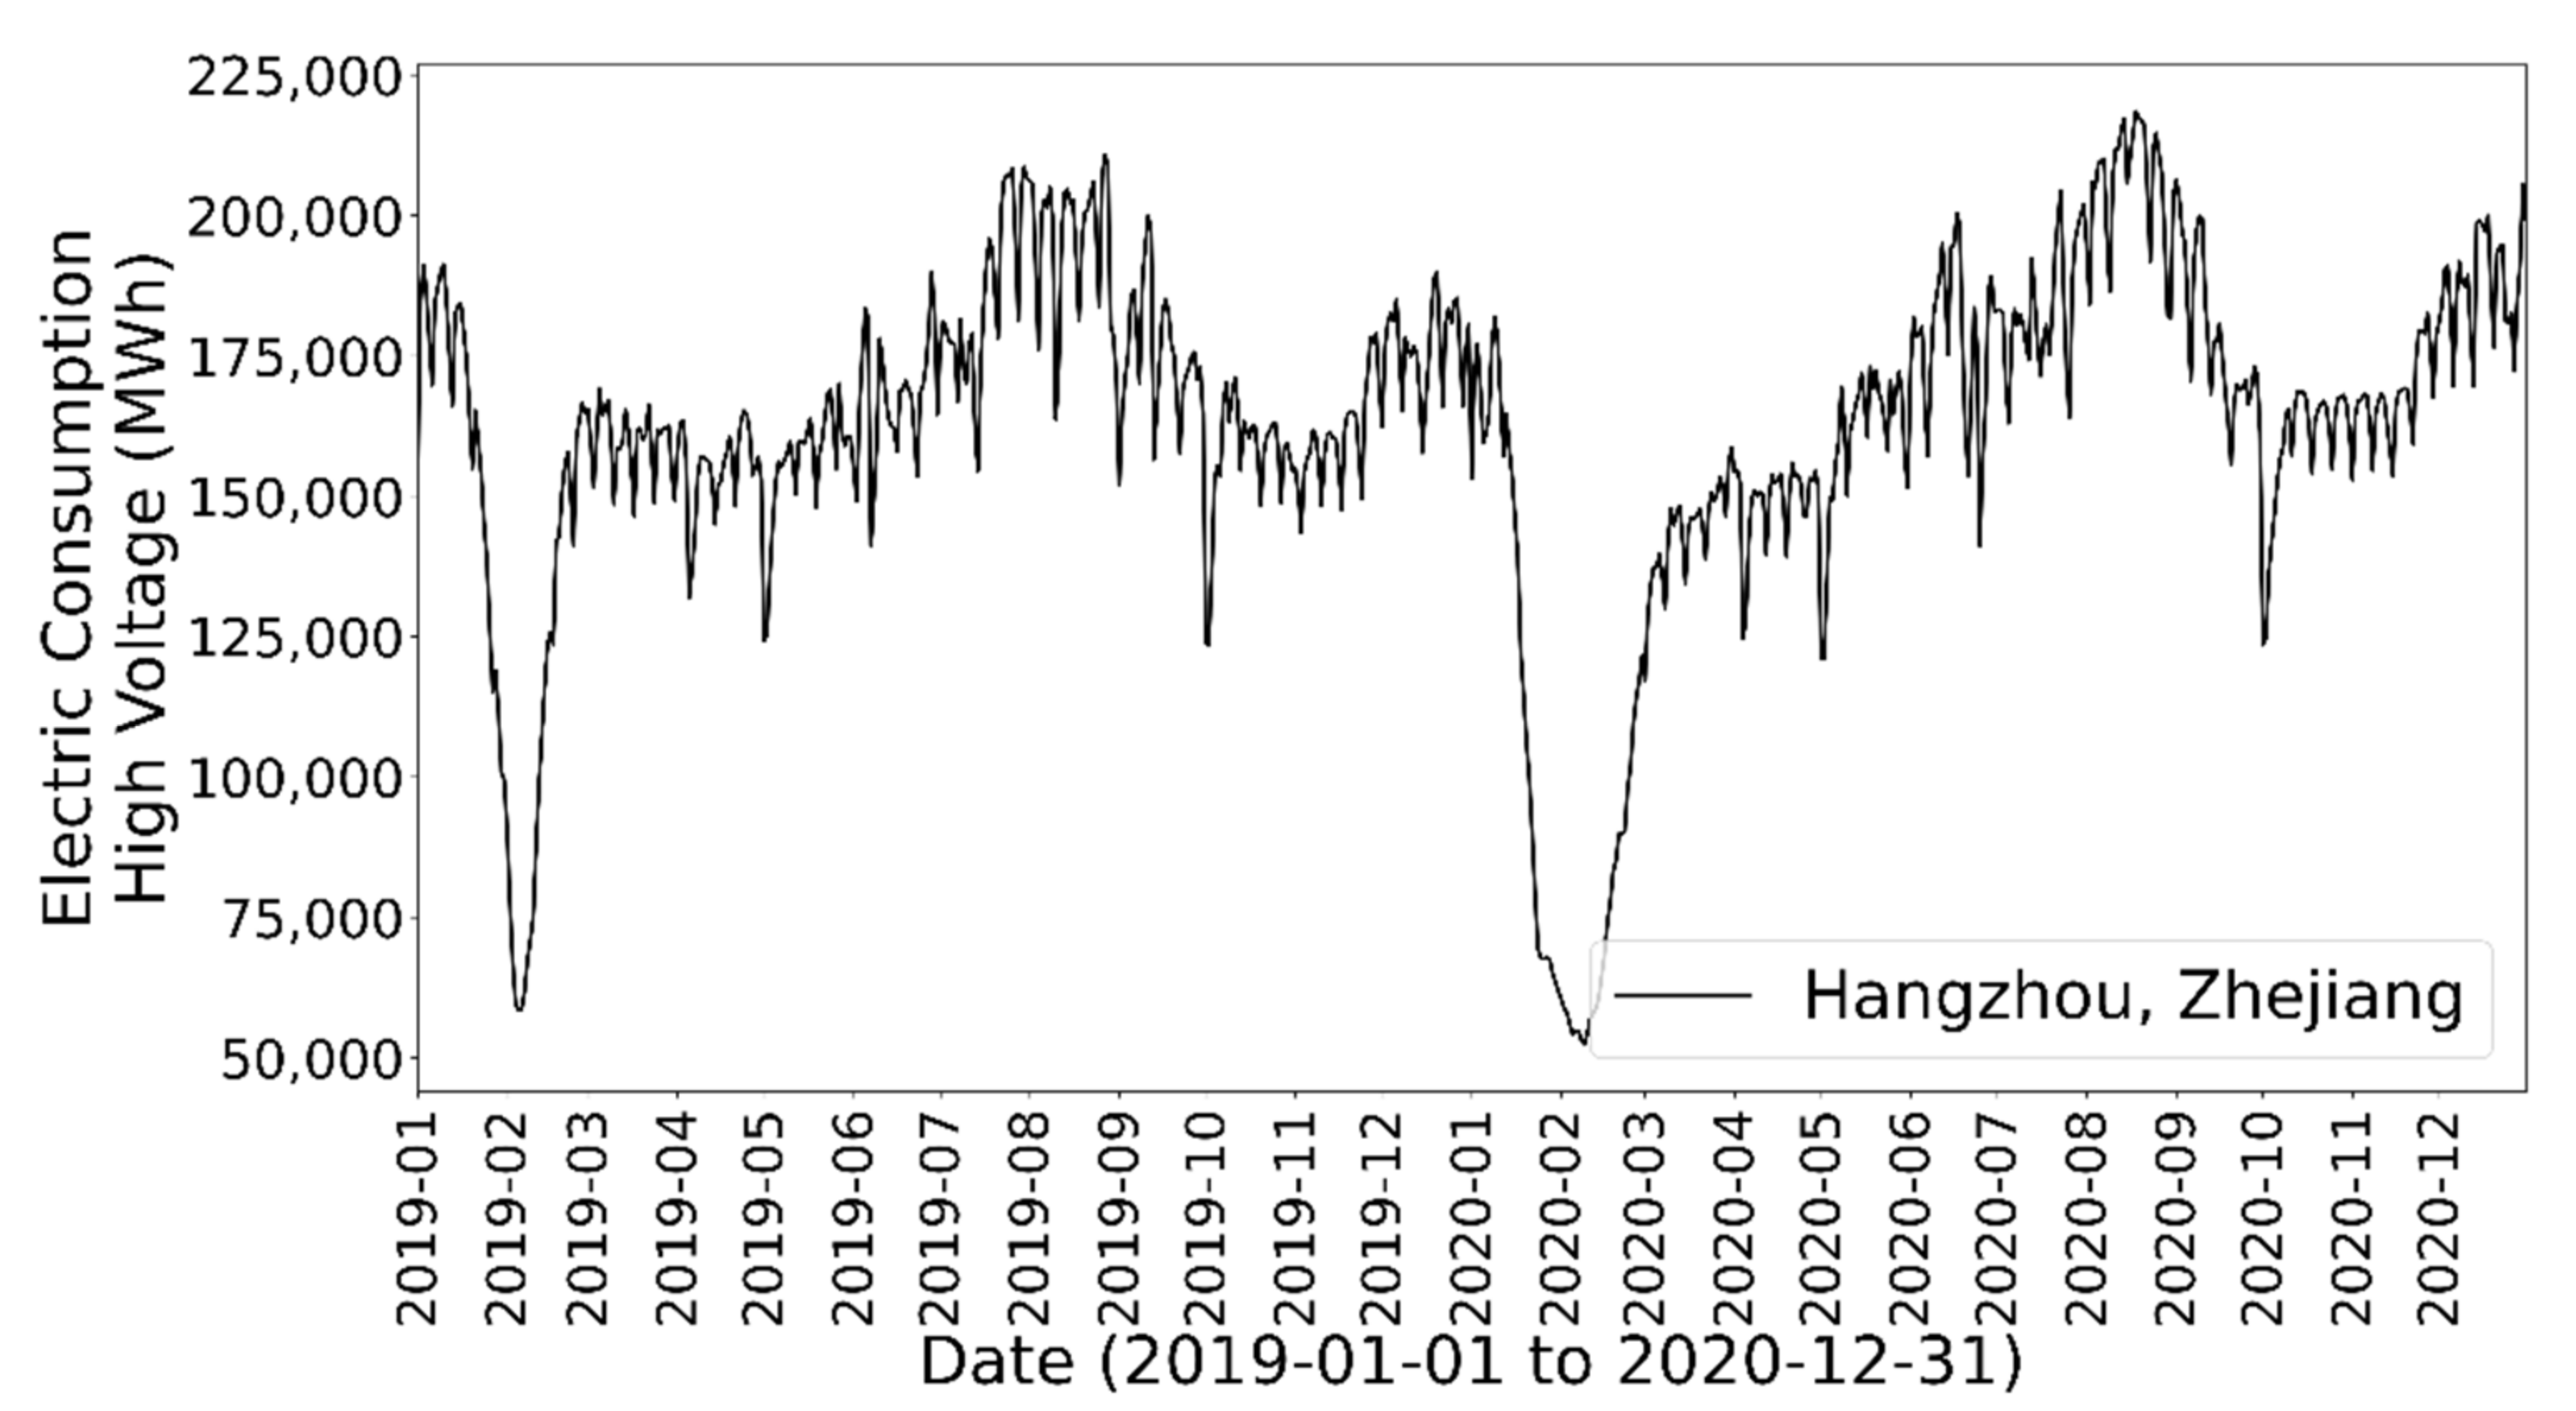
The basic information of the electricity consumption dataset is summarized in Table 1. The dataset contains daily total high-voltage (higher than 10 kV, mainly industrial use) electricity energy consumption of 87 administrative regions (districts) in the Zhejiang province. The record length of most of the data is from January 2019 to December 2020. Based on the data of daily COVID-19 cases of China [31], the daily number of new cases peaked around early February of 2020 and almost vanished around mid-March of 2020. Therefore, the electricity consumption dataset covers the pre-COVID-19, in-COVID-19, and post-COVID-19 periods of China. Figure 1 shows one sample of the data, the electricity consumption of Hangzhou (the capital city of the Zhejiang province). It is shown that, before the outbreak of COVID-19, the electricity consumption was stable except for the Chinese New Year holiday period (February of 2019); after the outbreak of COVID-19 in Wuhan in late January of 2020, the electricity consumption remained low for a few weeks before it climbed up to the level similar to 2019. The trend of the data is as expected.
3. Methodology
3.1. Analysis Workflow
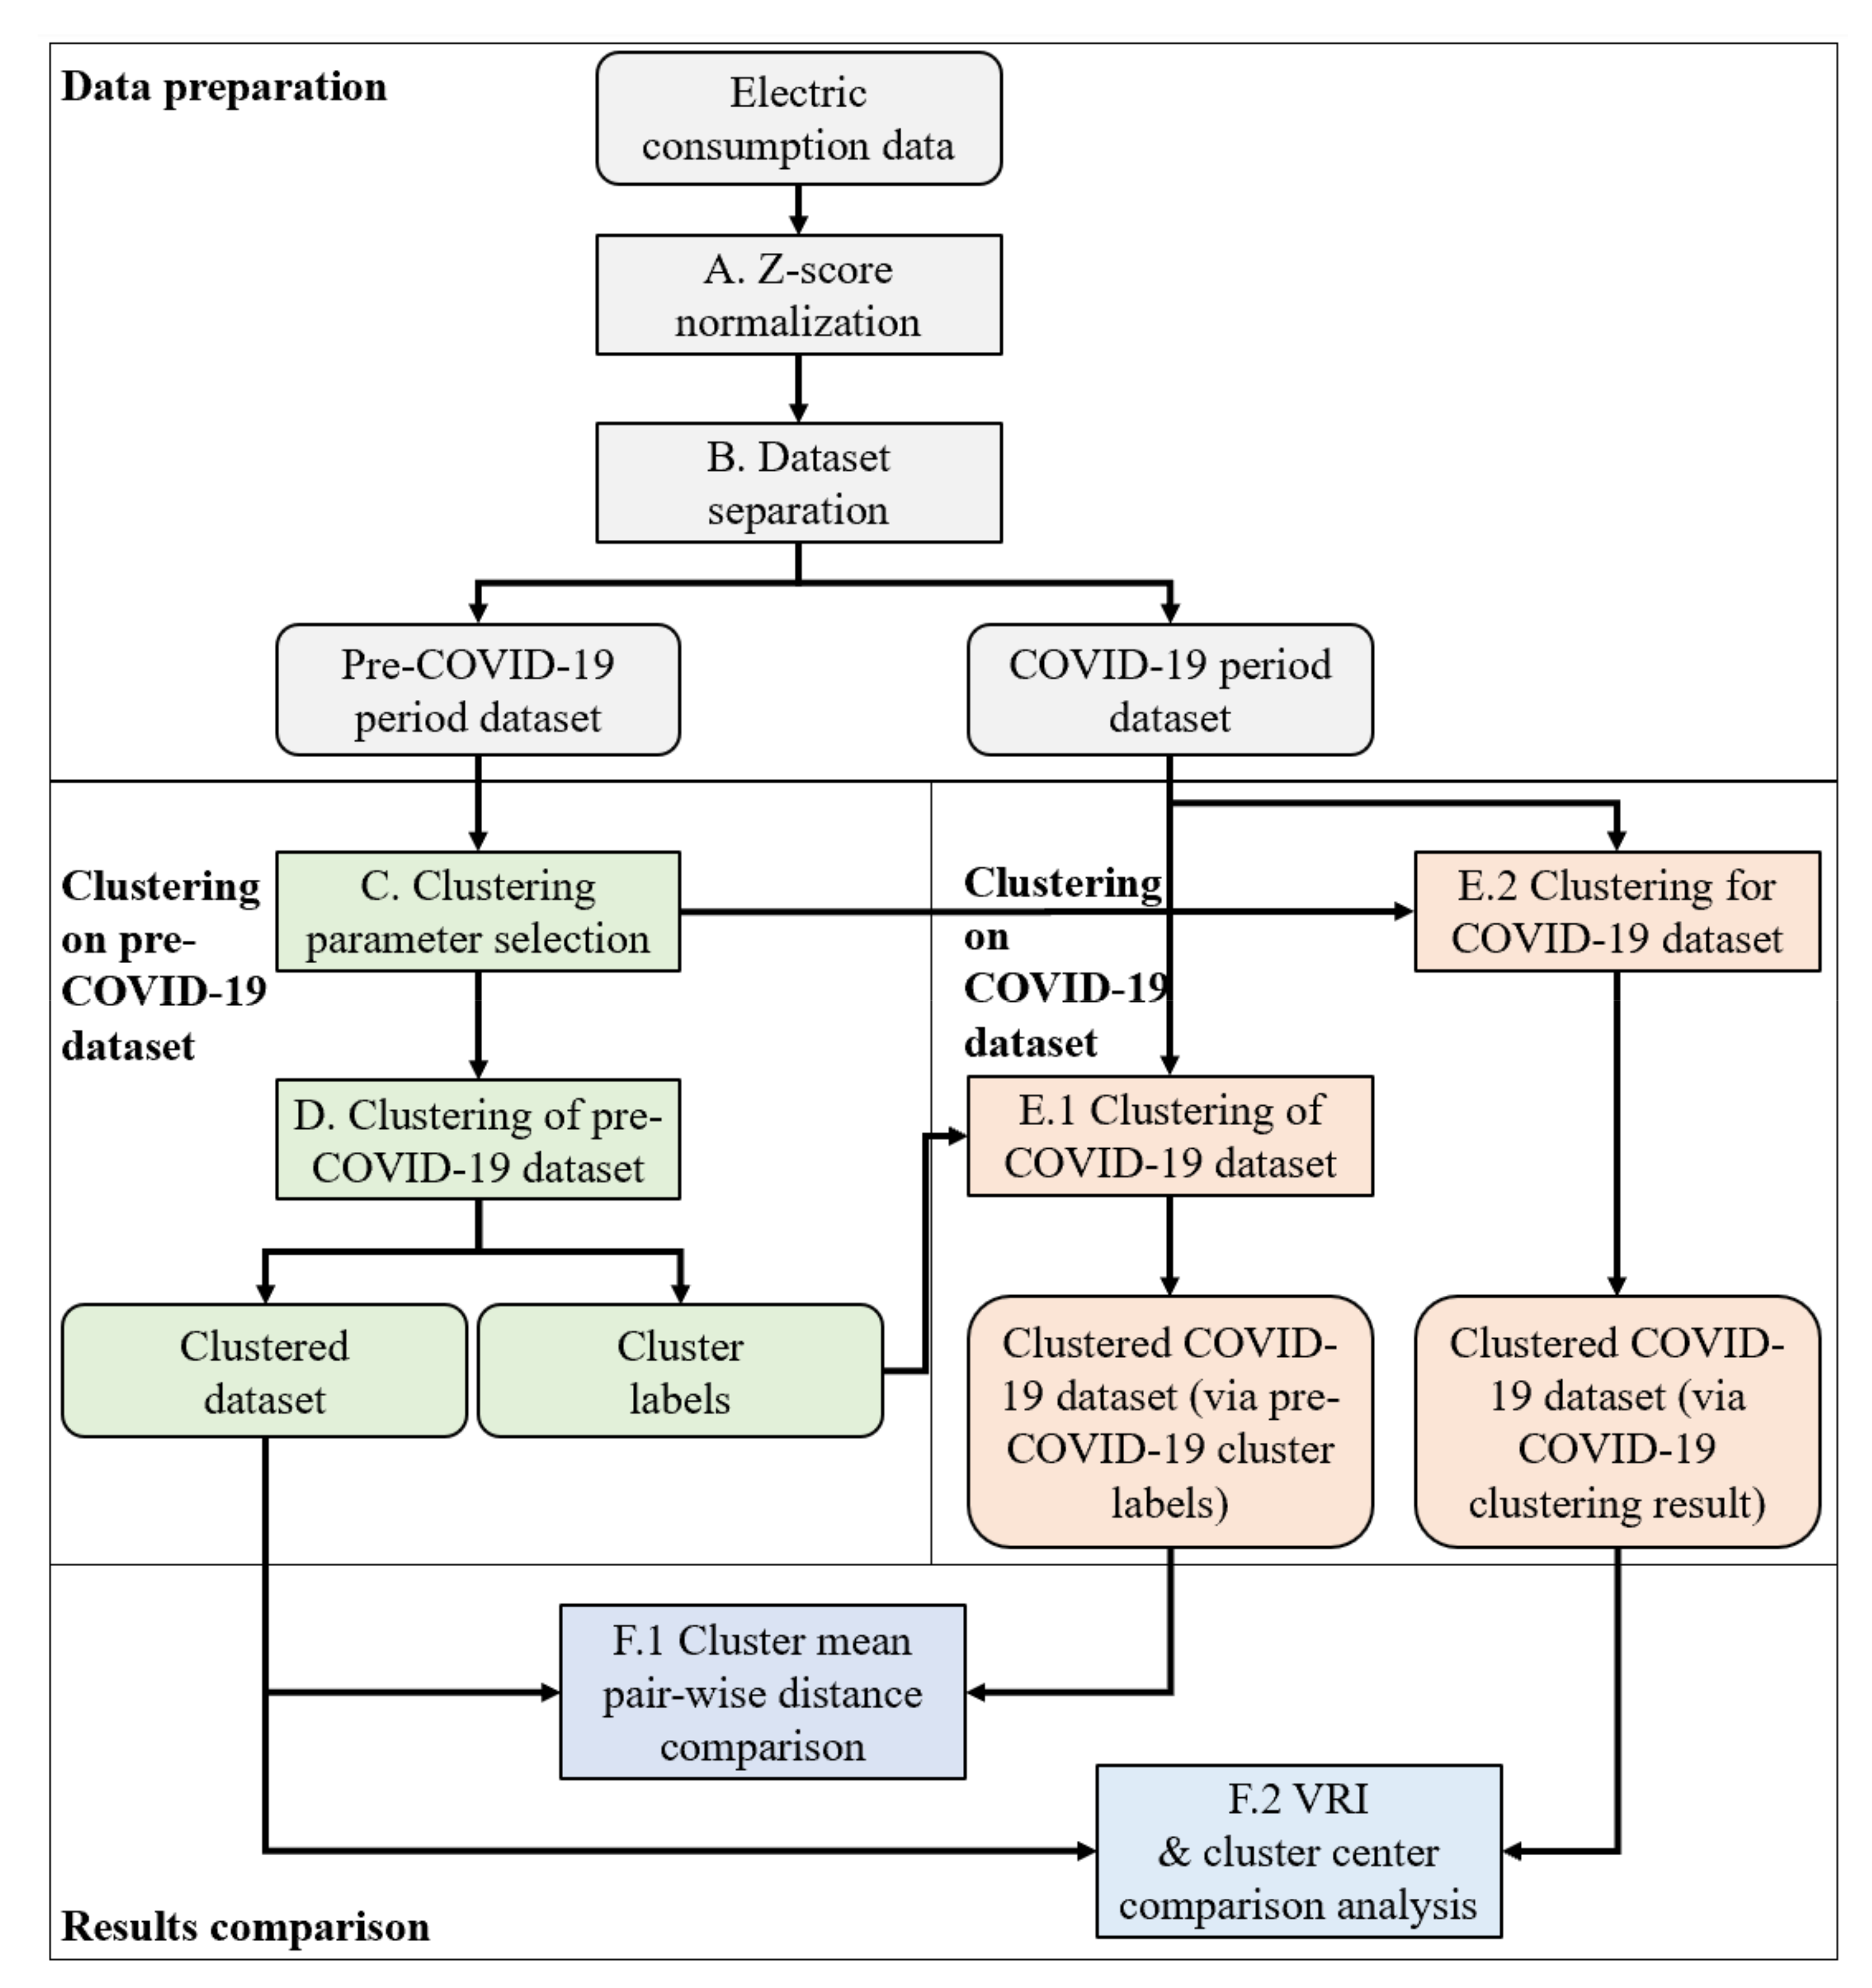
The overall analysis workflow is shown in Figure 2. The overall analysis is divided into four steps:
- Data preparation: This step pre-processes the electricity consumption dataset for the later analysis, including data cleaning/normalization and dataset separation;
- Clustering on the pre-COVID-19 dataset: This step uses the dataset of the period before the pandemic and performs the clustering parameter selection to obtain the clustering result;
- Clustering on COVID-19 dataset: This step uses two different approaches to perform clustering on the electricity consumption dataset after the COVID-19 pandemic;
- Results comparison: This step performs a comparison analysis on the clustering results obtained from the datasets in two different periods, including the pre-COVID-19 period and COVID-19 period. The analysis reveals the impact of the pandemic on the electricity consumption pattern.
The following subsections explain the different steps in detail.
3.2. Data Normalization (Step A)
Data normalization was to eliminate data variation and homogenous scale datasets according to particular attributes. Indeed, this was used to remove various scales of data attributes especially when they have been provided by different data sources. In this study, electricity consumption data from multiple regions in the Zhejiang province were collected, and the consumption level varied significantly among the different regions. Therefore, data normalization was required to scale the multi-region electricity consumption data to the same level.
Z-score normalization was used in this study as shown in Equation (1), where is z-score normalized electricity consumption data of region i, is original electric consumption data of region i, , and are the mean and standard deviation of the original electricity consumption of region i. Note that Z-score normalization was performed for the electricity consumption data over the period from the 1 January 2019 to the 5 July 2020, which covers both the pre-COVID-19 period and COVID-19 period:
3.3. Dataset Separation for Pre-COVID-19 and COVID-19 Period in China (Step B)
It was necessary to define the pre-pandemic period clearly and the in-pandemic period of China to analyze the impact of the pandemic. As per records, COVID-19 infections in China were firstly reported in the city of Wuhan in late December of 2019 [32]. Initially, large-scale confinement measures were not taken due to the limited knowledge of this virus. On the 22 January 2020, the World Health Organization (WHO) confirmed the evidence of human-to-human transmission of COVID-19 in Wuhan [32], and Wuhan was officially under lockdown on the 23 January 2020. It is worth noting that the 24 January 2020 is the first day of the 2020 Chinese New Year holiday. As this is the most important holiday in China, most businesses are closed for one or two weeks. This is similar to a city lock-down scenario which highly impacts social and economic activities.
According to the pandemic period and data availability, this study aimed to define two timeslots for the COVID-19 pandemic in China:
- Pre-COVID-19 period: 1 January 2019 to 31 December 2019.
- COVID-19 period: 24 January 2020 to 31 December 2020.
3.4. K-Means Clustering Method
Clustering is an unsupervised machine learning method that aims to explore data relationships and patterns. It categorizes data samples into several clusters according to their similarities. Clustering was used in this study to find interrelationships in the electricity consumption data in different regions. It grouped the regions with similar electricity consumption profiles.
K-means was used as the clustering method in this study, followed by the suggestions from [33,34] where K-means has been successfully used for electricity load clustering. The K-means method aims to cluster data into groups where the “inertia” is minimized. The metric “inertia” is defined as:
where is the cluster centers and is the a data sample. Intuitively, the K-means method clusters the data so that they are close to their own cluster centers. Users need to define the number of clusters. The pseudo-code for the K-means method is shown in Algorithm 1 below.
| Algorithm 1. K-means clustering. |
| Initialize k cluster centers randomly |
| while at least one data sample has changed its cluster assignment |
| for data sample in the dataset |
| calculate the Euclidean distance between the data sample and all k cluster |
| centers, and assign the data sample to the cluster where the distance is the |
| minimum |
| end |
| for cluster out of the k clusters |
| the cluster center = the mean of all cluster members |
| end |
| end |
The outcomes of K-means clustering consisted of two parts:
- Cluster centers: this is the arithmetic means of all members in a cluster.
- Cluster labels for each data sample. For example, cluster labels [0, 1, 2, 0, 3, …] mean the first sample belongs to cluster 0, the second sample belongs to cluster 1, the third sample belongs to cluster 2, etc.
3.5. Clustering Evaluation Metrics
Clustering is an unsupervised machine learning method, so the data samples for clustering are unlabeled. It is different from supervised machine learning methods, which are performed on labeled data. Hence, the performance evaluation of clustering is more complicated than supervised learning because of the lack of ground truth.
This study utilized the following five metrics to evaluate the clustering model. This included three conventional metrics [33], cohesion, separation, and the Calinski–Harabasz (CH) index [35]. Yet, the research used two additional ones, the delta inner-cluster distance and validation Rand index, to further study the performance of clustering. However, it must be noted that it is unlike supervised learning in which the performance can be clearly evaluated by comparing predicted values versus true values. Moreover, there is no widely agreed method to quantifiably evaluate a clustering model [33]. The five metrics were used as a reference for the evaluation, and human judgment was still necessary. Later in the study, the five metrics were used to select the parameter of the clustering model. In addition, the delta inner-cluster distance and validation Rand index were used for the impact analysis.
3.5.1. Cohesion
Cohesion measures the distance between data samples and the cluster center. Intuitively, it shows how clusters are formed fitted, and the center of each cluster is close to cluster members (data samples). Hence, best-fitted clusters return a smaller cohesion value. Equation (3) [33] shows the expression of cohesion:
where k is the number of clusters, is for one cluster , is the cluster center for cluster , and is one data sample.
3.5.2. Separation
Separation measures the distance between cluster centers and the overall center of the whole dataset. Intuitively, it shows the dissimilarity of clusters (i.e., cluster centers). Separation should be larger for a better cluster model. Equation (4) [33] shows the expression of separation:
where k is the number of clusters, represents the number of members in cluster , is the cluster center for cluster and is the center of the whole dataset.
3.5.3. Calinski–Harabasz (CH) Index
The CH index [35] is a combination of cohesion and separation. A larger CH index shows a better clustering model. Equation (5) shows the expression of the CH index:
where is the number of data samples and k is the number of clusters.
3.5.4. Delta Inner-Cluster Distance (DICD)
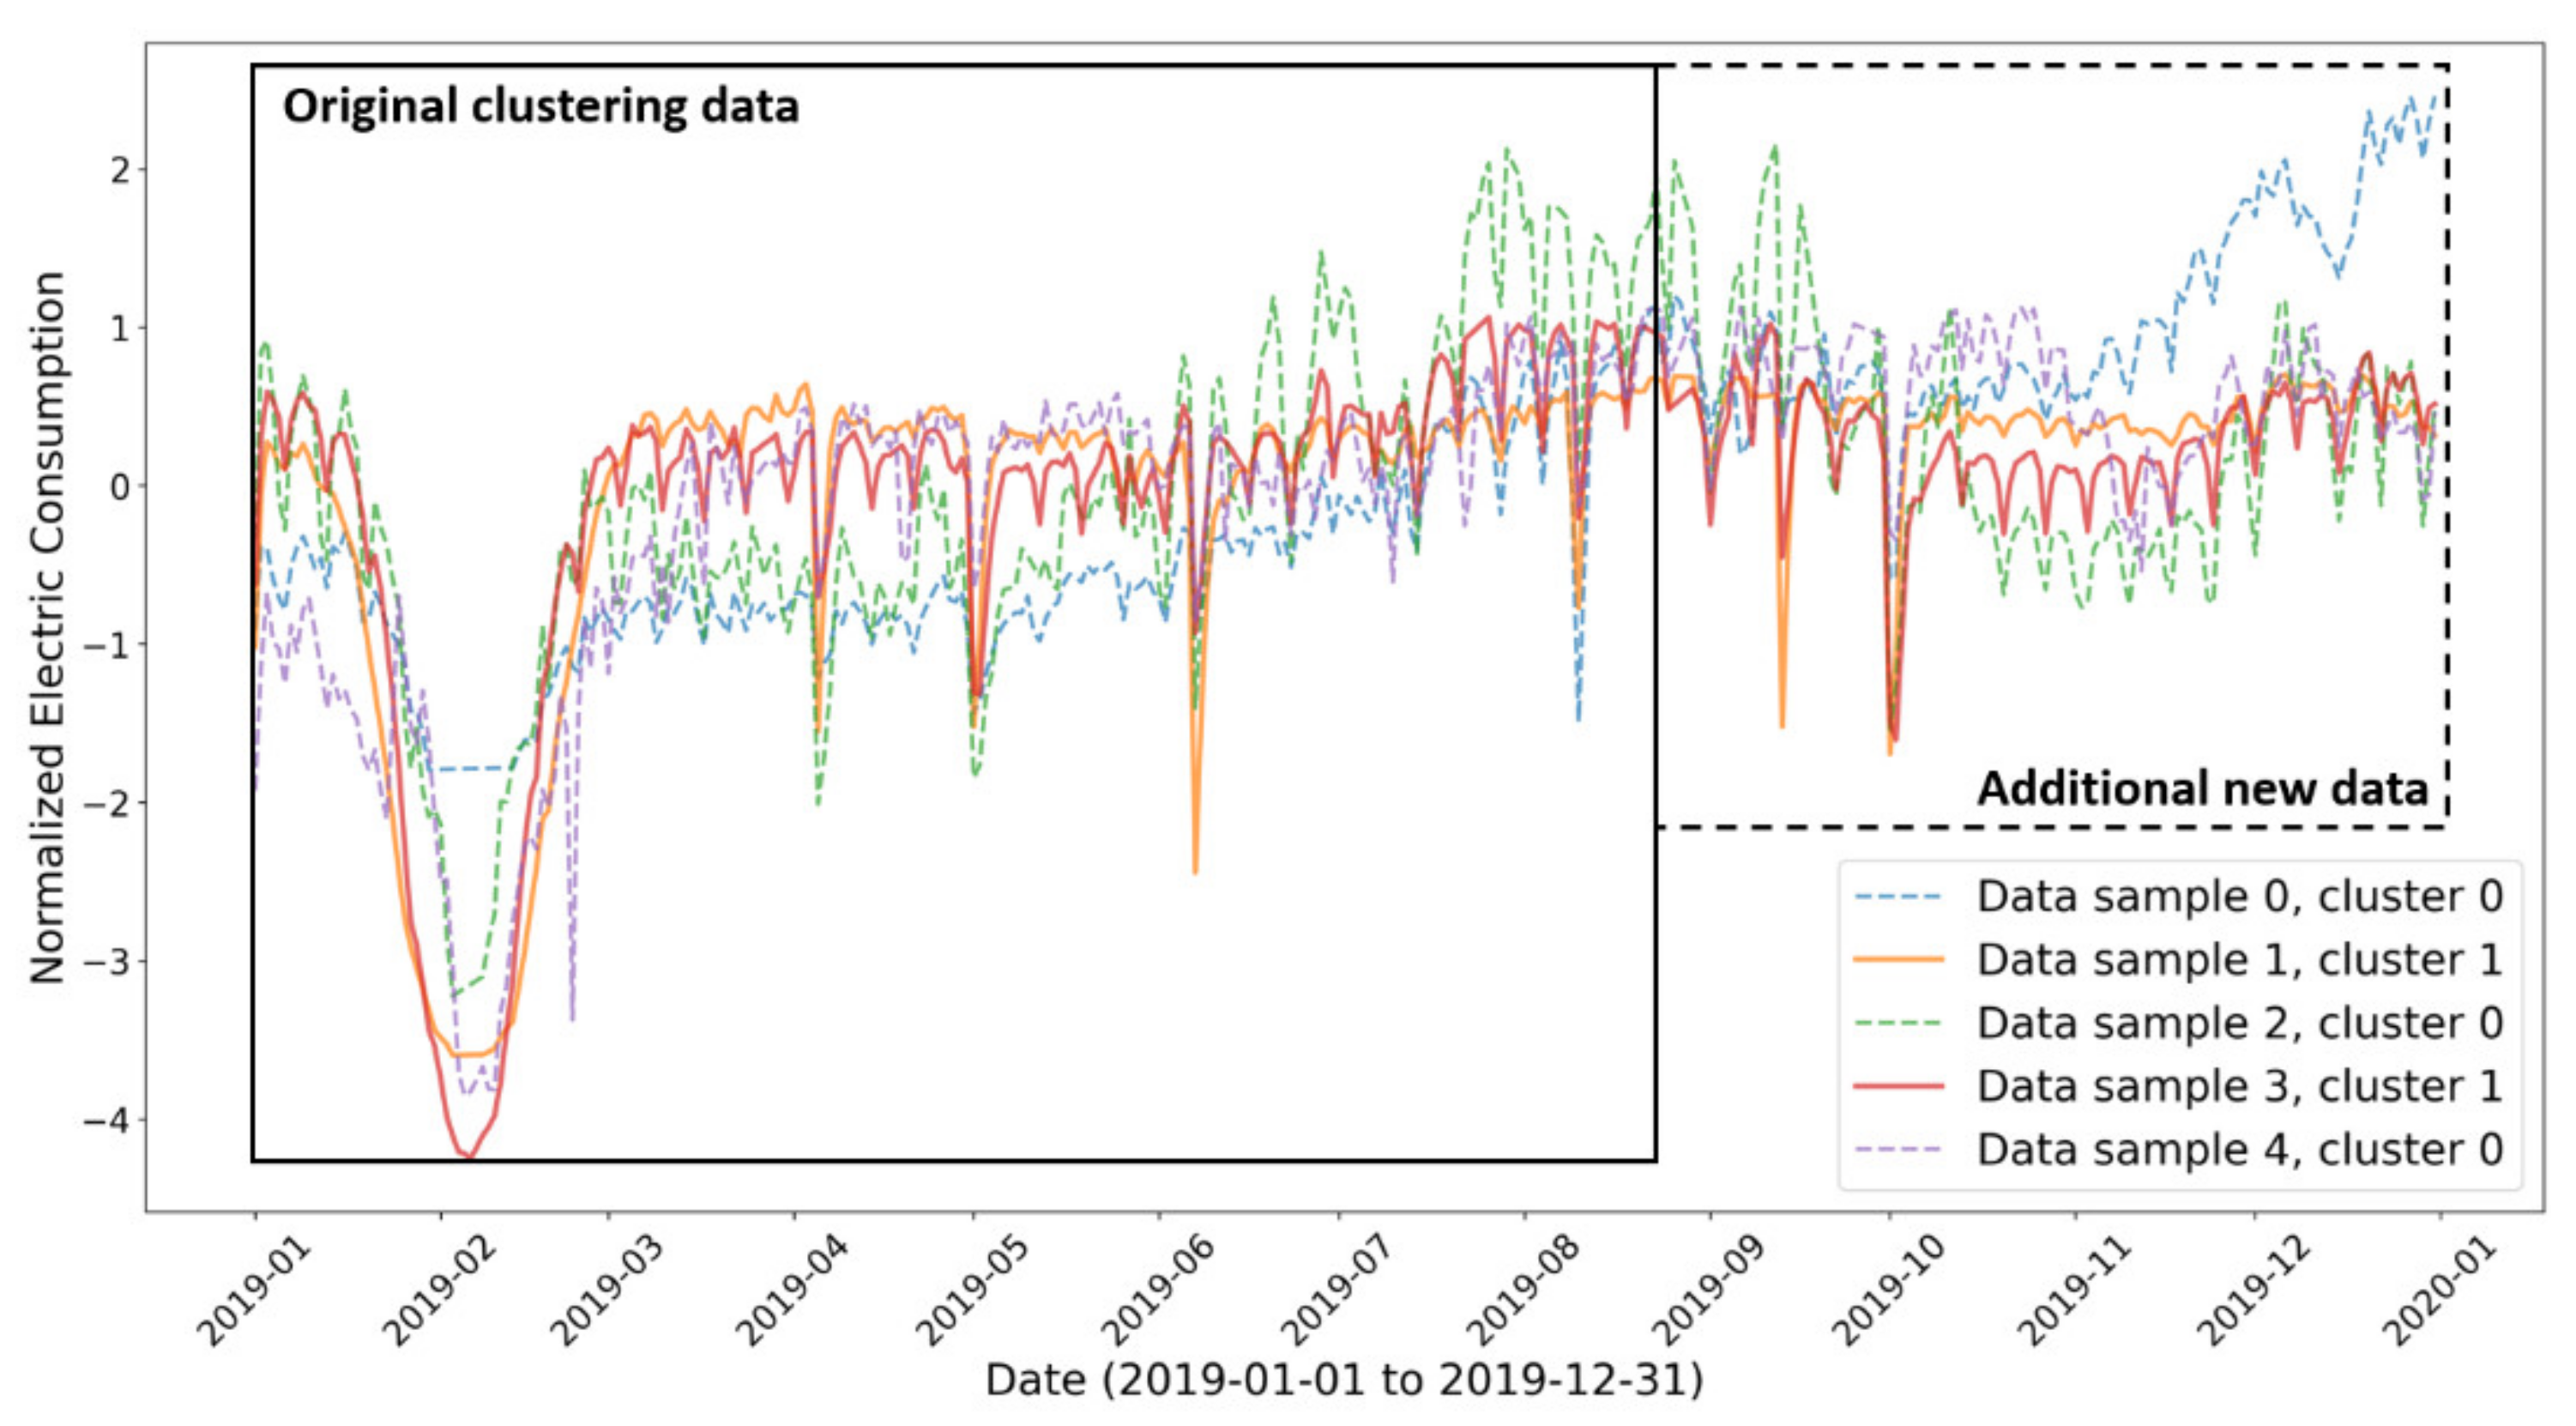
The above three metrics are standard ones that only evaluate the performance based on a fixed dataset. However, this study deals with time series electricity consumption data, which is time-dependent and may change rapidly over time. Figure 3 shows a schematic example of clustering with an additional new dataset. Originally, conventional K-means clustering can be performed based on the “original clustering data”. For example, the clustering labels are [0, 1, 0, 1, 0], meaning samples 0, 2, and 4 are in cluster 0, and samples 1 and 3 are in cluster 1 (each sample represents a region). Since the dataset is time-series electric energy consumption, additional data could be obtained for each sample, i.e., “additional new data”, as shown in Figure 3. For the additional new data, the previous clustering labels were directly applied without performing K-means clustering again. If we assume there is no fundamental change in the electricity consumption pattern of the regions, the clustering result on the “additional new data” should be satisfactory, i.e., cluster members are closed to each other. However, in this example, data sample 0 in “additional new data” is far from its cluster members (data sample 2 and data sample 4). This means the clustering model used in this example is not suitable. We used two additional metrics to quantitively evaluate a clustering model or clustering results in terms of time-series data. The first one is named “delta inner-cluster distance”.
For a given clustering result for a given fixed dataset, “inner-cluster distance (ICD)” is defined as:
where k is the number of clusters, is a cluster , is a data sample, and represents the number of members in cluster . In this equation: is named as the “cluster mean pairwise distance”, which is calculated for samples in the same cluster. A small “cluster mean pairwise distance” means the members in this cluster are closed to each other. ICD just takes the average of the “cluster mean pairwise distance” over all clusters. The concept of ICD is similar to cohesion, but cohesion calculates the distance between a sample and its cluster center, while this equation calculates the distance among the samples in the same cluster. This is because there are no cluster centers when the clustering result applies to a different additional dataset. Similar to cohesion, ICD should be smaller for a better clustering model, meaning the cluster members are closed with each other.
The delta inner-cluster distance (DICD) is defined as:
where is the inner-cluster distance calculated using the original clustering dataset, and is the inner-cluster distance calculated using a new additional dataset. The DICD shows the change of the inner-cluster distance when the same clustering result (cluster labels) applies to an additional dataset. If there is no change in a data-generating distribution (e.g., the economy of a city is running stably so the electricity consumption follows a stable pattern), the should be small, which indicates the clustering result derived using the clustering dataset is still applicable for the new additional dataset.
3.5.5. Validation Rand Index (VRI)
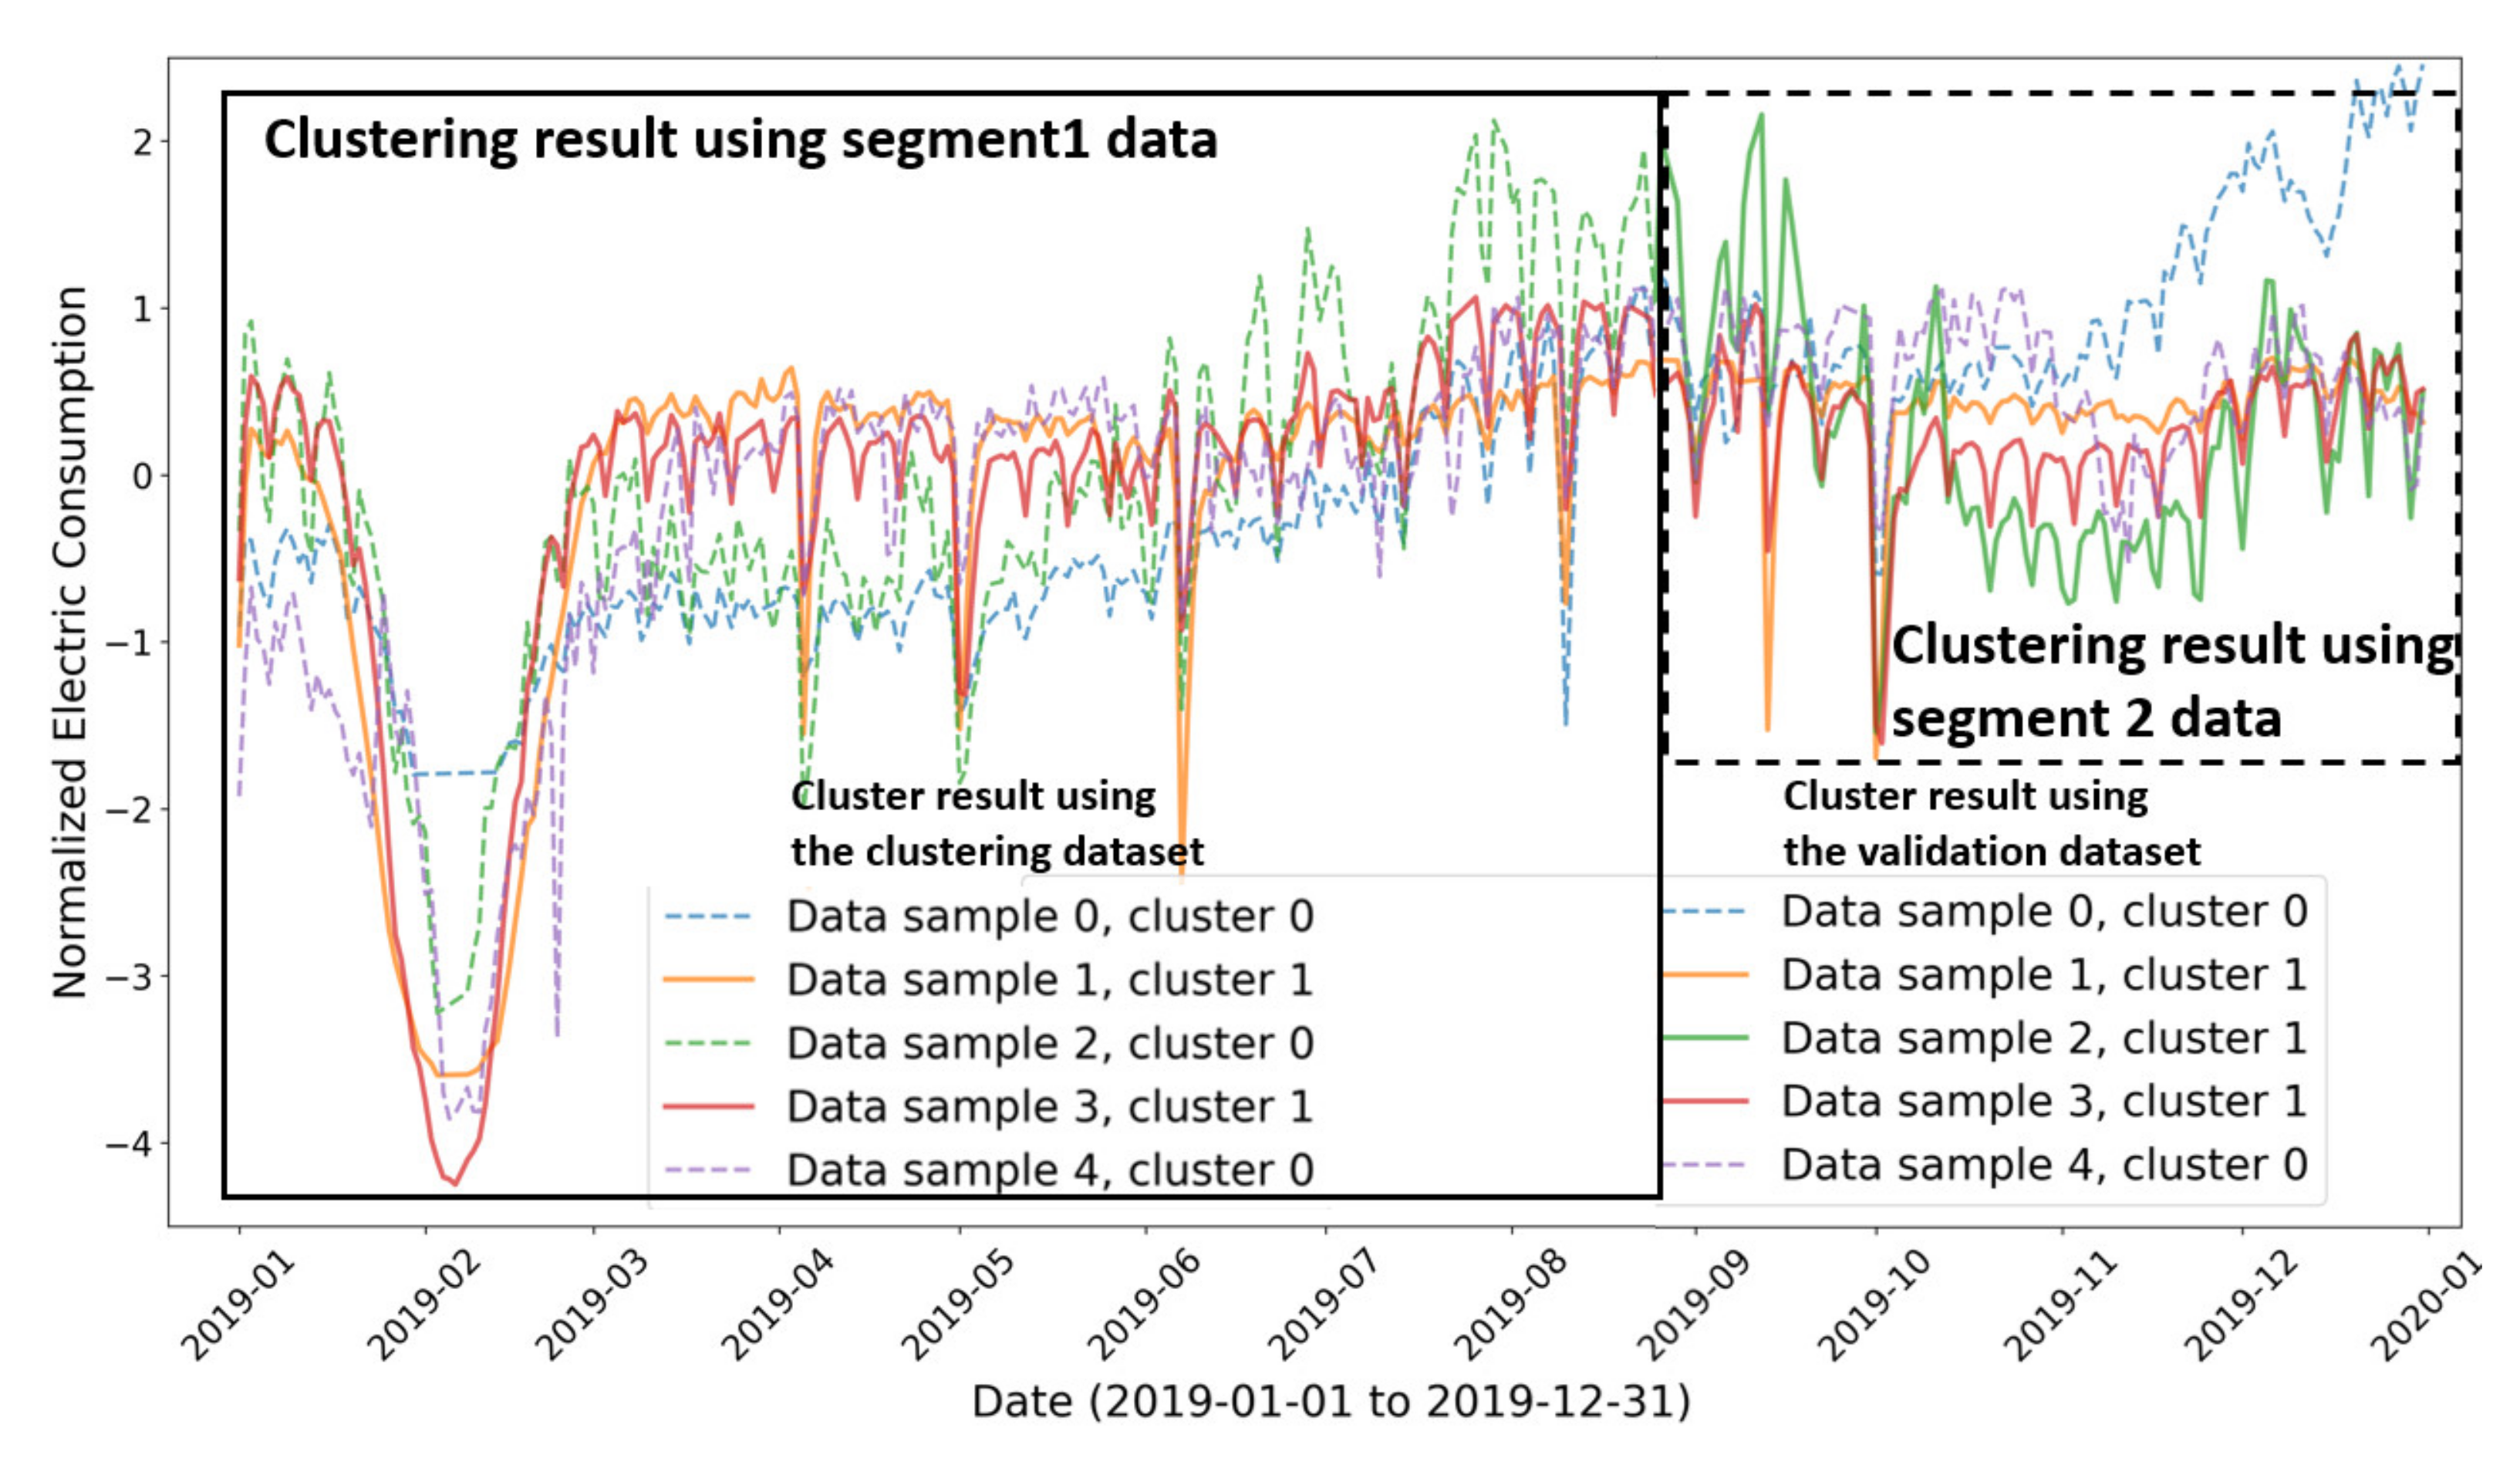
Ideally, for time-series data, if all data samples are from the same data-generating distribution, a good clustering model should generate the same clustering result (i.e., cluster labels) no matter which period of the dataset is used for clustering. Figure 4 shows an example of two different clustering results obtained by using different segmentations of the same time-series dataset (hypothetical result). The cluster labels using the segment 1 data are [0, 1, 0, 1, 0] but the cluster labels using the segment 2 data are [0, 1, 1, 1, 0]. This means the selected clustering model was not appropriate for this purpose if we assume there was no change in this time-series data-generating distribution. The resulting cluster labels should have been the same no matter which segmentations were used for clustering.
We used the metric “validation Rand index” to evaluate this situation. The Rand index [36] is used to compare the difference between two sets of cluster labels. For example, the Rand index of two sets of the same cluster labels is 1.0, and the Rand index of two sets of uniformly random cluster labels is close to 0.0. We defined the validation Rand index (VRI) as:
where clusterLabels_segment1 and clusterLabels_segment2 were the results of cluster labels by using different segments of the data. Based on our above discussion, for an ideal situation for electricity consumption clustering, the VRI should be 1.0 because we expect the clustering result to be the same no matter which segment of the dataset was used.
3.6. K-Means Parameter Selection (Step C)
The key parameter to determine in K-means clustering is the choice of “K”, i.e., the number of clusters. This study used the previously defined five metrics to select an appropriate K. The model selection processes are listed below:
- The parameter selection process is based on the pre-COVID-19 period dataset. This is because there were no major interruptions in economic and social activities in 2019 in China and in the Zhejiang province, so the electricity consumption in 2019 should follow the same pattern.
The calculation of the two newly defined evaluation metrics, the DICD and VRI, required segmenting the dataset into two. Therefore, we followed the common practice in the validation evaluation of supervised learning models and split the pre-COVID-19 period dataset into two segments:
- The data in the first 65% of the days in 2019 (237 days, 01-01-2019 to 08-26-2019). This was used as the training dataset in the DICD calculation and used as the “segment1” in the VRI calculation;
- The data in the remaining 35% of the days (128 days, 08-26-2019 to 31-12-2019). This was used as the validation dataset in the DICD calculation and used as the “segment2” in VRI calculation.
- 2.
- For all the choices of K from 2 to 20 (increment by 1), the same K-means clustering experiment was performed 20 times, and the average cohesion, separation, Calinski–Harabasz (CH) index, delta inner-cluster distance, and validation Rand index over the 20 experiments were recorded. A desirable K was selected based on the metrics.
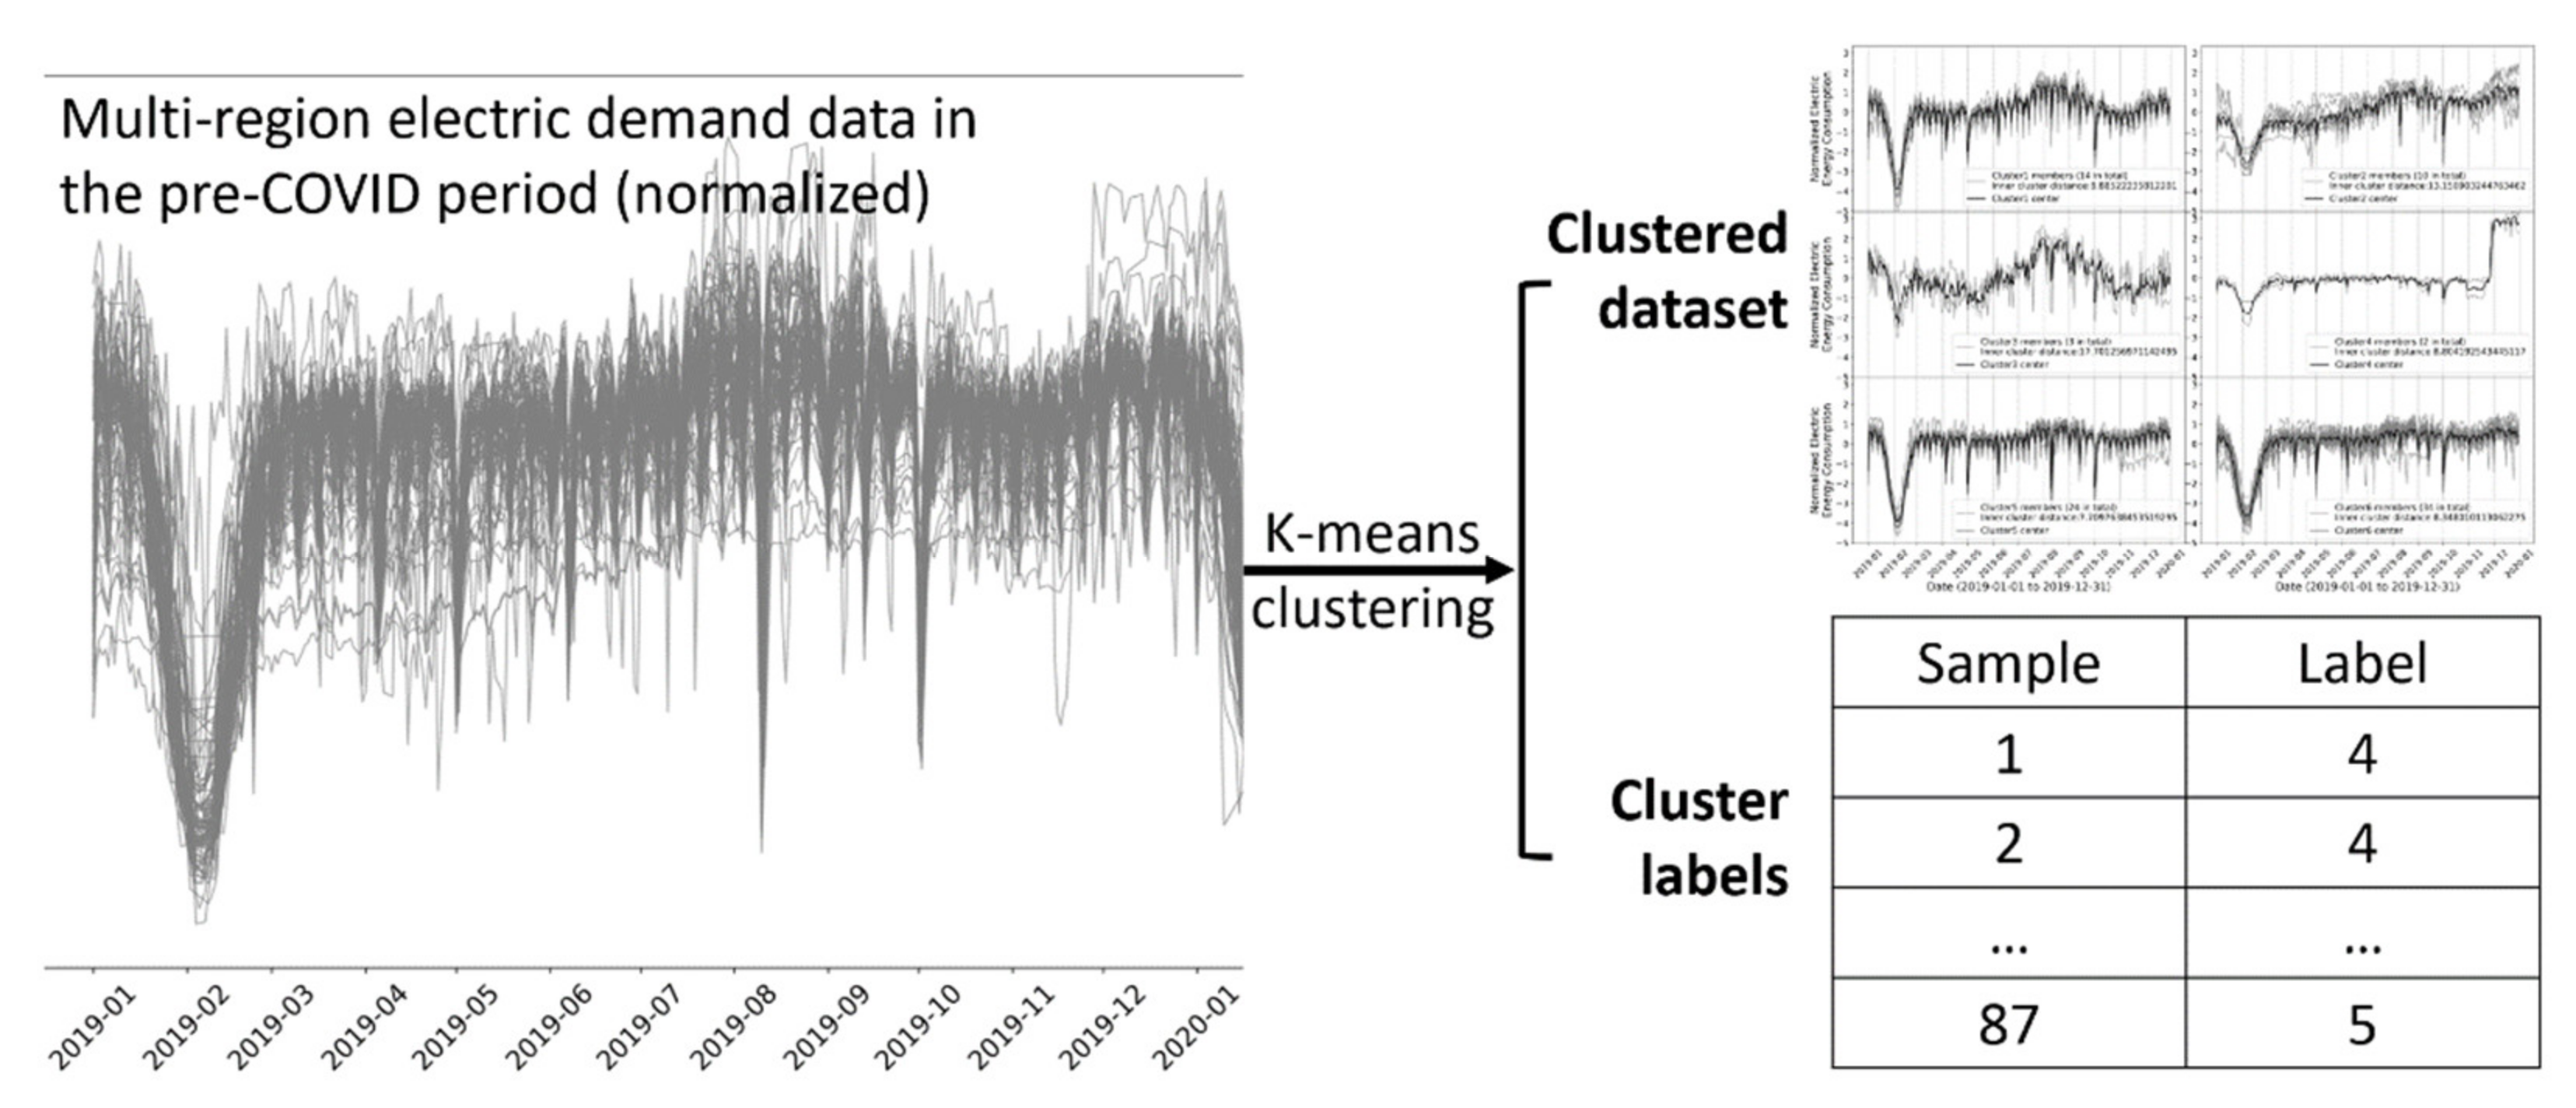
3.7. Clustering for Pre-COVID-19 Dataset (Step D)
After the K-means parameter was selected, the K-means clustering was performed firstly on the pre-COVID-19 dataset. The output of the clustering consisted of the following two parts, which are schematically demonstrated in Figure 5:
- Clustered dataset: the dataset that is grouped by clusters;
- Cluster labels: the membership of each sample in the dataset.
3.8. Clustering for COVID-19 Dataset and Comparison Analysis (Step E and F)
This was the essential step to perform clustering analysis on the impact of COVID-19 on electricity consumption. The COVID-19 dataset contained electricity consumption data after the pandemic swept China. The Chinese government took severe confinement measures, such as city lockdown, social distancing, travel restrictions, etc. These measures made significant impacts on social and economic activities; therefore, electricity consumption was expected to be affected.
Two different clustering analysis methods were proposed and used in this study: (1) clustering via pre-impact clustering result, and (2) clustering via post-impact clustering result.
3.8.1. Clustering via Pre-Impact Clustering Result (Step E1 and F1)
If there was no significant impact on social and economic activities, the electricity load should follow a constant pattern. Therefore, as we have discussed in Section 3.5.4, cluster labels obtained by one segment of time-series electricity load data (named “training dataset”) should also be suitable to cluster another new segment of the same time-series electric load data (named “validation dataset”). In such a case, the inner-cluster distance of the validation dataset should be similar or even smaller than that of the training dataset.
Therefore, to analyze the impact of COVID-19 on the electricity consumption of the Zhejiang Province, cluster labels obtained by the pre-COVID-19 dataset were directly applied to cluster the COVID-19 dataset, as shown in step E1 in Figure 2. In this case, the training dataset is the pre-COVID-19 dataset, and the validation dataset is the COVID-19 dataset. If COVID-19 had little or no impact on the electricity consumption, then the inner cluster distance of the COVID-19 dataset should be similar or smaller than that of the pre-COVID-19 dataset. If COVID-19 has changed the electricity load pattern, then the cluster labels obtained via the pre-COVID-19 dataset would not be suitable to cluster the COVID-19 dataset. In such a case, the inner-cluster distance of the COVID-19 dataset would be larger than that of the pre-COVID-19 dataset.
3.8.2. Clustering via Post-Impact Clustering Result (Step E2 and F2)
Similar to the concept in the previous section, if there was no significant impact on social and economic activities, cluster labels should be the same or similar no matter which segment of a time-series dataset is used to perform clustering. This concept has been discussed in Section 3.5.5, and a metric VRI was introduced based on this concept.
Therefore, clustering was performed using the COVID-19 dataset (as shown in step E2 in Figure 2), and the cluster labels were compared with the one obtained using the pre-COVID-19 dataset. If COVID-19 had a significant impact on the multi-region electricity load pattern of the Zhejiang province, then the results of cluster labels would differ, and the VRI would be small.
In addition to VRI-based analysis, the results of cluster centers of pre-COVID-19 clustering and COVID-19 clustering were compared. Cluster centers represent typical electricity load profiles in the regions. Comparison of the cluster centers reveals the impact of the pandemic on some typical electricity consumption patterns.
4. Results
4.1. Clustering Parameter Selection
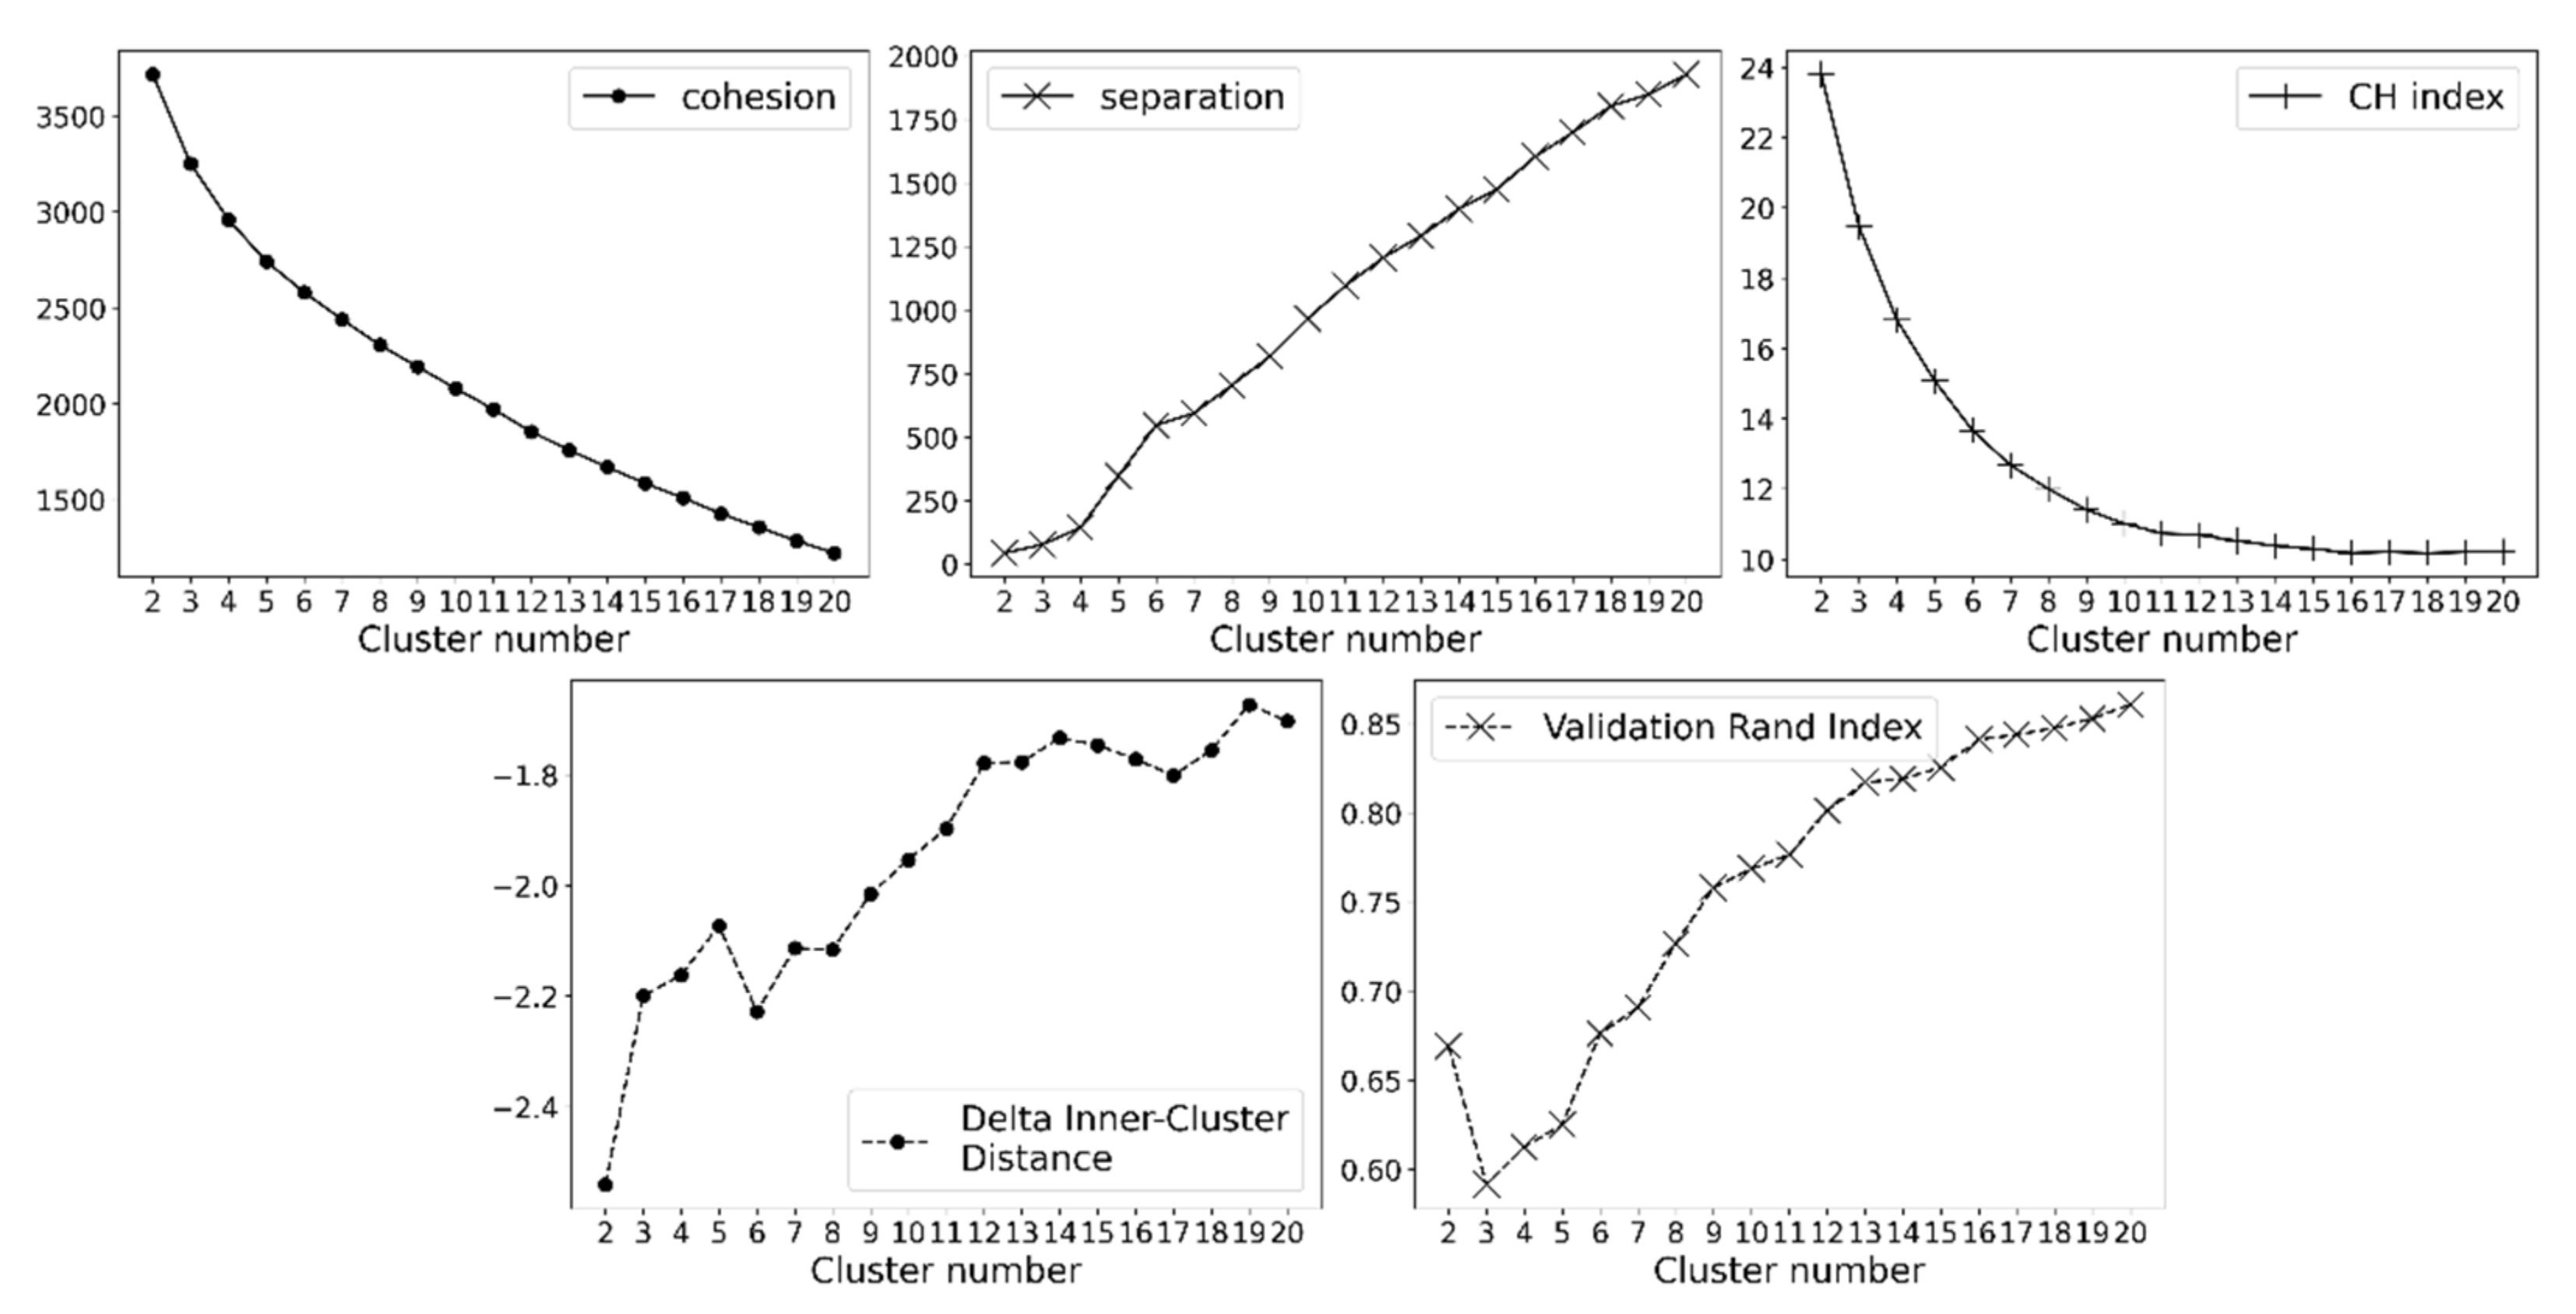
This subsection shows the result of the selection of “K” for K-means clustering. Following the parameter selection procedure in Section 3.6, Figure 6 plots the five clustering evaluation metrics versus different choices of K.
By looking at the conventional evaluation metrics (the top row of Figure 6), a larger K generally leads to smaller cohesion, larger separation, and a smaller CH index. As discussed in Section 3.5, a good-fitted clustering model should have small cohesion, large separation, and a large CH index. There is not a suitable K that can achieve the above conditions simultaneously. By looking at each curve separately, the elbow occurs in the cohesion curve when K = 5, and it occurs in the separation curve when K = 6. This indicates that after the elbows, the decrease rate or increase rate of the curves becomes smaller, so K = 5 or 6 are the best-balanced choice for K.
More information can be obtained by using the two additional metrics (the bottom row of Figure 6). For delta inner-cluster distance (DICD), a lower DICD indicates a better clustering model. In this study, the DICD firstly increased and then dropped at K = 6, and then increased again. For the validation Rand index (VRI), this number should be large for a good-fitting clustering model. In this study, VRI first dropped at 3 and then increased. Therefore, K = 6 is the best number to balance between the DICD and VRI.
Overall, the conventional evaluation metrics indicate K = 5 or 6 are the best-balanced choice of K; the additional evaluation metrics indicate K should be 6. Therefore, K = 6 was finally selected for this study.
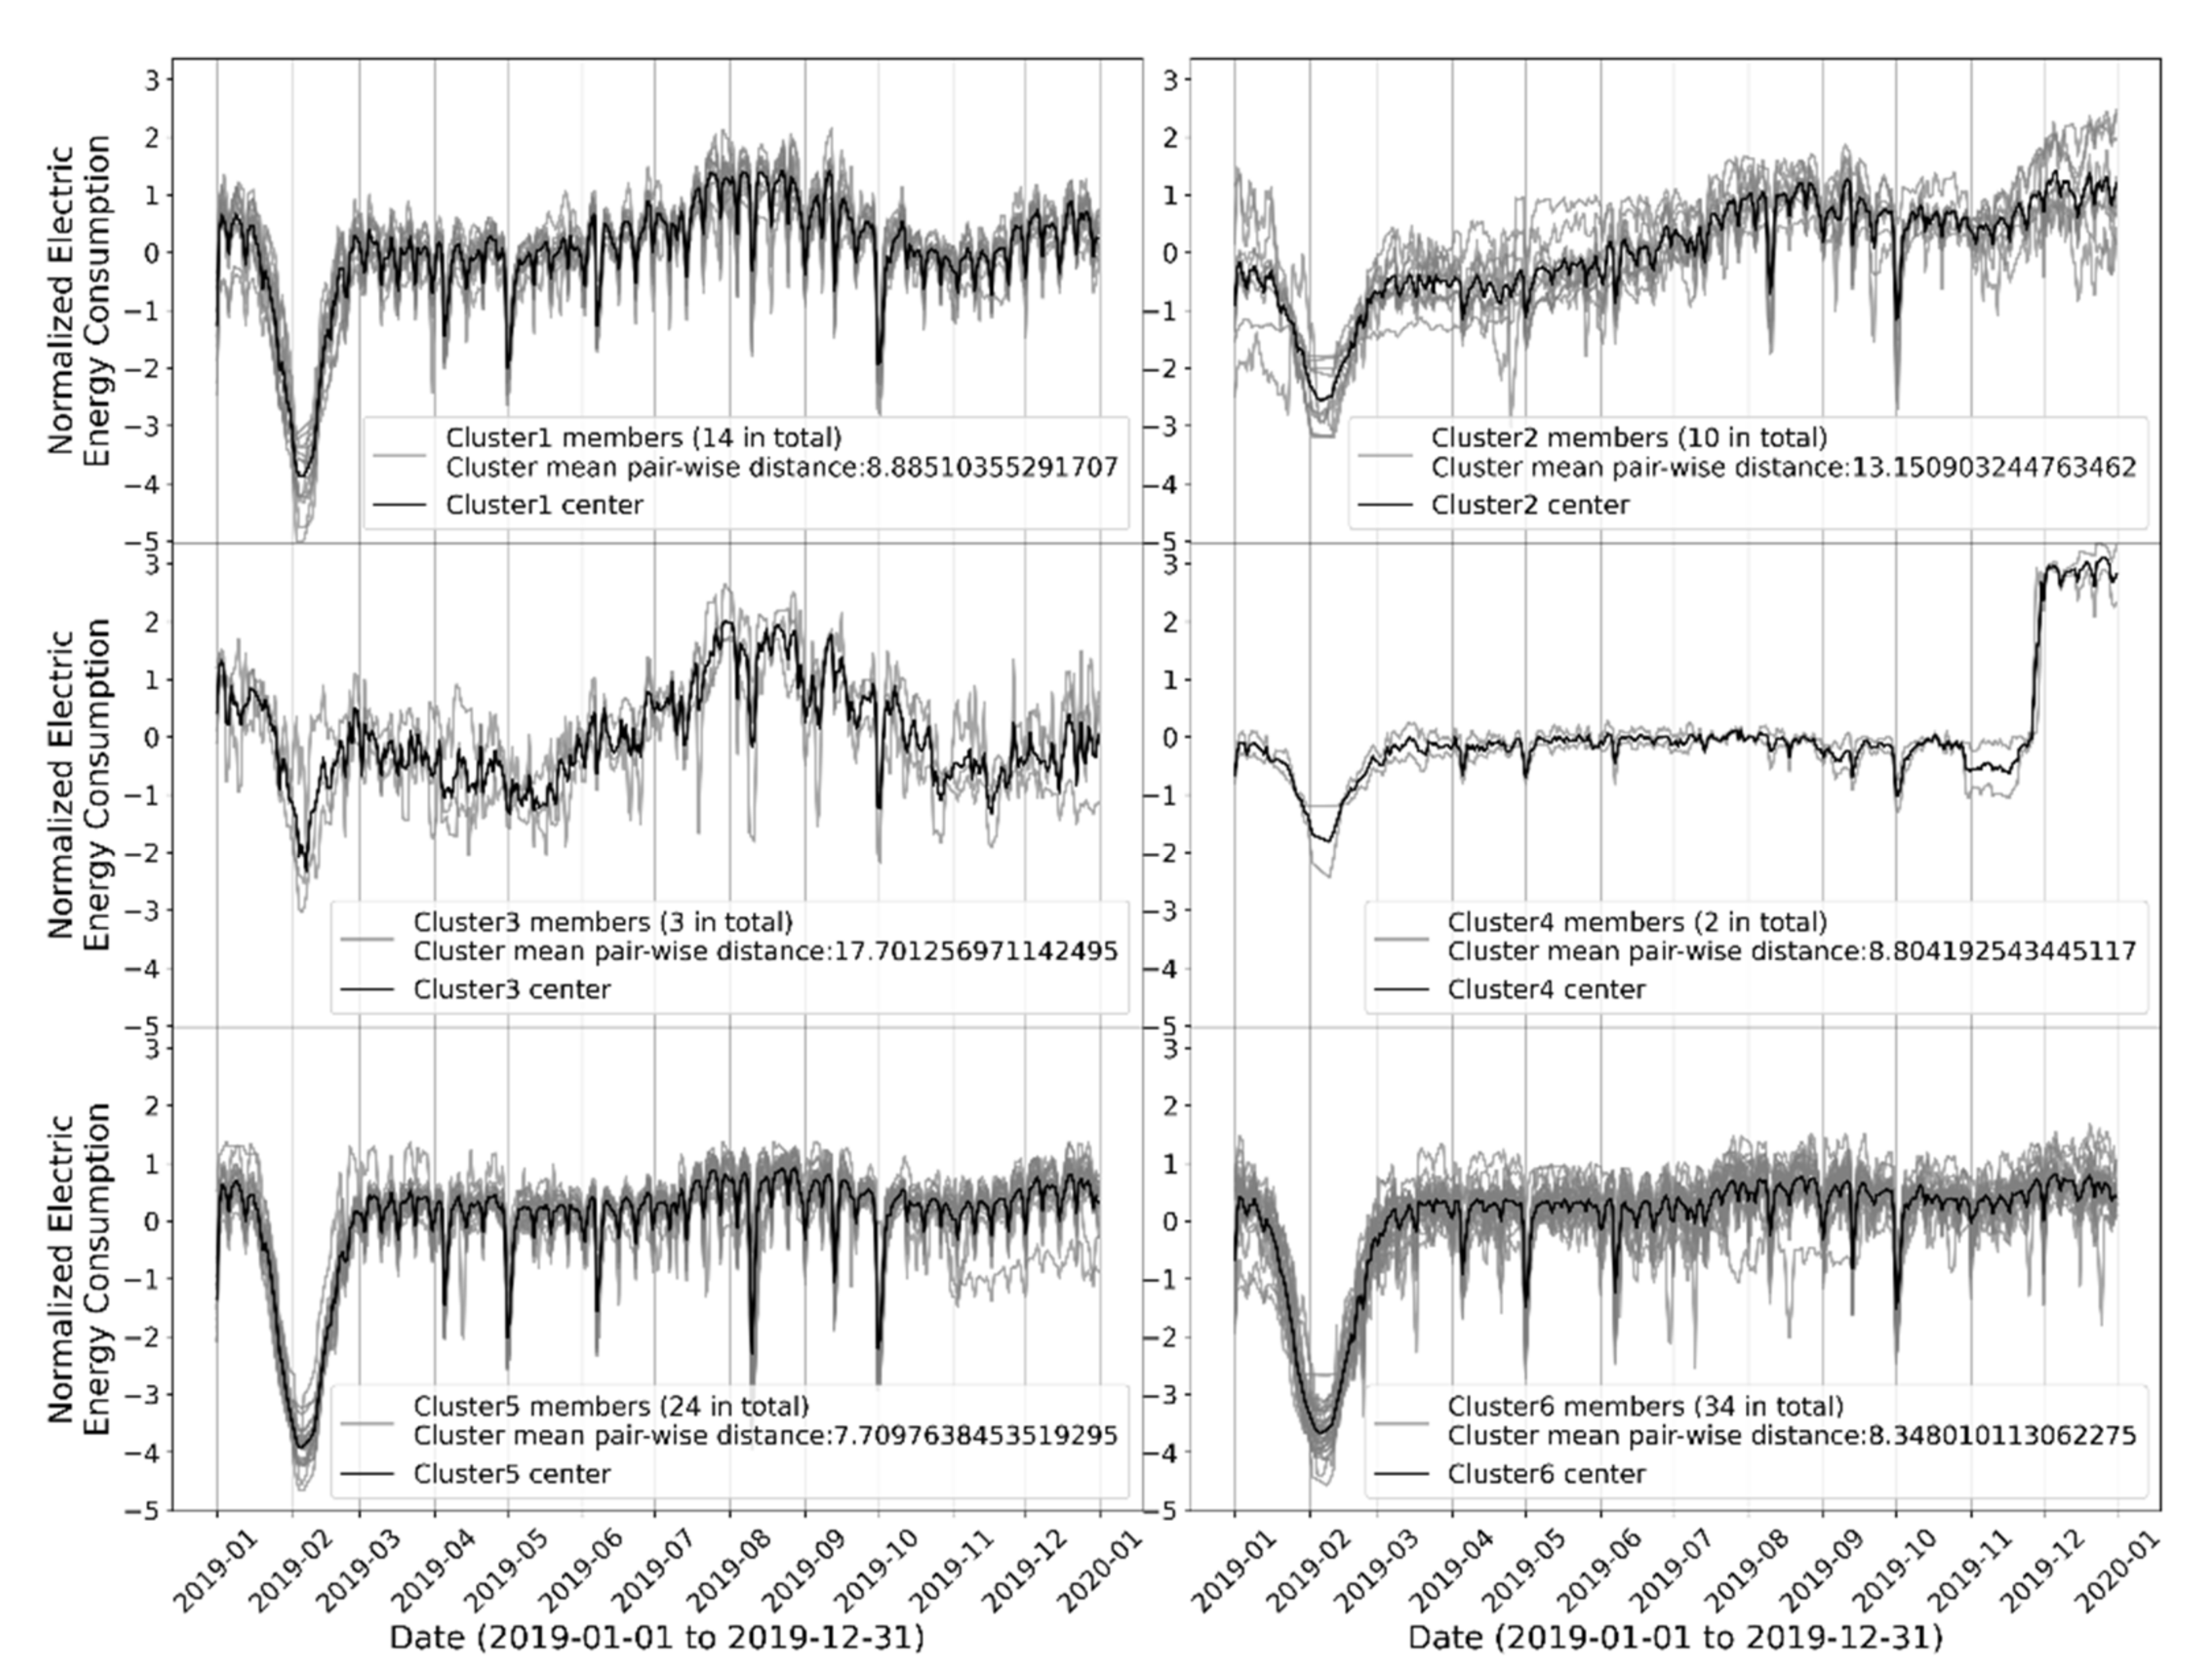
4.2. Clustering of the Pre-COVID-19 Dataset
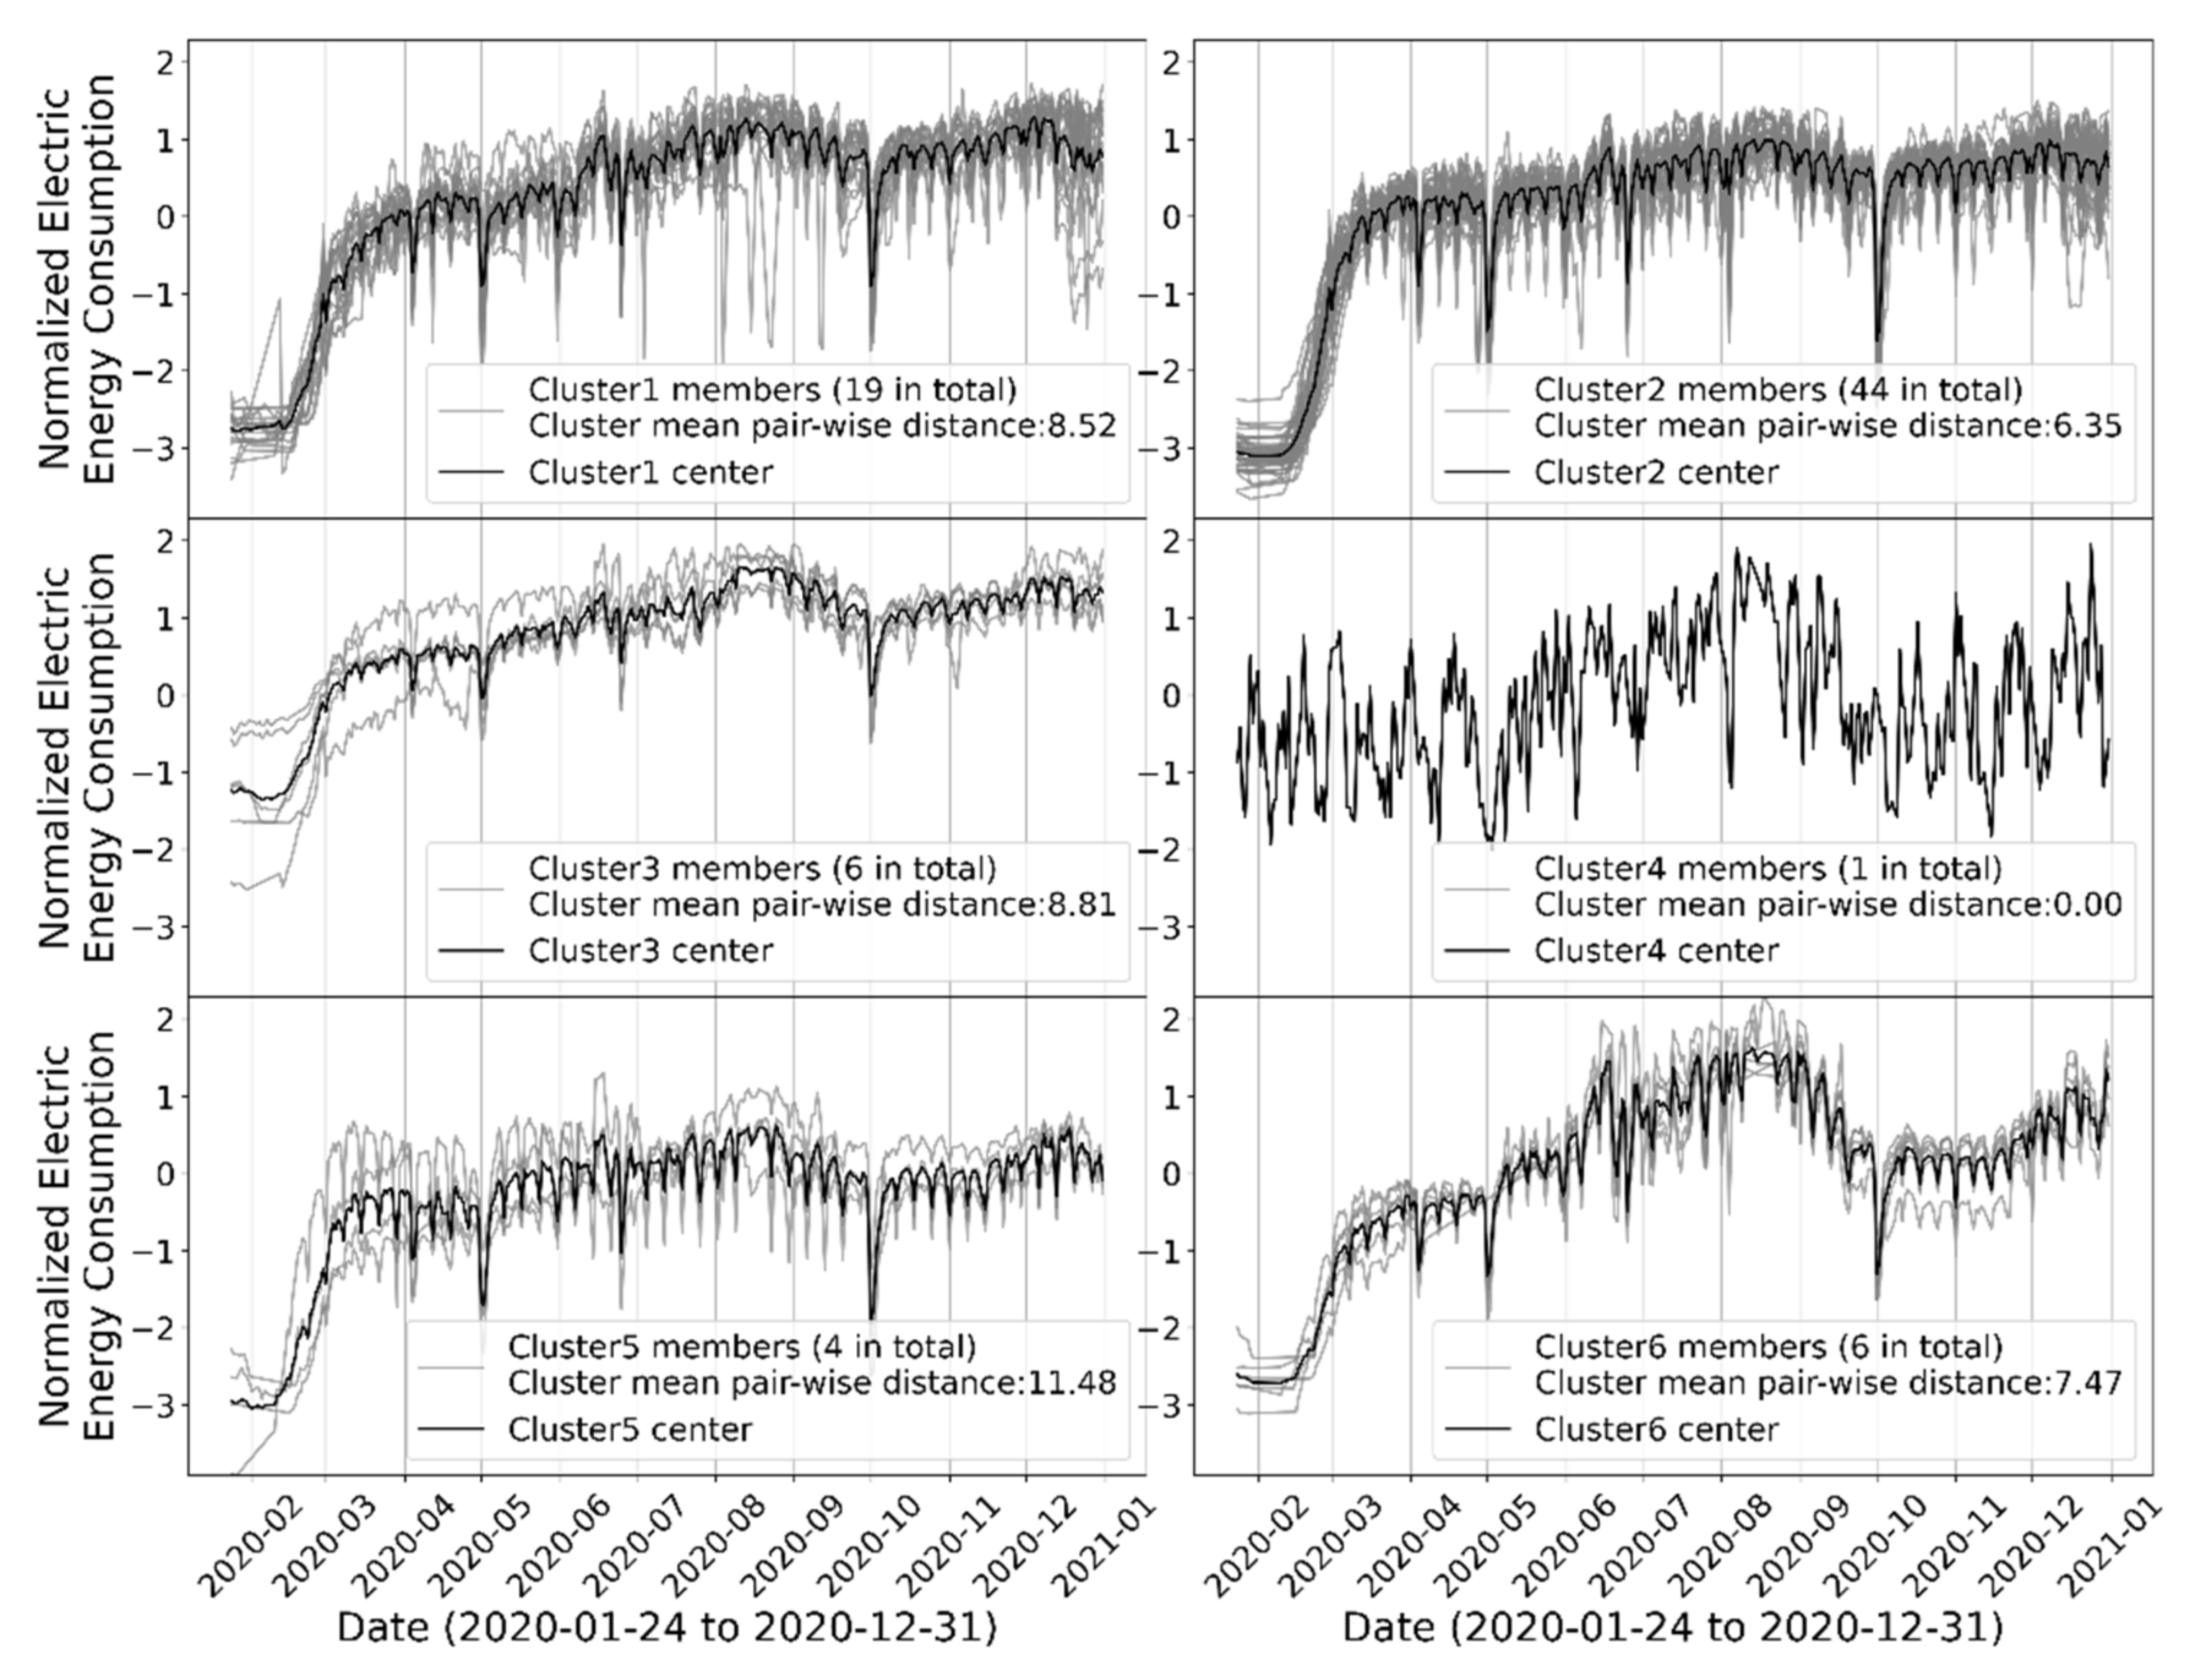
K-means clustering with K = 6 was performed on the pre-COVID-19 dataset, and the clustered dataset is shown in Figure 7. In this figure, each subplot represents one cluster; in each cluster, the gray lines are the electricity consumption data of one city that belongs to the cluster, and the black line is the cluster center. By just observing the clustering result, six clusters represent six different electricity load profiles. The cluster mean pairwise distance (as defined in Equation (6)) of each cluster was also calculated and is shown in Figure 7. A good cluster should have a small cluster mean pairwise distance, representing all cluster members as being close to each other. Based on this metric, some clusters showed better performance than others. For example, cluster 2 and cluster 3 have significantly larger cluster mean pairwise distances than other clusters because of the existence of many “outlier” members. Another observation is that cluster 4 has only two members, which means the electricity consumption profiles in this cluster are outliers among the data of all the regions. Therefore, only clusters 1, 5, and 6 were selected for further study because they were three representative consumption profiles in the dataset.
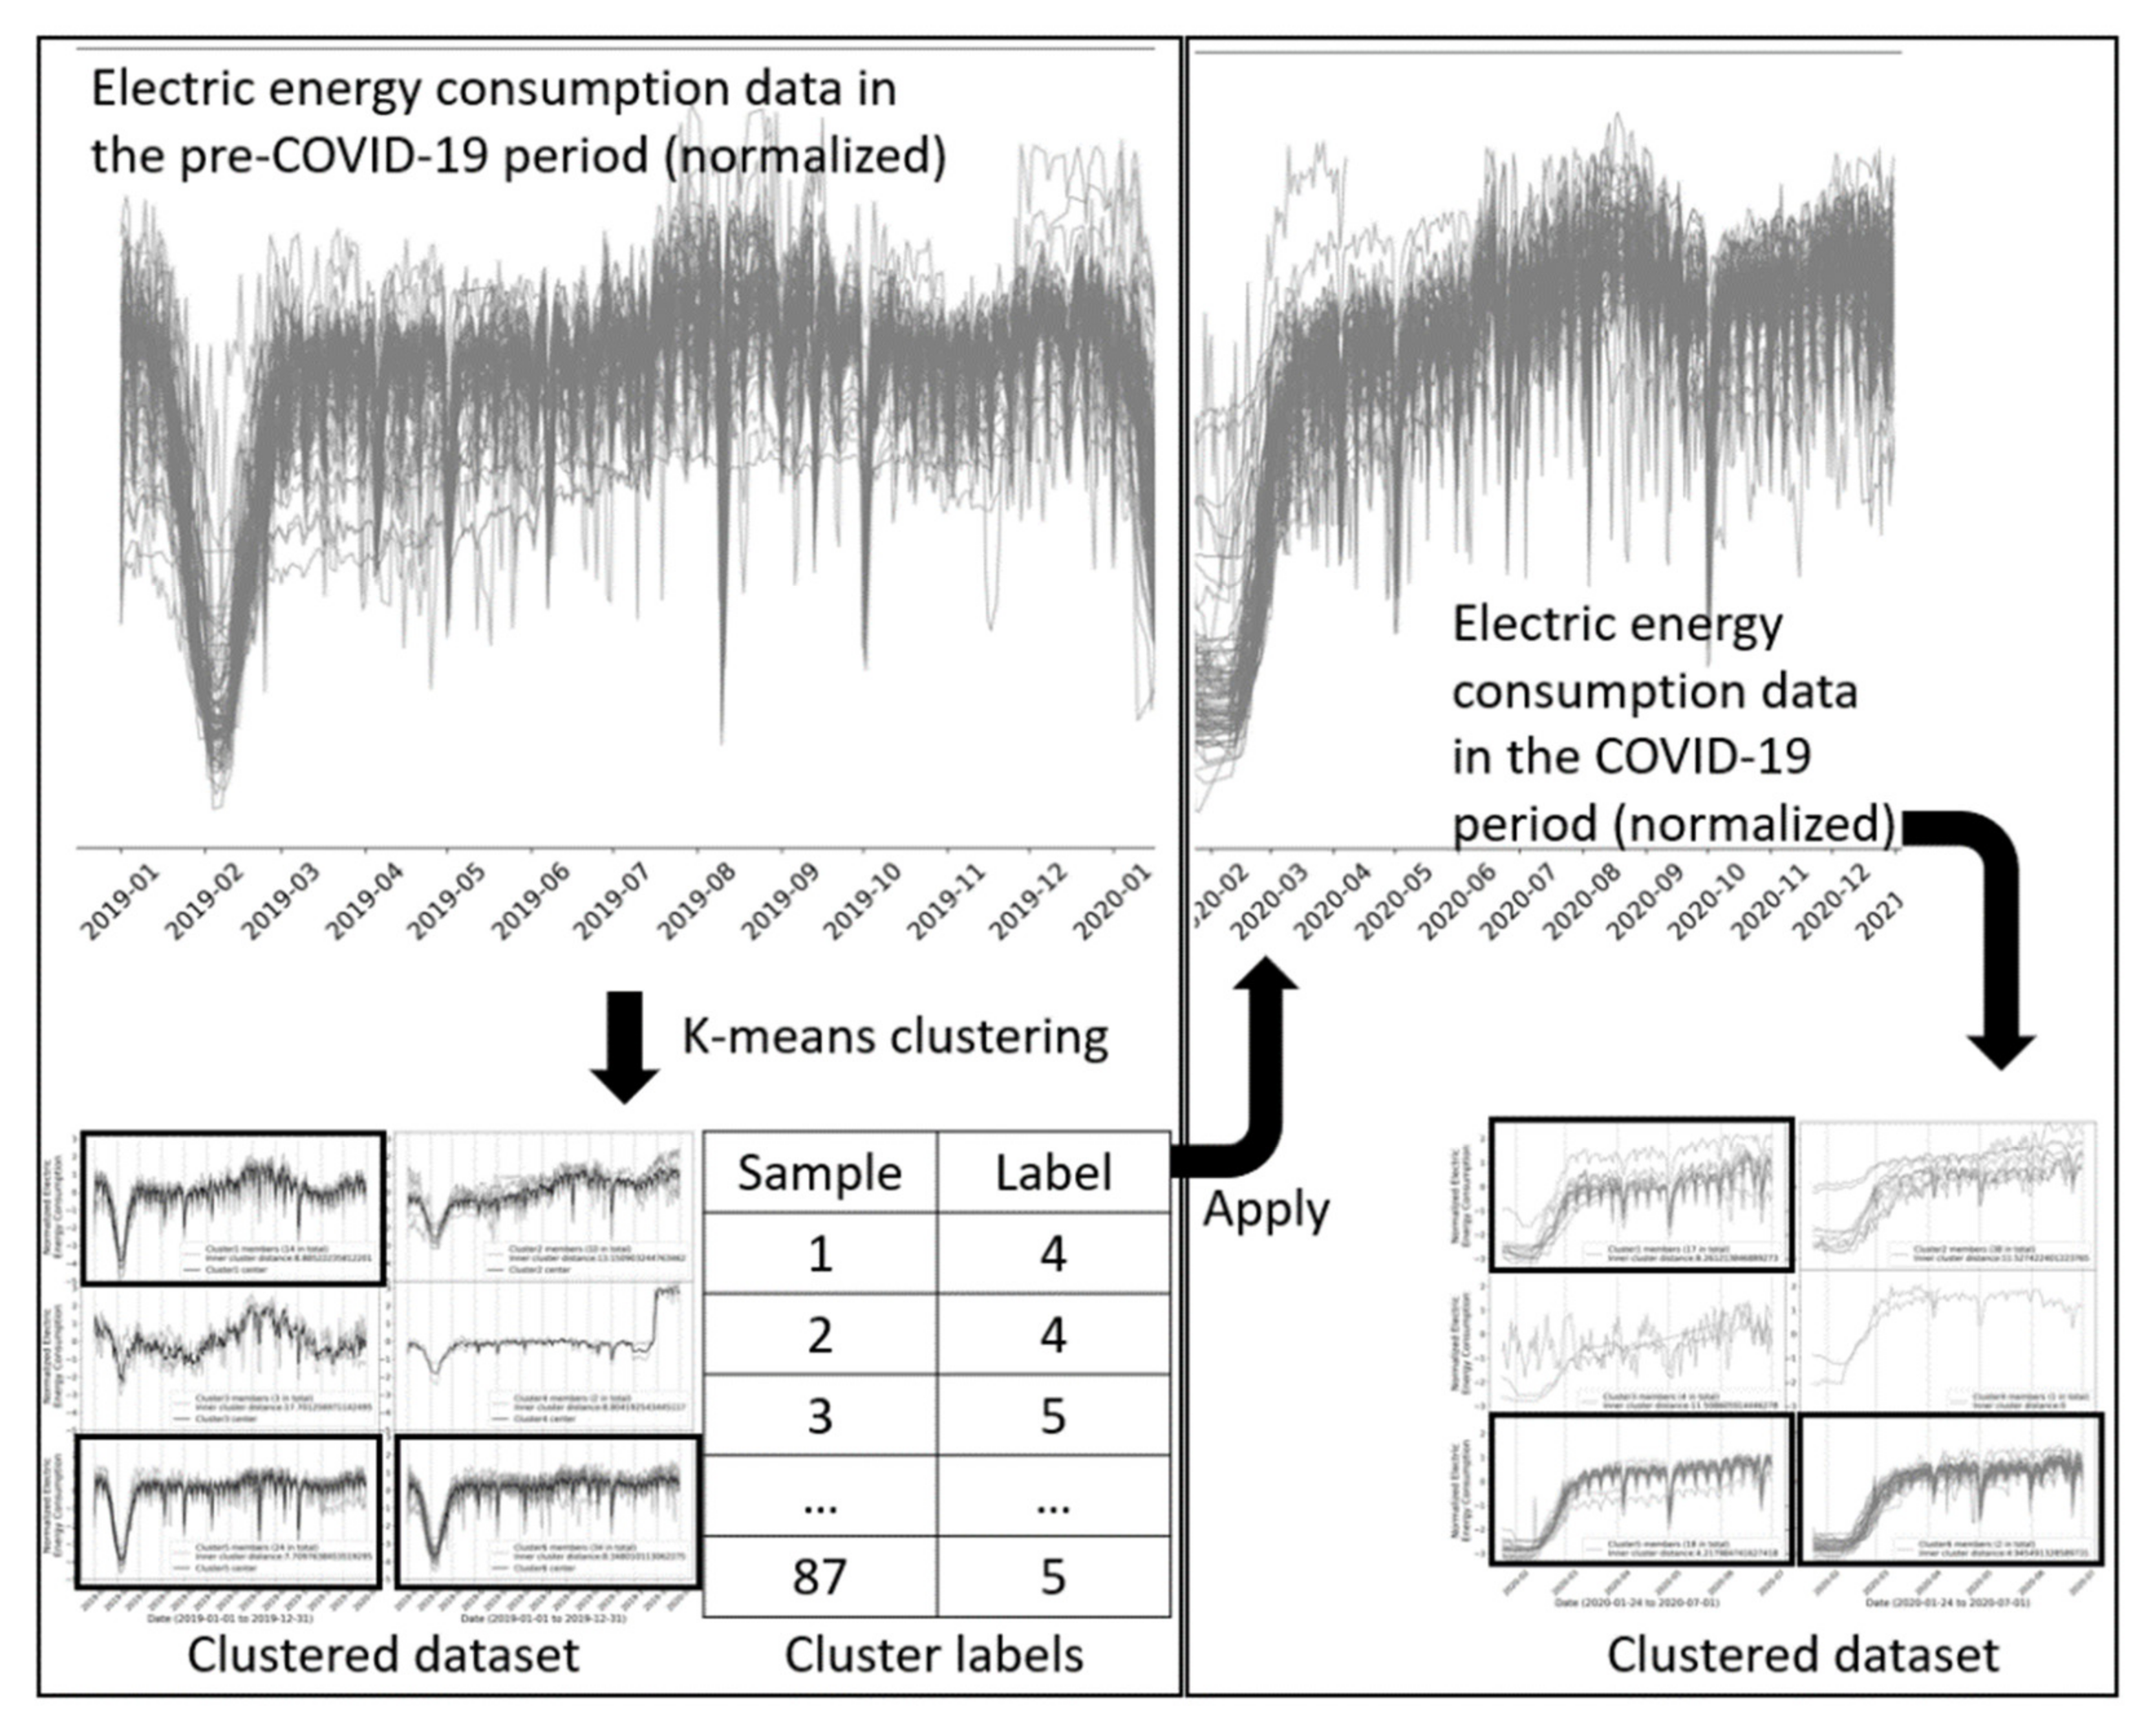
4.3. Clustering of the COVID-19 Dataset: Via Pre-Impact Clustering Result
The first clustering analysis of the COVID-19 dataset was performed using the pre-impact clustering result, as explained previously in Section 3.8.1. The pre-impact clustering result in this study was the cluster labels obtained from the clustering of the pre-COVID-19 dataset. In addition, only the cluster labels of clusters 1, 5, and 6 were used because they were representative consumption profiles in the dataset. This process is schematically shown in Figure 8.
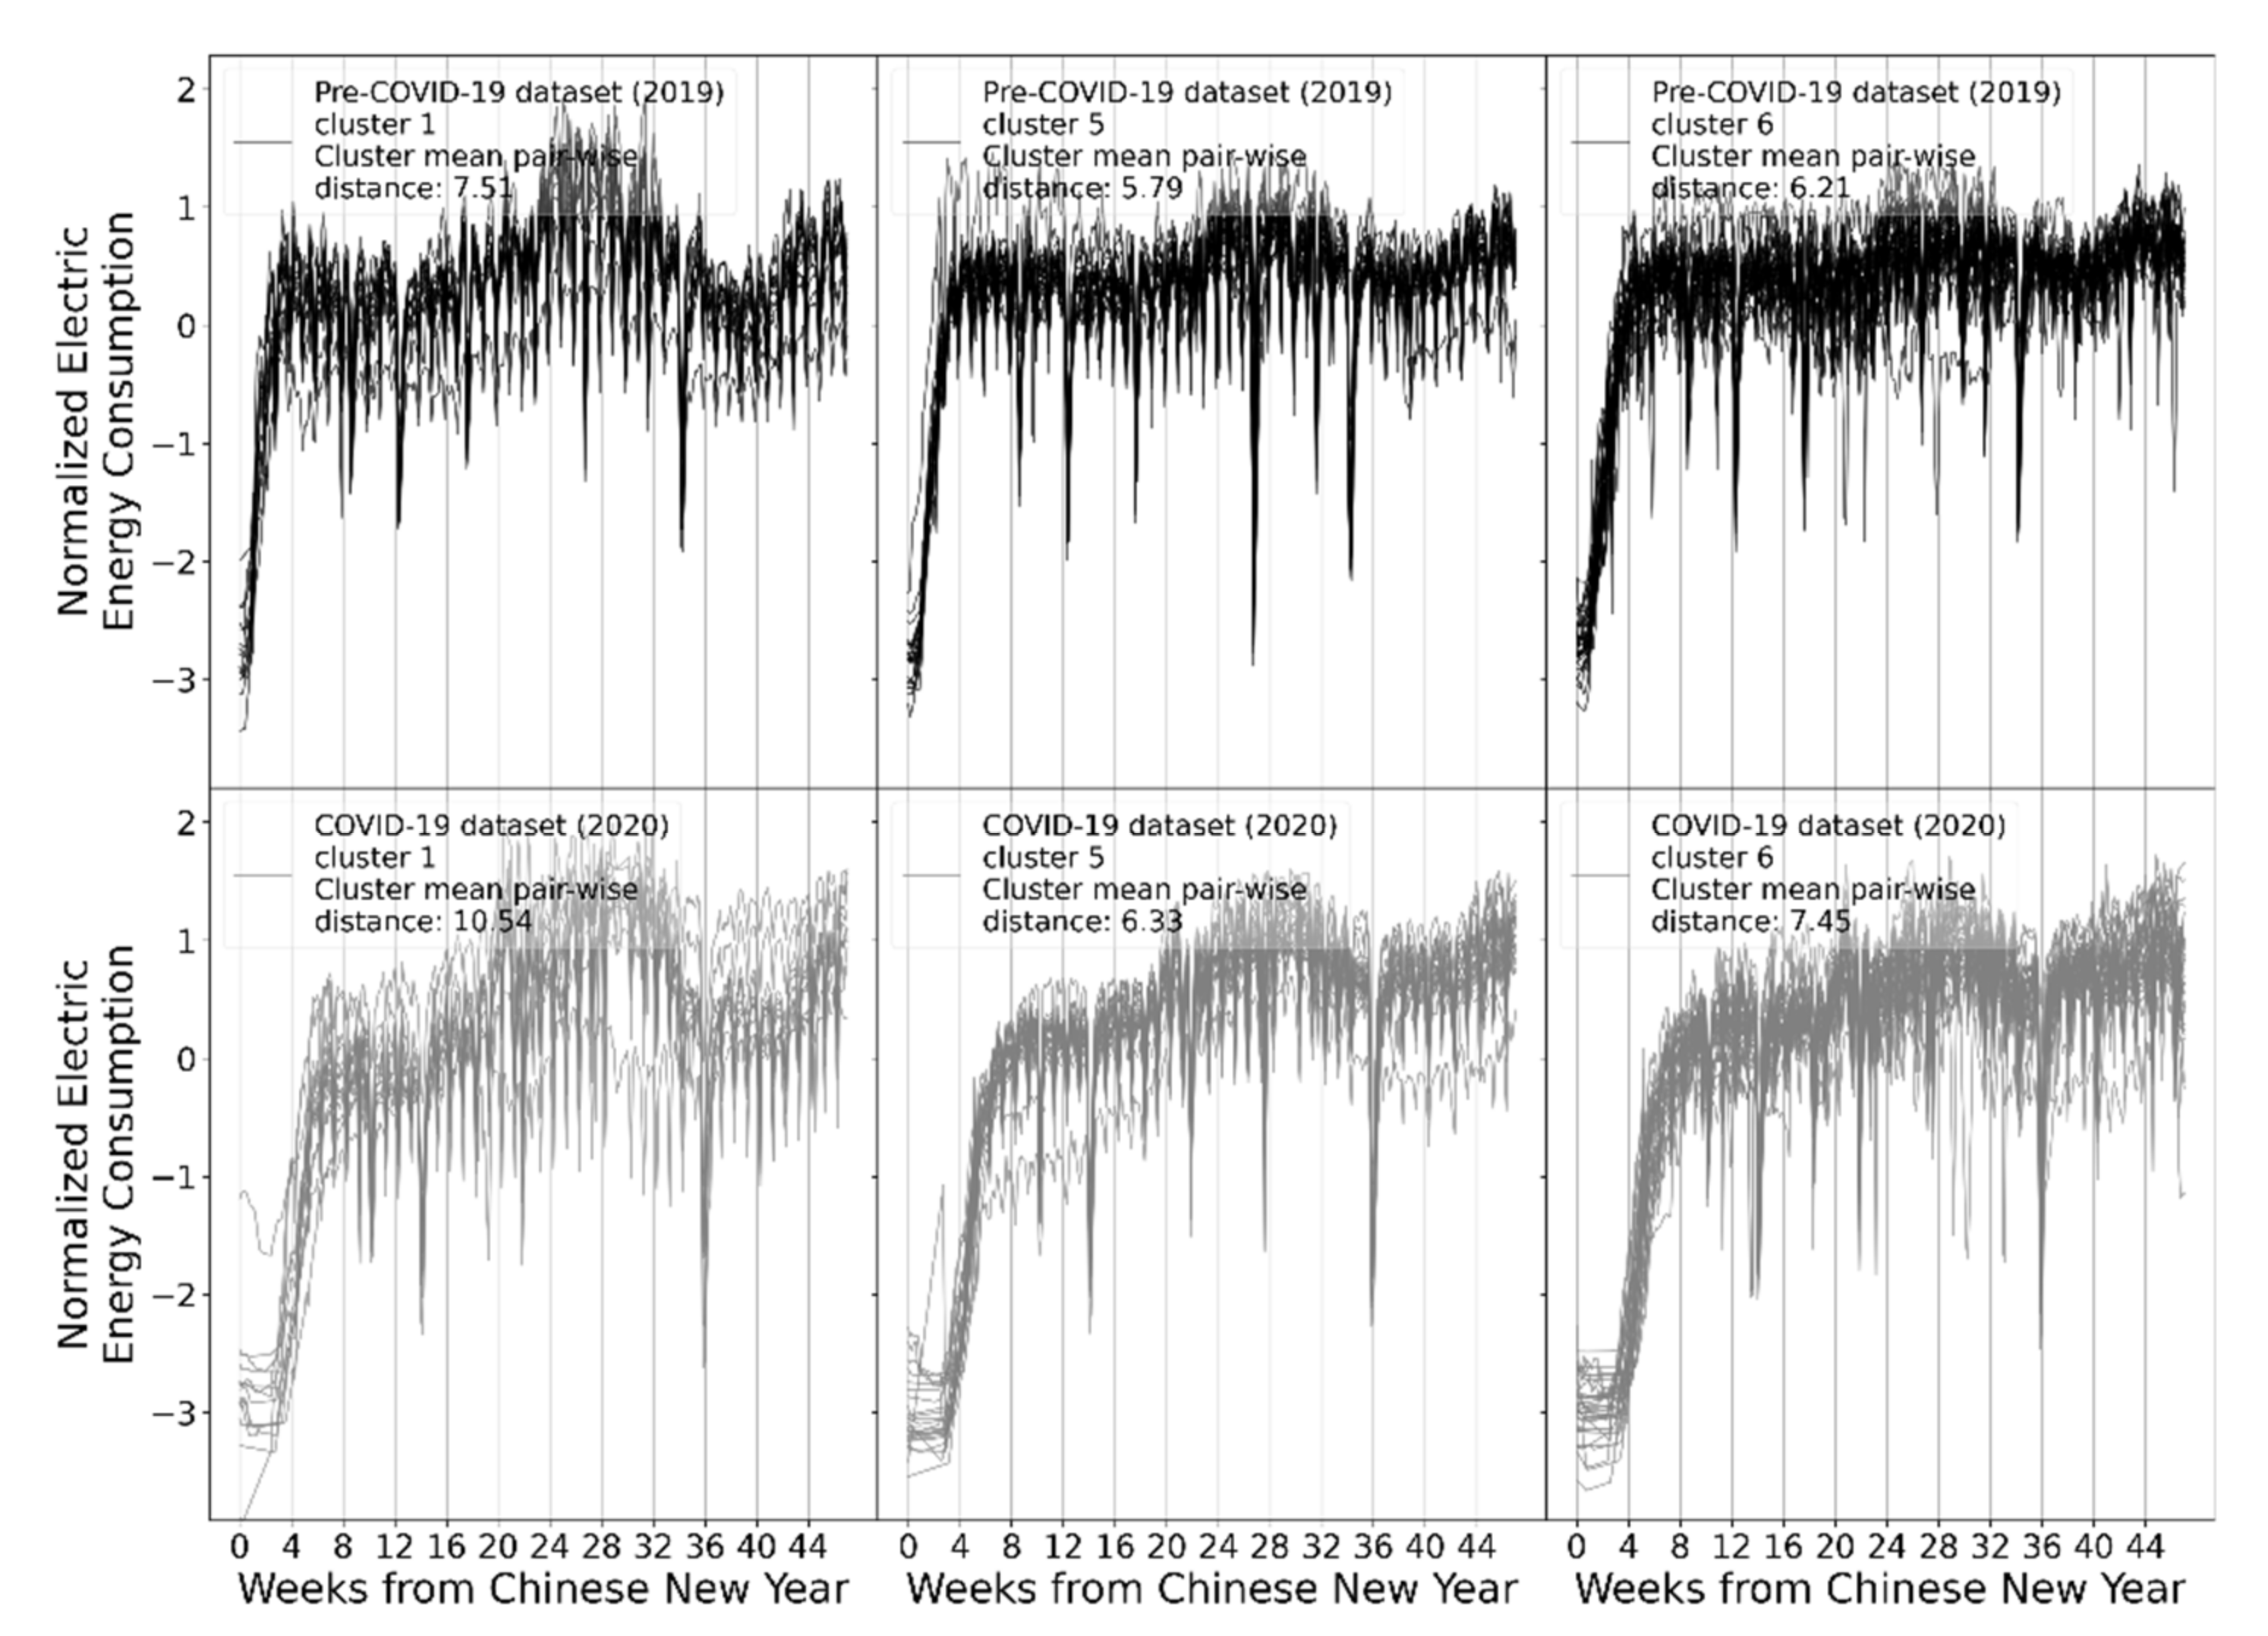
As discussed in Section 3.8.1, the clustering performance of the COVID-19 dataset should be similar to that of the pre-COVID-19 dataset if there is no change in the data-generating distribution (e.g., the economy is running stably, so the electricity consumption follows a stable pattern). This assumption on the data-generating distribution was invalid due to the outbreak of COVID-19. Figure 9 plots the comparison of the clustered pre-COVID-19 dataset and clustered COVID-19 dataset. The timeline of the comparison starts from the Chinese New Year of the respective year to make the results more comparable. This is because, firstly, the Chinese New Year holidays usually recess the economic activities in China (and, therefore, electricity consumption) significantly; secondly, the official lockdown policy during the COVID-19 period was implemented just around the Chinese New Year of 2020. Note that the Chinese New Year is based on the Chinese lunar calendar, which does not have a fixed date in terms of the widely used solar calendar. In 2019, the Chinese New Year was on the 4th of February; however, in 2020, the Chinese New Year was on the 24th of January. In the figure, the pre-COVID-19 clustering result shows better performance in terms of cluster mean pairwise distance for all three clusters. This indicates that the outbreak of COVID-19 made changes to the data-generating distribution of electricity consumption, so the pre-COVID-19 cluster labels were not suitable for the COVID-19 period dataset.
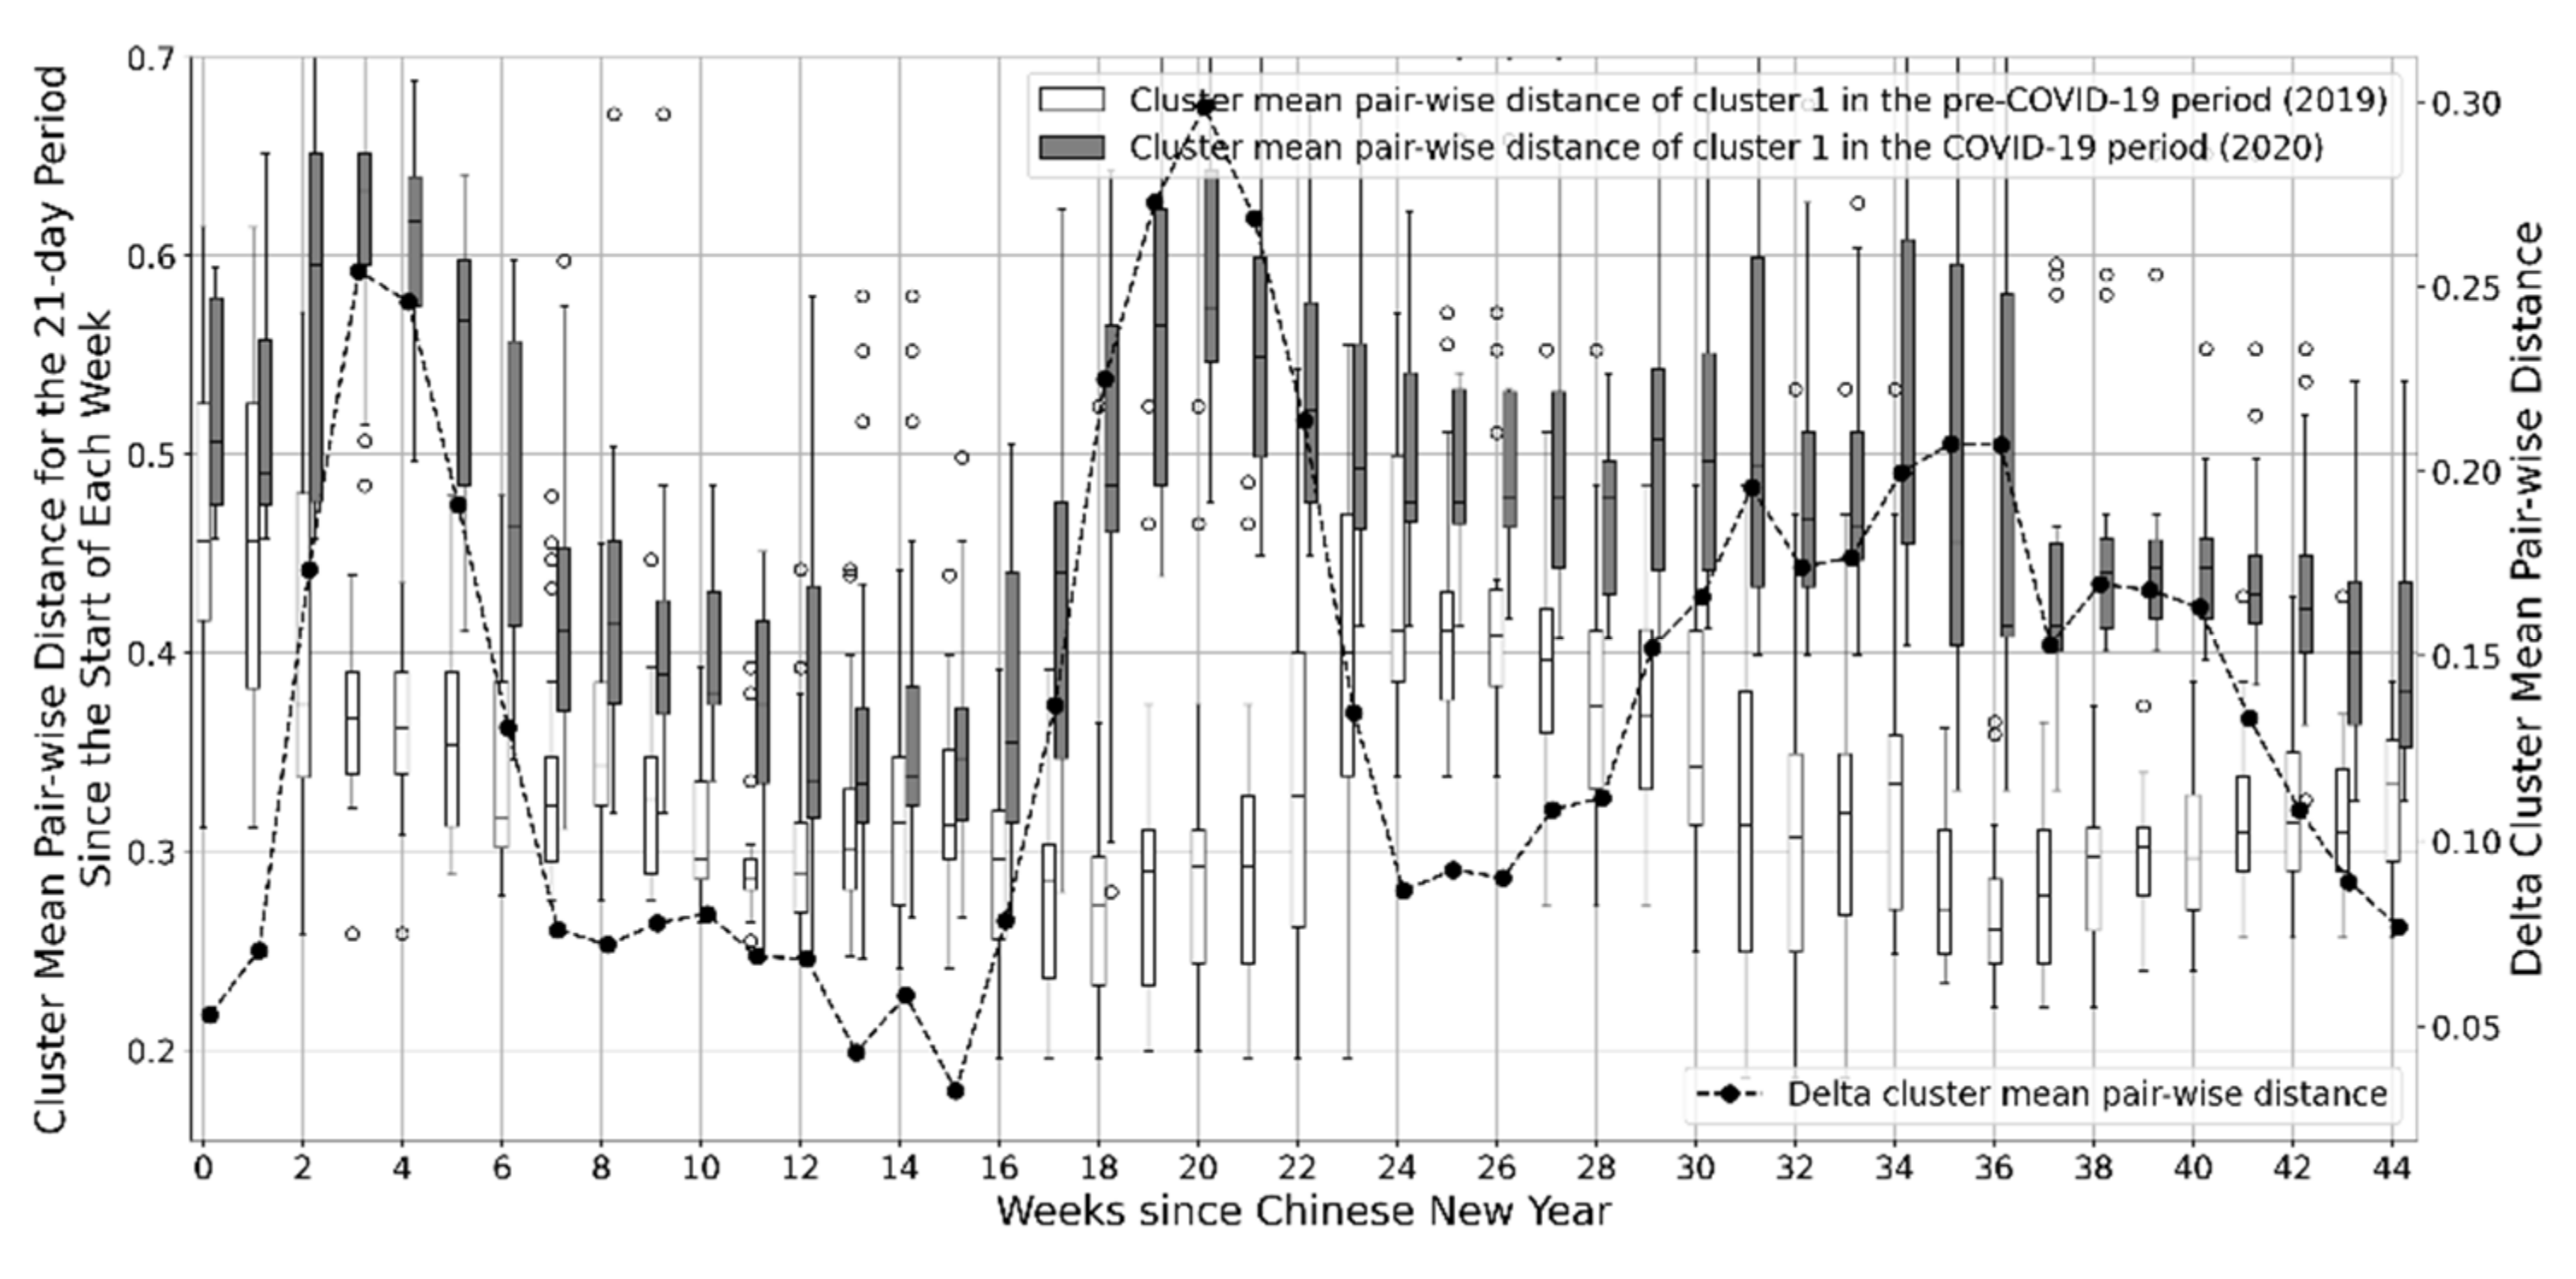
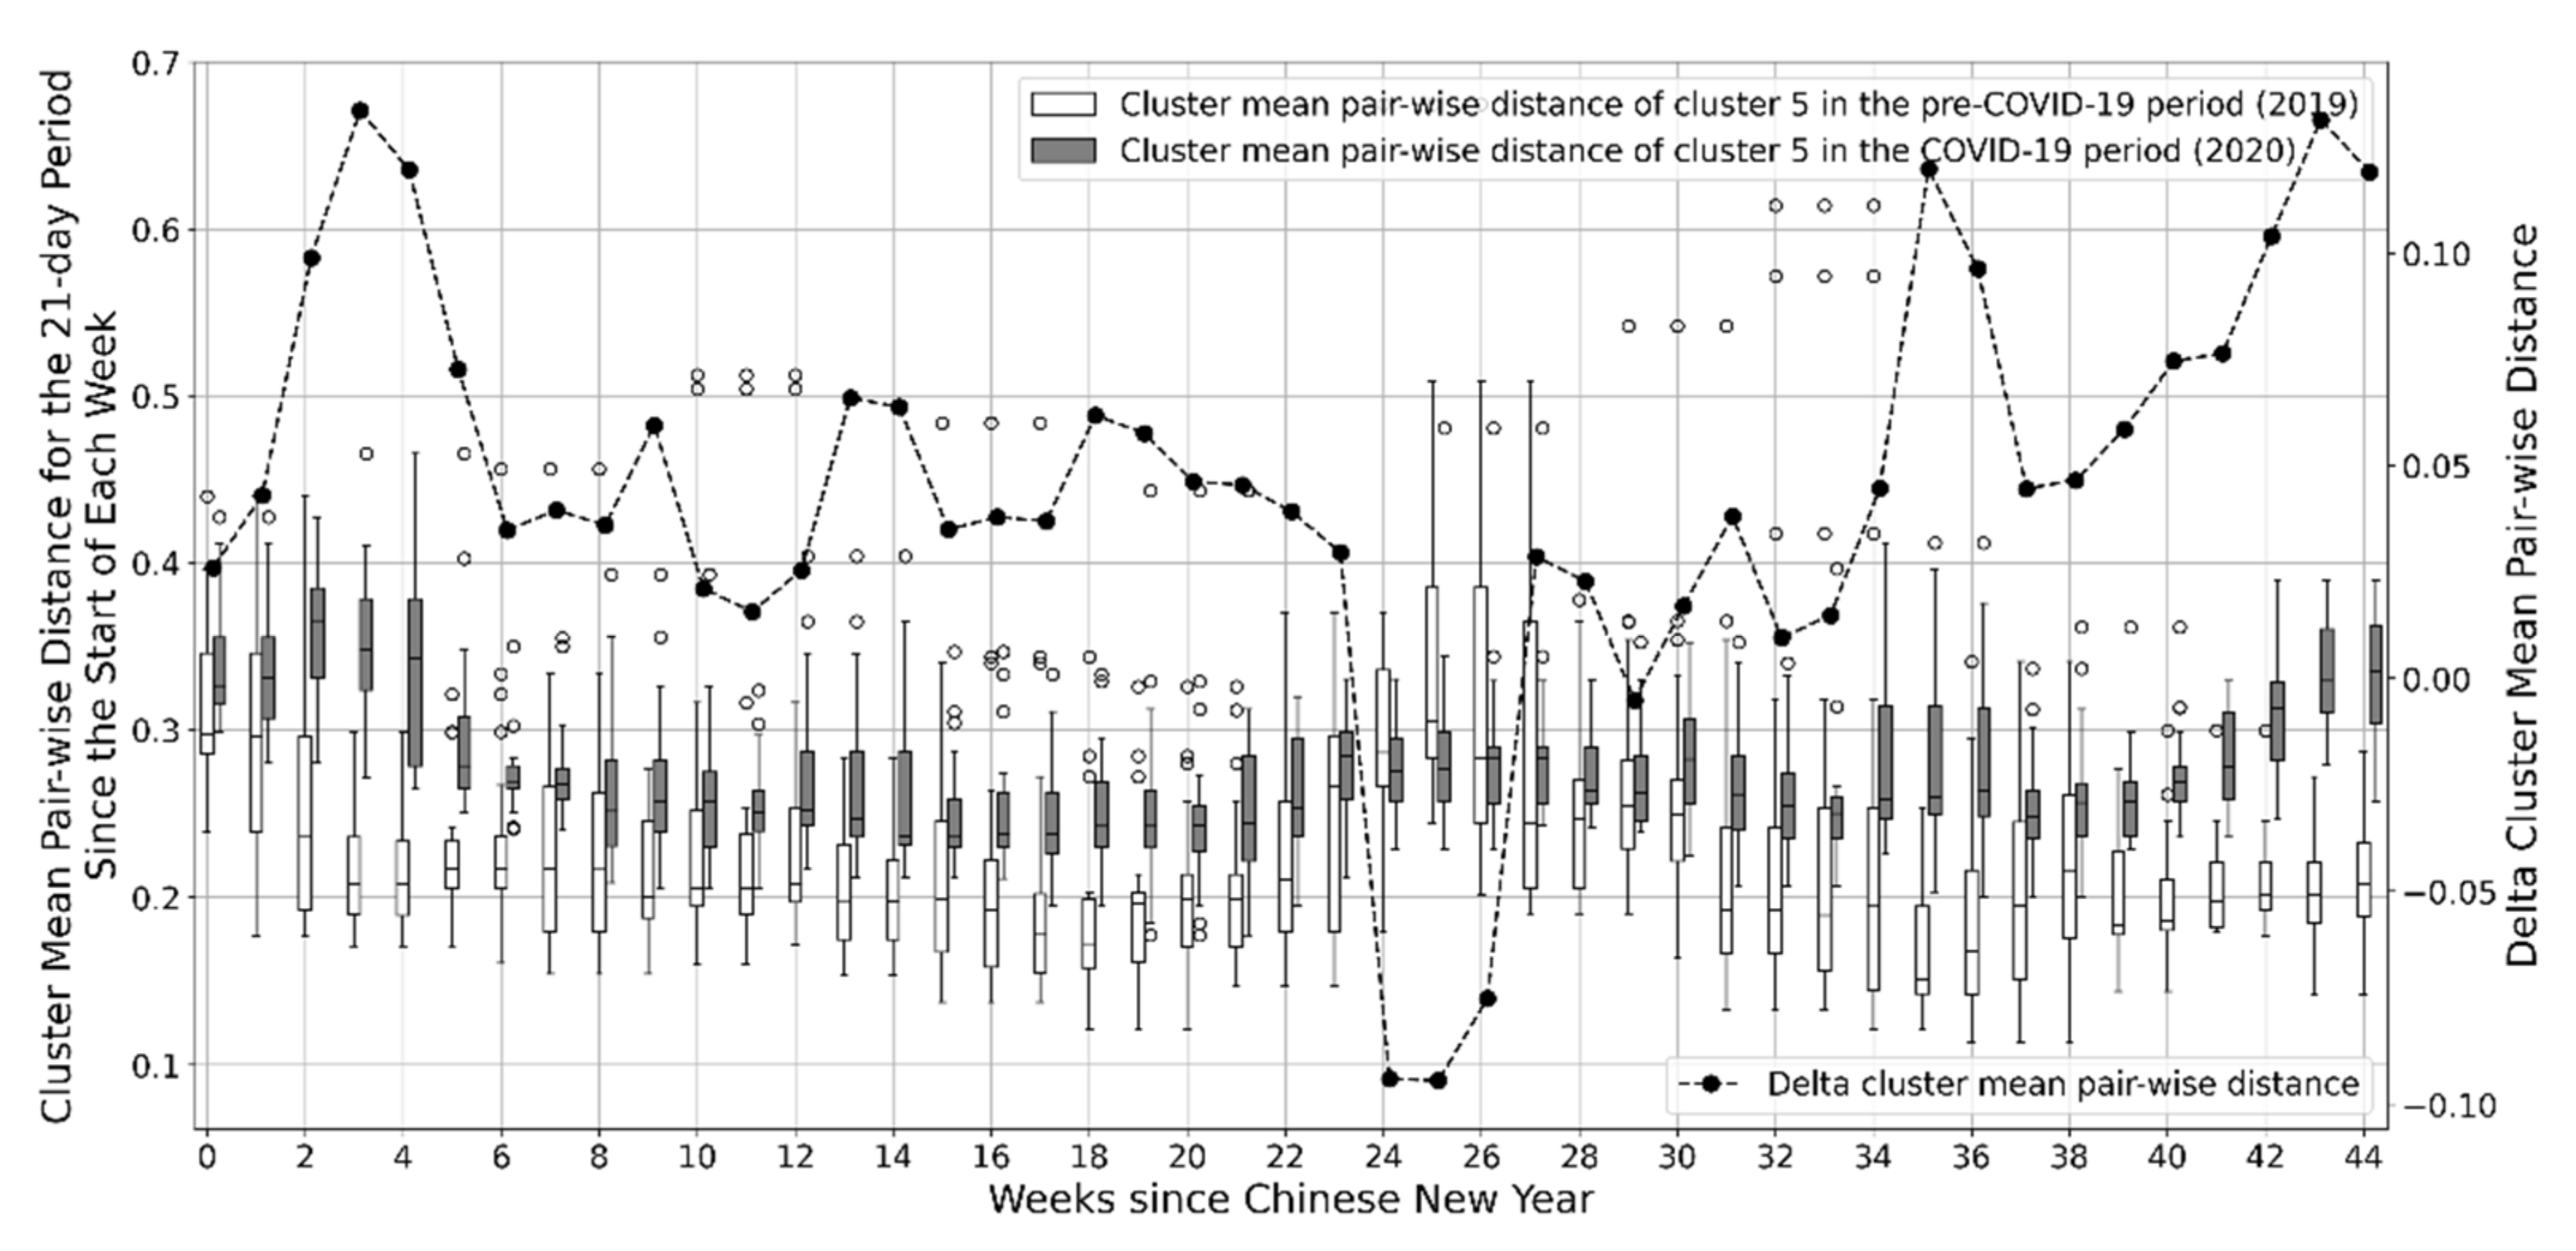
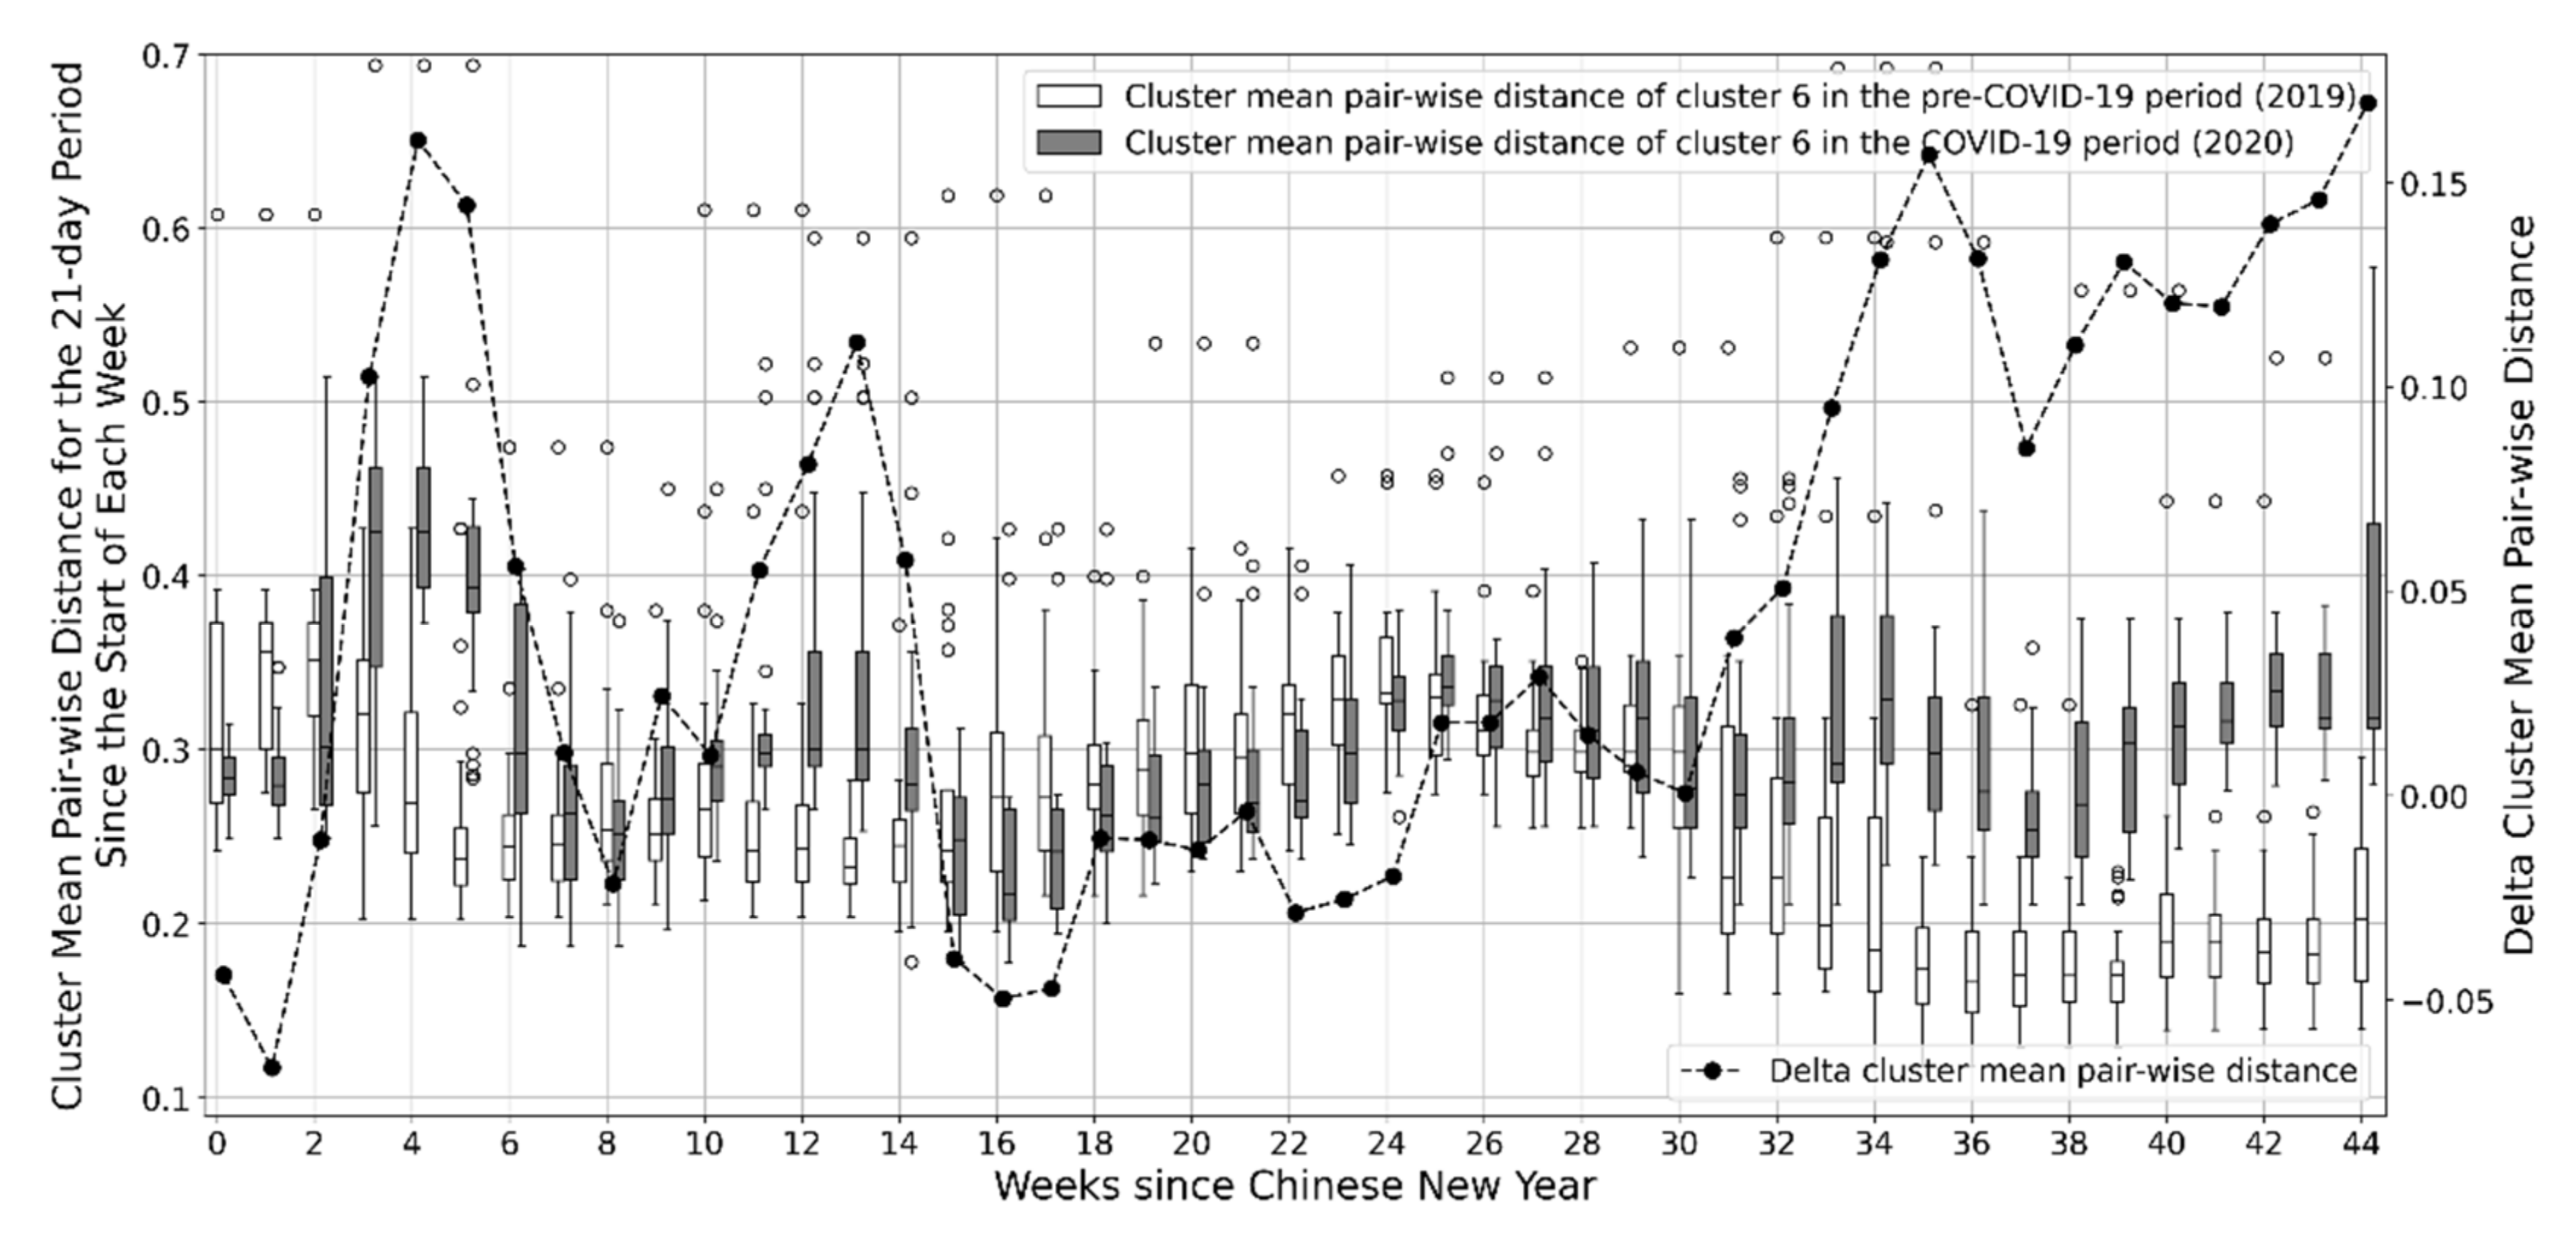
Even though Figure 9 indicates the change of the data generating distribution, it is also obvious that the electricity consumption in the COVID-19 period resumes to a nearly normal level a few weeks after the Chinese New Year. This is because economic activities resumed around April 2020 after the lock-down policies were lifted in most areas of the Zhejiang province. Therefore, it is interesting to study the time evolution of the difference between the two clustering results from the initial outbreak of COVID-19 to the period when the pandemic was under control. Figure 10, Figure 11 and Figure 12 show the boxplot comparisons of the cluster mean pairwise distance between the COVID-19 period and the pre-COVID-19 period for the three selected clusters. Each boxplot in the three figures represents the cluster mean pairwise distance of 21 consecutive days starting from the indicated week. This was to eliminate the effects of potential outlier days. Based on the definition of the cluster mean pairwise distance shown in Section 3.5.4, if there was no COVID-19 pandemic, the cluster mean pairwise distance of 2020 should have remained small and similar to that of 2019. However, COVID-19 has changed the electricity consumption pattern, so the previous hypothesis does not hold, as shown in the three figures below. In addition, the evolution was similar for the difference of the cluster mean pairwise distance between the two periods (named “delta cluster mean pairwise distance”) in all three figures. Some observations include:
- Firstly, the cluster mean pairwise distance of the COVID-19 period became larger than that in the pre-COVID-19 period after week #2 of the Chinese New Year. This indicates that the impact of the pandemic started to reflect on the electricity consumption after week #2. This observation is as expected because a normal Chinese New Year holiday usually lasts for two weeks;
- Secondly, the cluster mean pairwise distance difference between the two periods became smaller after week #5. This indicates that the electricity consumption pattern in the COVID-19 period started to resume to normal levels around this time, which was the end of February 2020. It coincides with the governmental policies of the Zhejiang Province, allowing the resumption of work and production at the end of February 2020 [37];
- The cluster mean pairwise distance difference between the pre-COVID-19 period and the COVID-19 period is still obvious even after the first shock of the pandemic, especially for cluster 1 (Figure 10) and cluster 5 (Figure 11). In these two clusters, the delta cluster mean pairwise distance has never returned to the low level before the pandemic. The difference increased quickly after the initial drop and then fluctuated at a high level. For cluster 6 (Figure 12), the cluster mean pairwise distance difference remained at a low level for several months after the pandemic but increased again toward the end of the year 2020. It indicates the data-generating distribution (i.e., the electricity consumption pattern) has been fundamentally changed by the pandemic even in the post-COVID-19 period;
- There is a peak in the delta cluster mean pairwise distance around week #13 for cluster 5 and cluster 6 (Figure 11 and Figure 12). Week #13 in 2020 was the Labor Day holiday, which was the first long public holiday after the pandemic. A similar peak occured again in all three figures around week #36, which was the National Day holiday of 2020. This indicates that holidays were an important factor that led to the increase of the delta cluster mean pairwise distance, in other words, the larger electricity consumption pattern difference.
4.4. Clustering of COVID-19 Dataset: Via Post-Impact Clustering Result
The analysis in this section was conducted based on the clustering results using the data from the COVID-19 period. The clustering method used in this section is the same as the previous section, but the clustering was based on the COVID-19 period data. Figure 13 shows the clustering result. Compared with the pre-COVID-19 clustering result, the VRI (the metric presented in Section 3.5.5) is 0.65, indicating the cluster labels differ significantly between the pre-COVID-19 clustering result and COVID-19 clustering result. This again shows the pandemic has changed the electricity consumption pattern. Figure 13 shows that the COVID-19 period data are mainly grouped into two clusters (cluster 1 and cluster 2), and the other clusters have very few members. Therefore, the two major populated clusters are used in this study. The two clusters differ mainly during the recovery period when the electricity consumption climbs around March 2020.
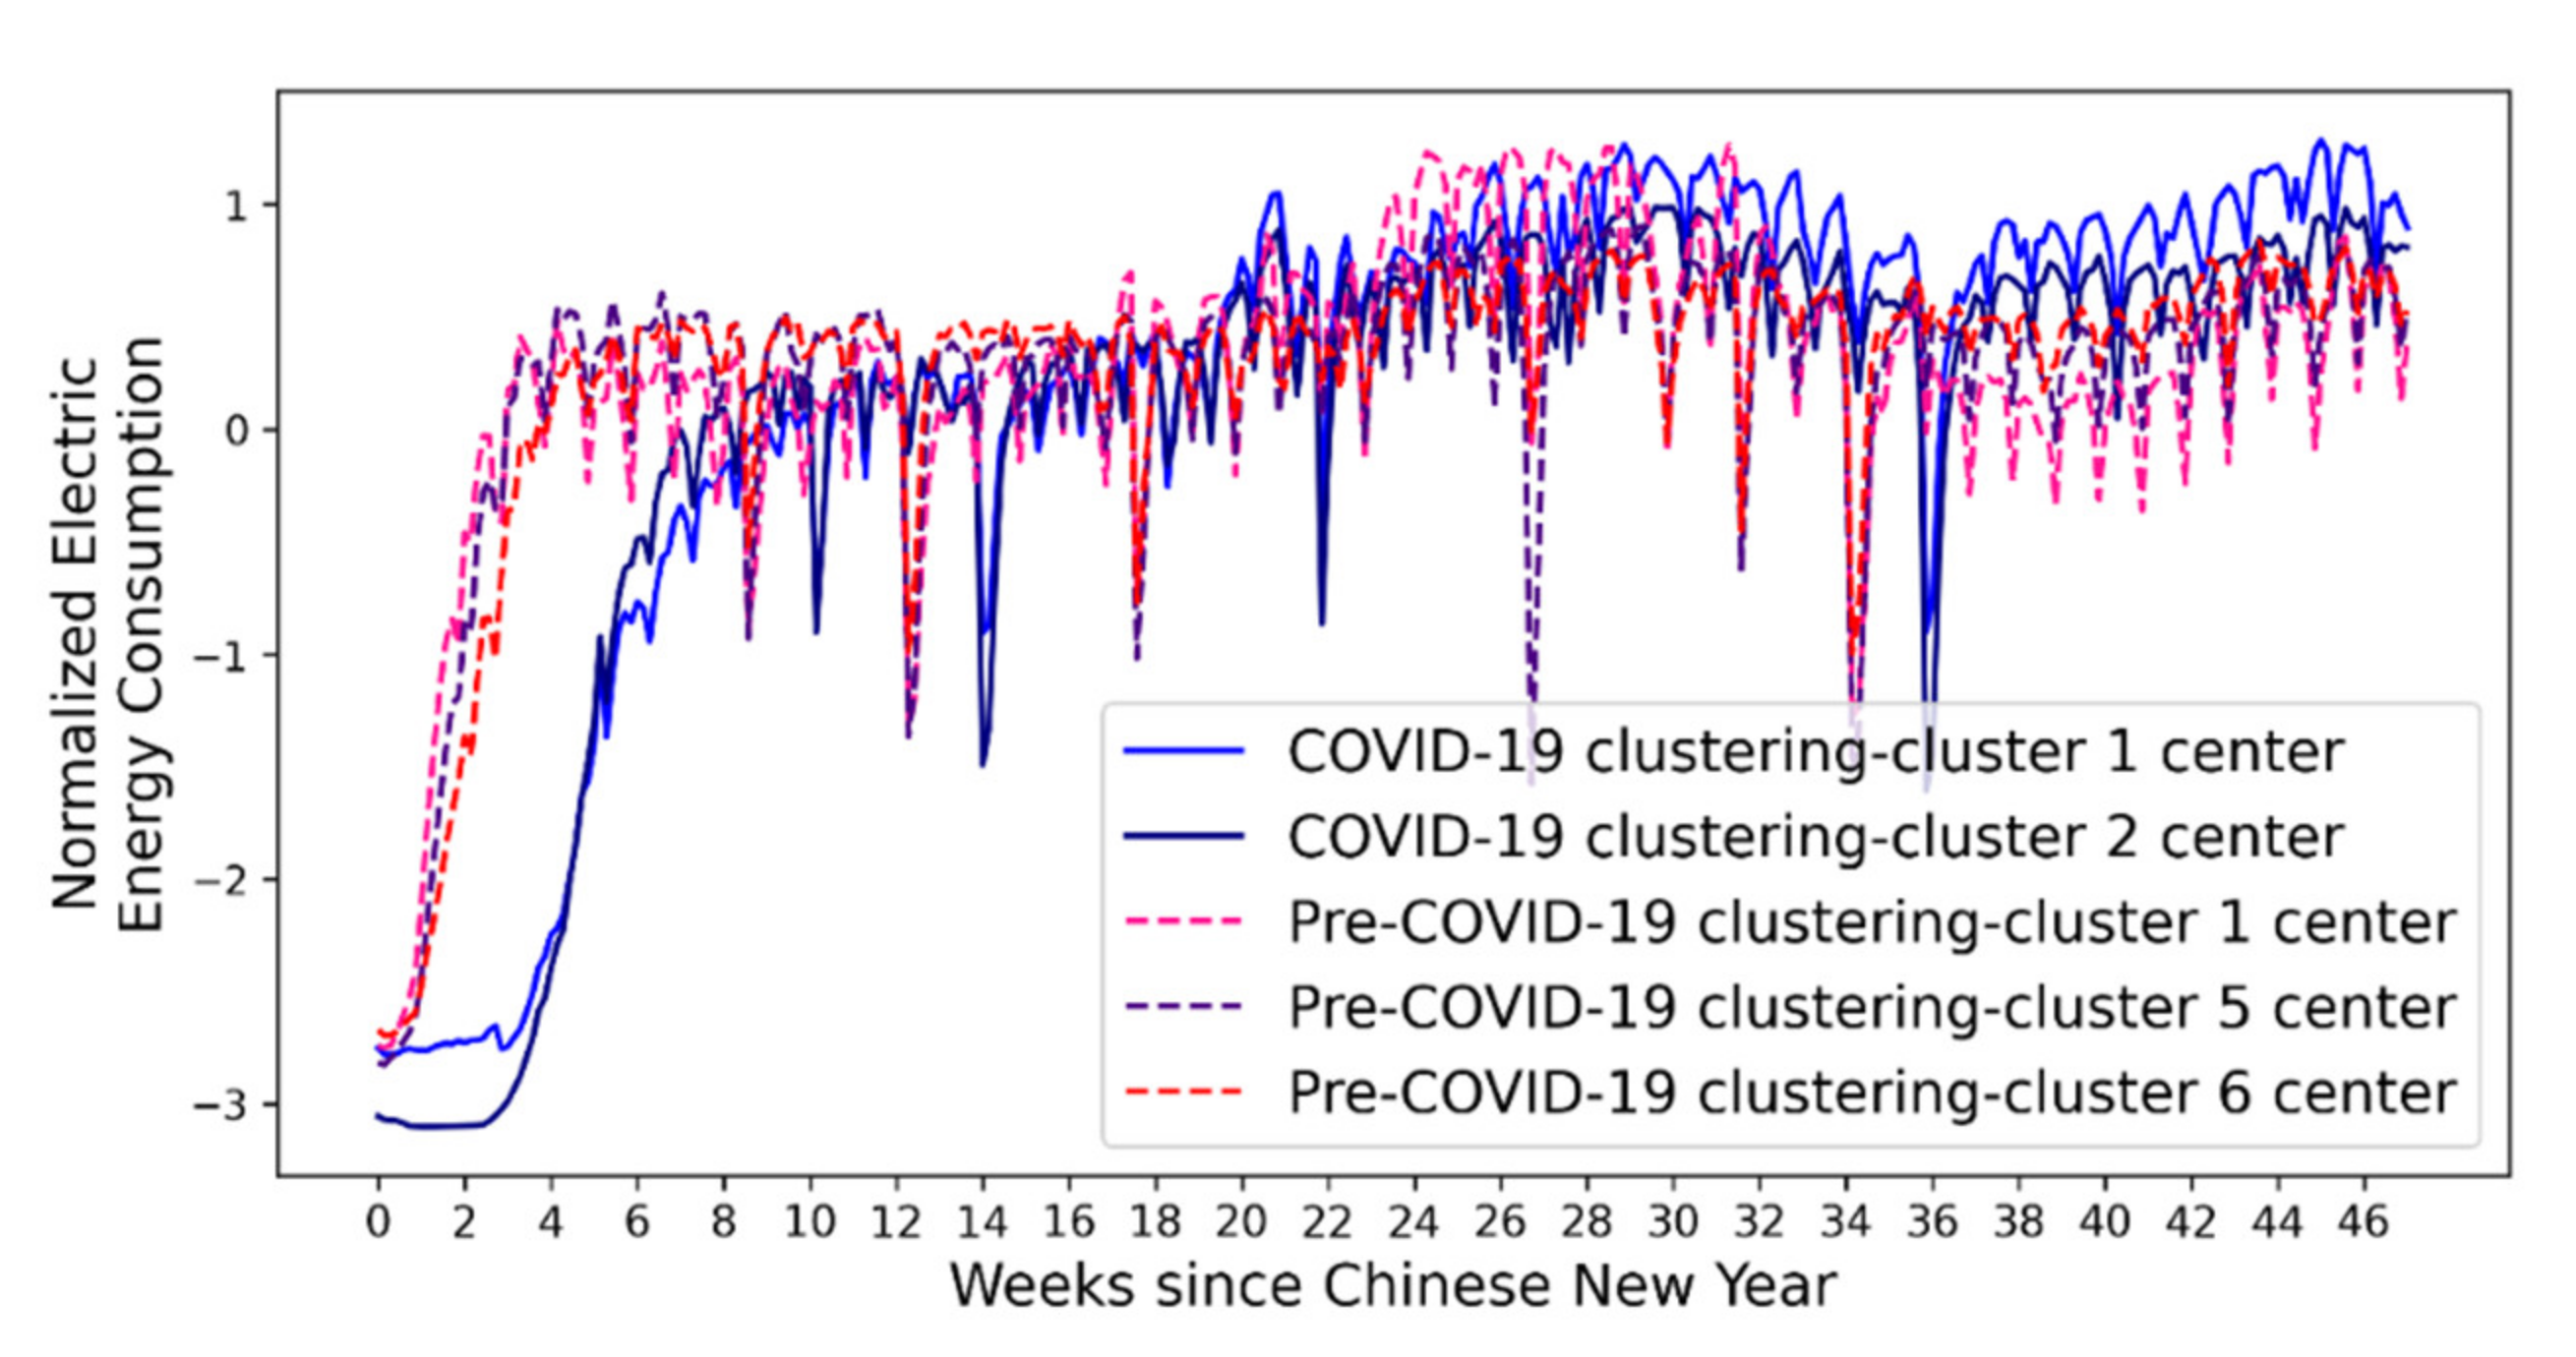
Figure 14 further plots the cluster centers of clusters 1 and 2 in Figure 13 and the centers of the three major clusters in the pre-COVID-19 clustering result (as shown in Figure 7). It is shown that, for the COVID-19 period data, the electricity consumption of cluster 2 starts to recover at around week #2.5 while cluster 1 starts to recover one week later than that. In addition, the recovery speed (the slope of the electric consumption) of cluster 2 is faster than that of cluster 1. The electricity consumption of cluster 2 from the COVID-19 clustering reaches the previous year’s level at around week #8, while cluster 1 reaches the previous year’s level at around week #10. Compared with the pre-COVID-19 clustering, the curves in the COVID-19 period are delayed by more than four weeks. For cluster 2 in the COVID-19 period, the electricity consumption gets back to the nearly-normal level around four weeks later than the pre-COVID-19 period; for cluster 1 in the COVID-19 period, the electricity consumption curve is delayed by around six weeks when it is back to the nearly-normal level.
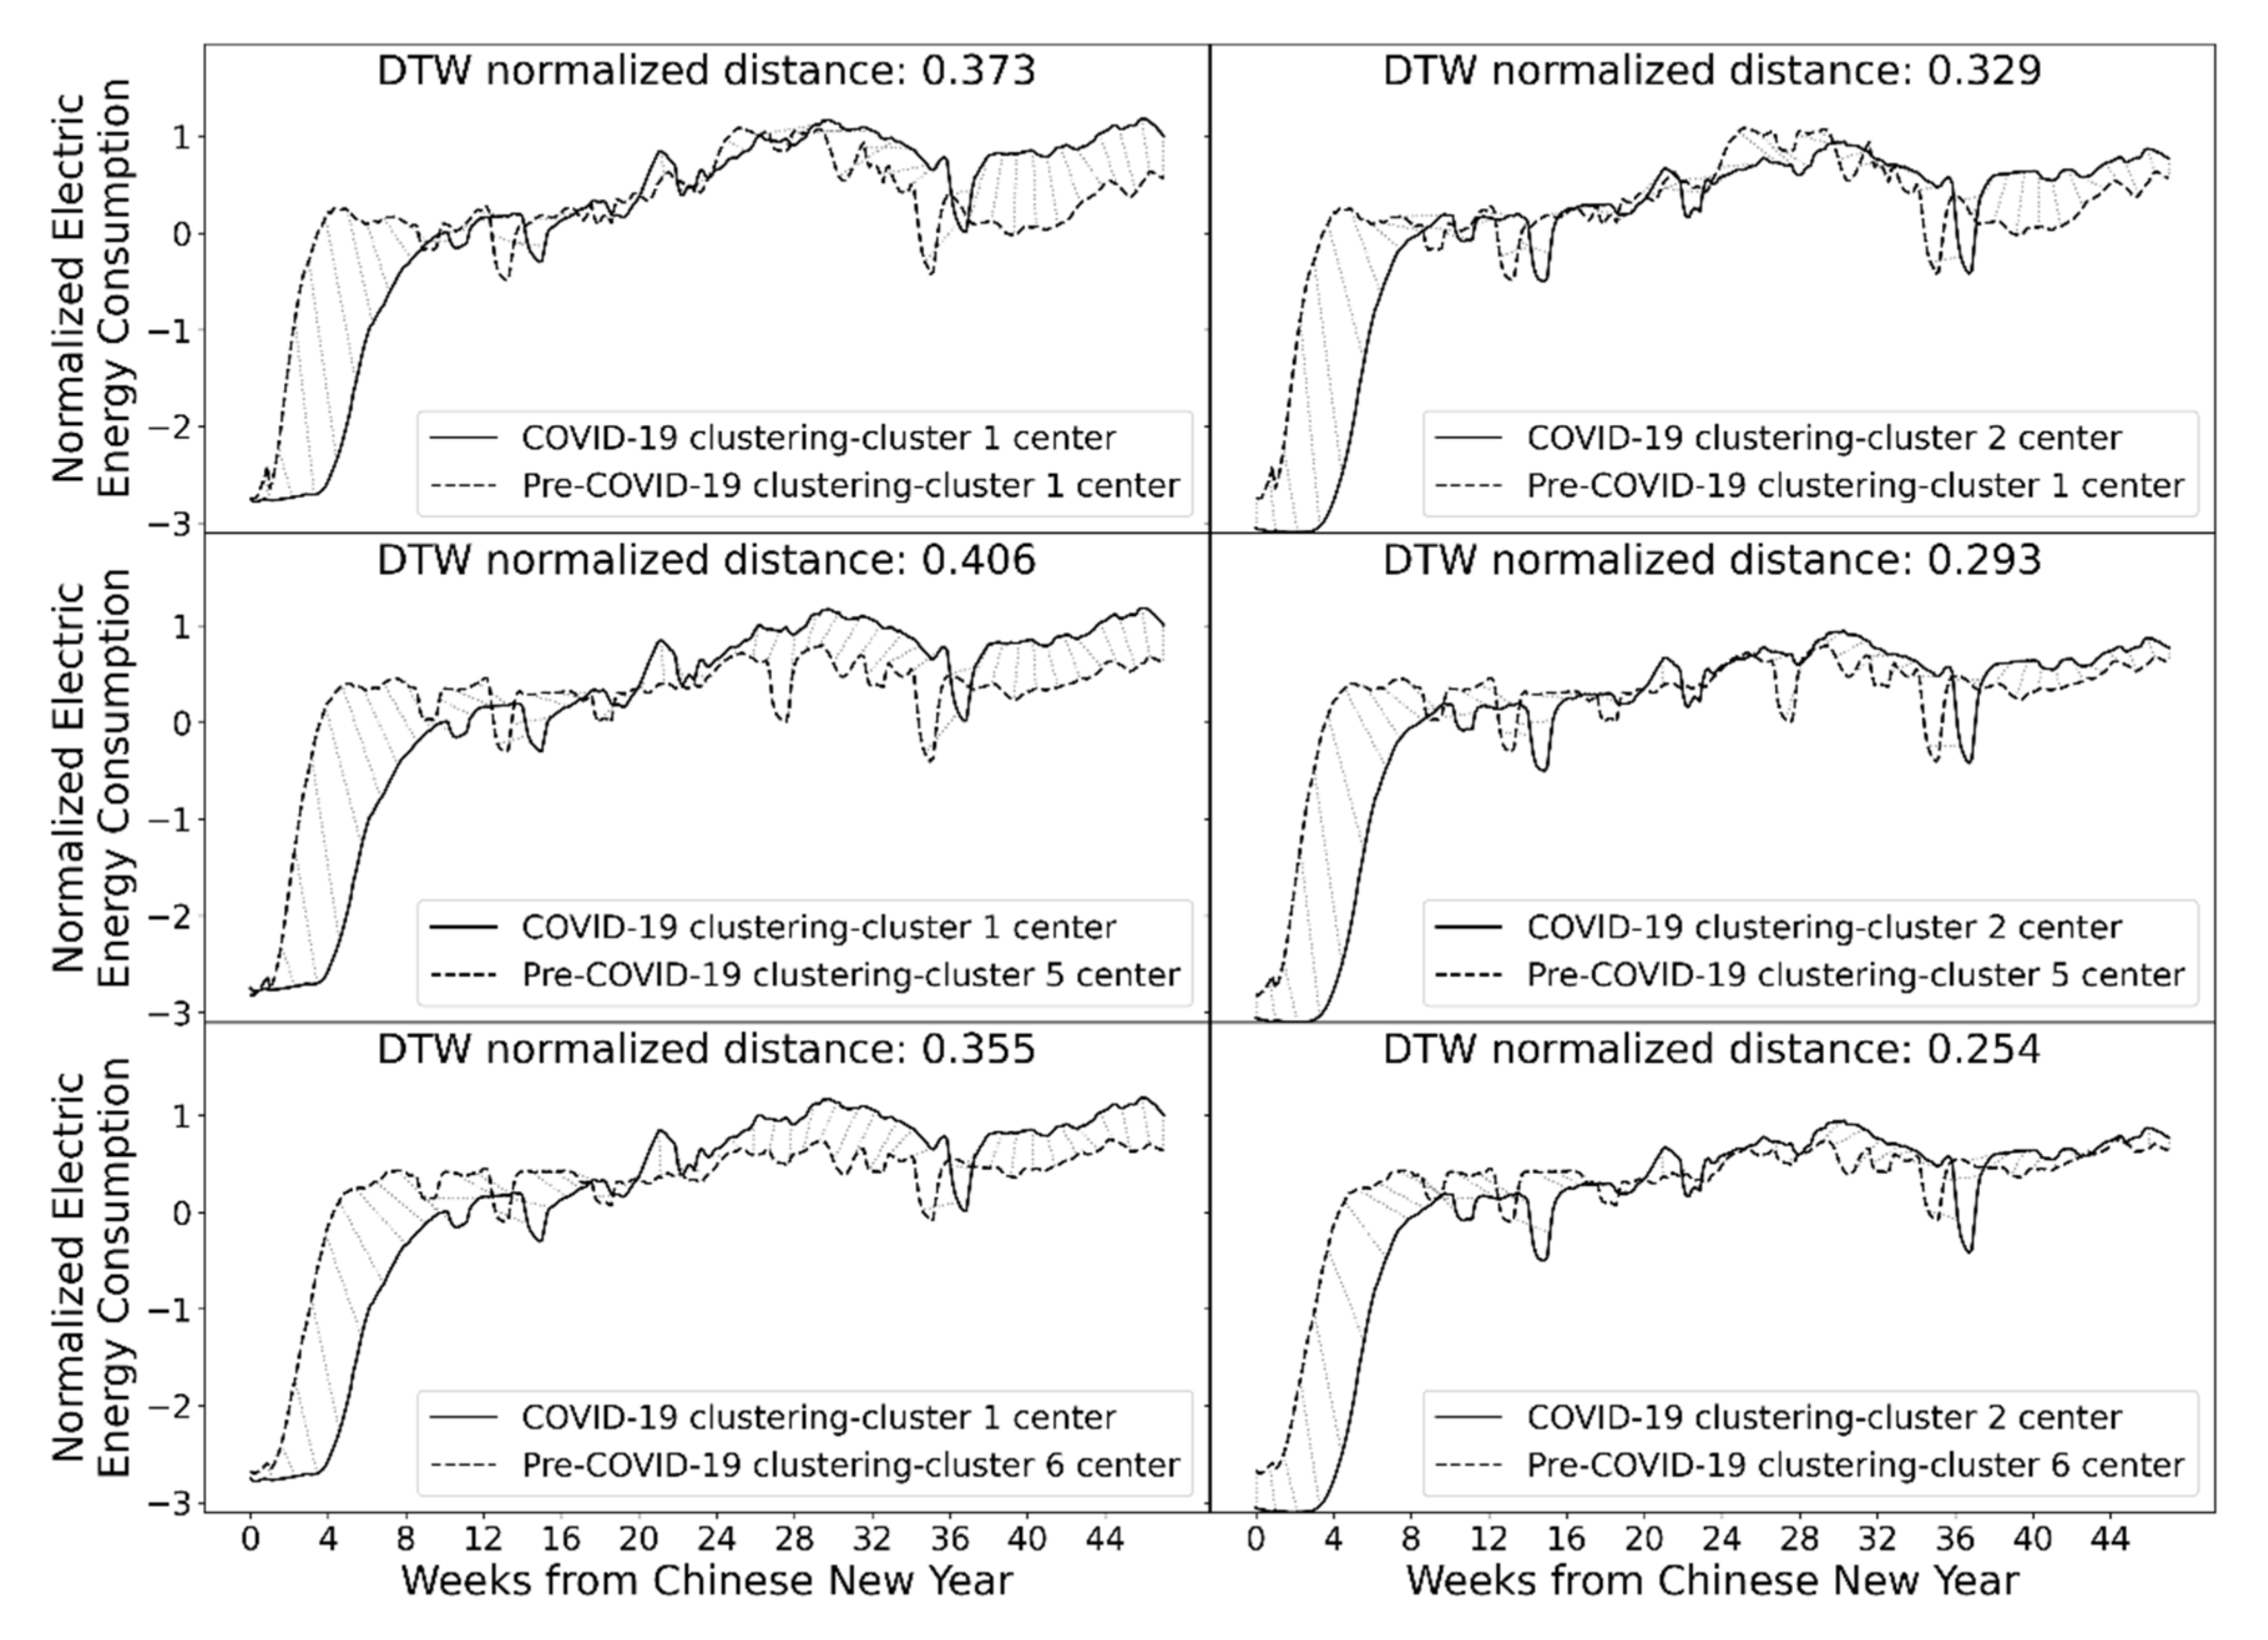
COVID-19 has made delays in the recovery of electricity consumption after the Chinese New Year holidays because of the lockdown enforced by the government. In addition, the shapes of the electricity consumption curves of some cities are also changed by the pandemic. It is shown in Figure 15, which makes a dynamic time warping (DTW) comparison between different clustering centers of the COVID-19 clustering result and pre-COVID-19 clustering result. DTW is a method to measure the similarity between two time-series sequences eliminating the effects of time shifts or different speeds. It is suitable to measure the similarity of the electric energy consumption data between the COVID-19 and pre-COVID-19 periods because it can show the trend disparity without considering the pure time delay effect caused by the lockdown policies. According to the figure, cluster 1′s center of the COVID-19 clustering has a relatively large DTW distance with all three major clusters of the pre-COVID-19 clustering, while the cluster 2 center of the COVID-19 clustering has a relatively smaller DTW distance. Cluster 6 of the pre-COVID-19 clustering has the most similar shape to cluster 2 of the COVID-19 clustering, as shown in the lower-right subplot in Figure 15. The two electricity consumption centers have similar time-series behaviors except for a two-week time shift.
5. Discussion
The impact of COVID-19 on electricity consumption patterns is not obvious because of complex time-series behaviors in the data. In addition, in China, COVID-19 was under control within two months and nearly all social and economic activities have resumed since March of 2020. Therefore, it makes impact analysis difficult because the direct impact only lasts for a very short period. For example, as shown in Figure 1, the electricity consumption of Hangzhou dropped significantly during the lock-down period in February 2020, but then it quickly recovered to a similar level as the year before after the lock-down was lifted. Visually speaking, the electricity consumption of Hangzhou before and after COVID-19 looks similar; however, there are some hidden changes. Another difficulty is the effect of the Chinese New Year holidays. The city lock-down policy of China was enforced at the same time as the Chinese New Year holidays. How to differentiate the effect of COVID-19 from the effect of the Chinese New Year holidays is a challenge. Most recent studies on electricity consumption during COVID-19 focus on the impact analysis of one single city, such as [13,27,38,39] with a much longer lock-down period than China, so the methods and conclusions cannot directly apply.
This study focuses on the electricity consumption of a group of similar cities (districts) in China and uses a clustering-based method to successfully reveal the change of the electricity consumption pattern of the Zhejiang province, China, created by the pandemic. The change of the pattern was quantified by two metrics, including the cluster mean pairwise distance and validation Rand index. Cluster mean pairwise distance measures the similarity of members in the same cluster, and the distance should be similar for the electricity consumption before and after COVID-19 if the pattern is not changed. However, the cluster mean pairwise distance for the electricity consumption of the COVID-19 period (i.e., February 2020 to December 2020) significantly increased compared to that of the pre-COVID-19 period (i.e., January 2019 to December 2019), indicating COVID-19 has changed the consumption pattern. The same conclusion can be made by using another metric, the validation Rand index, which is not closed to 1, indicating the electricity consumption pattern after COVID-19 is different from that of before COVID-19.
The time evolution of the pattern change in the COVID-19 period is quantitively revealed by assessing the delta cluster mean pairwise distance for different weeks after the initial outbreak of COVID-19. Small delta cluster mean pairwise distance indicates the pattern is not changed while the large value indicates the opposite. Week #4 observed the peak change of the electricity consumption pattern of the Zhejiang province. The change of pattern is not obvious in the first three weeks because that period was the Chinese New Year holidays. The electricity consumption resumed to a similar pattern as the pre-COVID-19 period at week #8. This aligns with the duration of the city lock-down policies of the Zhejiang province. This indicates that city lock-down is the main reason for the electricity consumption pattern change during the initial period of COVID-19.
Even though city lock-down policies were enforced for only a few weeks in the Zhejiang province, the impact of COVID-19 on electricity consumption patterns lasted for several months. The behavior of the long-lasting impact is dramatically different for different regions. For some regions (as shown in Figure 11), COVID-19′s impact lasted only during the city lock-down period. After that, the electricity consumption pattern resumed to a similar pattern as the previous year until October of 2020. For some other regions (as shown in Figure 10 and Figure 12), the pandemic has made a long-lasting change to the electricity consumption pattern. The delta cluster mean pairwise distance remains high, indicating electricity consumption in these regions did not resume the previous year’s pattern even after all confinement measures were terminated. This phenomenon is also confirmed by the dynamic time warping analysis. It shows that, for some regions, COVID-19 has only “delayed” effects on electricity consumption, but for others, the electricity consumption pattern is fundamentally changed. The different impacts may be caused by different economic structures, different geographical locations, different region functions, different weather conditions, etc. However, this paper does not consider the effects of various external factors. The scope of this paper was to conduct pure time-series data-driven analysis. Another interesting finding is that, for all regions in the Zhejiang province, the change in electricity consumption pattern peaks at key national holidays (Labor Day and National Day holidays), even for the regions where the electricity consumption pattern resumed to normal after city lock-down policies were lifted. This is probably because Chinese people usually travel in China or abroad during national holidays, but travel has been discouraged by the government since COVID-19 even though other social and economic activities have resumed.
Even though this paper only focuses on analyzing time-series electricity consumption, the proposed clustering method can be used as the first step for a more detailed analysis of the impact. Firstly, the clustering method can accurately group regions with similar electricity consumption patterns and identify the significant representative electricity consumption profiles. This can significantly narrow down the scope of further detailed analysis. For example, the clustering of the pre-COVID-19 dataset gives three major clusters, and each cluster only consists of 14–34 regions. Detailed analysis can be conducted within each cluster, which can be easier than analyzing nearly 90 regions altogether. Secondly, the clustering method quantified the time evolution of the pattern change in different region clusters. The information can be used to target potential affecting external factors. For example, some clusters had increased pattern change around the Labor holiday in 2020. This indicates that these clusters may have major economic activities related to tourism. Thirdly, the clustering method identified the most alike clusters of regions before and after the pandemic via the dynamic time warping evaluation of the representative electricity consumption profiles. This information can help determine the economic structure change of a region before and after the pandemic by comparing the different clusters of regions. For example, the electricity consumption profile of cluster 2 of the COVID-19 clustering is very similar to that of cluster 6 of the pre-COVID-19 clustering. This indicates there may be some economic structure similarities for the regions in the two different clusters. Altogether, the clustering method and results are useful for further analysis to fully understand the impact of the pandemic on social and economic activities.
The study has the following known limitations:
- (1)
- The proposed clustering-based method was designed for and tested the electricity consumption data of the Zhejiang province only. Its generality for the electricity consumption data of other regions, or other types of time series data has not been studied due to the scope of this paper. However, since the theoretical foundation of this method is based on unsupervised learning of time-series data, the method can, generally, be used to quantify the change of pattern in a group of time-series data;
- (2)
- The proposed clustering-based method deals with one-dimensional time series data only (i.e., electricity consumption data in this study). It cannot reveal the intercorrelations among different factors, such as the relationship among mobility, weather, vaccination, and electricity consumption, etc.;
- (3)
- The study used two metrics, including the delta inner-cluster distance and validation Rand index to determine the pattern change in electricity consumption. However, since the proposed method is based on unsupervised learning, the critical threshold values for the proposed metrics could not be determined. The metrics had to be used with relative changes, which required more historical data to perform the analysis;
- (4)
- This study only used two-year data, from January 2019 to December 2020, due to the availability of data. The data size was relatively small.
6. Conclusions and Future Work
Clustering is an unsupervised learning method to reveal hidden information in a relatively large dataset. This study proposed a new K-means clustering-based method to analyze the impact of COVID-19 on the time-series electricity consumption of multiple regions of China. Two non-conventional clustering evaluation metrics, namely the delta inner-cluster distance and validation Rand index, were used for clustering parameter selection and impact analysis. Clustering was performed on both the pre-COVID-19 period and COVID-19 period to reveal the impact of the pandemic. Clustering of the COVID-19 period was further divided into two parts: clustering via pre-impact clustering result and clustering via post-impact clustering result, which uncovered more hidden electricity consumption pattern changes created by the pandemic.
This study used one of the most developed provinces and industrial centers in China, Zhejiang province, as a case study and applied the proposed clustering method to analyze the daily high-voltage electricity consumption data of 87 regions of the Zhejiang province. The clustering analysis quantifiably confirmed that the COVID-19 pandemic has changed the electricity consumption patterns of the Zhejiang province. The proposed method can also quantify the time evolution of the pattern change, and this information can accurately infer the start and end time of confinement measures in the Zhejiang province. After the confinement measures were lifted, some regions still have dramatically different electricity consumption patterns compared to the previous year, which means the pandemic has made a fundamental long-term change. In contrast, the electricity consumption patterns of some regions resumed to a similar pattern as the previous year after the confinement measures were lifted. This paper solely focuses on the analysis of electricity consumption, but the proposed clustering method is helpful for further analysis to fully uncover COVID-19′s impact on social and economic activities.
Future work directions are suggested as follows. Firstly, clustering methods other than K-means can be tested to study the optimal method for electricity consumption data clustering. Secondly, the same clustering method should be applied to other electricity consumption datasets to validate the method’s generality. Finally, multi-parameter analysis needs to be performed to consider a wide range of external parameters, such as weather conditions, economic structures, economic indexes, mobility, etc. The findings can answer why the electricity consumption pattern changed and predict how long the impact would last.
Author Contributions
Conceptualization, Z.Z., A.C. and S.P.A.; methodology, Z.Z., S.P.A. and A.C.; programming, Z.Z.; results analysis, Z.Z.; writing—original draft preparation, Z.Z. and A.C.; writing—review and editing, Z.Z., A.C. and S.P.A.; visualization, Z.Z.; project administration, A.C. All authors have read and agreed to the published version of the manuscript.
Funding
The information will be added later upon acceptance.
Institutional Review Board Statement
Not applicable.
Informed Consent Statement
Not applicable.
Acknowledgments
Ali Cheshmehzangi acknowledges the National Natural Science Foundation of China (NSFC) for funding project number 71950410760, and the Ministry of Education, Culture, Sports, Science, and Technology (MEXT) for the provision of funding for further studies on peace and urban sustainability. Zhiang Zhang acknowledges University of Nottingham Ningbo China for the New Researcher Grant (funding project number I03210900007). Ali Cheshmehzangi thanks the Research and Knowledge Exchange Team of University of Nottingham Ningbo China for the provision of internal Seed Funding grant, which has been used to cover part of the publishing fees.
Conflicts of Interest
The authors declare no conflict of interest.
References
- Aruga, K.; Islam, M.M.; Jannat, A. Effects of COVID-19 on Indian Energy Consumption. Sustainability 2020, 12, 5616. [Google Scholar] [CrossRef]
- Cheshmehzangi, A. COVID-19 and household energy implications: What are the main impacts on energy use? Heliyon 2020, 6, e05202. [Google Scholar] [CrossRef] [PubMed]
- Carvalho, M.; Bandeira de Mello Delgado, D.; de Lima, K.M.; de Camargo Cancela, M.; dos Siqueira, C.A.; de Souza, D.L.B. Effects of the COVID-19 pandemic on the Brazilian electricity consumption patterns. Int. J. Energy Res. 2021, 45, 3358–3364. [Google Scholar] [CrossRef]
- Kuzemko, C.; Bradshaw, M.; Bridge, G.; Goldthau, A.; Jewell, J.; Overland, I.; Scholten, D.; Van de Graaf, T.; Westphal, K. Covid-19 and the politics of sustainable energy transitions. Energy Res. Soc. Sci. 2020, 68, 101685. [Google Scholar] [CrossRef]
- Brosemer, K.; Schelly, C.; Gagnon, V.; Arola, K.L.; Pearce, J.M.; Bessette, D.; Olabisi, L.S. The energy crises revealed by COVID: Intersections of Indigeneity, inequity, and health. Energy Res. Soc. Sci. 2020, 68, 101661. [Google Scholar] [CrossRef] [PubMed]
- Graff, M.; Carley, S. COVID-19 assistance needs to target energy insecurity. Nat. Energy 2020, 5, 352–354. [Google Scholar] [CrossRef]
- Jiang, P.; Fan, Y.V.; Klemeš, J.J. Impacts of COVID-19 on energy demand and consumption: Challenges, lessons and emerging opportunities. Appl. Energy 2021, 285, 116441. [Google Scholar] [CrossRef]
- Abu-Rayash, A.; Dincer, I. Analysis of the electricity demand trends amidst the COVID-19 coronavirus pandemic. Energy Res. Soc. Sci. 2020, 68, 101682. [Google Scholar] [CrossRef]
- IEA. Covid-19 Impact on Electricity; IEA: Paris, France, 2021. [Google Scholar]
- Electric Power Research Institute. Electric Power Research Institute. COVID-19 Bulk System Impacts: Demand Impacts and Operational and Control Center Practices. Electr. Power Res. Inst. 2020, 27. [Google Scholar]
- Santiago, I.; Moreno-Munoz, A.; Quintero-Jiménez, P.; Garcia-Torres, F.; Gonzalez-Redondo, M.J. Electricity demand during pandemic times: The case of the COVID-19 in Spain. Energy Policy 2021, 148, 111964. [Google Scholar] [CrossRef] [PubMed]
- Halbrügge, S.; Schott, P.; Weibelzahl, M.; Buhl, H.U.; Fridgen, G.; Schöpf, M. How did the German and other European electricity systems react to the COVID-19 pandemic? Appl. Energy 2021, 285, 116370. [Google Scholar] [CrossRef]
- Rouleau, J.; Gosselin, L. Impacts of the COVID-19 lockdown on energy consumption in a Canadian social housing building. Appl. Energy 2021, 287, 116565. [Google Scholar] [CrossRef] [PubMed]
- Gillingham, K.T.; Knittel, C.R.; Li, J.; Ovaere, M.; Reguant, M. The Short-run and Long-run Effects of Covid-19 on Energy and the Environment. Joule 2020, 4, 1337–1341. [Google Scholar] [CrossRef]
- Kirli, D.; Parzen, M.; Kiprakis, A. Impact of the COVID-19 Lockdown on the Electricity System of Great Britain: A Study on Energy Demand, Generation, Pricing and Grid Stability. Energies 2021, 14, 635. [Google Scholar] [CrossRef]
- Edomah, N.; Ndulue, G. Energy transition in a lockdown: An analysis of the impact of COVID-19 on changes in electricity demand in Lagos Nigeria. Glob. Transit. 2020, 2, 127–137. [Google Scholar] [CrossRef] [PubMed]
- Krarti, M.; Aldubyan, M. Review analysis of COVID-19 impact on electricity demand for residential buildings. Renew. Sustain. Energy Rev. 2021, 143, 110888. [Google Scholar] [CrossRef]
- Falchetta, G.; Noussan, M. The Impact of COVID-19 on Transport Demand, Modal Choices, and Sectoral Energy Consumption in Europe. IAEE Energy Forum 2020, 2020, 48–50. [Google Scholar]
- Narajewski, M.; Ziel, F. Changes in electricity demand pattern in Europe due to COVID-19 shutdowns. arXiv 2020, arXiv:2004.14864. [Google Scholar]
- Bahmanyar, A.; Estebsari, A.; Ernst, D. The impact of different COVID-19 containment measures on electricity consumption in Europe. Energy Res. Soc. Sci. 2020, 68, 101683. [Google Scholar] [CrossRef] [PubMed]
- Liu, X.; Lin, Z. Impact of Covid-19 Pandemic on Electricity Demand in the UK Based on Multivariate Time Series Forecasting with Bidirectional Long Short Term Memory. Energy 2021, 227, 120455. [Google Scholar] [CrossRef]
- Werth, A.; Gravino, P.; Prevedello, G. Impact analysis of COVID-19 responses on energy grid dynamics in Europe. Appl. Energy 2021, 281, 116045. [Google Scholar] [CrossRef] [PubMed]
- Eryilmaz, D.; Patria, M.; Heilbrun, C. Assessment of the COVID-19 pandemic effect on regional electricity generation mix in NYISO, MISO, and PJM markets. Electr. J. 2020, 33, 106829. [Google Scholar] [CrossRef]
- Mahfuz Alam, S.M.; Ali, M.H. Analysis of COVID-19 effect on residential loads and distribution transformers. Int. J. Electr. Power Energy Syst. 2021, 129, 106832. [Google Scholar] [CrossRef]
- Zhong, H.; Tan, Z.; He, Y.; Xie, L.; Kang, C. Implications of COVID-19 for the electricity industry: A comprehensive review. CSEE J. Power Energy Syst. 2020, 6, 489–495. [Google Scholar]
- Wang, B.; Yang, Z.; Xuan, J.; Jiao, K. Crises and opportunities in terms of energy and AI technologies during the COVID-19 pandemic. Energy AI 2020, 1, 100013. [Google Scholar] [CrossRef]
- Alasali, F.; Nusair, K.; Alhmoud, L.; Zarour, E. Impact of the COVID-19 Pandemic on Electricity Demand and Load Forecasting. Sustainability 2021, 13, 1435. [Google Scholar] [CrossRef]
- De Mello Delgado, D.B.; de Lima, K.M.; de Camargo Cancela, M.; dos Santos Siqueira, C.A.; Carvalho, M.; de Souza, D.L.B. Trend analyses of electricity load changes in Brazil due to COVID-19 shutdowns. Electr. Power Syst. Res. 2021, 193, 107009. [Google Scholar]
- Wang, Z.; Hong, T.Z.; Li, H.; Piette, M.A. Predicting City-Scale Daily Electricity Consumption Using Data-Driven Models. Adv. Appl. Energy 2021, 2, 100025. [Google Scholar] [CrossRef]
- National Bureau of Statistics of China. National Data. 2021. Available online: https://data.stats.gov.cn/ (accessed on 9 May 2021).
- National Health Commission of the People’s Republic of China. COVID-19 Report. 2021. Available online: http://www.nhc.gov.cn/xcs/yqtb/list_gzbd.shtml (accessed on 9 May 2021).
- World Health Organization. Listings of WHO’s Response to COVID-19. 2020. Available online: https://www.who.int/news/item/29-06-2020-covidtimeline (accessed on 9 May 2021).
- Park, J.Y.; Yang, X.; Miller, C.; Arjunan, P.; Nagy, Z. Apples or oranges? Identification of fundamental load shape profiles for benchmarking buildings using a large and diverse dataset. Appl. Energy 2019, 236, 1280–1295. [Google Scholar] [CrossRef]
- Zhan, S.; Liu, Z.; Chong, A.; Yan, D. Building categorization revisited: A clustering-based approach to using smart meter data for building energy benchmarking. Appl. Energy 2020, 269, 114920. [Google Scholar] [CrossRef]
- Caliński, T.; Harabasz, J. A dendrite method for cluster analysis. Commun. Stat. 1974, 3, 1–27. [Google Scholar]
- Hubert, L. Arabie, Comparing partitions. J. Classif. 1985, 2, 193–218. [Google Scholar] [CrossRef]
- Xinhua News Agency. Zhejiang Issued 12 Local Standards to Provide Support for COVID-19 Control and the Resumption of Work and Production. 2020. Available online: http://www.gov.cn/xinwen/2020-02/29/content_5485025.htm (accessed on 13 May 2021).
- Abulibdeh, A. Spatiotemporal analysis of water-electricity consumption in the context of the COVID-19 pandemic across six socioeconomic sectors in Doha City, Qatar. Appl. Energy 2021, 304, 117864. [Google Scholar] [CrossRef] [PubMed]
- García, S.; Parejo, A.; Personal, E.; Guerrero, J.I.; Biscarri, F.; León, C. A retrospective analysis of the impact of the COVID-19 restrictions on energy consumption at a disaggregated level. Appl. Energy 2021, 287, 116547. [Google Scholar] [CrossRef] [PubMed]
Figure 1.
Daily high-voltage electricity consumption of Hangzhou (the capital city of the Zhejiang province) from 01 January 2019 to 31 December 2020.
Figure 1.
Daily high-voltage electricity consumption of Hangzhou (the capital city of the Zhejiang province) from 01 January 2019 to 31 December 2020.

Figure 2.
Analysis workflow.

Figure 3.
An example of using an existing clustering result applying to additional new data (this is the hypothetical result with only five samples for demonstration purposes).
Figure 3.
An example of using an existing clustering result applying to additional new data (this is the hypothetical result with only five samples for demonstration purposes).

Figure 4.
An example of two different clustering results obtained by using different segmentations of the same time-series dataset (hypothetical result with only five samples for demonstration purpose).
Figure 4.
An example of two different clustering results obtained by using different segmentations of the same time-series dataset (hypothetical result with only five samples for demonstration purpose).

Figure 5.
Schematic demonstration for the results of clustering for the pre-COVID-19 dataset.

Figure 6.
Evaluation metrics of K-means clustering for different cluster numbers for the pre-COVID-19 dataset (top left: cohesion versus cluster number; top middle: separation versus cluster number; top right: CH index versus cluster number; lower left: delta inner-cluster distance versus cluster number; lower right: validation rand index versus cluster number).

Figure 7.
Clustering result of the pre-COVID-19 dataset.

Figure 8.
Schematic diagram of the clustering of the COVID-19 dataset by using the pre-COVID-19 cluster labels.
Figure 8.
Schematic diagram of the clustering of the COVID-19 dataset by using the pre-COVID-19 cluster labels.

Figure 9.
Comparison of the clustered pre-COVID-19 dataset and clustered COVID-19 dataset by using the cluster labels of the pre-COVID-19 clustering (selected clusters are shown; the top row is the clustered dataset of the pre-COVID-19 period, and the bottom row is the clustered dataset of the COVID-19 period; the start date of all the subplots is the Chinese New Year of the respective year).

Figure 10.
Boxplot comparison of the cluster mean pairwise distance of cluster 1 between the COVID-19 period and the pre-COVID-19 period (each green or blue boxplot represents the cluster mean pairwise distance for the 21-day period from the indicated week on the x-axis; delta cluster mean pairwise distance is the difference between the cluster mean pairwise distance of the COVID-19 period and the pre-COVID-19 period).

Figure 11.
Boxplot comparison of the cluster mean pairwise distance of cluster 5 between the COVID-19 period and the pre-COVID-19 period (each green or blue boxplot represents the cluster mean pairwise distance for the 21-day period from the indicated week on the x-axis; delta cluster mean pairwise distance is the difference between the cluster mean pairwise distance of the COVID-19 period and the pre-COVID-19 period).

Figure 12.
Boxplot comparison of the cluster mean pairwise distance of cluster 6 between the COVID-19 period and the pre-COVID-19 period (each green or blue boxplot represents the cluster mean pairwise distance for the 21-day period from the indicated week on the x-axis; delta cluster mean pairwise distance is the difference between the cluster mean pairwise distance of the COVID-19 period and the pre-COVID-19 period).

Figure 13.
Clustering result for the dataset of the COVID-19 period.

Figure 14.
Comparison of the cluster centers between the COVID-19 clustering results and pre-COVID-19 clustering results.
Figure 14.
Comparison of the cluster centers between the COVID-19 clustering results and pre-COVID-19 clustering results.

Figure 15.
Dynamic time warping (DTW) comparison between the cluster centers of the COVID-19 clustering and pre-COVID-19 clustering (moving average filtering with the filtering window length 7 is applied to the cluster centers).
Figure 15.
Dynamic time warping (DTW) comparison between the cluster centers of the COVID-19 clustering and pre-COVID-19 clustering (moving average filtering with the filtering window length 7 is applied to the cluster centers).


Table 1.
Basic information of the electricity consumption data used in this study.
| Item | Information |
|---|---|
| Data type | Total high-voltage electric energy consumption |
| Record level | Administrative region (district) |
| Number of administrative regions | 87 |
| Record length | 1 January 2019 to 31 December 2020 |
| Record time resolution | Daily |
Publisher’s Note: MDPI stays neutral with regard to jurisdictional claims in published maps and institutional affiliations. |
© 2021 by the authors. Licensee MDPI, Basel, Switzerland. This article is an open access article distributed under the terms and conditions of the Creative Commons Attribution (CC BY) license (https://creativecommons.org/licenses/by/4.0/).
Share and Cite
MDPI and ACS Style
Zhang, Z.; Cheshmehzangi, A.; Ardakani, S.P. A Data-Driven Clustering Analysis for the Impact of COVID-19 on the Electricity Consumption Pattern of Zhejiang Province, China. Energies 2021, 14, 8187. https://doi.org/10.3390/en14238187
AMA Style
Zhang Z, Cheshmehzangi A, Ardakani SP. A Data-Driven Clustering Analysis for the Impact of COVID-19 on the Electricity Consumption Pattern of Zhejiang Province, China. Energies. 2021; 14(23):8187. https://doi.org/10.3390/en14238187
Chicago/Turabian StyleZhang, Zhiang, Ali Cheshmehzangi, and Saeid Pourroostaei Ardakani. 2021. "A Data-Driven Clustering Analysis for the Impact of COVID-19 on the Electricity Consumption Pattern of Zhejiang Province, China" Energies 14, no. 23: 8187. https://doi.org/10.3390/en14238187
Note that from the first issue of 2016, this journal uses article numbers instead of page numbers. See further details here.