
COVID-19 Detection from Radiographs: Is Deep Learning Able to Handle the Crisis?
by
 , , , , and
Muhammad Saqib
1,† ,
,
Abbas Anwar
2,†,
Saeed Anwar
3,*,
Lars Petersson
4,
Nabin Sharma
5 and
and
Michael Blumenstein
5 1
Data61 Commonwealth Scientific Industrial Research Organization (CSIRO), Marsfield, NSW 2122, Australia
2
Department of Computer Systems Engineering, University of Engineering and Technology (UET), Peshawar 25120, Pakistan
3
College of Engineering and Computer Science, Australian National University (ANU), Canberra, ACT 2219, Australia
4
Data61 Commonwealth Scientific Industrial Research Organization (CSIRO), Black Mountain, ACT 2601, Australia
5
Faculty of Engineering and Information Technology, University of Technology Sydney (UTS), Ultimo, NSW 2007, Australia
*
Author to whom correspondence should be addressed.
†
These authors contributed equally to this work.
Signals 2022, 3(2), 296-312; https://doi.org/10.3390/signals3020019
Submission received: 11 April 2022
/
Revised: 29 April 2022
/
Accepted: 5 May 2022
/
Published: 11 May 2022
(This article belongs to the Special Issue The 2022 7th International Conference on Intelligent Information Processing)
Abstract
:Deep learning in the last decade has been very successful in computer vision and machine learning applications. Deep learning networks provide state-of-the-art performance in almost all of the applications where they have been employed. In this review, we aim to summarize the essential deep learning techniques and then apply them to COVID-19, a highly contagious viral infection that wreaks havoc on everyone’s lives in various ways. According to the World Health Organization and scientists, more testing potentially helps contain the virus’s spread. The use of chest radiographs is one of the early screening tests for determining disease, as the infection affects the lungs severely. To detect the COVID-19 infection, this experimental survey investigates and automates the process of testing by employing state-of-the-art deep learning classifiers. Moreover, the viruses are of many types, such as influenza, hepatitis, and COVID. Here, our focus is on COVID-19. Therefore, we employ binary classification, where one class is COVID-19 while the other viral infection types are treated as non-COVID-19 in the radiographs. The classification task is challenging due to the limited number of scans available for COVID-19 and the minute variations in the viral infections. We aim to employ current state-of-the-art CNN architectures, compare their results, and determine whether deep learning algorithms can handle the crisis appropriately and accurately. We train and evaluate 34 models. We also provide the limitations and future direction.
1. Introduction
In recent years, the most talked about topics are coronavirus (in the medical community) and deep learning (in the computer vision and machine learning community). The novel Coronavirus (also known as SARS-CoV-2), belonging to the Corona family and abbreviated as COVID-19, is a virus known to cause lung infections. The virus is highly contagious, as evidenced by the exponential growth of positive cases worldwide in a short period with limited testing. The infection causes severe damage to the lungs, causing pneumonia with accompanying symptoms of a sore throat, dry coughing, sneezing, and high temperature. Moreover, some patients do not show signs, so acting as a carrier is a worrying concern for health organizations. The World Health Organization (WHO) recommended conducting more tests for screening out COVID-19 patients to contain the virus’s spread. This testing would help in identifying and isolating potential COVID-19 patients from patients of other kinds of infections.
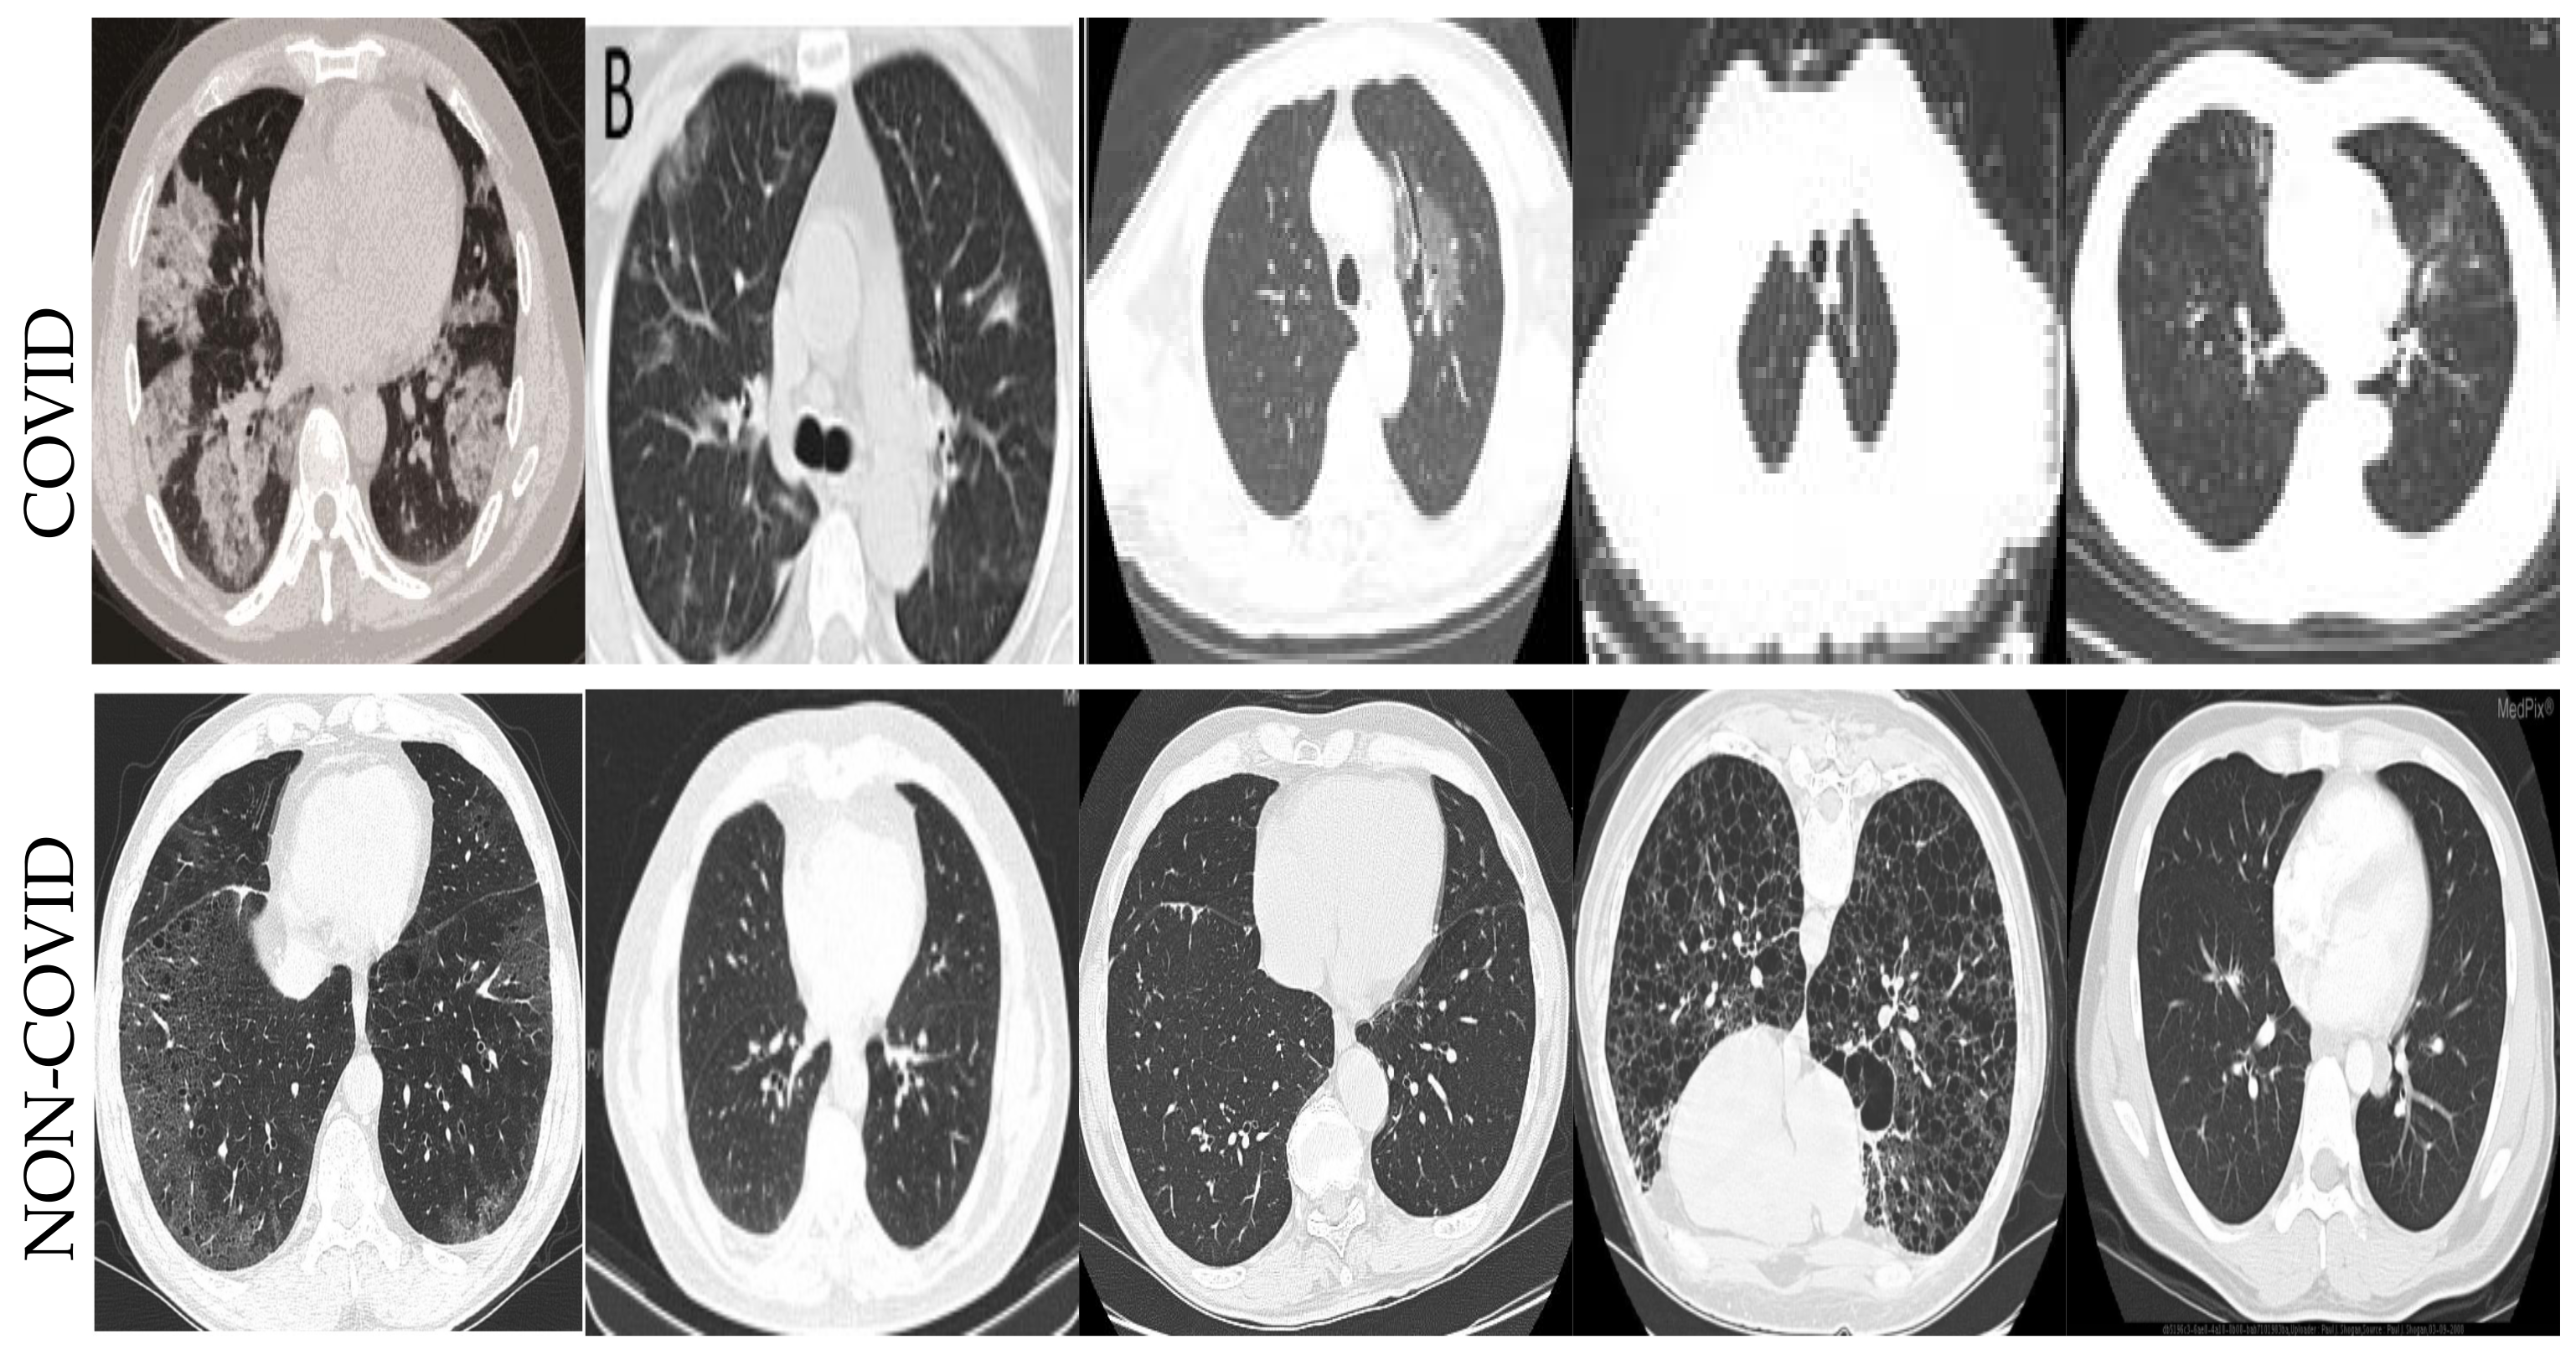
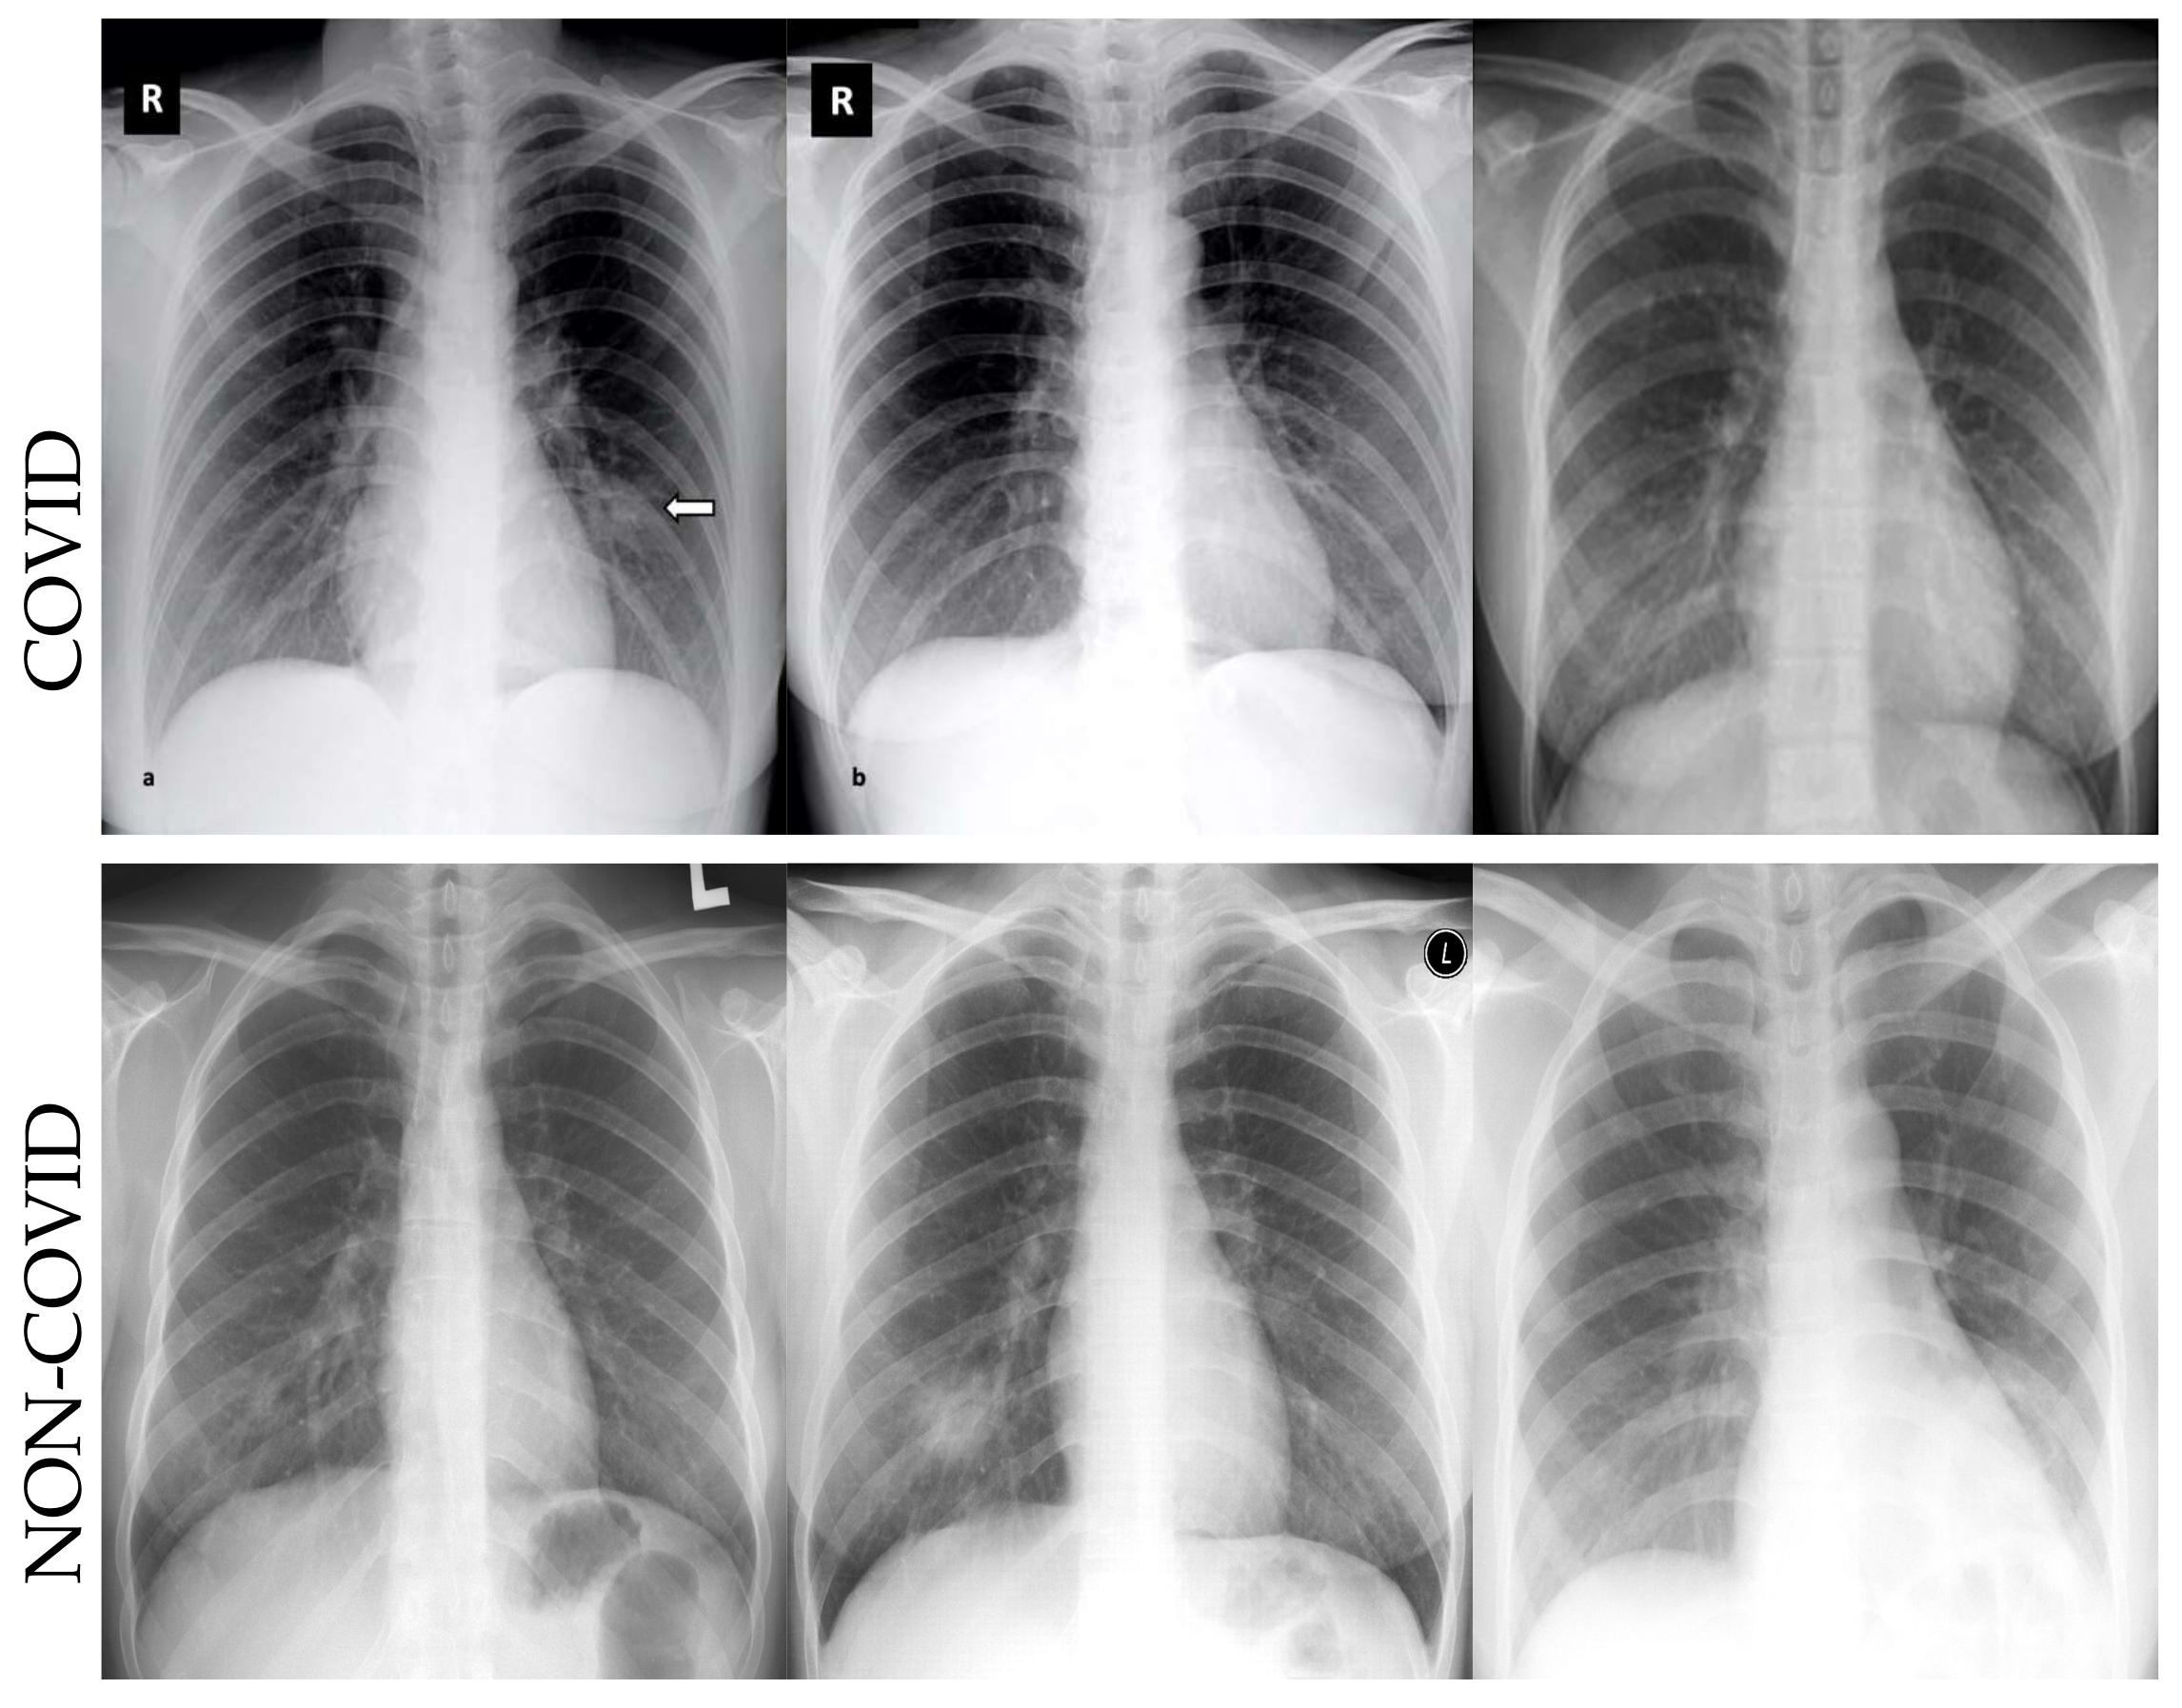
Generally, X-ray imaging is used for the majority of chest infections, such as pneumonia, bronchitis, and bronchiolitis. Although the use of X-rays is considered non-specific in radiological findings, it will help in further management of a disease. Reverse Transcription Polymerase Chain Reaction (RT-PCR) kits are utilized primarily to test COVD-19 patients. The test kits are expensive and also limited in supply. Moreover, the turnaround time for the test is, on average, 24 h, which considerably slows the testing process. Since the test kits are limited in supply, the use of X-rays can be a viable option, especially in far-flung and rural areas. This pandemic is causing health systems to be overwhelmed with many patients. Chest X-rays could be used in conjunction with related tests to quickly rule out non-COVID patients, ultimately easing the burden on health systems. Like any other pneumonia infection, COVID-19 has shown distinct markers on chest X-rays. Sample images for CT scans from the COVIDCT dataset [1] for both COVID and non-COVID cases are illustrated in Figure 1. Representative images for X-rays from the COVIDx dataset [2] for both COVID and non-COVID cases are shown in Figure 2.
We aim to summarize the most important deep learning networks and then train them on different COVID datasets to predict whether the current classifiers can handle an infection and diagnose it accurately. To this end, we present an experimental survey that reviews and investigates how state-of-the-art deep learning networks can capture fine-grained details from the images and classify them.
Our Contributions: We claim the following contributions in this article:
- We present a review of the deep learning networks and summarize the most prominent components of each with focused block diagrams;
- We employ the deep learning algorithms for COVID-19 datasets to detect infection in the CT and X-ray images;
- Finally, we provide limitations, challenges, and future directions for the research community.
2. Related Work
This section of the article presents the information about the datasets and the methods developed to deal with COVID. However, it should be noted that we are not interested in listing the networks that are specifically designed to detect, localize, or classify COVID cases or produce comparisons between them. Instead, we aim to review and employ traditional deep learning networks to observe their capability in handling the disease. Moreover, we provide these specifically designed methods as a literature review for our proposed algorithm and a starting point for future research. A considerable amount of research has been published on COVID-19 detection [3,4,5,6], but none covered comprehensively applying different deep learning architectures.
Chen et al. [7] retrospectively collected 46,096 high-quality CT images from 106 admitted patients anonymously. There were 51 laboratory-confirmed COVID-19 patients, while the remaining 55 were patients of different diseases. Three expert radiologists with over 5 years of experience annotated the COVID-19 dataset with combined consensus. The problem was framed as a segmentation task, and UNet++ [8] was trained to segment the valid areas in the CT images. The trained model was deployed at the Renmin Hospital of Wuhan University and as a web API to assist in the diagnosis of COVID-19 cases worldwide.
COVNet [9] uses a 3D deep learning framework to extract 2D local and 3D features for the detection of COVID-19. ResNet [10] is employed as the backbone to extract features from the input CT slices. The extracted features are passed through the max-pooling operation. The final feature map is fed through the fully connected layer and eventually through the softmax function to find the probabilities for each class. Previous studies have shown the successful application of deep learning methodologies to chest X-rays to diagnose bacterial and viral infections [11,12].
A deep learning-based CT diagnosis system, termed DeepPneumonia, was proposed to detect and localize the lesions causing COVID-19 [13]. First, the lung region is extracted in each CT image and then fed to the Details Relation Extraction Neural Network (DRE-Net) to produce the top K details in a CT scan using pre-trained ResNet with a Feature Pyramid Network (FPN) and attention module. The attention module is used to learn the importance of each detail. The aggregation module aggregates the predictions to predict the patient-level diagnosis.
Deep learning requires a significant amount of annotated data for training the model. As the radiologists are busy dealing with the pandemic, the annotation task is difficult and costly. Therefore, a weakly supervised technique by Zheng et al. [14] utilizes weak patient-level labels for the rapid diagnosis of COVID-19 subjects. A 3D deep convolutional neural network called DeCoVNet [14] is used to take the input of the CT volumes and 3D lung masks to output the probabilities of COVID-19 or no COVID-19. A pre-trained model is used to generate a 3D lung mask. The first stage of the architecture consists of a vanilla 3D convolutional base, followed by batch normalization and max-pooling to create a 3D feature map. In the second stage, a 3D feature map is passed through two 3D residual blocks with the batch norm. In the last step, a Progressive Classifier (ProClf) progressively abstracts the information in 3D volumes and classifies it using the softmax function to output the probability of being COVID-19 or non-COVID-19.
Chest X-ray radiography (CXR) is widely used to diagnose infections due to its lower cost and broader availability. COVID-19 patients show lung consolidation over the period and therefore could be used as a diagnostic tool in conjunction with a CT scan for better radiological analysis [15]. A two-step human–machine collaborative strategy was proposed to design a network architecture for the detection of COVID-19 cases from CXR images [2]. In the first step, the initial network design prototype is constructed using human-driven principles. In the second step, the initial prototype and human-specific designs are used in machine-driven exploration to find the optimal macroarchitecture and microarchitecture for the final deep neural network architecture. The final architecture of COVID-Net is applied for three-class classification into (1) no infection, (2) non-COVID-19, and (3) having COVID-19. The experimentation is carried out on a COVIDx dataset, curated from five multiple sources. The authors of [16] proposed a three-stage ResNet architecture to classify the classes from the COVIDx dataset.
It is essential to estimate uncertainty in deep learning models and avoid COVID-19 misdiagnoses. A dropweights-based Bayesian Convolutional Neural Network (BCNN) [17] was proposed to deal with the uncertainty in deep learning. The experiments were carried out on the COVID-19 CXR dataset. The author found a strong relationship between uncertainty and accuracy, which helped identify false positives and unknown cases.
We aim to employ the available deep learning state-of-the-art algorithms to identify the COVID-19 and non-COVID-19 features. The purpose for this is twofold: (1) this research will provide baselines, and (2) it will also establish the performance of current state-of-the-art deep learning algorithms.
3. Deep Learning Networks Review
For the sake of completeness, we will discuss the basic building blocks of the current state-of-the-art deep learning architectures for image classification tasks. Convolutional Neural Networks (CNNs) are commonly used for image classification and can extract powerful, generic features from the image by applying convolution filters. In CNNs, the filter parameters are learned using backpropagation, where low-level features such as edges are determined in the lower layers of the architecture, and high-level features such as shapes are discovered in the deeper layers of the network. The ImageNet Large-Scale Visual Recognition Challenge (ILSVRC) [18] played a considerable role in the modern CNN architectures’ design choices. The novel architectures should be end-to-end trainable and learn multiscale features with fewer parameters and smaller model sizes. The other design choices include dropouts, batch normalizations, optimizations, and loss functions. Modern CNN architectures can be broadly grouped into the following categories.
3.1. Plain Networks
AlexNet [19] is the first architecture that sparked the research interest in deep learning when it won the ImageNet challenge by a substantial margin. The architecture consists of eight layers, including five convolutional layers, an activation function, and three fully connected layers. AlexNet, for the first time, used multi-GPUs to train bigger models and reduce the training time. The sample architecture for plain networks is shown in Figure 3.
Subsequently, Simonyan and Zisserman [20] proposed the Visual Geometry Group (VGG) in different variations such as VGG16 and VGG19, which are the most common architectures with 16 and 19 layers, respectively. The typical pattern among these architectures uses only 3 × 3 filters. The initial layers utilize a few filters but increase their number as the depth of the network increases, which is the kind of pattern that can also be seen in other architectures. In earlier layers of the VGG or other plain architectures, they learn more spatial information for filters, while the later layers use more filters to balance out the availability of less spatial information. Initially, the VGG architecture was difficult to train from the random initialization of weights. However, the training became more accessible with the introduction of intelligent initialization techniques such as Xavier [21,22]. VGG19, the highly accurate model, has a size of 574 MB.
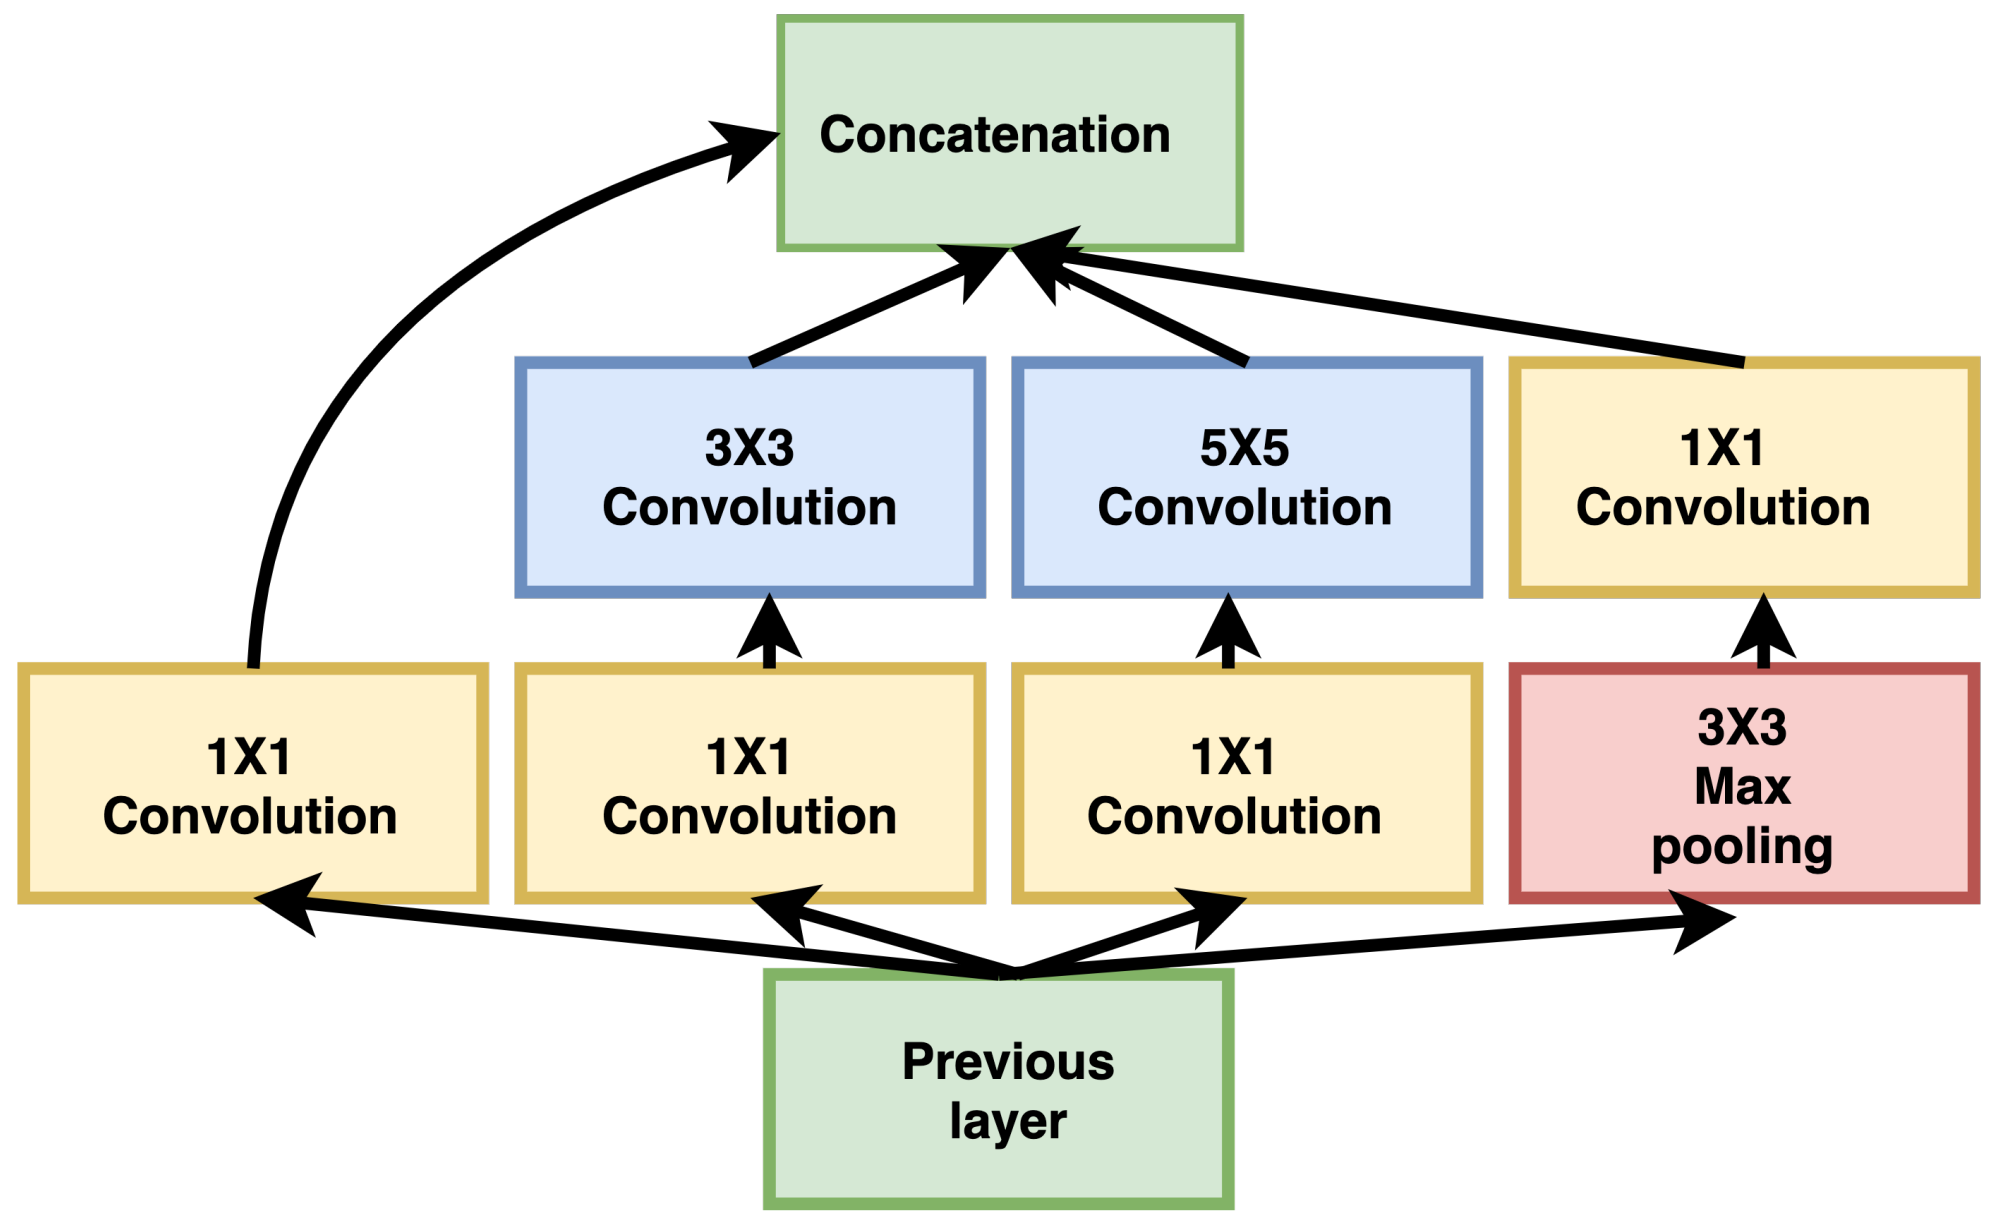
3.2. GoogleNet Inception Networks
Contrary to the plain networks, the succeeding architectures share a common property (i.e., using shortcut paths from the earlier layers to the last layers) which addresses the vanishing gradient problem [23] in training deep neural networks.
GoogleNet, introduced by Szegedy et al. [24], was the winning architecture in the ImageNet challenge. The performance of GoogleNet was slightly better than the VGG. However, the GoogleNet model was considerably smaller in size, being only 28.12 MB compared with 574 MB for the VGG model. The basic building block of the GoogleNet is termed “the Inception module”, which comes in different variations, making it more accurate than the original implementation of GoogleNet Inception. The idea of Inception is to use filters of varying dimensions simultaneously, and then it is left to the network to decide during optimization which weights are essential. In this way, the network learns multiscale features efficiently. The 1 × 1 convolution was used to reduce the dimension of the feature map volume-wise before applying any other filter, thus decreasing the model size significantly. The Inception module, as shown in Figure 4, uses 1 × 1 convolution in the first layer and max-pooling followed by any other filter. The output of all the filters is concatenated volume-wise before passing into the next layer of the network.
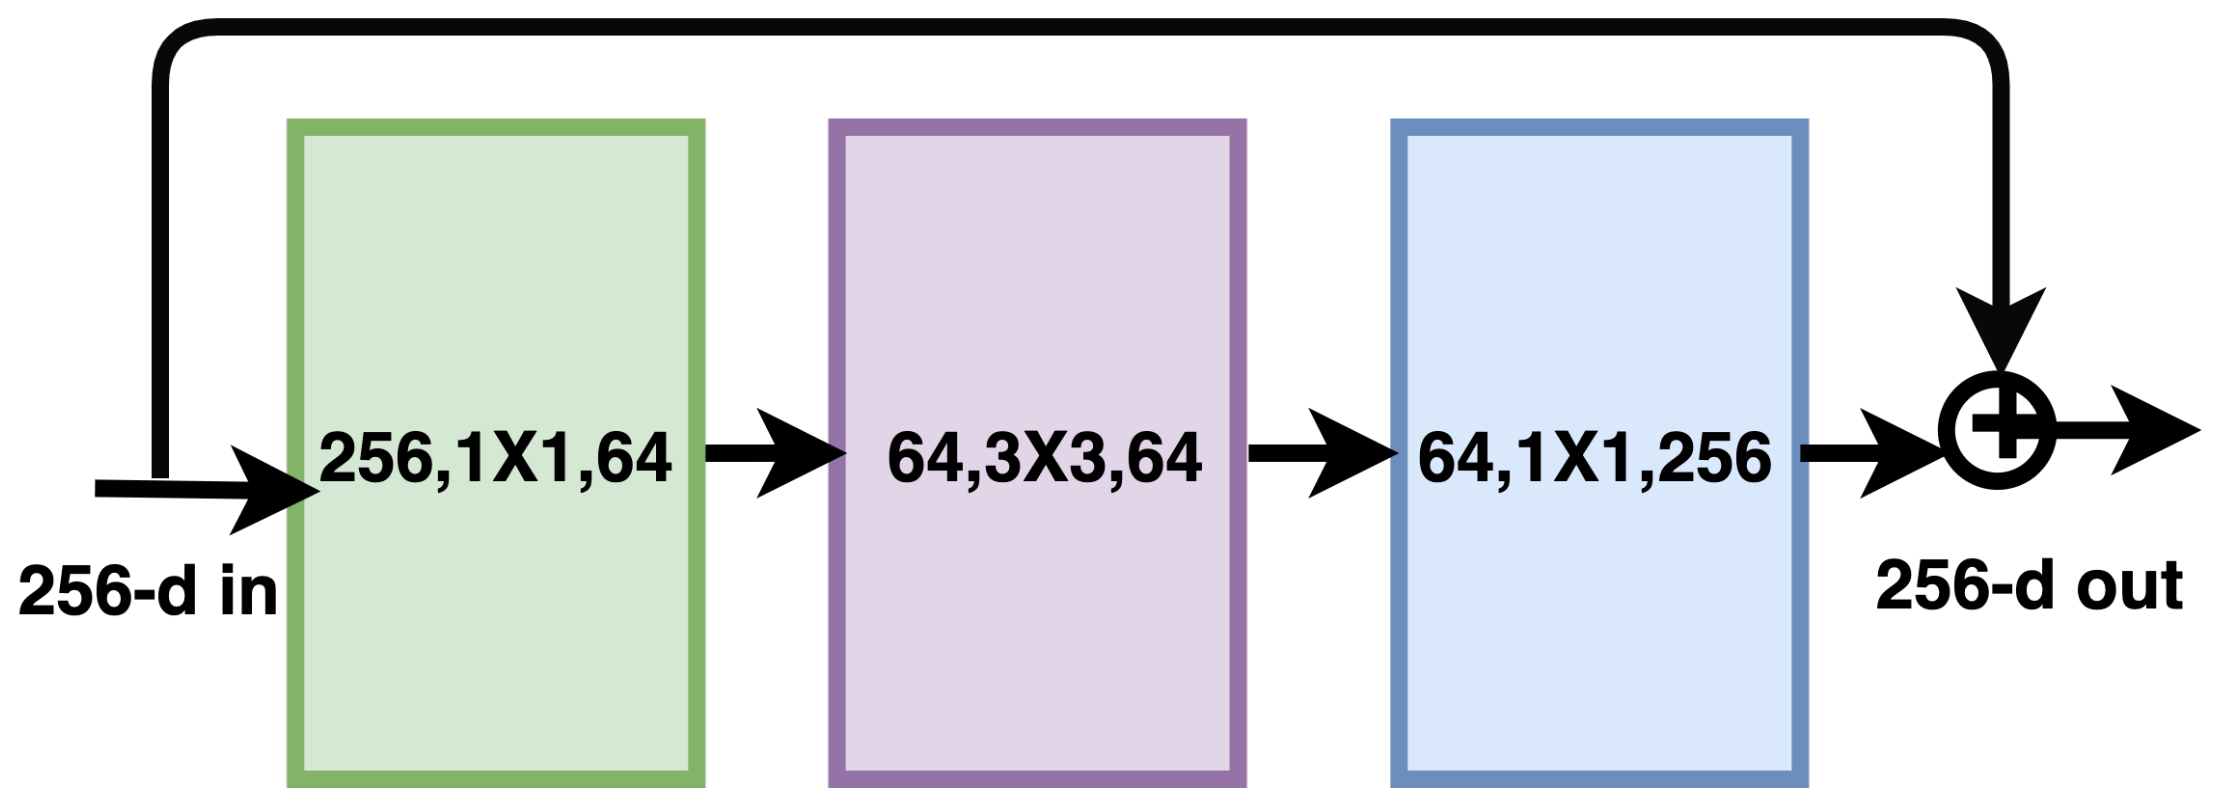
3.3. Residual Networks
The traditional network suffers from a vanishing gradient problem [23] during backpropagation. The gradient becomes significantly smaller and cannot update the initial layers’ parameters, causing the network learning to be prolonged. The Residual Network (ResNet) made it possible to train deeper networks [10]. The basic module of ResNet is called a residual block, as shown in the Figure 5, which starts at the input of the module with two branches. One of the branches takes the input through a series of convolutions, activations, and batch normalization, while the other branch is a shortcut that skips all the operations and is added to the output of the other branch, known as identity mapping. The residual layer starts learning at the identity function and learns more sophisticated and robust features regarding the architecture’s depth. In the recent version of ResNet, the order of operations in the first branch has been changed from convolution, activation, and batch normalization (Conv-ReLU-BN) to batch normalization, activation, and convolution (BN-ReLU-Conv). This method is called preactivation.
3.4. Dense Networks
In DenseNet [25], each layer concatenates the feature maps from all the previous layers, using the collective knowledge in the current feature map’s computation. The current layer passes on its feature map to all the subsequent layers, ensuring maximum information flow and gradients between the layers of the network. On the contrary, ResNet adds the features from the module input to the output layer. Figure 6 shows the module of DenseNet. A composition layer uses preactivation on all the previous layers before concatenating with the current layer. DenseNet has fewer parameters and can learn more complex features.
3.5. Efficient Networks
Generally, deeper ConvNets tend to obtain a better top 1% accuracy in challenging tasks such as ImageNet detection and classification. However, the trained models are over-parameterized, and challenging to train and deploy on available hardware resources. For example, Gpip [26] requires a considerable number of parameters (i.e., 577M) to train and achieve a top 1% accuracy of 84.3%. There always has been a tradeoff between the accuracy and efficiency of model selection for a specific application. Traditionally, models achieved better accuracy by increasing the depth of the architecture (using more layers), the width of architecture (via more channels), or increasing the resolution of an input image. Tan and Le [27] proposed compound scaling to size up all three critical parameters (width, depth, and input image resolution) to improve a model’s performance. The proposed network is called EfficientNets [27], which is the family of highly scalable and efficient neural network architectures that uses compound scaling to select models such as EfficientNet-B0–B7, keeping in view the resource requirements. The building block of EfficientNet uses mobile inverted bottleneck MBConv [28], as shown in Figure 7, with squeeze-and-excitation optimization [29].
3.6. Squeeze Networks
Most CNN architectures are resource-hungry to achieve good accuracy for a particular dataset. The smaller architectures with equivalent accuracy require less bandwidth, are easily deployable on limited-capacity hardware, and offer benefits in distributed training. The model weights for most of the CNN architectures range from 100 MB (e.g., ResNet) to 553 MB (e.g., VGG). The weights for AlexNet sit in the middle at 249 MB. Recently, in SqueezNet [30], the author proposed an architecture with a comparable accuracy to AlexNet but with fewer parameters and with an incredibly lower weight of 4.9 MB. The weights were further reduced to 0.5 MB by applying compression techniques such as weight pruning and sparsifying the model.
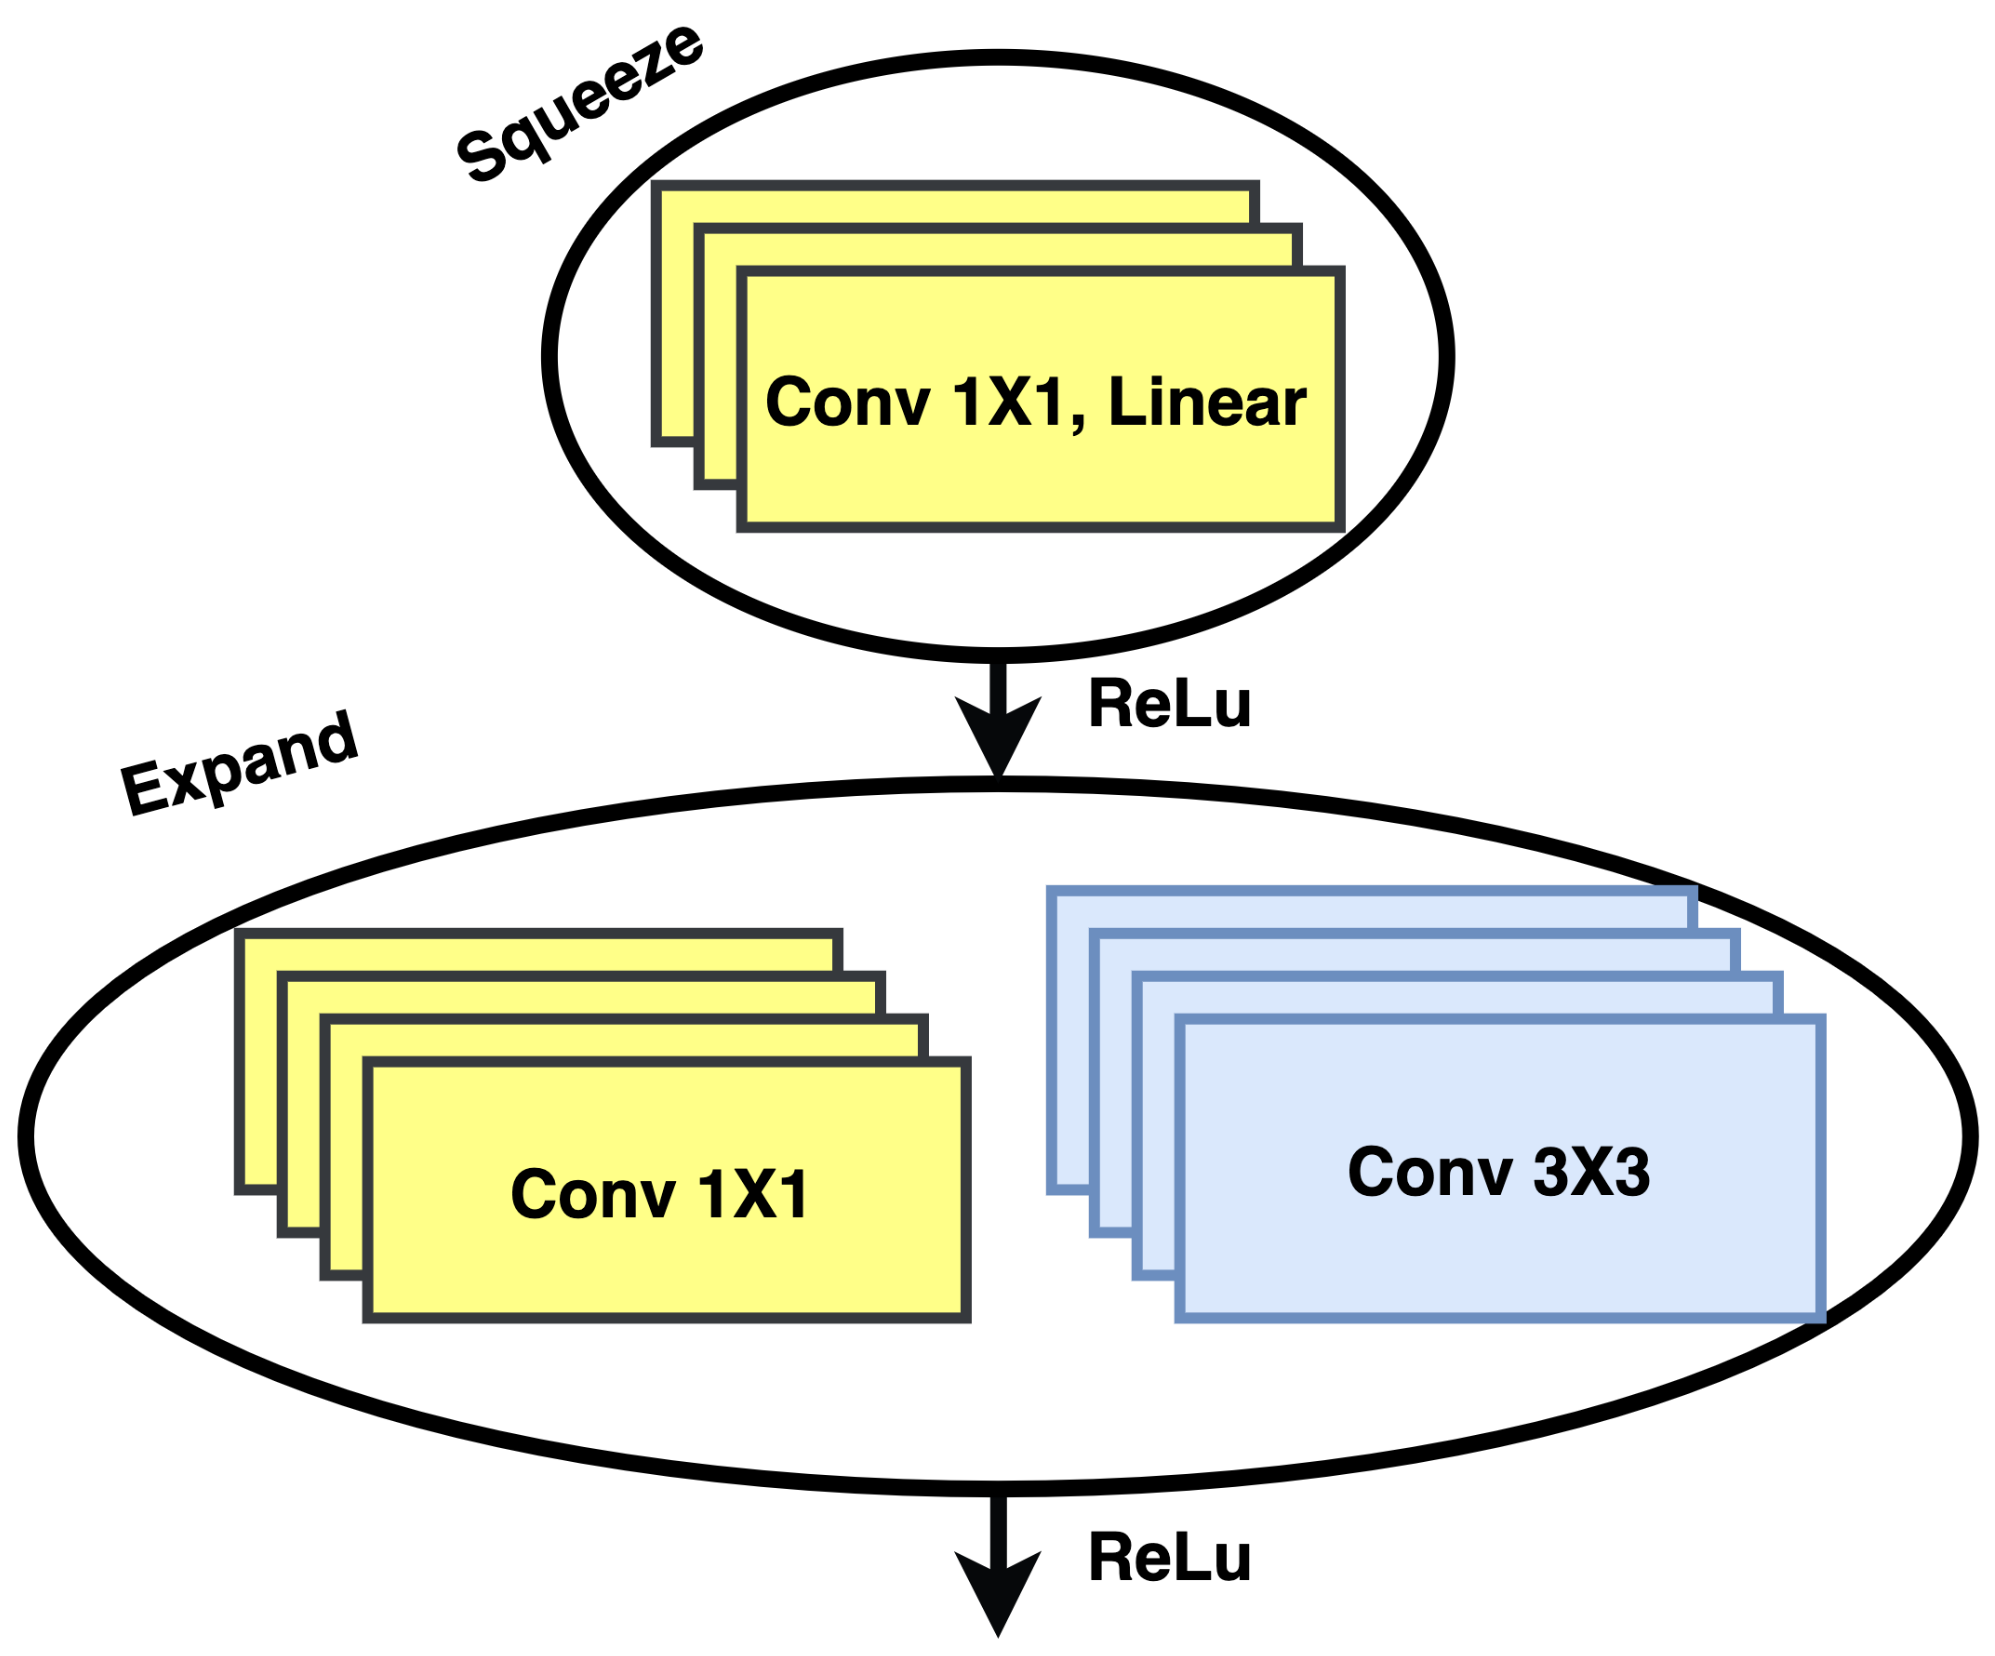
The basic Fire Module is employed in the SqueezNet architecture with a clever combination of 1 × 1 and 3 × 3 filters. The module consists of a two-phase operation of “squeeze” and “expand”. The squeeze phase applies a smaller number of 1 × 1 filters than the input volume, thus reducing the dimensions of the output feature map. Before feeding to the expanding phase, ReLU activation is applied to the output of the squeeze phase. During the expanding phase, a combination of 1 × 1 and 3 × 3 filters is used to capture the spatial relationship and extract more complex features, as shown in Figure 8.
3.7. Shuffle Networks
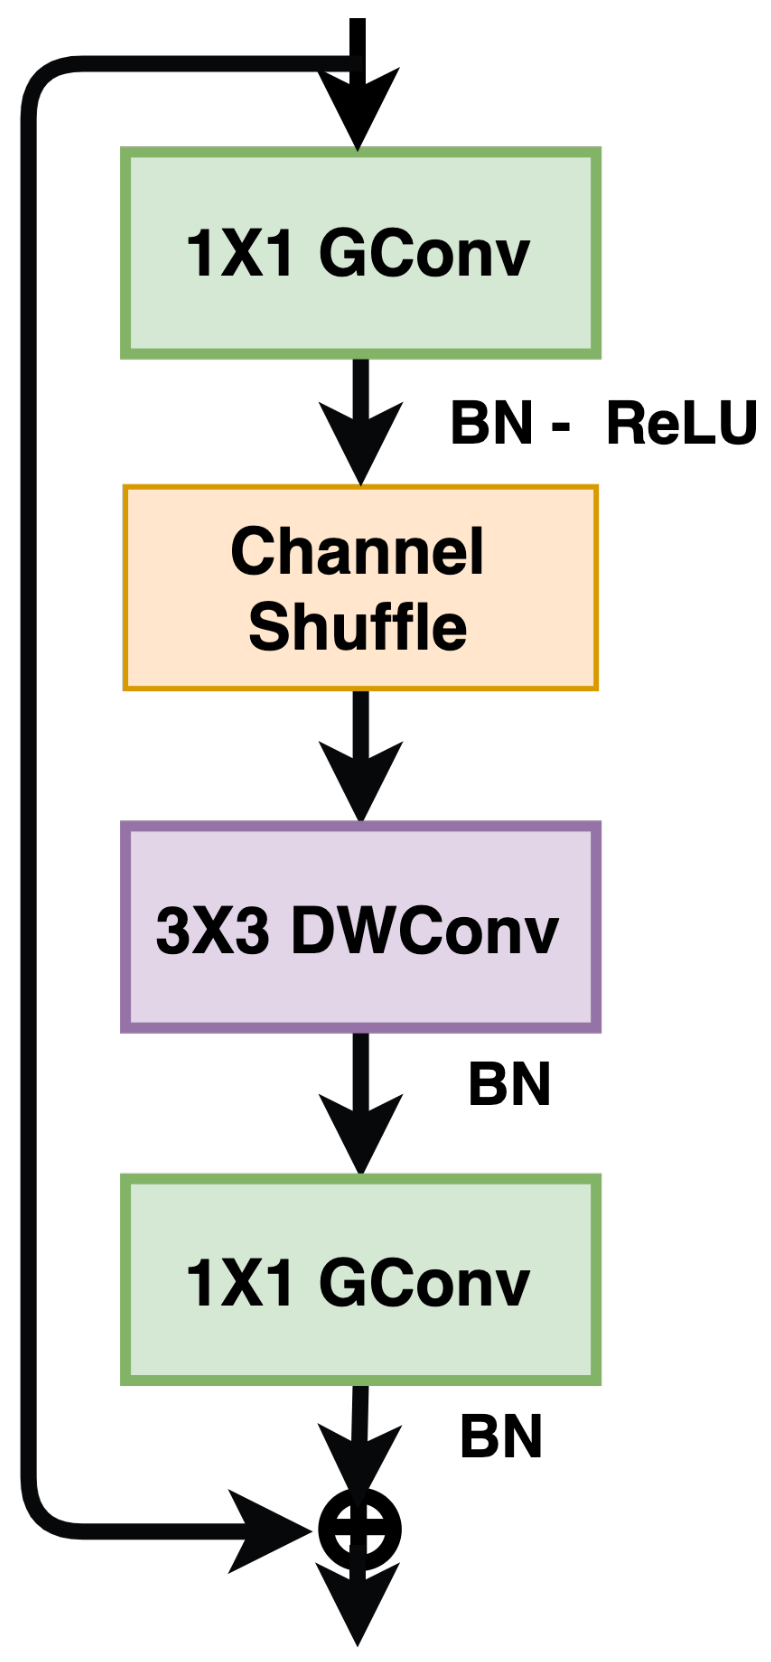
ShuffleNet [31] is another lightweight architecture design belonging to the family of architectures such as MobileNet [32], CondenseNet [33], MobileNetV2 [28], and Xception [34]. These architectures use group- and depth-wise convolution and are suitable for low-end devices. The authors of ShuffleNet proposed guidelines for effective network architecture design. Traditionally a widely accepted indirect metric called FLOPS is used as the only measure of computational complexity (estimation of actual run time). However, a direct metric such as speed or latency is more relevant when considering group- and depth-wise convolutions on low-end devices. These operations’ memory access costs should be regarded in the neural architecture design for low-end devices. The second important factor to consider is the degree of parallelism. For example, under the same FLOPs, a model with a high degree of parallelism could perform better than the low-degree counterpart. The author used these guidelines to design a network called ShuffleNet, as shown in Figure 9.
3.8. Mobile Networks
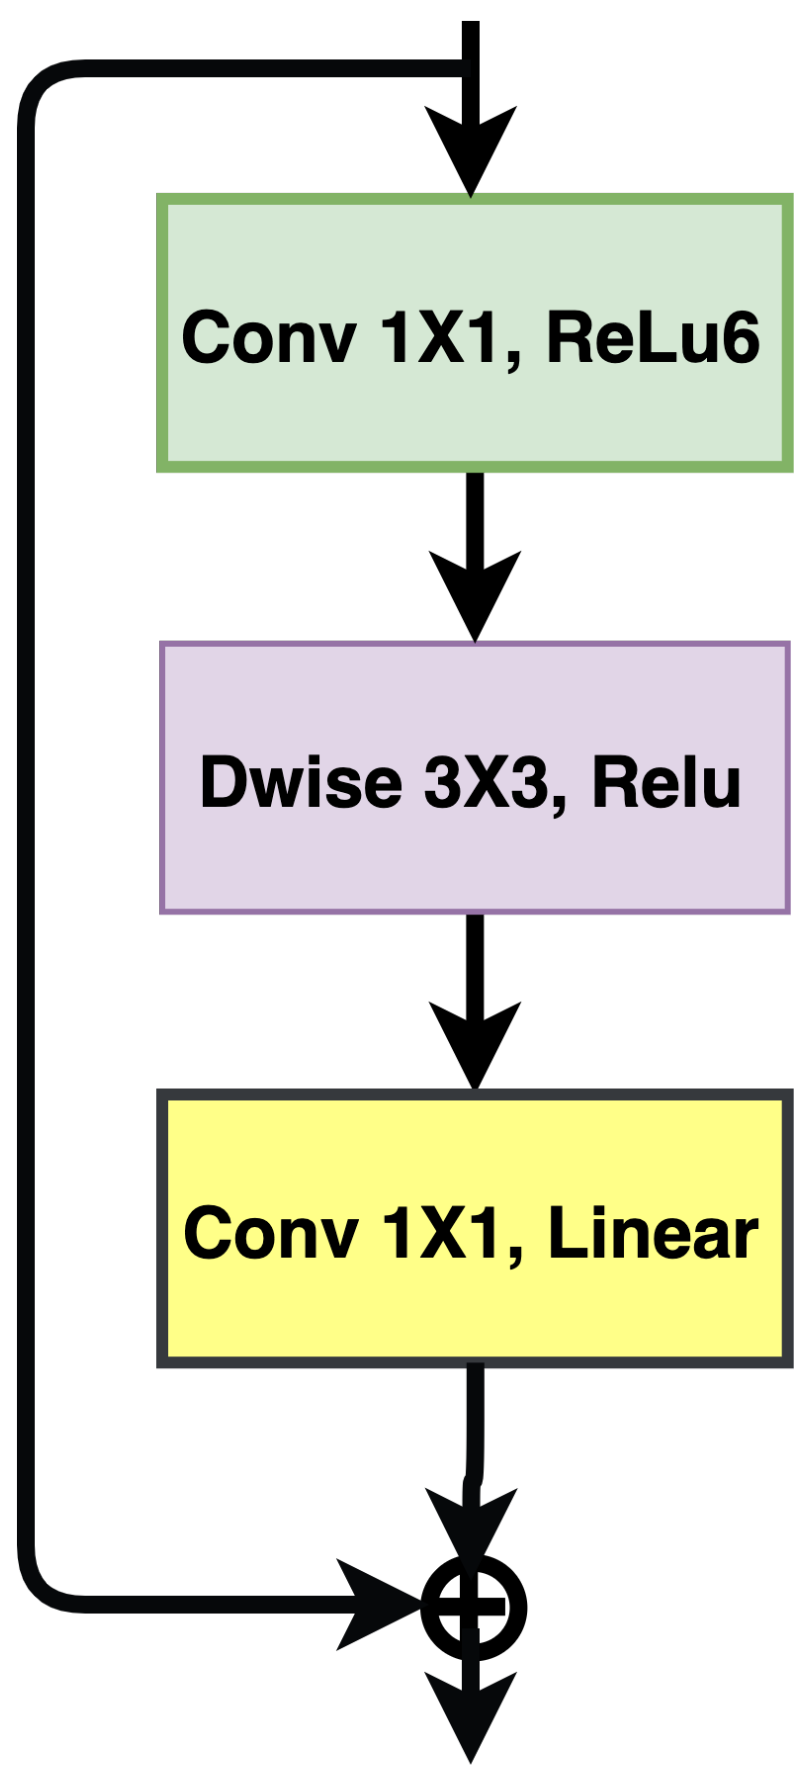
MobileNetV2 [28] is tailored for use in computer vision applications designed for resource-constrained devices. The model uses fewer operations and memory access to give comparable accuracy to AlexNet. Unlike standard convolution, the MobileNetV1 model proposes the use of depth-wise separable convolutions, which means that a depth-wise convolution is followed by 1 × 1 convolution. A single filter is applied per input channel in depth-wise convolution, and pointwise operation is used to combine the depth-wise convolutions’ output. The models are lightweight due to the decreased multiplications that reduce computational complexity. In MobileNetV2, the authors introduced an inverted residual with a linear bottleneck layer. In a residual block with one stride, the first layer adopts 1 × 1 convolution, followed by depthwise convolution in the second layer. The third layer uses a 1 × 1 convolution without an activation function, as shown in Figure 7.
3.9. Neural Architecture Search NASNet
Neural architecture search belongs to the family of deep learning methods called meta-learning. These algorithms use auxiliary search methods such as random, evolutionary, and recurrent neural networks and deep reinforcement learning to design various network architectures’ characteristics. These characteristics include the learning rate, number of filters, and filter maps. In neural architecture search, these characteristics are learned by another neural network for searching in a discrete search space. Neural architecture searches use two kinds of convolutional layers called the normal cell and the reduction cell. The typical cell returns the feature map of the same dimensions as those of the input, while the reduction cell reduces the dimension by two.
The fundamental idea is to design a single cell instead of a whole network. The search algorithm will search for the optimal parameters from a set of parameters and then create a complete architecture by stacking normal and reduction cells. Typically, exploring architecture is carried out on smaller datasets, and the learned layers are transferred to the search architecture for large datasets. However, these approaches do not permit the layer diversity required for high accuracy and lower latency in mobile applications. In MNASNets [35], a multi-objective search using deep reinforcement is proposed to find CNN models with increased accuracy and low inference latency that are suitable for mobile devices.
3.10. Wide ResNets
When ResNet is scaled up to a thousand layers, a fractional improvement in accuracy requires doubling the layers and exponentially increasing the training time. In Wide-ResNet [36], the authors suggested an architecture with decreased depth and increased width compared with the ResNets to obtain good accuracy over its thin and deep counterpart.
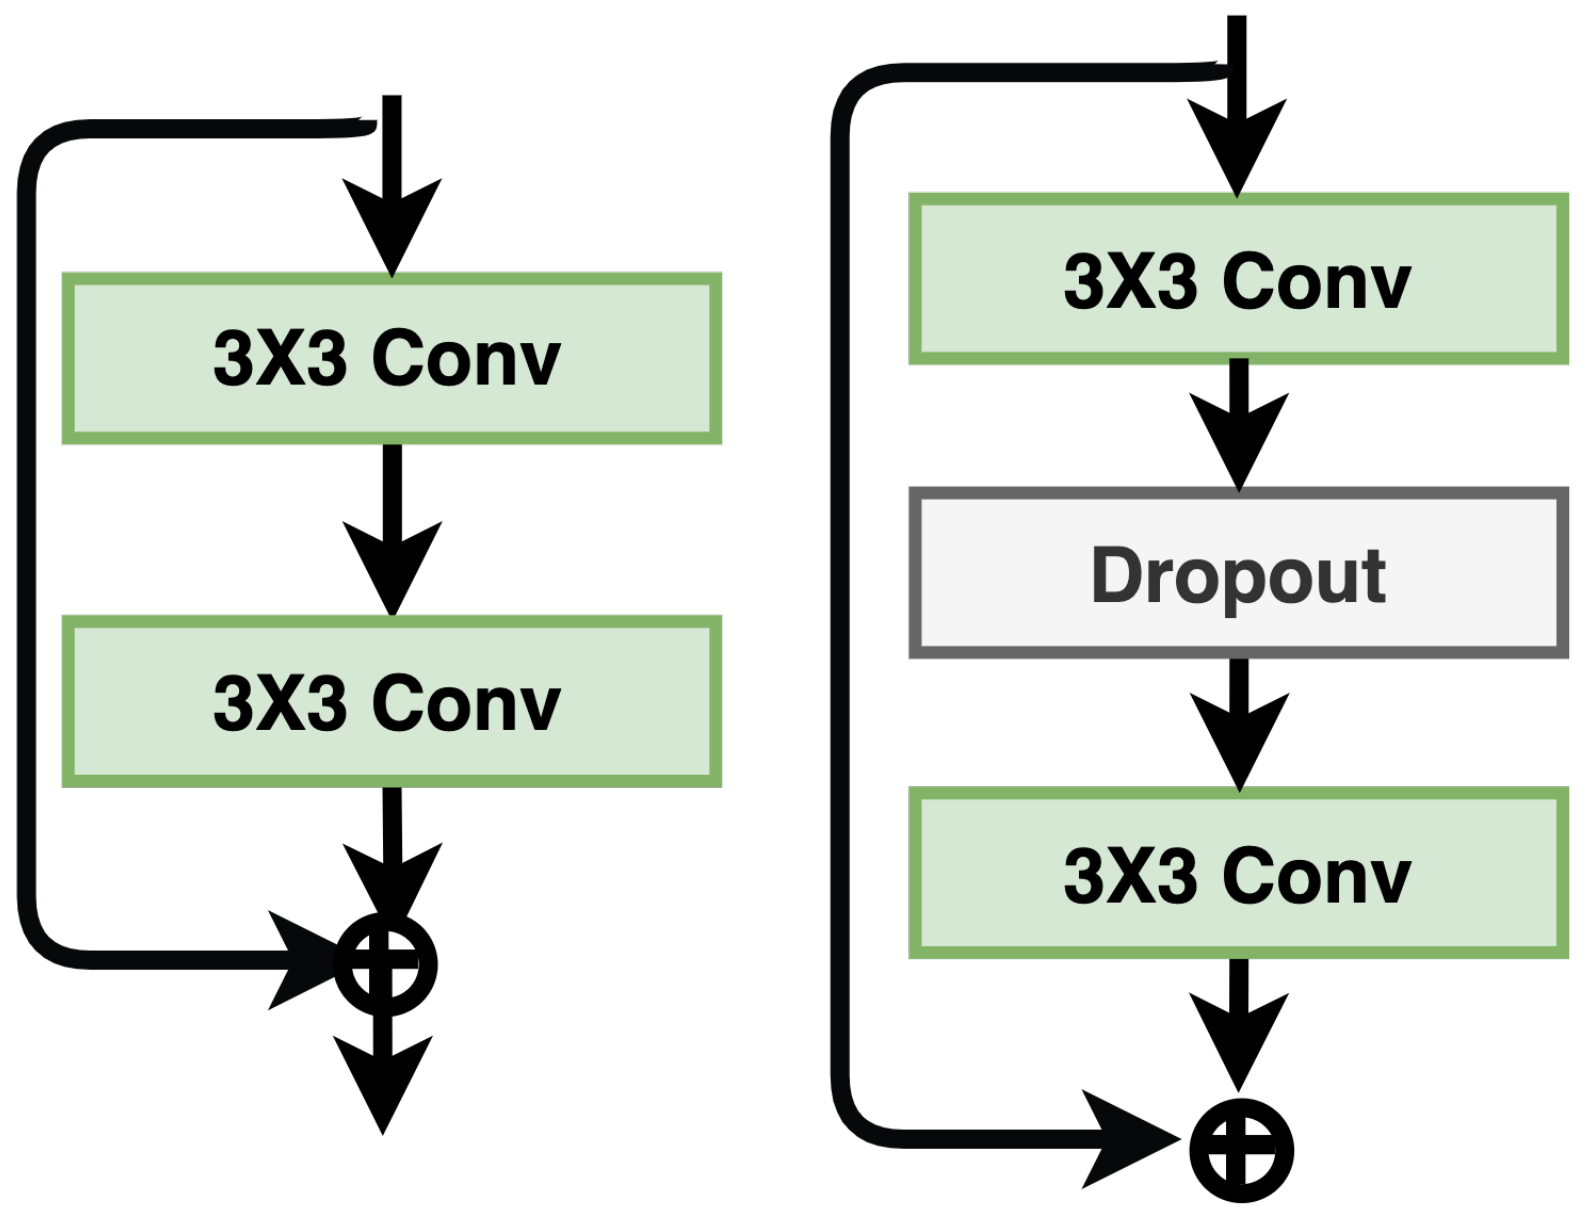
In a typical ResNet architecture, there are two blocks: basic (residual) and bottleneck. The bottleneck block was used to make the network thinner, computationally less expensive, and suitable for the design of deeper networks. Nevertheless, the authors used only the residual block with increasing convolutional layers, feature maps, and filter sizes for better performance. The authors considered two factors: (i) deepening fact l and (ii) widening factor k, where l represents the number of the convolutions in a block, and k is the number of feature maps in convolutional layers. The number of parameters increases linearly with l and quadratically with k. Keeping in mind that GPUs are more efficient in parallel computations, and consequently, widening the architecture is more effective. The performance can be further improved if dropout is used in the residual block. In Figure 10, the building block of Wide-ResNet [36] with and without the dropout is shown.
3.11. ResNeXt
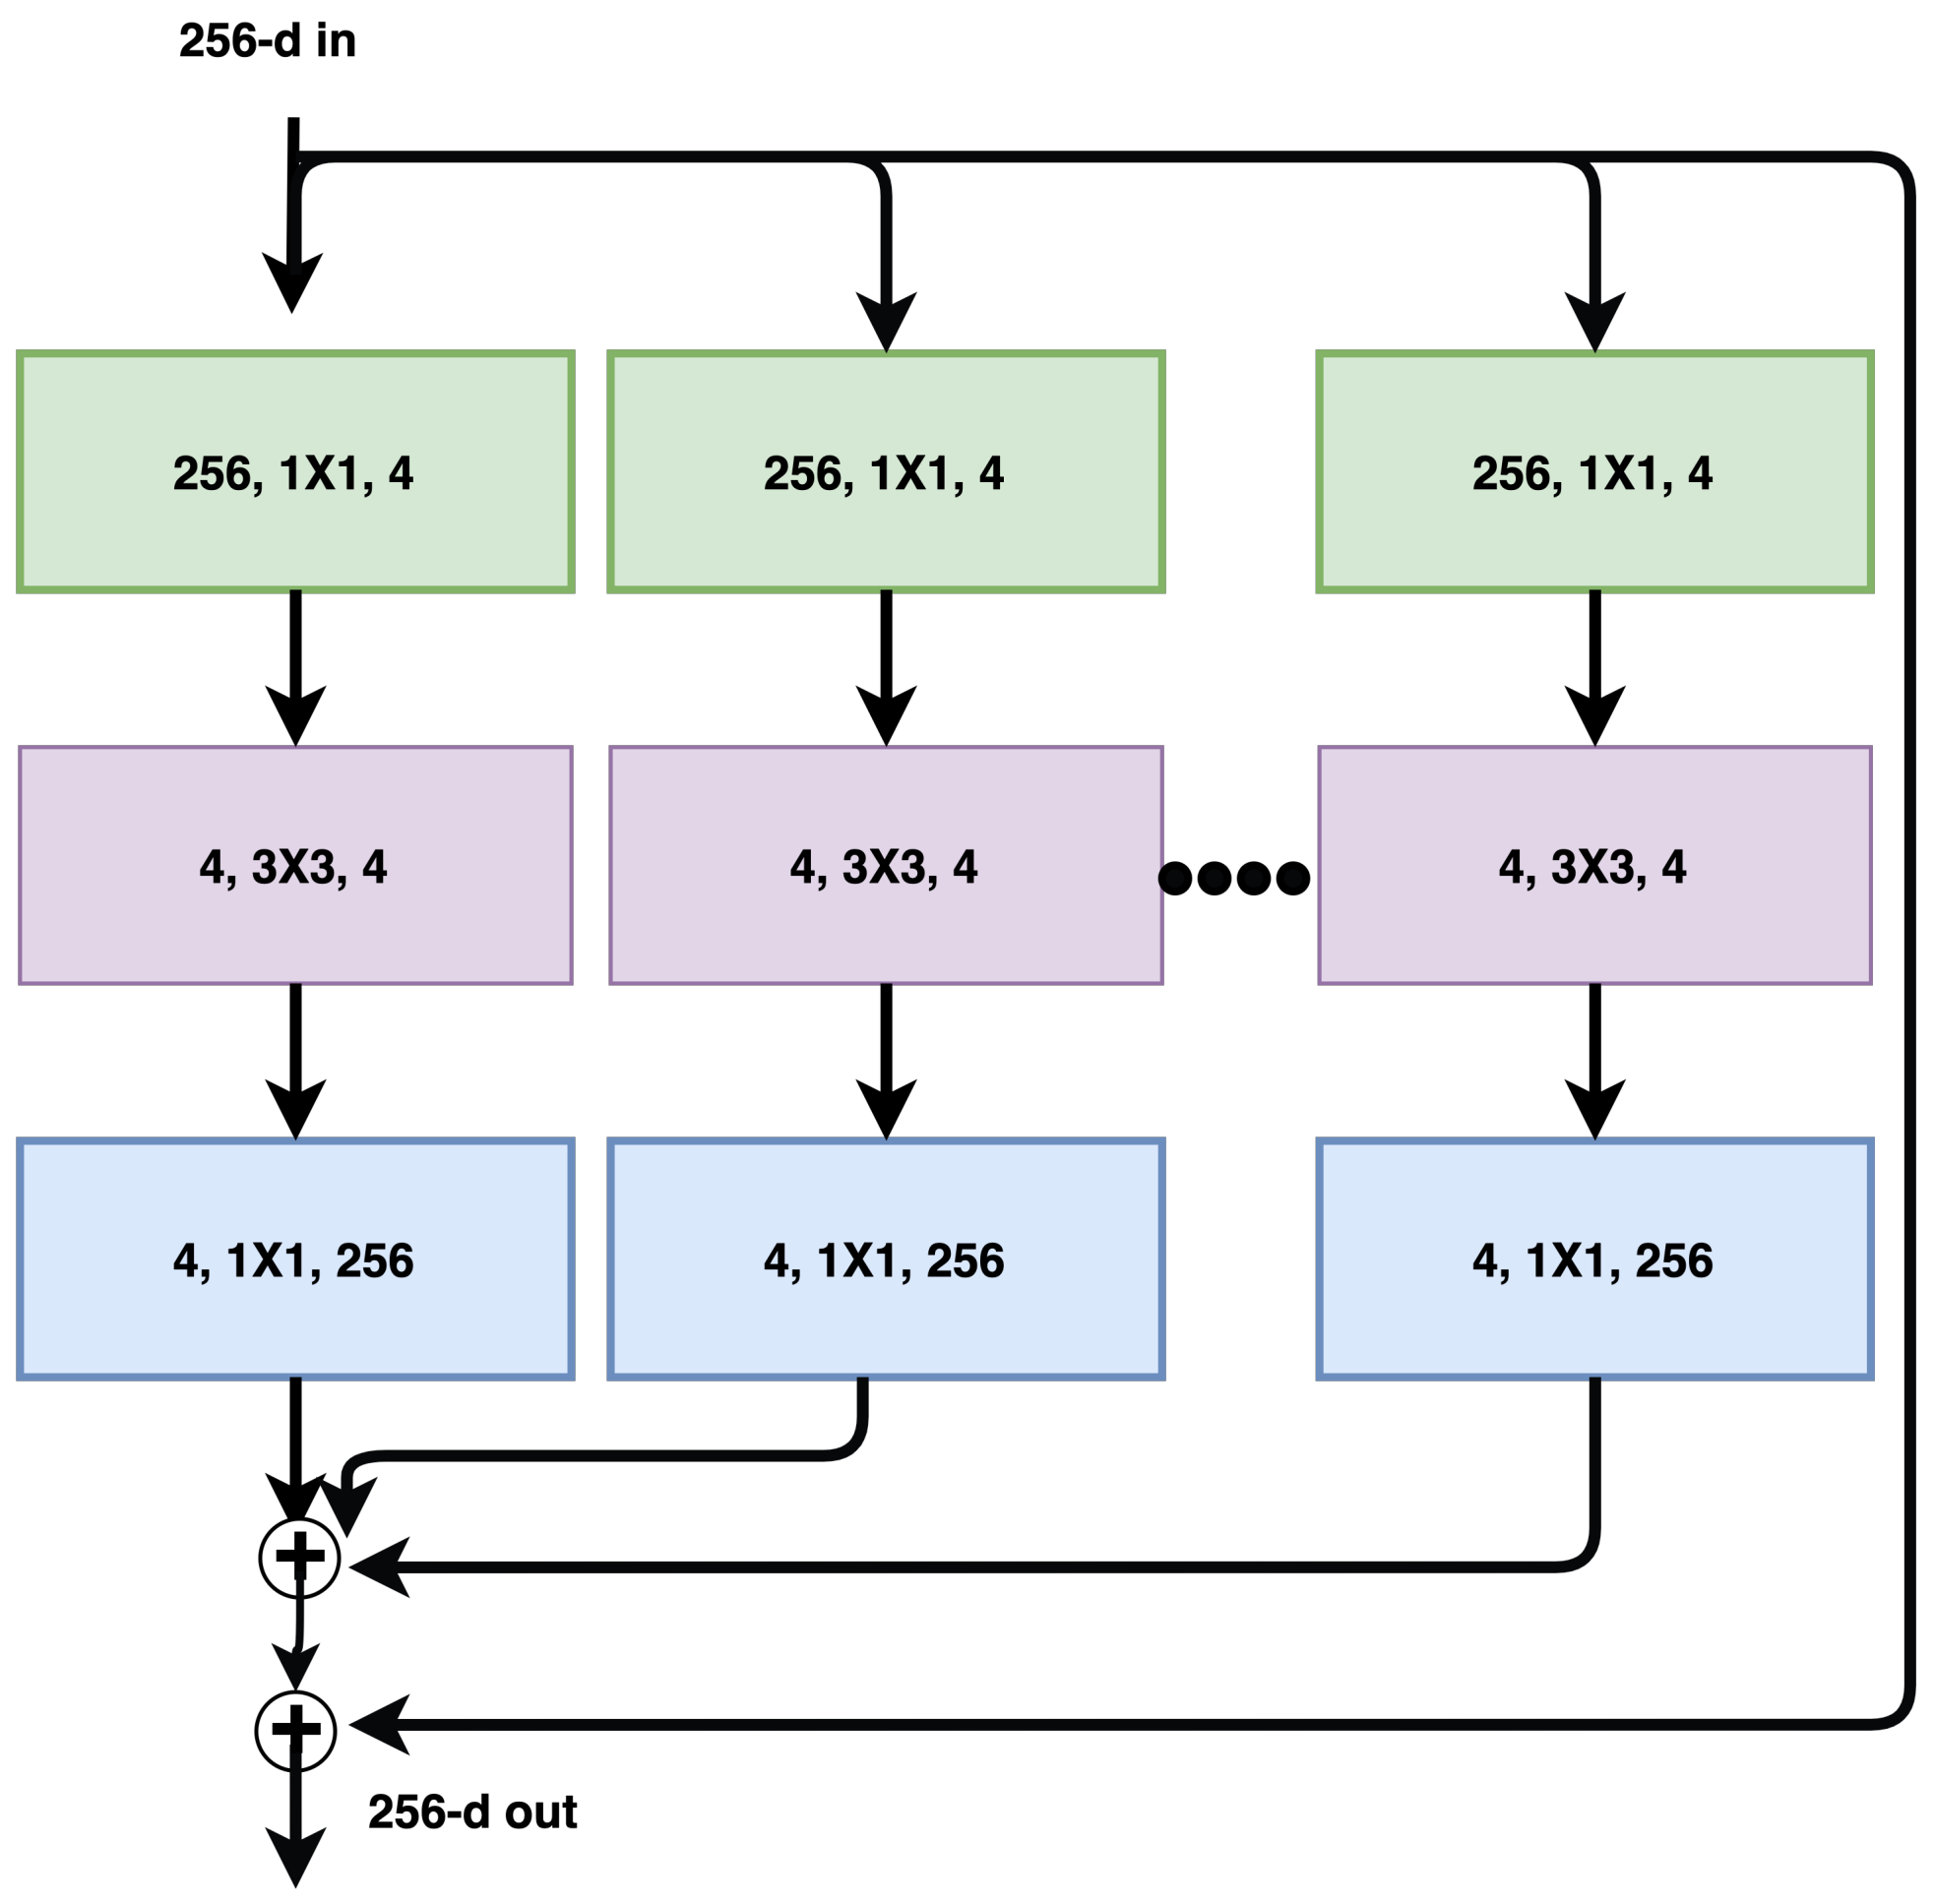
ResNeXt [37] takes its inspiration from ResNet’s skip connections, VGG’s stacking of layers, and Inception’s split-transform-merge strategy [37]. The ResNeXt module is very similar to Inception’s split-transform strategy, except that the output paths are merged by addition instead of depthwise concatenation, as shown in Figure 11. Another key difference from Inception is that all split paths share the same topology. ResNeXt proposed a hyperparameter called cardinality, which refers to independent paths to adjust the model’s capacity. The model achieved better results with increasing cardinality rather than going deeper and wider. The model is also easier to adapt to new datasets, as there is only one parameter for adjustment.
4. Results
4.1. Experimental Set-Up
We used the default settings for each of the networks. The input size of the image was the same, as specified by the authors of the networks. The input batch size was set to 32 with an initial learning rate of 10. The models were finetuned for 500 epochs from the weights of ImageNet [18] due to the limited number of images available in the datasets. The last layer for classification in all networks was changed to binary to differentiate between COVID-19 and non-COVID-19 radiographs or CT scans. PyTorch was used as a framework for training and testing the algorithms.
4.2. Datasets
Since there is no single sizeable dataset available for CXR images of COVID-19 patients, the dataset was curated from multiple sources to have sufficient training, testing, and validation data.
COVIDx: The first dataset of COVIDx [2] was made public to the research community, being a collection of four classes of CXR, namely (1) normal, (2) bacterial, (3) pneumonia (non-COVID), and (4) COVID-19. A total of 5941 posteroanterior (PA) CXR were collected from 2839 patients. Currently, the dataset contains only 68 X-rays for COVID-19 patients. There are 1203, 931, and 660 samples available for negative pneumonia, bacterial pneumonia, and non-COVID viral pneumonia, respectively.
COVIDCT: The University of San Diego collected a CT dataset of 349 CT images called COVID-CT [1]. The COVID-CT dataset contains clinical information on 216 COVID-19 patients. The CT images were extracted using PyMuPDF4 from 760 preprints such as medRxiv2, bioRxiv3, NEJM, and JAMA between 19 January 2020 and 25 March 2020.
4.3. Metrics
We took into account the following five metrics to evaluate each algorithm:
- Precision is the ratio of correctly predicted positive COVID-19 patients to the total positive predictions (i.e., true positives and false positives). This metric gives an algorithm the ability to determine the rate of false positives. The higher rate is for precision, and the lower rate is for false positives.
- Recall is also known as the sensitivity of the algorithm, and it is the ratio of correctly predicted positive outcomes (i.e., true positives) to the actual class observations (i.e., true positives and false negatives).
- F1 Score assesses the false positives and false negatives by taking the weighted average of the earlier-mentioned metrics. The F1 score is helpful in cases where class distribution is uneven.
- Accuracy is the most used and intuitive measure in classification. Accuracy is defined as the ratio of correct predictions to the total number of samples. Although high accuracy may be a good measure, it may not be the best in certain situations where the class distribution is not symmetric. Hence, we used other metrics to evaluate the performance of the algorithms.
- AUC stands for area under the curve and is the second-most-used metric for classification. It represents the degree of separability. The aim here is to model the network’s capability while distinguishing between classes. A higher value for the AUC means the model is better at predicting correct values; in other words, it can predict positive as positives and negatives as negatives.
4.4. Evaluations
The quantitative results are reported in Table 1 and Table 2 for the COVIDCT and COVIDx datasets, respectively. The accuracy of the COVIDCT dataset varied from 70% to 81%. Moreover, GoogleNet achieved the highest average recall of 94.29%, and DenseNet169 had the highest precision of 100%. The highest performance for the area under the curve was 88.80%, achieved via ResNet101. The accuracy of the deep learning models on the COVIDx dataset was higher than that for the COVIDCT dataset, ranging from 78.23% to 87.1%. On average, the accuracy was more than 82%. On the other hand, the deep models yielded lower recall results while having similar results for precision on the COVIDx dataset. The highest recall achieved was 47.62% by MNASNet1.0. Similarly, the best precision was from GoogleNet and EfficientNet-b3, which was 83.33%. In addition, the models struggled to produce comparable results for the AUC metric, where DenseNet201 gave the top performance, achieving 78.59%.
4.5. Attention
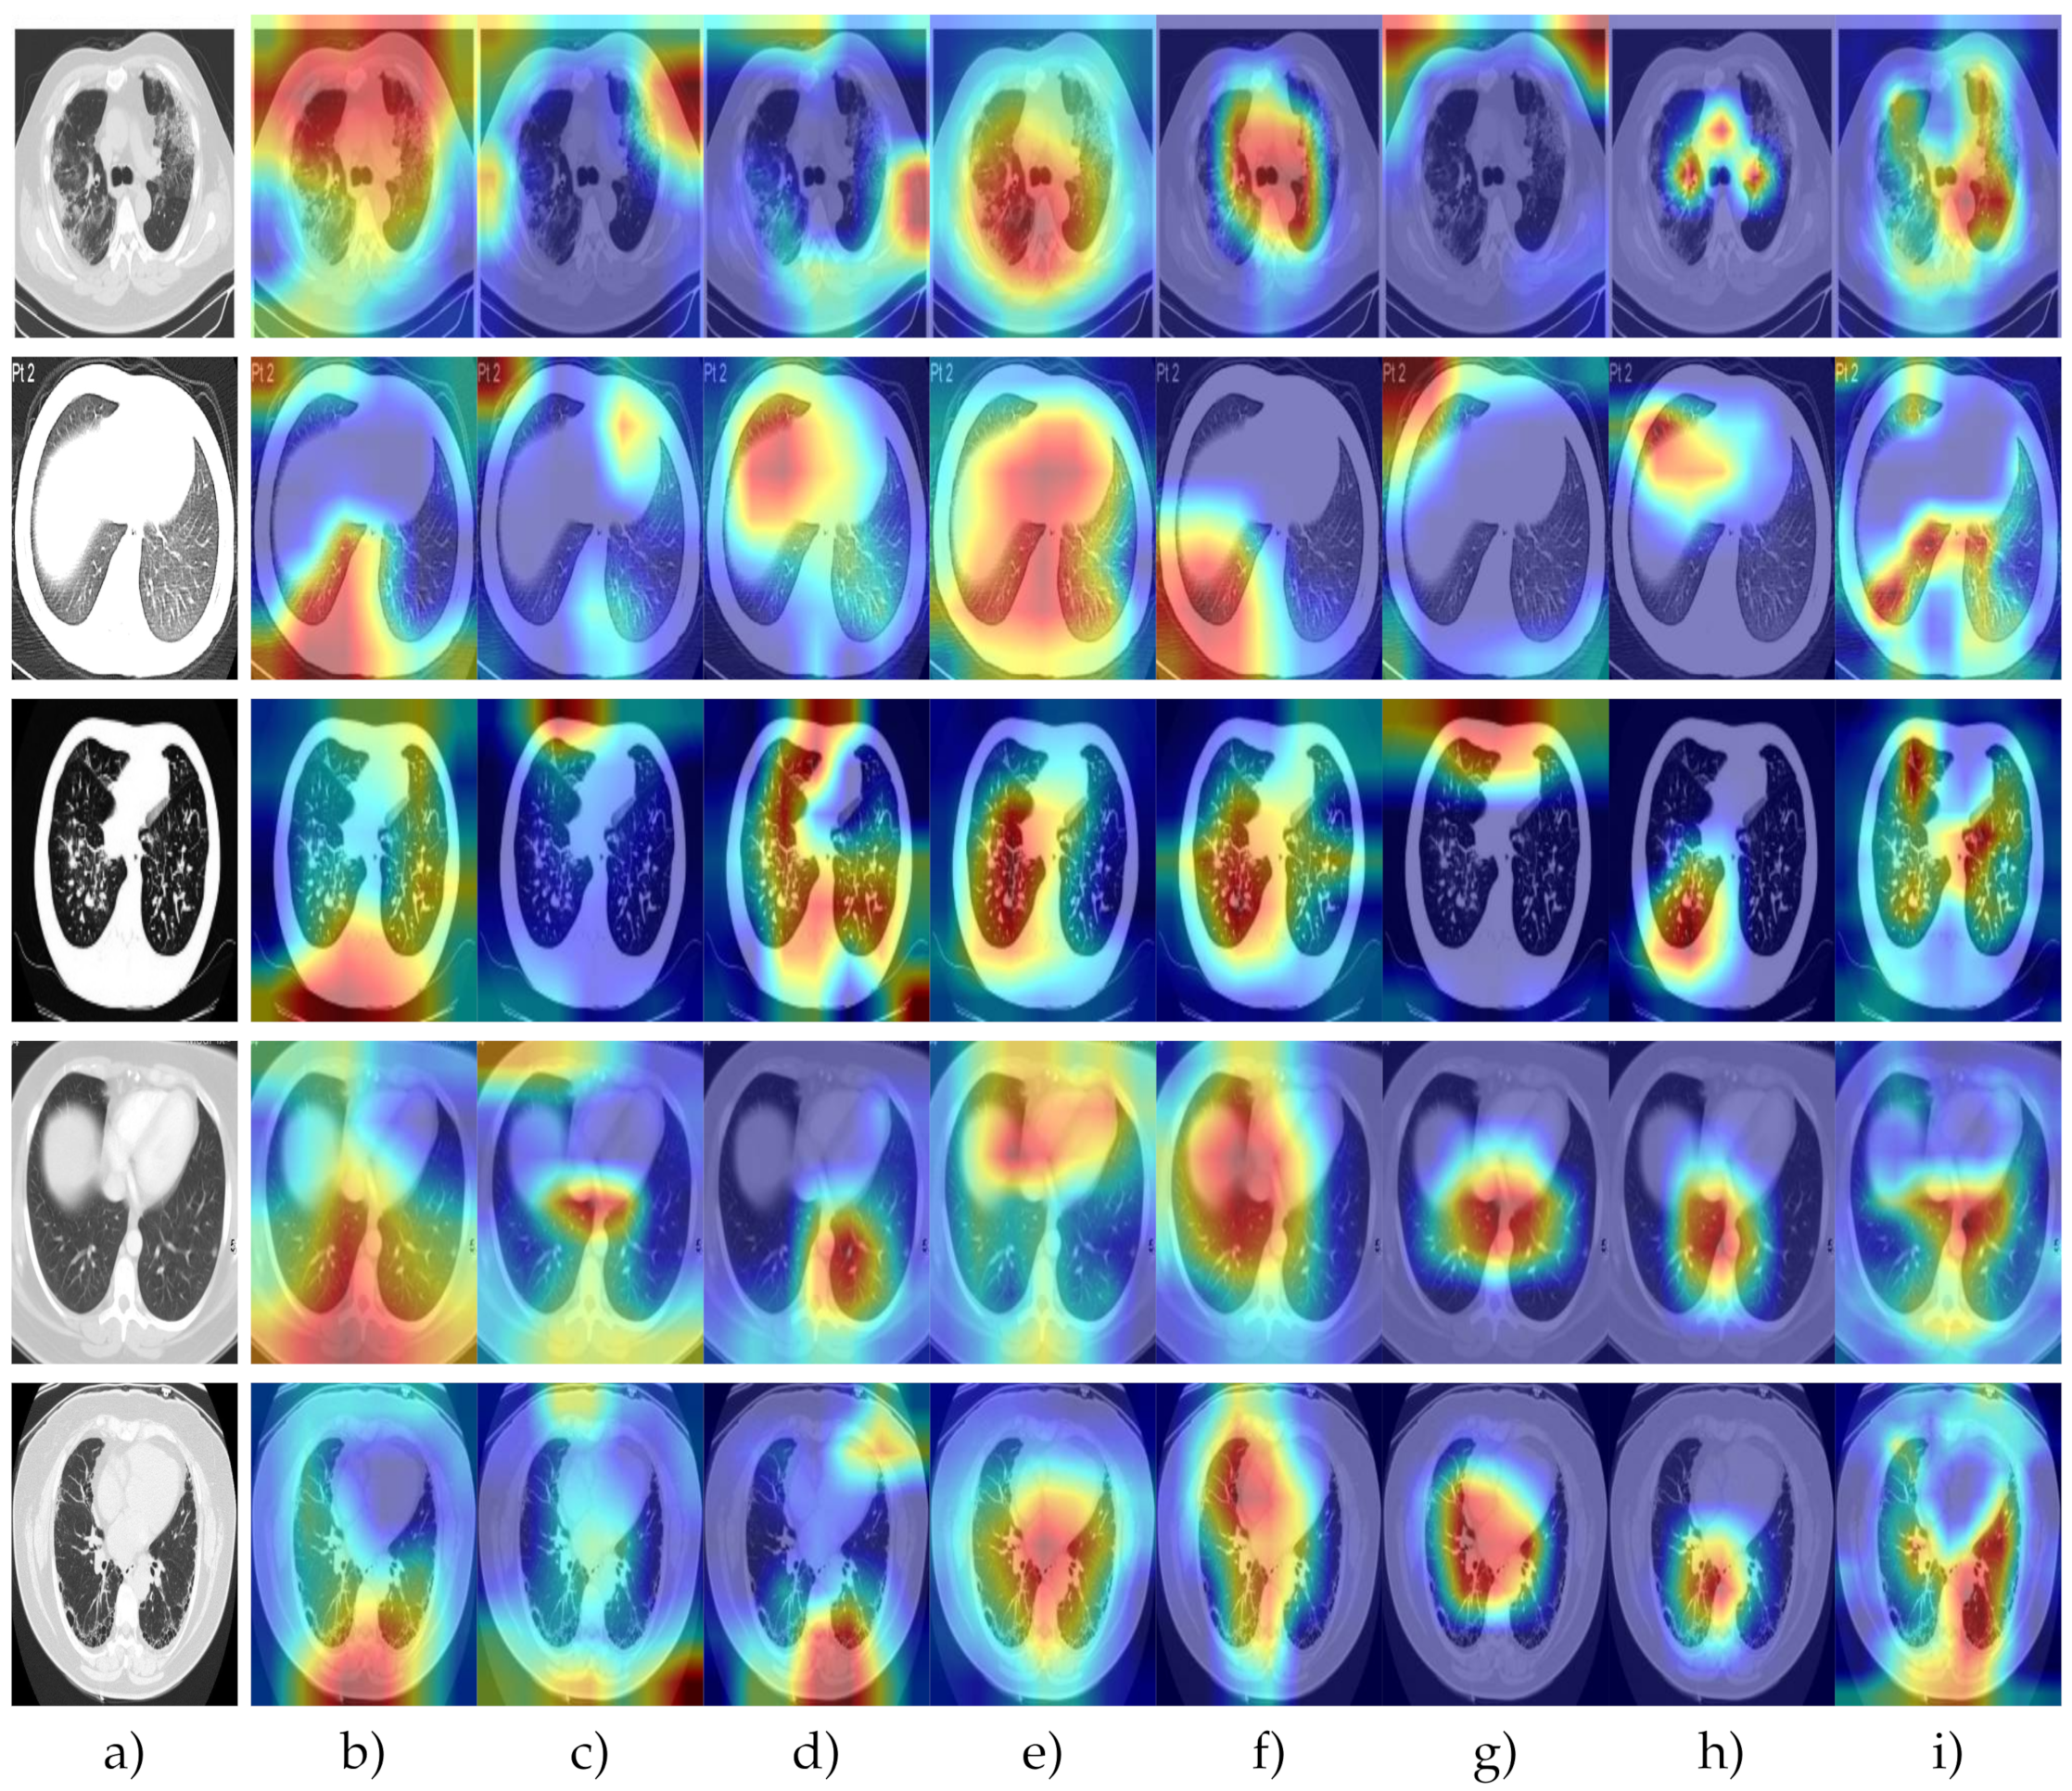
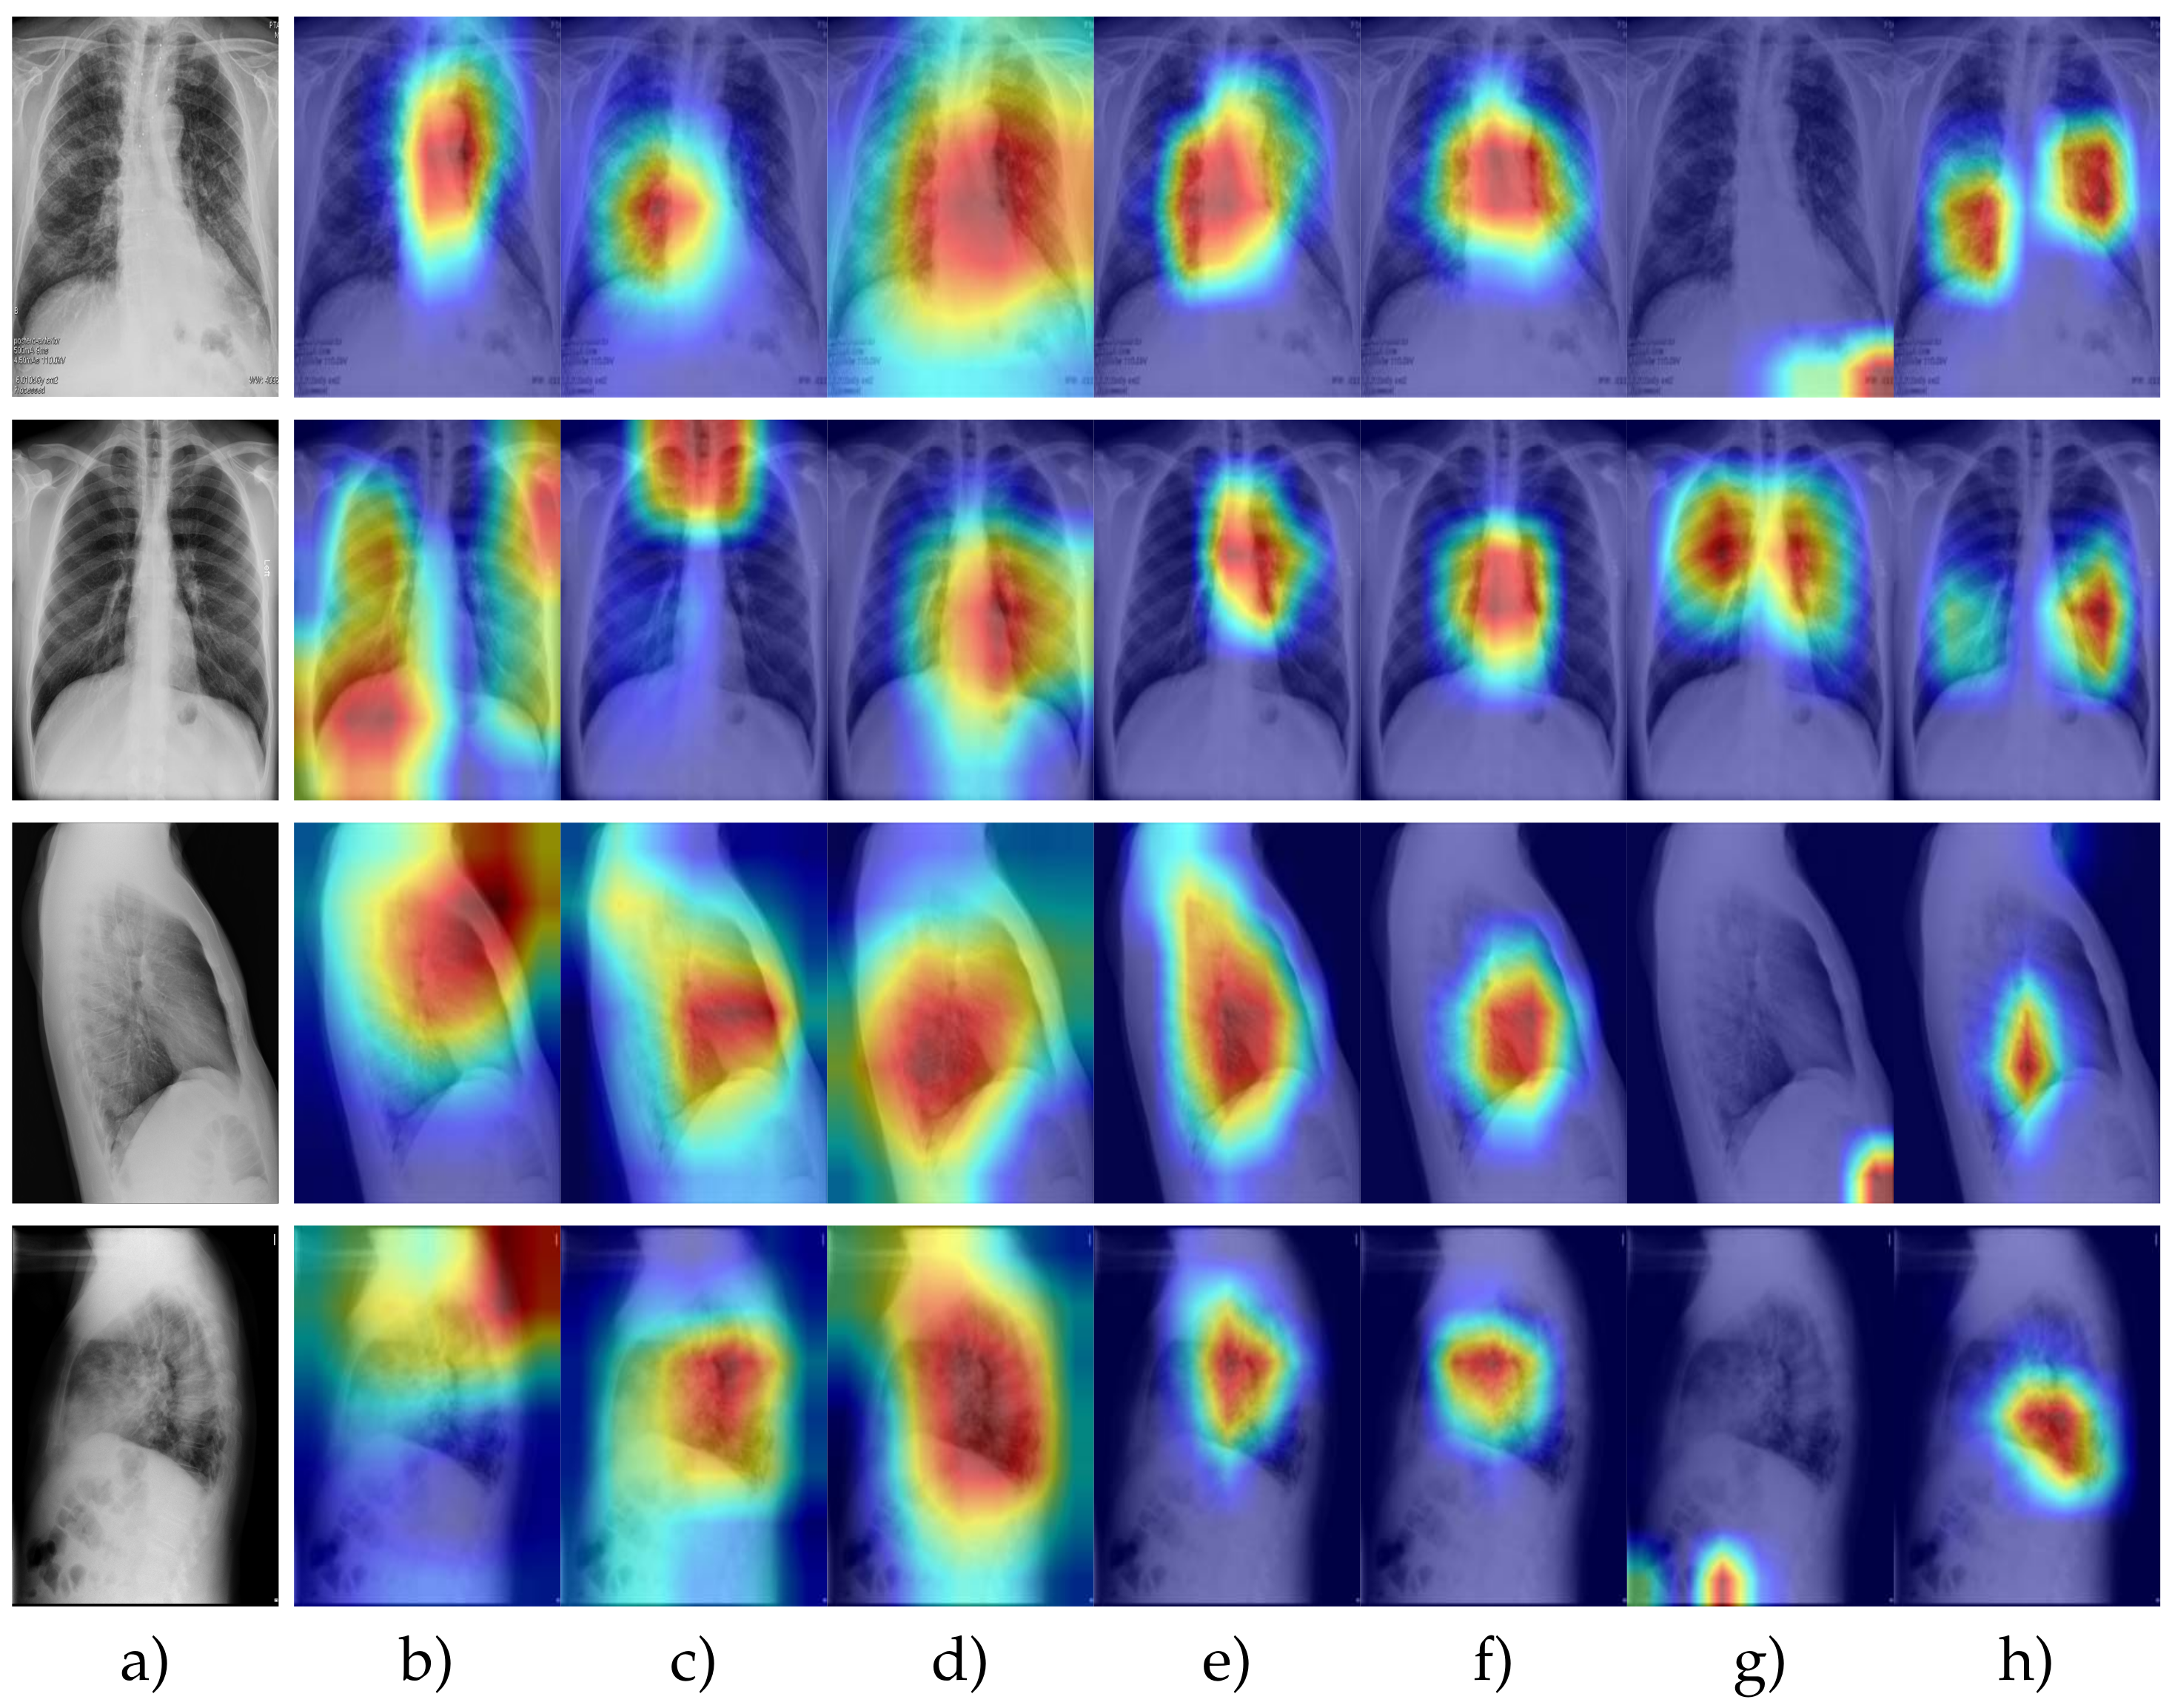
Each model focuses on specific aspects of the image to detect an object or an artifact. Here, we present the models for infected and non-infected radiographs. In Figure 12, we present the CT images with feature attention, where the red color indicates the region where the models focused. The first three rows contain COVID-19 cases, while the remaining two rows in Figure 12 are infection-free. Similarly, Figure 13 shows four different COVID-19 case radiographs from four different orientations. ResNet, DenseNet, and GoogleNet, presented in the second, third, and fourth columns, respectively, focused on most chest radiographs, while the remaining models concentrated on particular regions of the chest. It was challenging for the models to pinpoint the exact artifacts caused by COVID-19, as is obvious from the feature attention mechanism.
5. Open Problems and Challenges
- Lack of Significant Datasets: Data are vital for the progress of any field, and deep learning is no exception. Similarly, the identification of the specific anomalies requires significant annotated datasets. Although there are some available datasets for COVID-19, these are not significant enough for confident detection of an infection underway. Therefore, it is crucial to have large annotated datasets to accurately and appropriately detect the condition.
- Medical Experts Input: The system’s accuracy is dependent on the input of the experts in the research field. Although deep learning systems provide decent accuracy in identifying or classifying the infection, medical expert opinions are required on the outcome of the model to make sure that prediction is correct. The medical expert should also be consulted to determine the challenging cases and variants of the virus for the model’s robustness. Overall, the involvement of medical experts and their input should be at the heart of this research.
- Lack of Variants Identification: Since the pandemic’s start, everyone knew only one name: coronavirus. However, as time passed, more information about the infection came to light about the virus variants and strains. The infection capability and severity change depending on the strain; some are infectious, while others are dangerous. The identification and classification of these strains are vital so that the system can identify the strain type and warn about the challenges posed by infection.
- Models’ Efficiency: The efficiency of the models is another aspect neglected in COVID-19 research, as the focus thus far has been on the effectiveness rather than the efficiency. Real-time diagnosis is essential, along with accuracy, if the models need to be deployed for screening on devices. Therefore, it is desired to have research dedicated to training efficient models.
- Benchmark Deficiency: Benchmarks play an important role in advancing the field and identifying the state-of-the-art methods from the crowd, as there is a significant effort in COVID-19 research. The lack of benchmarks made it hard to isolate the excellent investigation, analysis, and methods.
- Generalization: The proposed models’ generalization for COVID-19 case detection, classification, and identification is vital due to the variants and strains emerging. The trained model should have the ability to accurately detect and classify cases without retraining the whole system in case of a new variant. The best approach would be to apply attention to the details specific to the virus type. Moreover, it should be noted that the dataset quality may also influence the models’ generalization and robustness. Hence, a step toward generalization is to utilize pretrained models with attention mechanisms.
- Integrating Input Data Types: COVID-19 has been identified or detected from a single source such as an X-ray or CT. However, utilizing more information, including the body temperature, will help improve the performance and reliability of the methods. Furthermore, employing multiple data types helps predict the relationship between COVID-19 and the most robust combination for early detection.
6. Conclusions
In this work, we have tested the current state-of-the-art deep learning algorithms’ capacity and provided baselines for future research comparisons on two publicly available COVIDCT and COVIDx datasets. We aimed to differentiate between COVID-19 cases and non-cases in scans and radiographs. We have shown the quantitative results and attention of the models in the sample images. We employed several metrics to give a more comprehensive understanding of network performance. Although the results are promising, the need for a more significant number of images will help further training and testing.
For future work, we aim to utilize the code and the dataset employed in this article for an apparent multinomial extension. The dataset investigated in this study has fewer images and furthermore has a lower number of infections. In the future, we will include an analysis of the significant datasets containing more images and more infection types. We will also focus on differentiating between different coronavirus types.
Author Contributions
Conceptualization, M.S., A.A., S.A., L.P., N.S. and M.B.; Data curation, M.S. and A.A.; Formal analysis, M.S., A.A., S.A., L.P., N.S. and M.B.; Methodology, M.S., A.A. and S.A.; Project administration, M.S. and A.A.; Supervision, M.S., A.A., S.A., L.P., N.S. and M.B.; Resources, A.A., M.S. and S.A.; Visualization, A.A., M.S. and S.A.; Writing—original draft, M.S. and A.A.; Writing—review & editing, M.S., A.A., S.A. and N.S. All authors have read and agreed to the published version of the manuscript.
Funding
This research recieved no external funding.
Institutional Review Board Statement
Not applicable.
Informed Consent Statement
Informed consent was obtained from all subjects involved in the study.
Data Availability Statement
COVIDCT and COVIDx datasets were used in this study.
Conflicts of Interest
The authors declare no conflict of interest.
Ethics Approval:
Since no experiments were performed on humans or animals (dead or alive) in this research, ethical approval was not required.
Code Availability:
https://github.com/saeed-anwar/COVID19-Baselines (accessed on 9 May 2022).
References
- He, X.; Yang, X.; Zhang, S.; Zhao, J.; Zhang, Y.; Xing, E.; Xie, P. Sample-Efficient Deep Learning for COVID-19 Diagnosis Based on CT Scans. medRxiv 2020. [Google Scholar] [CrossRef]
- Wang, L.; Wong, A. COVID-Net: A Tailored Deep Convolutional Neural Network Design for Detection of COVID-19 Cases from Chest X-Ray Images. arXiv 2020, arXiv:2003.09871. [Google Scholar] [CrossRef] [PubMed]
- Alshazly, H.; Linse, C.; Barth, E.; Martinetz, T. Explainable COVID-19 detection using chest CT scans and deep learning. Sensors 2021, 21, 455. [Google Scholar] [CrossRef]
- Alshazly, H.; Linse, C.; Abdalla, M.; Barth, E.; Martinetz, T. COVID-Nets: Deep CNN architectures for detecting COVID-19 using chest CT scans. Peerj Comput. Sci. 2021, 7, e655. [Google Scholar] [CrossRef] [PubMed]
- Kini, A.S.; Gopal Reddy, A.N.; Kaur, M.; Satheesh, S.; Singh, J.; Martinetz, T.; Alshazly, H. Ensemble Deep Learning and Internet of Things-Based Automated COVID-19 Diagnosis Framework. Contrast Media Mol. Imaging 2022, 2022, 7377502. [Google Scholar] [CrossRef] [PubMed]
- Sakib, S.; Tazrin, T.; Fouda, M.M.; Fadlullah, Z.M.; Guizani, M. DL-CRC: Deep learning-based chest radiograph classification for COVID-19 detection: A novel approach. IEEE Access 2020, 8, 171575–171589. [Google Scholar] [CrossRef]
- Chen, J.; Wu, L.; Zhang, J.; Zhang, L.; Gong, D.; Zhao, Y.; Hu, S.; Wang, Y.; Hu, X.; Zheng, B.; et al. Deep learning-based model for detecting 2019 novel coronavirus pneumonia on high-resolution computed tomography: A prospective study. medRxiv 2020. [Google Scholar] [CrossRef]
- Zhou, Z.; Siddiquee, M.M.R.; Tajbakhsh, N.; Liang, J. Unet++: A nested u-net architecture for medical image segmentation. In Deep Learning in Medical Image Analysis and Multimodal Learning for Clinical Decision Support; Springer: Cham, Switzerland, 2018; pp. 3–11. [Google Scholar]
- Li, L.; Qin, L.; Xu, Z.; Yin, Y.; Wang, X.; Kong, B.; Bai, J.; Lu, Y.; Fang, Z.; Song, Q.; et al. Artificial intelligence distinguishes COVID-19 from community acquired pneumonia on chest CT. Radiology 2020, 200905. [Google Scholar] [CrossRef]
- He, K.; Zhang, X.; Ren, S.; Sun, J. Deep residual learning for image recognition. In Proceedings of the IEEE Conference on Computer Vision and Pattern Recognition, Las Vegas, NV, USA, 27–30 June 2016; pp. 770–778. [Google Scholar]
- Rajaraman, S.; Candemir, S.; Kim, I.; Thoma, G.; Antani, S. Visualization and interpretation of convolutional neural network predictions in detecting pneumonia in pediatric chest radiographs. Appl. Sci. 2018, 8, 1715. [Google Scholar] [CrossRef] [PubMed] [Green Version]
- Kermany, D.S.; Goldbaum, M.; Cai, W.; Valentim, C.C.; Liang, H.; Baxter, S.L.; McKeown, A.; Yang, G.; Wu, X.; Yan, F.; et al. Identifying medical diagnoses and treatable diseases by image-based deep learning. Cell 2018, 172, 1122–1131. [Google Scholar] [CrossRef] [PubMed]
- Song, Y.; Zheng, S.; Li, L.; Zhang, X.; Zhang, X.; Huang, Z.; Chen, J.; Zhao, H.; Jie, Y.; Wang, R.; et al. Deep learning enables accurate diagnosis of novel coronavirus (COVID-19) with CT images. medRxiv 2020. [Google Scholar] [CrossRef] [PubMed]
- Zheng, C.; Deng, X.; Fu, Q.; Zhou, Q.; Feng, J.; Ma, H.; Liu, W.; Wang, X. Deep learning-based detection for COVID-19 from chest CT using weak label. medRxiv 2020. [Google Scholar] [CrossRef] [Green Version]
- Ng, M.Y.; Lee, E.Y.; Yang, J.; Yang, F.; Li, X.; Wang, H.; Lui, M.M.s.; Lo, C.S.Y.; Leung, B.; Khong, P.L.; et al. Imaging profile of the COVID-19 infection: Radiologic findings and literature review. Radiol. Cardiothorac. Imaging 2020, 2, e200034. [Google Scholar] [CrossRef] [Green Version]
- Farooq, M.; Hafeez, A. Covid-resnet: A deep learning framework for screening of covid19 from radiographs. arXiv 2020, arXiv:2003.14395. [Google Scholar]
- Ghoshal, B.; Tucker, A. Estimating uncertainty and interpretability in deep learning for coronavirus (COVID-19) detection. arXiv 2020, arXiv:2003.10769. [Google Scholar]
- Deng, J.; Dong, W.; Socher, R.; Li, L.J.; Li, K.; Fei-Fei, L. ImageNet: A Large-Scale Hierarchical Image Database. In Proceedings of the CVPR09, Miami, FL, USA, 20–25 June 2009. [Google Scholar]
- Krizhevsky, A.; Sutskever, I.; Hinton, G.E. Imagenet classification with deep convolutional neural networks. In Proceedings of the Advances in Neural Information Processing Systems, Lake Tahoe, NV, USA, 3–8 December 2012; pp. 1097–1105. [Google Scholar]
- Simonyan, K.; Zisserman, A. Very Deep Convolutional Networks for Large-Scale Image Recognition. In Proceedings of the International Conference on Learning Representations, San Diego, CA, USA, 7–9 May 2015. [Google Scholar]
- Glorot, X.; Bengio, Y. Understanding the difficulty of training deep feedforward neural networks. In Proceedings of the Thirteenth International Conference on Artificial Intelligence and Statistics, AISTATS 2010, Chia Laguna Resort, Sardinia, Italy, 13–15 May 2010; Volume 9, pp. 249–256. [Google Scholar]
- He, K.; Zhang, X.; Ren, S.; Sun, J. Delving Deep into Rectifiers: Surpassing Human-Level Performance on ImageNet Classification. In Proceedings of the 2015 IEEE International Conference on Computer Vision (ICCV), Santiago, Chile, 7–13 December 2015; pp. 1026–1034. [Google Scholar]
- Hochreiter, S. The vanishing gradient problem during learning recurrent neural nets and problem solutions. Int. J. Uncertain. Fuzziness-Knowl. Syst. 1998, 6, 107–116. [Google Scholar] [CrossRef] [Green Version]
- Szegedy, C.; Wei, L.; Yangqing, J.; Sermanet, P.; Reed, S.; Anguelov, D.; Erhan, D.; Vanhoucke, V.; Rabinovich, A. Going deeper with convolutions. In Proceedings of the 2015 IEEE Conference on Computer Vision and Pattern Recognition (CVPR), Boston, MA, USA, 7–12 June 2015; pp. 1–9. [Google Scholar]
- Huang, G.; Liu, Z.; Van Der Maaten, L.; Weinberger, K.Q. Densely connected convolutional networks. In Proceedings of the IEEE Conference on Computer Vision and Pattern Recognition, Honolulu, HI, USA, 21–26 July 2017; pp. 4700–4708. [Google Scholar]
- Huang, Y.; Cheng, Y.; Bapna, A.; Firat, O.; Chen, D.; Chen, M.; Lee, H.; Ngiam, J.; Le, Q.V.; Wu, Y.; et al. Gpipe: Efficient training of giant neural networks using pipeline parallelism. In Proceedings of the Advances in Neural Information Processing Systems, Vancouver, BC, Canada, 8–14 December 2019; pp. 103–112. [Google Scholar]
- Tan, M.; Le, Q.V. Efficientnet: Rethinking model scaling for convolutional neural networks. arXiv 2019, arXiv:1905.11946. [Google Scholar]
- Sandler, M.; Howard, A.; Zhu, M.; Zhmoginov, A.; Chen, L.C. Mobilenetv2: Inverted residuals and linear bottlenecks. In Proceedings of the IEEE Conference on Computer Vision and Pattern Recognition, Salt Lake City, UT, USA, 18–23 June 2018; pp. 4510–4520. [Google Scholar]
- Hu, J.; Shen, L.; Sun, G. Squeeze-and-excitation networks. In Proceedings of the IEEE Conference on Computer Vision and Pattern Recognition, Salt Lake City, UT, USA, 18–23 June 2018; pp. 7132–7141. [Google Scholar]
- Iandola, F.N.; Han, S.; Moskewicz, M.W.; Ashraf, K.; Dally, W.J.; Keutzer, K. SqueezeNet: AlexNet-level accuracy with 50x fewer parameters and <0.5 MB model size. arXiv 2016, arXiv:1602.07360. [Google Scholar]
- Zhang, X.; Zhou, X.; Lin, M.; Sun, J. Shufflenet: An extremely efficient convolutional neural network for mobile devices. In Proceedings of the IEEE Conference on Computer Vision and Pattern Recognition, Salt Lake City, UT, USA, 18–23 June 2018; pp. 6848–6856. [Google Scholar]
- Howard, A.G.; Zhu, M.; Chen, B.; Kalenichenko, D.; Wang, W.; Weyand, T.; Andreetto, M.; Adam, H. Mobilenets: Efficient convolutional neural networks for mobile vision applications. arXiv 2017, arXiv:1704.04861. [Google Scholar]
- Huang, G.; Liu, S.; Van der Maaten, L.; Weinberger, K.Q. Condensenet: An efficient densenet using learned group convolutions. In Proceedings of the IEEE Conference on Computer Vision and Pattern Recognition, Salt Lake City, UT, USA, 18–23 June 2018; pp. 2752–2761. [Google Scholar]
- Chollet, F. Xception: Deep learning with depthwise separable convolutions. In Proceedings of the IEEE Conference on Computer Vision and Pattern Recognition, Honolulu, HI, USA, 21–26 July 2017; pp. 1251–1258. [Google Scholar]
- Tan, M.; Chen, B.; Pang, R.; Vasudevan, V.; Sandler, M.; Howard, A.; Le, Q.V. Mnasnet: Platform-aware neural architecture search for mobile. In Proceedings of the IEEE Conference on Computer Vision and Pattern Recognition, Long Beach, CA, USA, 15–20 June 2019; pp. 2820–2828. [Google Scholar]
- Zagoruyko, S.; Komodakis, N. Wide residual networks. arXiv 2016, arXiv:1605.07146. [Google Scholar]
- Xie, S.; Girshick, R.; Dollár, P.; Tu, Z.; He, K. Aggregated residual transformations for deep neural networks. In Proceedings of the IEEE Conference on Computer Vision and Pattern Recognition, Honolulu, HI, USA, 21–26 July 2017; pp. 1492–1500. [Google Scholar]
Figure 1.
Representative images of the COVIDCT [1] dataset employed for training and evaluation of algorithms.
Figure 1.
Representative images of the COVIDCT [1] dataset employed for training and evaluation of algorithms.

Figure 2.
Samples from the COVIDx [2] dataset. The upper row shows examples with COVID-19, while the lower row presents images without COVID-19’s presence.
Figure 2.
Samples from the COVIDx [2] dataset. The upper row shows examples with COVID-19, while the lower row presents images without COVID-19’s presence.

Figure 3.
Sample architecture of plain networks.

Figure 4.
Inception: the basic building block of GoogleNet.

Figure 5.
Basic building block of the Residual Network.

Figure 6.
The main module of DenseNet showing the concatenation of features from previous layers.

Figure 7.
Mobile network with an MBConvolution block composed of three convolutional layers and a linear layer.
Figure 7.
Mobile network with an MBConvolution block composed of three convolutional layers and a linear layer.

Figure 8.
Fire module: the backbone module of the squeeze network.

Figure 9.
Shufflenet basic building block. “GConv” stands for group convolution, and “DWConv” denotes depth-wise convolution.
Figure 9.
Shufflenet basic building block. “GConv” stands for group convolution, and “DWConv” denotes depth-wise convolution.

Figure 10.
The basic schematic of a Wide ResNet block with and without a dropout layer.

Figure 11.
ResNeXt backbone module showing different paths for feature learning.

Figure 12.
Representative images from COVID-CT to show the algorithm focus areas. The red color shows the focus of the network. The first three rows of images are of cases with COVID-19, while the last two rows of images are COVID-19-free. (a) Input images. (b) Alexnet. (c) VGG. (d) Resnet. (e) Densenet. (f) Googlenet. (g) Efficientnet-b0. (h) Efficientnet-b7. (i) Squeezenet.

Figure 13.
Samples from the COVIDx dataset to show the feature attention. All input images contain COVID-19 cases. The sequence shown in the figure is (a) input images, (b) ResNet, (c) DenseNet, (d) GoogleNet, (e) ResNeXt, (f) MNASNet, (g) EfficientNet, and (h) ShuffleNet.
Figure 13.
Samples from the COVIDx dataset to show the feature attention. All input images contain COVID-19 cases. The sequence shown in the figure is (a) input images, (b) ResNet, (c) DenseNet, (d) GoogleNet, (e) ResNeXt, (f) MNASNet, (g) EfficientNet, and (h) ShuffleNet.


Table 1.
Five quantitative measures for state-of-the-art deep learning networks on COVIDCT. The variants of the same algorithm are differentiated via the number at the end of the method’s name.
Table 1.
Five quantitative measures for state-of-the-art deep learning networks on COVIDCT. The variants of the same algorithm are differentiated via the number at the end of the method’s name.
| Methods | Average Recall | Average Precision | Average F1 | Average Accuracy | Average AUC |
|---|---|---|---|---|---|
| AlexNet | 0.7810 | 0.7321 | 0.7558 | 0.7389 | 0.8007 |
| VGG11 | 0.8952 | 0.7344 | 0.8069 | 0.7783 | 0.8785 |
| VGG13 | 0.7524 | 0.8144 | 0.7822 | 0.7833 | 0.8610 |
| VGG16 | 0.8381 | 0.7333 | 0.7822 | 0.7586 | 0.8395 |
| VGG19 | 0.8476 | 0.7876 | 0.8165 | 0.8030 | 0.8796 |
| ResNet18 | 0.7524 | 0.7670 | 0.7596 | 0.7537 | 0.8397 |
| ResNet34 | 0.8667 | 0.7982 | 0.8311 | 0.8177 | 0.8851 |
| ResNet50 | 0.7905 | 0.8300 | 0.8098 | 0.8079 | 0.8769 |
| ResNet101 | 0.8571 | 0.7826 | 0.8182 | 0.8030 | 0.8880 |
| ResNet152 | 0.7333 | 0.8191 | 0.7739 | 0.7783 | 0.8670 |
| DenseNet121 | 0.7238 | 0.8444 | 0.7795 | 0.7882 | 0.8700 |
| DenseNet161 | 0.7905 | 0.8218 | 0.8058 | 0.8030 | 0.8729 |
| DenseNet169 | 0.7524 | 0.8495 | 0.7980 | 0.8030 | 0.8586 |
| DenseNet201 | 0.8476 | 0.7739 | 0.8091 | 0.7931 | 0.8698 |
| GoogleNet | 0.9429 | 0.6306 | 0.7557 | 0.6847 | 0.7815 |
| Efficient-b0 | 0.7333 | 0.7700 | 0.7512 | 0.7488 | 0.8518 |
| Efficient-b1 | 0.8095 | 0.7589 | 0.7834 | 0.7685 | 0.8588 |
| Efficient-b2 | 0.7143 | 0.7895 | 0.7500 | 0.7537 | 0.8325 |
| Efficient-b3 | 0.8190 | 0.8037 | 0.8113 | 0.8030 | 0.8862 |
| Efficient-b4 | 0.8190 | 0.8037 | 0.8113 | 0.8030 | 0.8862 |
| Efficient-b5 | 0.6952 | 0.7300 | 0.7122 | 0.7094 | 0.7903 |
| Efficient-b6 | 0.7524 | 0.7900 | 0.7707 | 0.7685 | 0.8552 |
| Efficient-b7 | 0.7905 | 0.7905 | 0.7905 | 0.7833 | 0.8566 |
| SqueezeNet1.0 | 0.9048 | 0.7090 | 0.7950 | 0.7586 | 0.8722 |
| SqueezeNet1.1 | 0.9333 | 0.7259 | 0.8167 | 0.7833 | 0.8725 |
| MNASNet0.5 | 0.5238 | 0.7857 | 0.6286 | 0.6798 | 0.7938 |
| MNASNet1.0 | 0.8952 | 0.7833 | 0.8356 | 0.8177 | 0.8845 |
| ResNeXt50-32x4d | 0.8000 | 0.8235 | 0.8116 | 0.8079 | 0.8726 |
| ResNeXt101-32x8d | 0.8000 | 0.7368 | 0.7671 | 0.7488 | 0.8624 |
| Wide-ResNet50.2 | 0.7905 | 0.7757 | 0.7830 | 0.7734 | 0.8571 |
| Wide-ResNet101-2 | 0.8667 | 0.7712 | 0.8161 | 0.7980 | 0.8863 |
| ShuffleNet-v2-x0.5 | 0.8190 | 0.7611 | 0.7890 | 0.7734 | 0.8654 |
| ShuffleNet-v2-x1.0 | 0.7714 | 0.7431 | 0.7570 | 0.7438 | 0.8289 |
| MobileNet-v2 | 0.7810 | 0.7736 | 0.7773 | 0.7685 | 0.8549 |
Table 2.
Quantitative results for state-of-the-art deep learning algorithms on COVIDx. The numbers at the end of the method name indicate variants of the same algorithms.
Table 2.
Quantitative results for state-of-the-art deep learning algorithms on COVIDx. The numbers at the end of the method name indicate variants of the same algorithms.
| Methods | Average Recall | Average Precision | Average F1 | Average Accuracy | Average AUC |
|---|---|---|---|---|---|
| AlexNet | 0.0952 | 0.5000 | 0.1600 | 0.8306 | 0.6445 |
| VGG11 | 0.1429 | 0.5000 | 0.2222 | 0.8306 | 0.6815 |
| VGG13 | 0.1905 | 0.5000 | 0.2759 | 0.8306 | 0.6875 |
| VGG16 | 0.1905 | 1.0000 | 0.3200 | 0.8629 | 0.7240 |
| VGG19 | 0.1905 | 0.8000 | 0.3077 | 0.8548 | 0.6366 |
| ResNet18 | 0.2857 | 0.8571 | 0.4286 | 0.8710 | 0.7406 |
| ResNet34 | 0.1905 | 0.6667 | 0.2963 | 0.8468 | 0.7235 |
| ResNet50 | 0.1429 | 0.7500 | 0.2400 | 0.8468 | 0.6588 |
| ResNet101 | 0.0952 | 0.4000 | 0.1538 | 0.8226 | 0.5825 |
| ResNet152 | 0.1429 | 0.4286 | 0.2143 | 0.8226 | 0.6084 |
| DenseNet121 | 0.3810 | 0.5333 | : 0.4444 | 0.8387 | 0.6764 |
| DenseNet161 | 0.3810 | 0.6667 | : 0.4848 | 0.8629 | 0.6320 |
| DenseNet169 | 0.1429 | 0.3750 | : 0.2069 | 0.8145 | 0.5927 |
| DenseNet201 | 0.0952 | 0.2857 | : 0.1429 | 0.8065 | 0.5890 |
| GoogleNet | 0.2381 | 0.8333 | 0.3704 | 0.8629 | 0.6990 |
| EfficientNet-b0 | 0.1429 | 1.0000 | 0.2500 | 0.8548 | 0.6893 |
| EfficientNet-b1 | 0.2381 | 0.4545 | 0.3125 | 0.8226 | 0.6644 |
| EfficientNet-b2 | 0.3333 | 0.7000 | 0.4516 | 0.8629 | 0.7180 |
| EfficientNet-b3 | 0.2381 | 0.8333 | 0.3704 | 0.8629 | 0.7263 |
| EfficientNet-b4 | 0.1429 | 0.7500 | 0.2400 | 0.8468 | 0.7499 |
| EfficientNet-b5 | 0.0952 | 0.5000 | 0.1600 | 0.8306 | 0.6251 |
| EfficientNet-b6 | 0.1429 | 0.3750 | 0.2069 | 0.8145 | 0.6671 |
| EfficientNet-b7 | 0.1429 | 0.7500 | 0.2400 | 0.8468 | 0.7069 |
| SqueezeNet1.0 | 0.285 | 0.4000 | 0.3333 | 0.8065 | 0.6602 |
| SqueezeNet1.1 | 0.2381 | 0.7143 | 0.3571 | 0.8548 | 0.6338 |
| MNASNet0.5 | 0.6667 | 0.4000 | 0.5000 | 0.7742 | 0.7383 |
| MNASNet1.0 | 0.5238 | 0.4400 | 0.4783 | 0.8065 | 0.7560 |
| ResNeXt50-32x4d | 0.2381 | 0.5556 | 0.3333 | 0.8387 | 0.7110 |
| ResNeXt101-32x8d | 0.1429 | 0.7500 | 0.2400 | 0.8468 | 0.6990 |
| Wide-ResNet50.2 | 0.1905 | 1.0000 | 0.3200 | 0.8629 | 0.6630 |
| Wide-ResNet101-2 | 0.2381 | 0.3125 | 0.2703 | 0.7823 | 0.6144 |
| ShuffleNet-v2-x0.5 | 0.2381 | 0.5556 | 0.3333 | 0.8387 | 0.6620 |
| ShuffleNet-v2-x1.0 | 0.1905 | 0.4000 | 0.2581 | 0.8145 | 0.6482 |
| MobileNet-v2 | 0.3333 | 0.7000 | 0.4516 | 0.8629 | 0.7180 |
Publisher’s Note: MDPI stays neutral with regard to jurisdictional claims in published maps and institutional affiliations. |
© 2022 by the authors. Licensee MDPI, Basel, Switzerland. This article is an open access article distributed under the terms and conditions of the Creative Commons Attribution (CC BY) license (https://creativecommons.org/licenses/by/4.0/).
Share and Cite
MDPI and ACS Style
Saqib, M.; Anwar, A.; Anwar, S.; Petersson, L.; Sharma, N.; Blumenstein, M. COVID-19 Detection from Radiographs: Is Deep Learning Able to Handle the Crisis? Signals 2022, 3, 296-312. https://doi.org/10.3390/signals3020019
AMA Style
Saqib M, Anwar A, Anwar S, Petersson L, Sharma N, Blumenstein M. COVID-19 Detection from Radiographs: Is Deep Learning Able to Handle the Crisis? Signals. 2022; 3(2):296-312. https://doi.org/10.3390/signals3020019
Chicago/Turabian StyleSaqib, Muhammad, Abbas Anwar, Saeed Anwar, Lars Petersson, Nabin Sharma, and Michael Blumenstein. 2022. "COVID-19 Detection from Radiographs: Is Deep Learning Able to Handle the Crisis?" Signals 3, no. 2: 296-312. https://doi.org/10.3390/signals3020019