
Mortality and Years of Potential Life Lost Due to COVID-19 in Brazil


Abstract
:1. Introduction
2. Materials and Methods
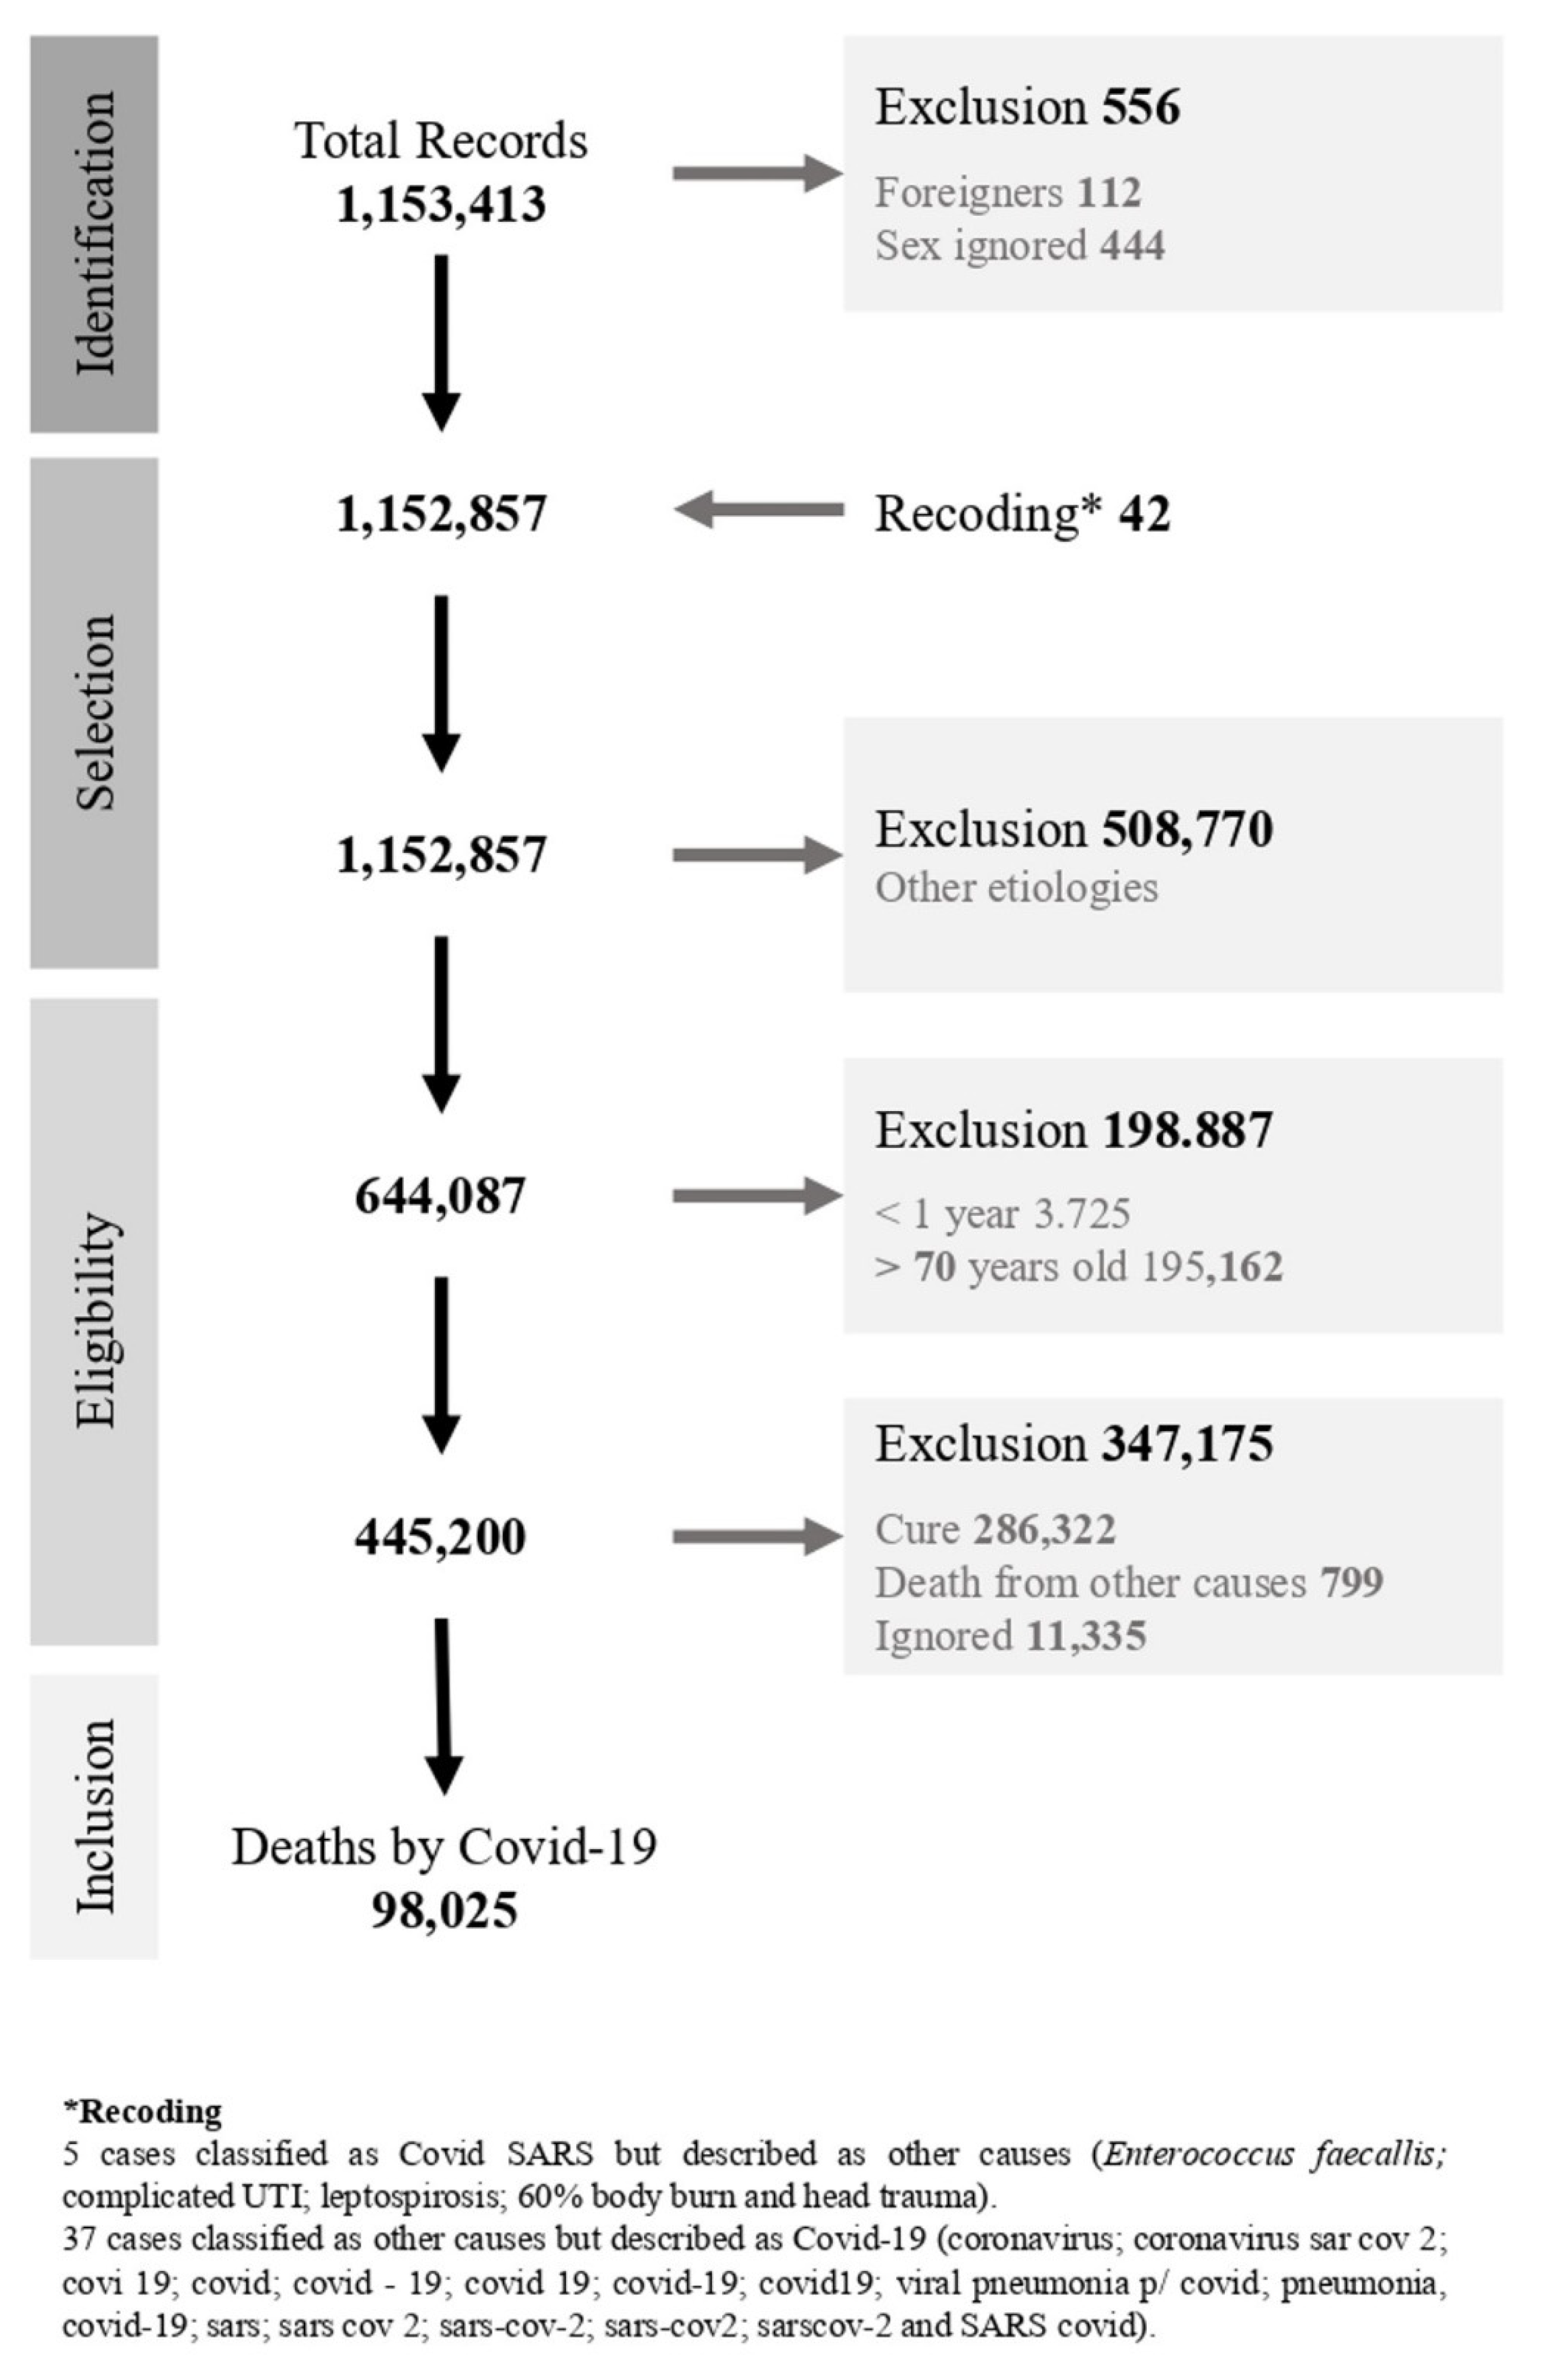
2.1. SIVEP-Gripe
2.2. Estimates of Years of Potential Life Lost
2.2.1. Rate of Years of Potential Life Lost
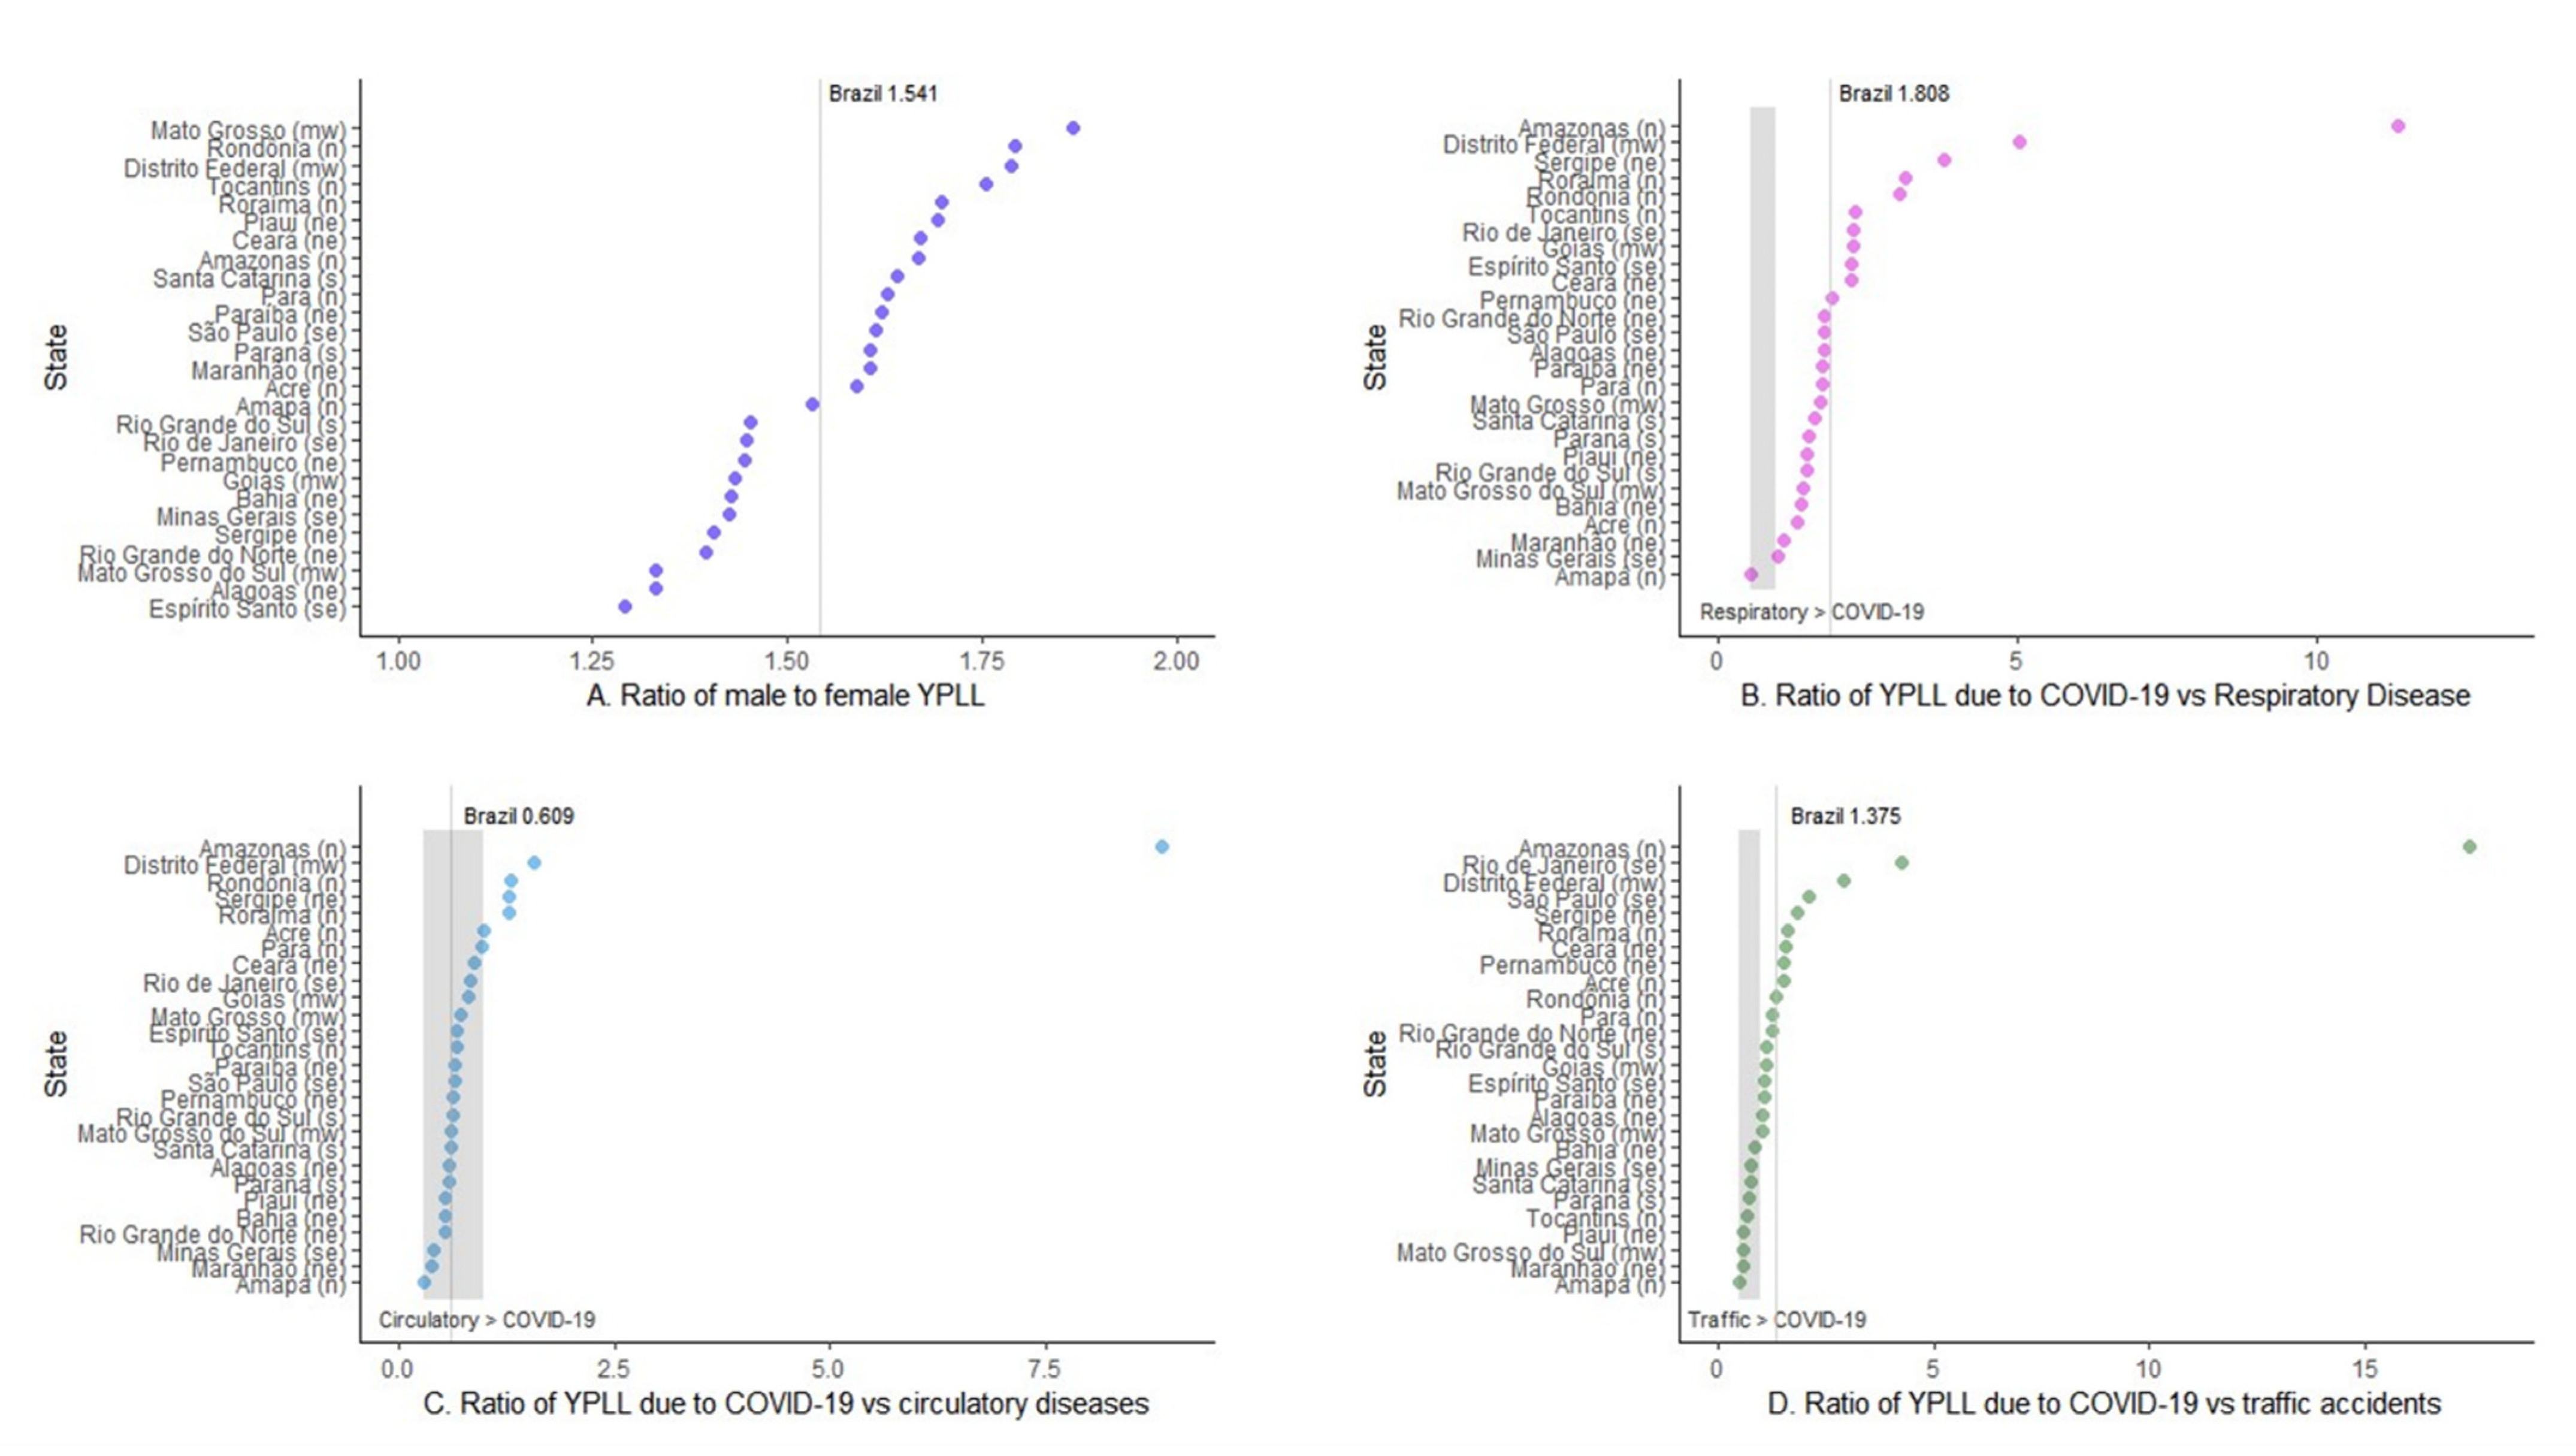
2.2.2. Ratio of Years of Potential Life Lost
2.3. Estimate of Excess Mortality
2.4. Data Analysis
3. Results
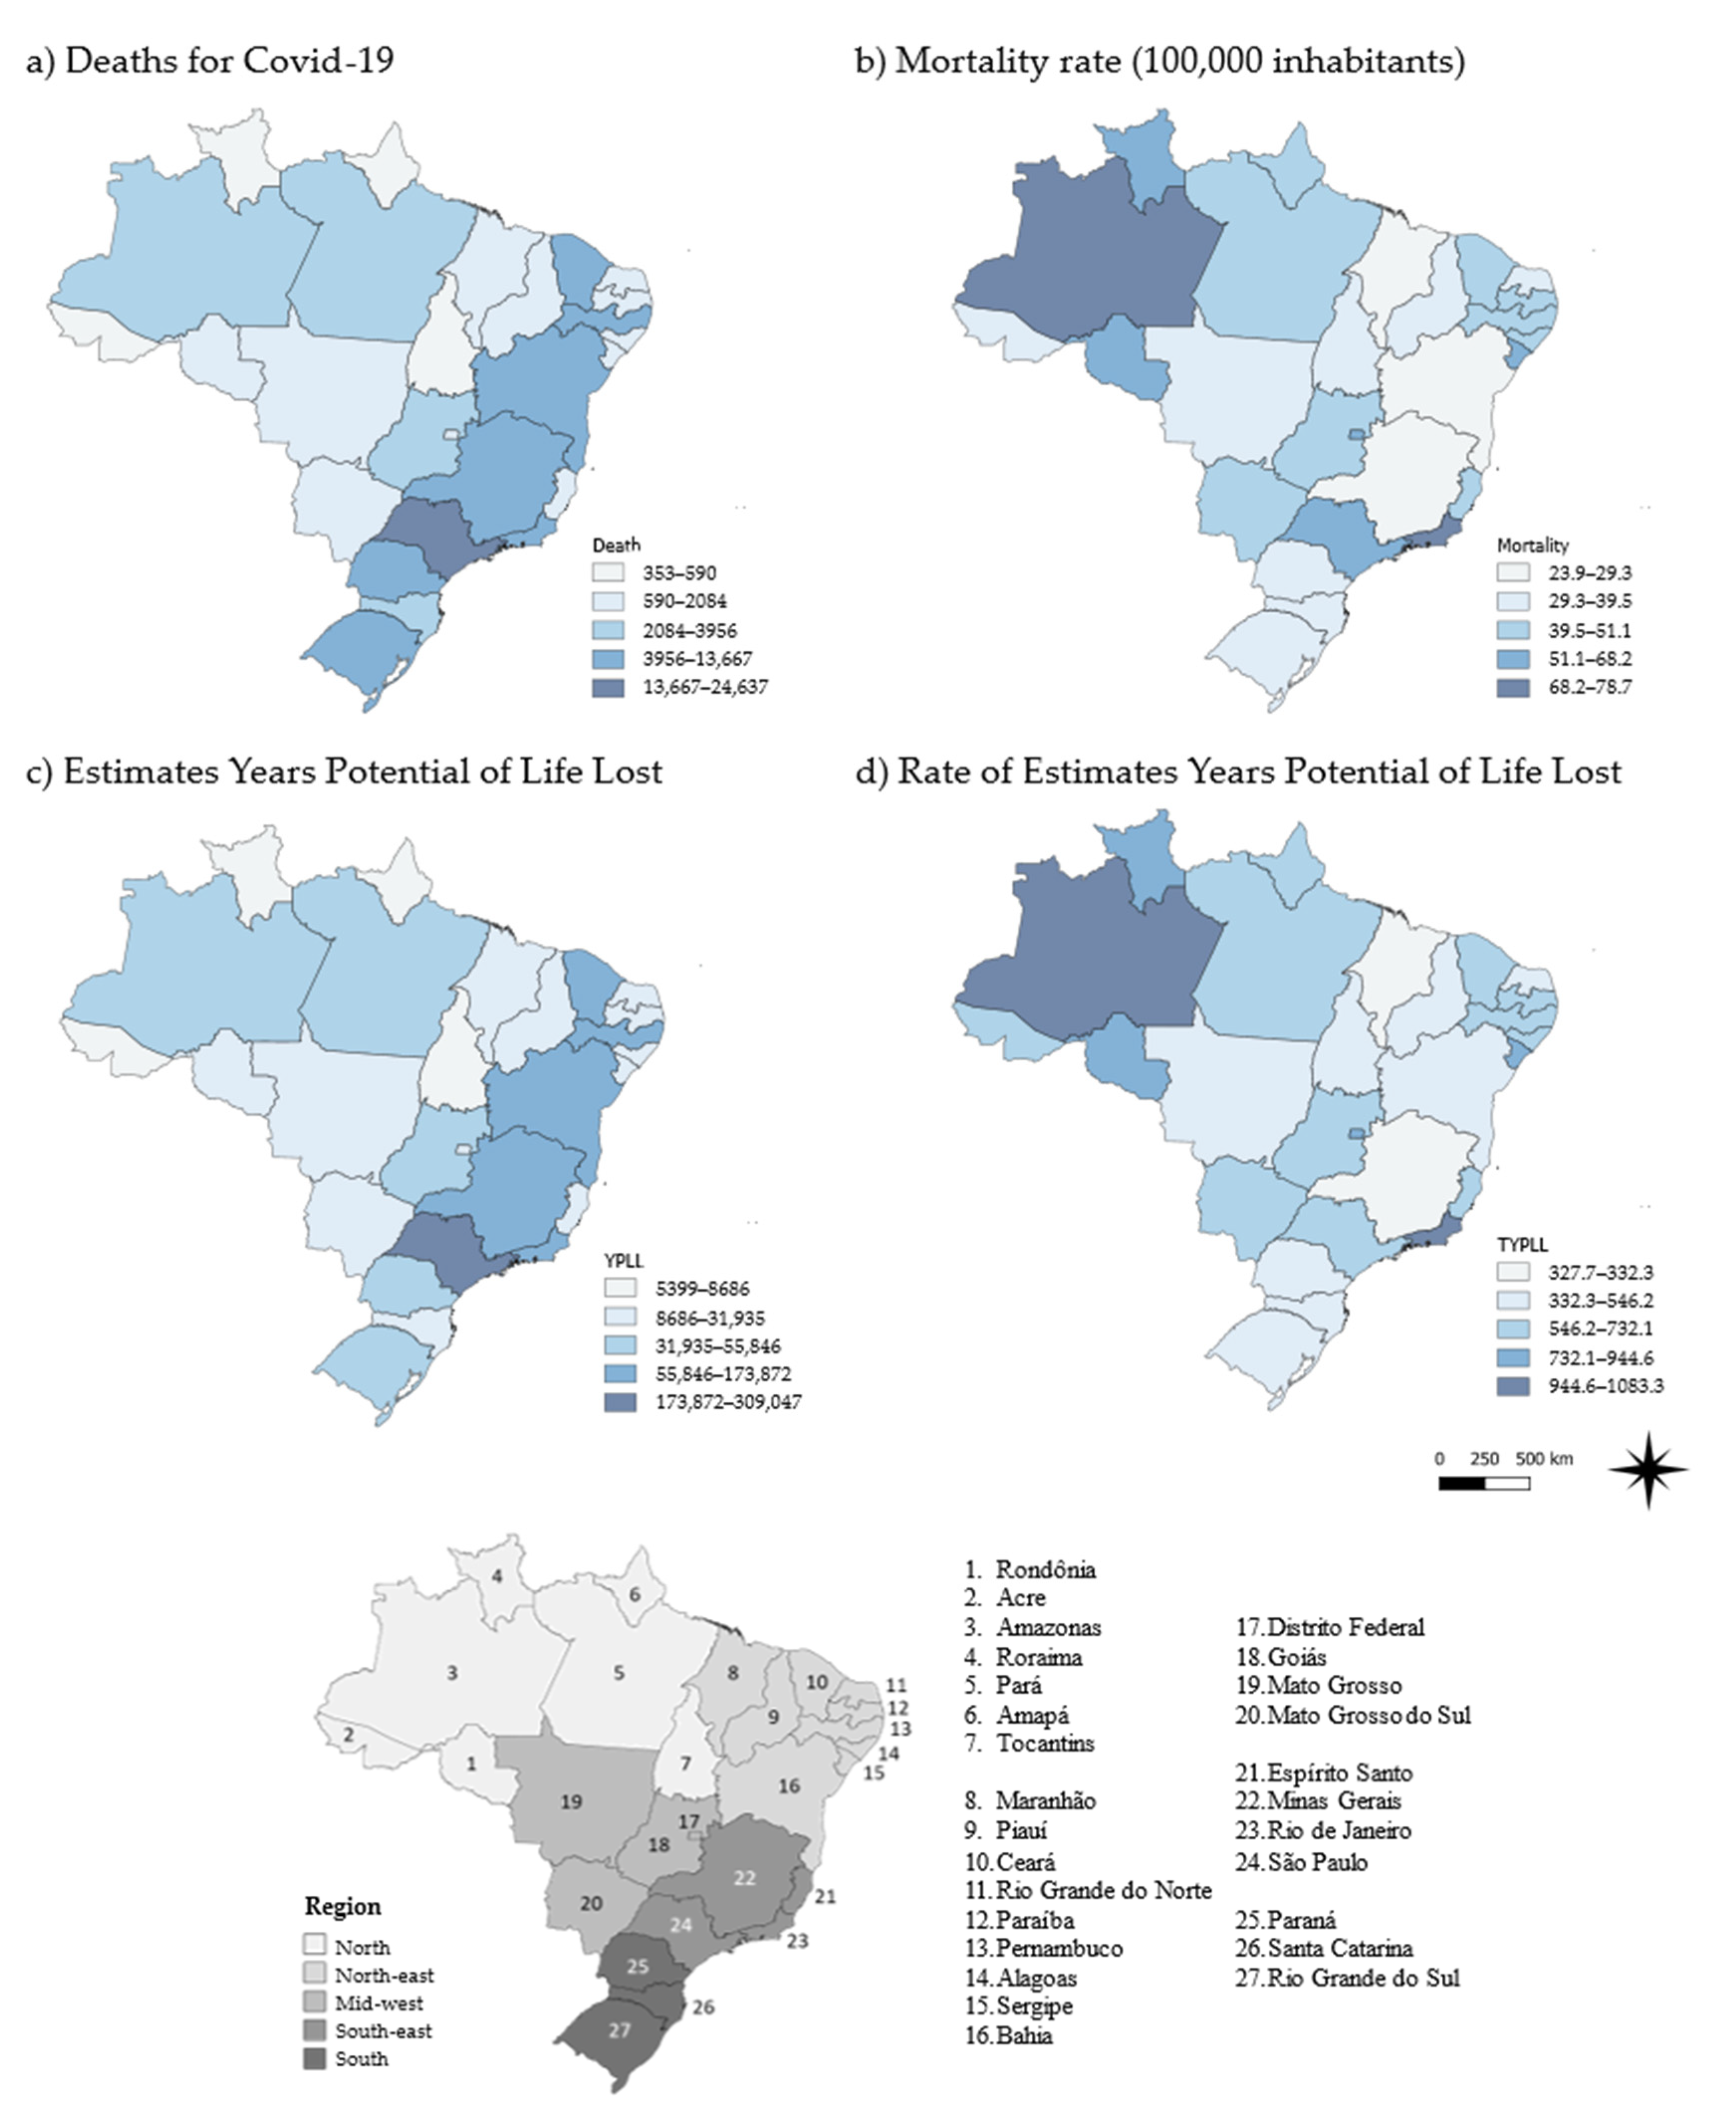
3.1. Mortality Rate
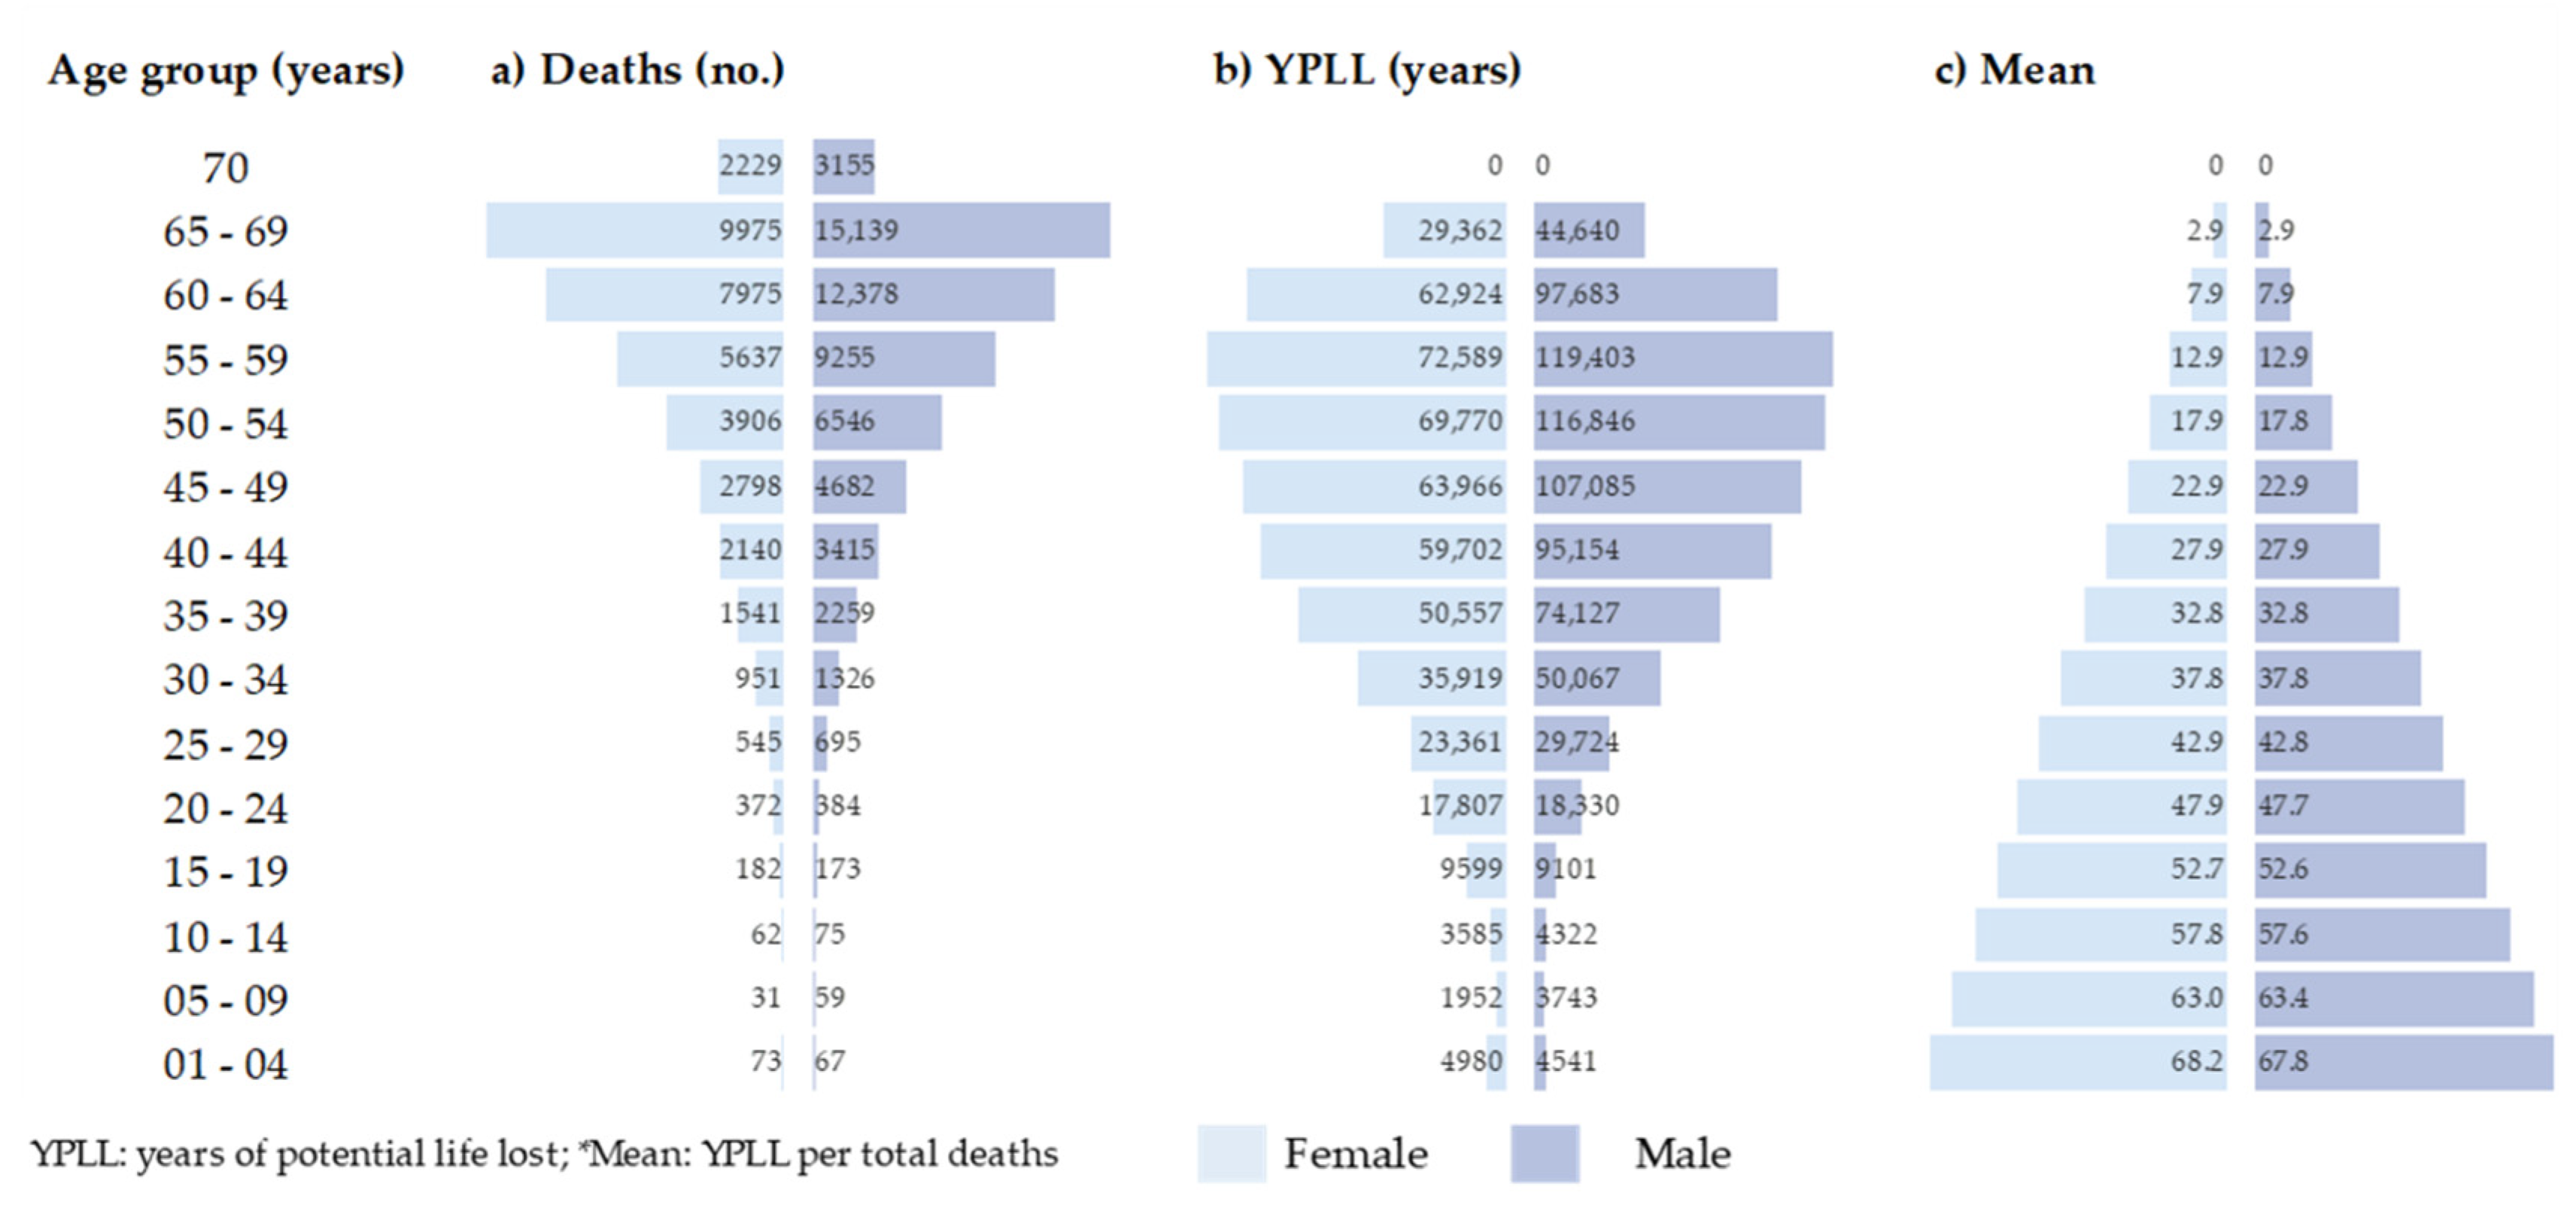
3.2. Years of Potential Life Lost
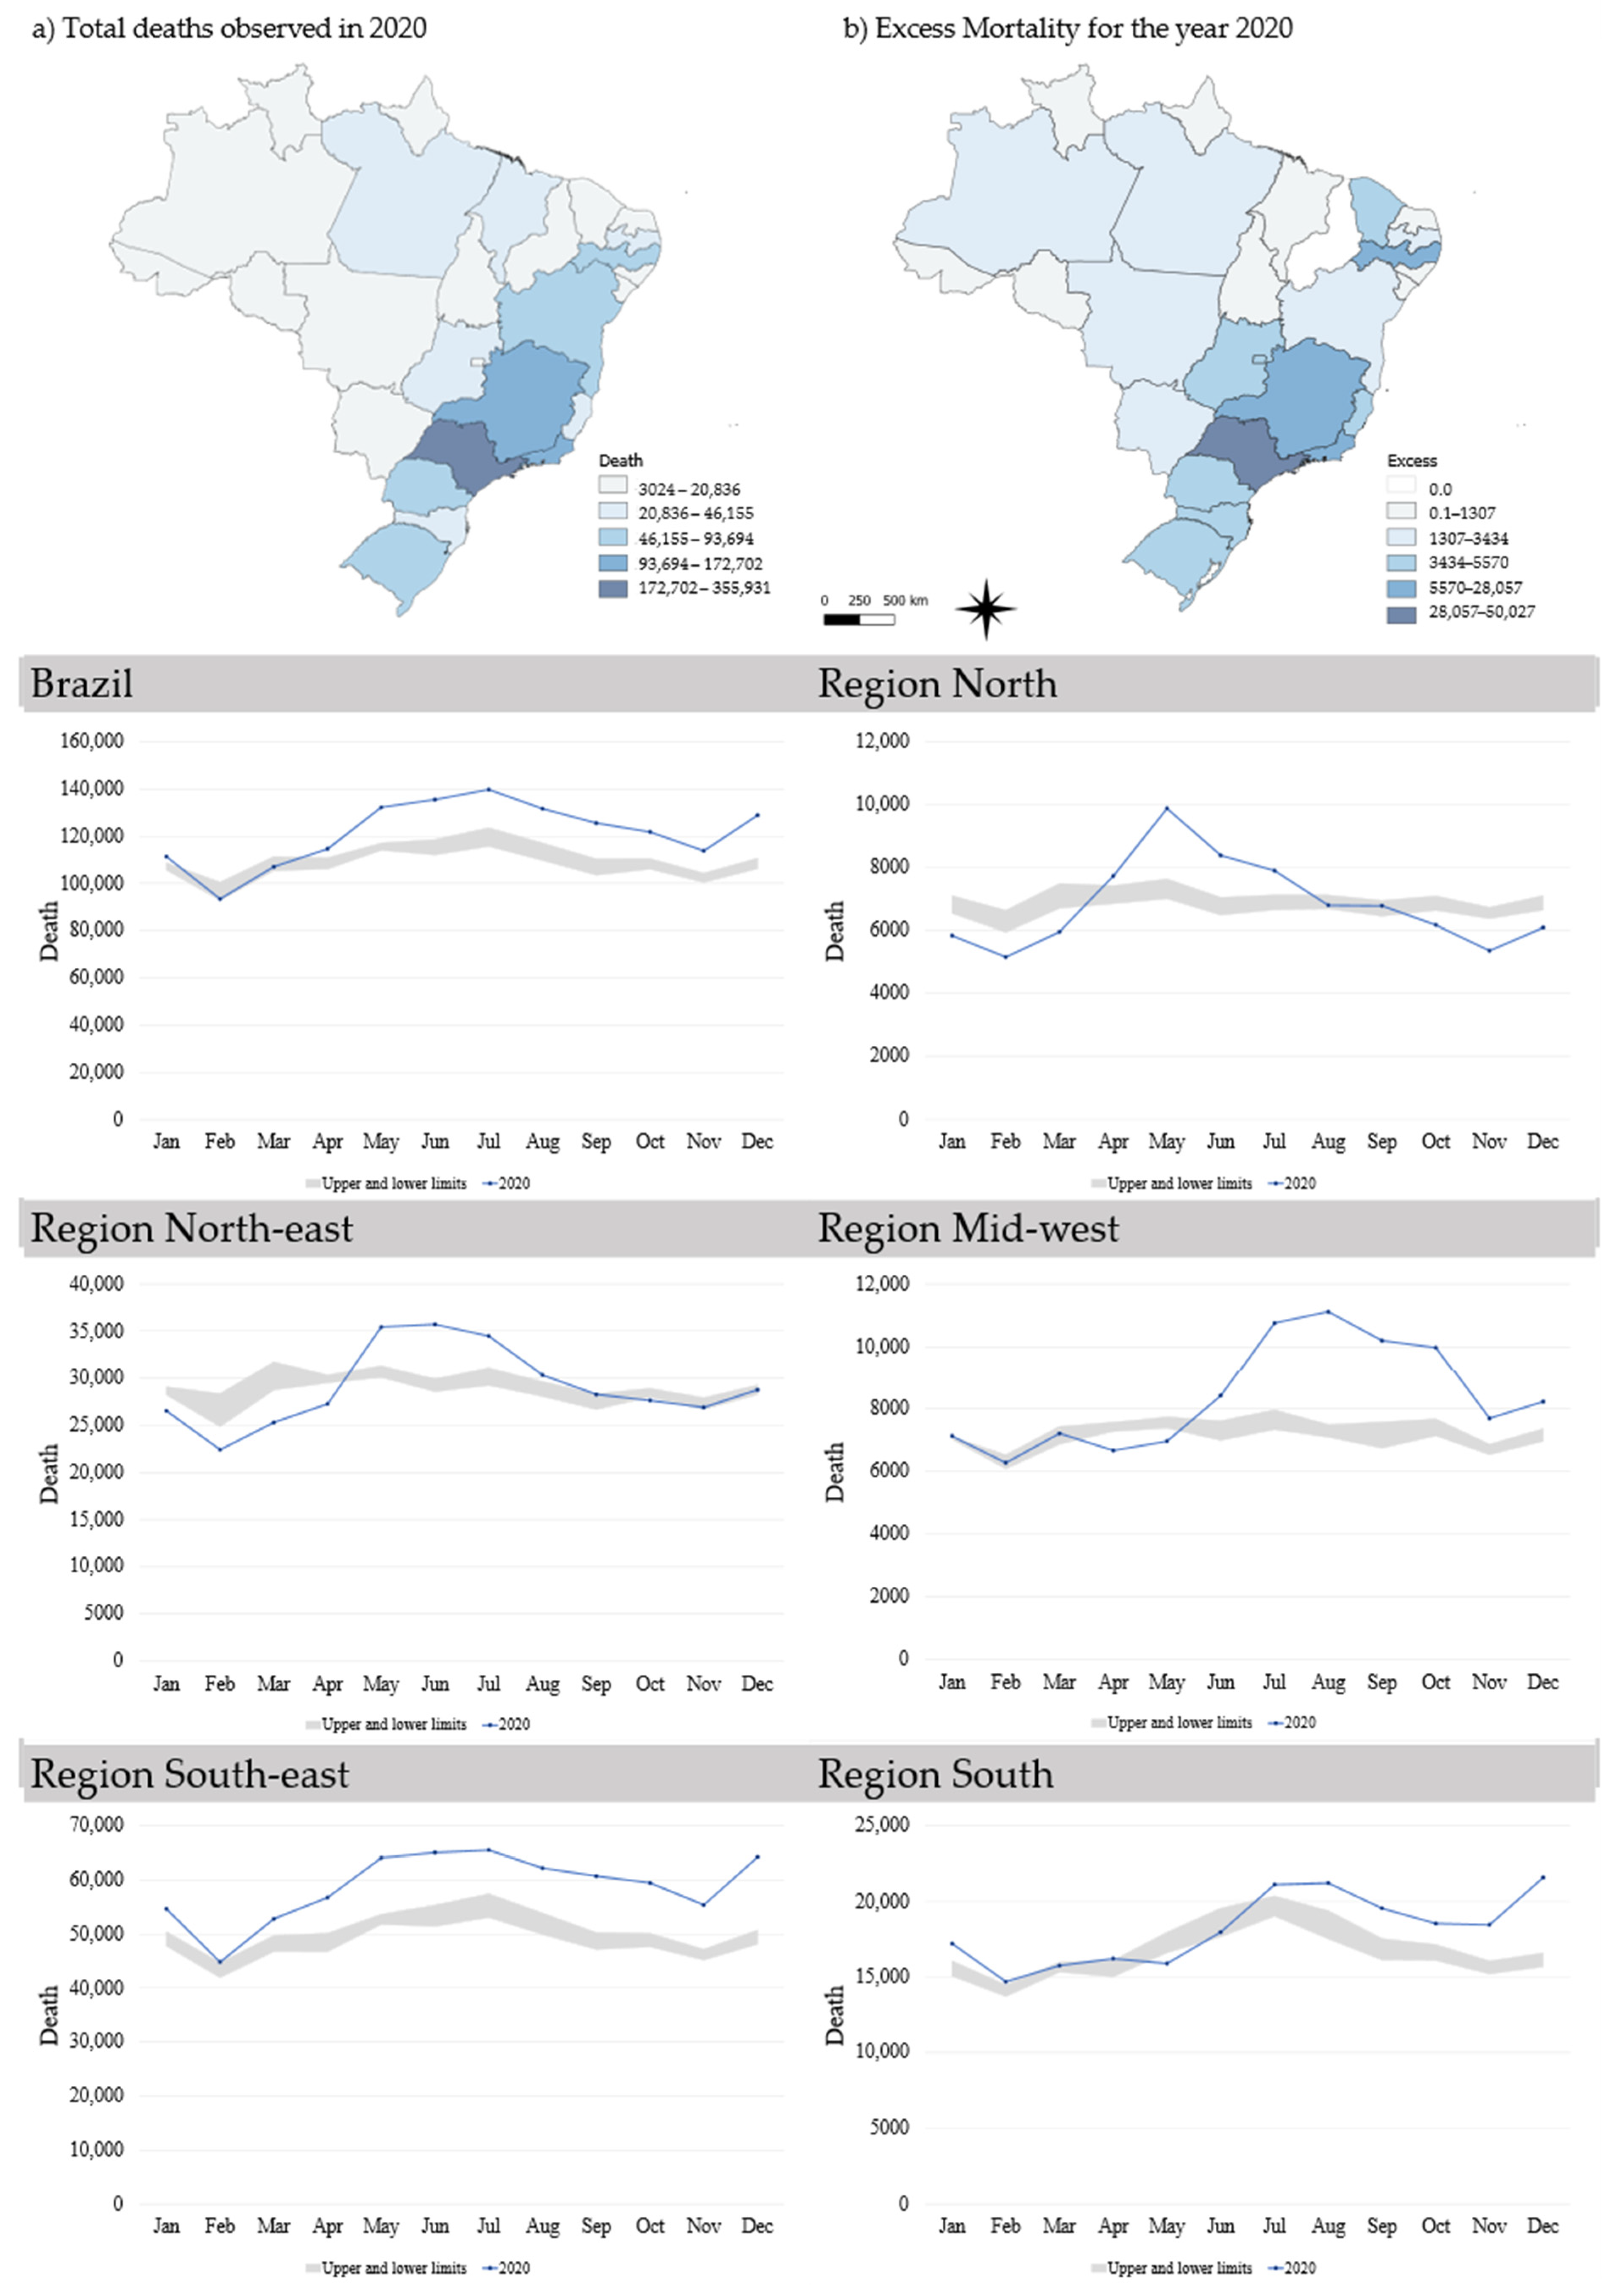
3.3. The Expected and Excess Mortality Rate
4. Discussion
5. Conclusions
Author Contributions
Funding
Institutional Review Board Statement
Informed Consent Statement
Data Availability Statement
Conflicts of Interest
Appendix A


| Region/States of Residence | Population 2020 | Deaths | YPLL | Cumulative Excess Mortality | ||||
|---|---|---|---|---|---|---|---|---|
| No (%) | Mortality Rate | No (%) | Mean | YPLL Rate | Observed | Excess (%) | ||
| Brazil | 211,755,692 | 98,025 (100) | 46.3 | 1,280,839 (100) | 13.1 | 604.9 | 1,455,522 | 122,914 (9.2) |
| North | 18,672,591 | 10,019 (10.2) | 53.7 | 143,106 (11.2) | 14.3 | 766.4 | 82,063 | 4643 (6.0) |
| Acre | 89,4470 | 353 (3.5) | 39.5 | 5399 (3.8) | 15.3 | 603.6 | 4748 | 675 (16.6) |
| Amapá | 86,1773 | 405 (4.0) | 47.0 | 6309 (4.4) | 15.6 | 732.1 | 3273 | 306 (10.3) |
| Amazonas | 4,207,714 | 3302 (33.0) | 78.5 | 45,581 (31.9) | 13.8 | 1083.3 | 19,217 | 2660 (16.1) |
| Pará | 8,690,745 | 3956 (39.5) | 45.5 | 55,846 (39.0) | 14.1 | 642.6 | 35,467 | 1989 (5.9) |
| Rondônia | 1,796,460 | 1025 (10.2) | 57.1 | 15,323 (10.7) | 14.9 | 853.0 | 9221 | 1307 (16.5) |
| Roraima | 631,181 | 388 (3.9) | 61.5 | 5962 (4.2) | 15.4 | 944.6 | 3024 | 423 (16.2) |
| Tocantins | 1,590,248 | 590 (5.9) | 37.1 | 8686 (6.1) | 14.7 | 546.2 | 7113 | 184 (2.7) |
| North-east | 57,374,243 | 22,211 (22.7) | 38.7 | 313,004 (24.4) | 14.1 | 545.5 | 349,239 | 13,933 (4.2) |
| Alagoas | 3,351,543 | 1418 (6.4) | 42.3 | 20,722 (6.6) | 14.6 | 618.3 | 20,836 | 1125 (5.7) |
| Bahia | 14,930,634 | 4373 (19.7) | 29.3 | 60,803 (19.4) | 13.9 | 407.2 | 91,997 | 3434 (3.9) |
| Ceará | 9,187,103 | 4533 (20.4) | 49.3 | 63,450 (20.3) | 14.0 | 690.6 | 5567 | 3819 (218.4) |
| Maranhão | 7,114,598 | 1698 (7.6) | 23.9 | 23,641 (7.6) | 13.9 | 332.3 | 29,173 | 424 (1.5) |
| Paraíba | 4,039,277 | 1764 (7.9) | 43.7 | 25,516 (8.2) | 14.5 | 631.7 | 29,718 | 2274 (8.3) |
| Pernambuco | 9,616,621 | 4790 (21.6) | 49.8 | 65,114 (20.8) | 13.6 | 677.1 | 72,729 | 7318 (11.2) |
| Piauí | 3,281,480 | 1091 (4.9) | 33.2 | 15,805 (5.0) | 14.5 | 481.6 | 15,296 | 0 (0.0) |
| Rio Grande do Norte | 3,534,165 | 1165 (5.2) | 33.0 | 16,849 (5.4) | 14.5 | 476.7 | 19,575 | 521 (2.7) |
| Sergipe | 2,318,822 | 1379 (6.2) | 59.5 | 21,104 (6.7) | 15.3 | 910.1 | 14,245 | 1170 (9.0) |
| Mid-west | 16,504,303 | 8368 (8.5) | 50.7 | 111,815 (8.7) | 13.4 | 677.5 | 100,425 | 13,935 (16.1) |
| Distrito Federal | 3,055,149 | 2084 (24.9) | 68.2 | 27,194 (24.3 | 13.0 | 890.1 | 18,353 | 5570 (43.6) |
| Goiás | 7,113,540 | 3635 (43.4) | 51.1 | 48,739 (43.6) | 13.4 | 685.2 | 43,154 | 4256 (10.9) |
| Mato Grosso | 3,526,220 | 1273 (15.2) | 36.1 | 18,853 (16.9) | 14.8 | 534.7 | 19,999 | 2773 (16.1) |
| Mato Grosso do Sul | 2,809,394 | 1376 (16.4) | 49.0 | 17,029 (15.2) | 12.4 | 606.1 | 18,919 | 2303 (13.9) |
| South-east | 89,012,240 | 46,003 (46.9) | 51.7 | 577,128 (45.1) | 12.5 | 648.4 | 705,485 | 91,673 (14.9) |
| Espírito Santo | 4,064,052 | 1848 (4.0) | 45.5 | 24,432 (4.2) | 13.2 | 601.2 | 29,286 | 4865 (19.9) |
| Minas Gerais | 21,292,666 | 5851 (12.7) | 27.5 | 69,777 (12.1) | 11.9 | 327.7 | 147,566 | 9666 (7.0) |
| Rio de Janeiro | 17,366,189 | 13,667 (29.7) | 78.7 | 173,872 (30.1) | 12.7 | 1.001.2 | 172,702 | 28,057 (19.4) |
| São Paulo | 46,289,333 | 24,637 (53.6) | 53.2 | 309,047 (53.5) | 12.5 | 667.6 | 355,931 | 50,027 (16.4) |
| South | 30,192,315 | 11,424 (11.7) | 37.8 | 135,786 (10.6) | 11.9 | 449.7 | 21,831 | 14,761 (208.8) |
| Paraná | 11,516,840 | 4270 (37.4) | 37.1 | 52,745 (38.8) | 12.4 | 458.0 | 78,461 | 4574 (6.2) |
| Rio Grande do Sul | 11,422,973 | 4408 (38.6) | 38.6 | 51,106 (37.6) | 11.6 | 447.4 | 93,694 | 5260 (5.9) |
| Santa Catarina | 7,252,502 | 2746 (24.0) | 37.9 | 31,935 (23.5) | 11.6 | 440.3 | 46,155 | 4920 (11.9) |
| Characteristic | Sex, No (%) | ||||||||
|---|---|---|---|---|---|---|---|---|---|
| Female | YPLL | Mean | Male | YPLL | Mean | Total | YPLL | Mean | |
| 38,417 (39.2) | 506073 (39.5) | 13.2 | 59608 (60.8) | 774,766 (60.5) | 13.0 | 98,025 (100) | 1,280,839 (100) | 13.1 | |
| Pregnant | |||||||||
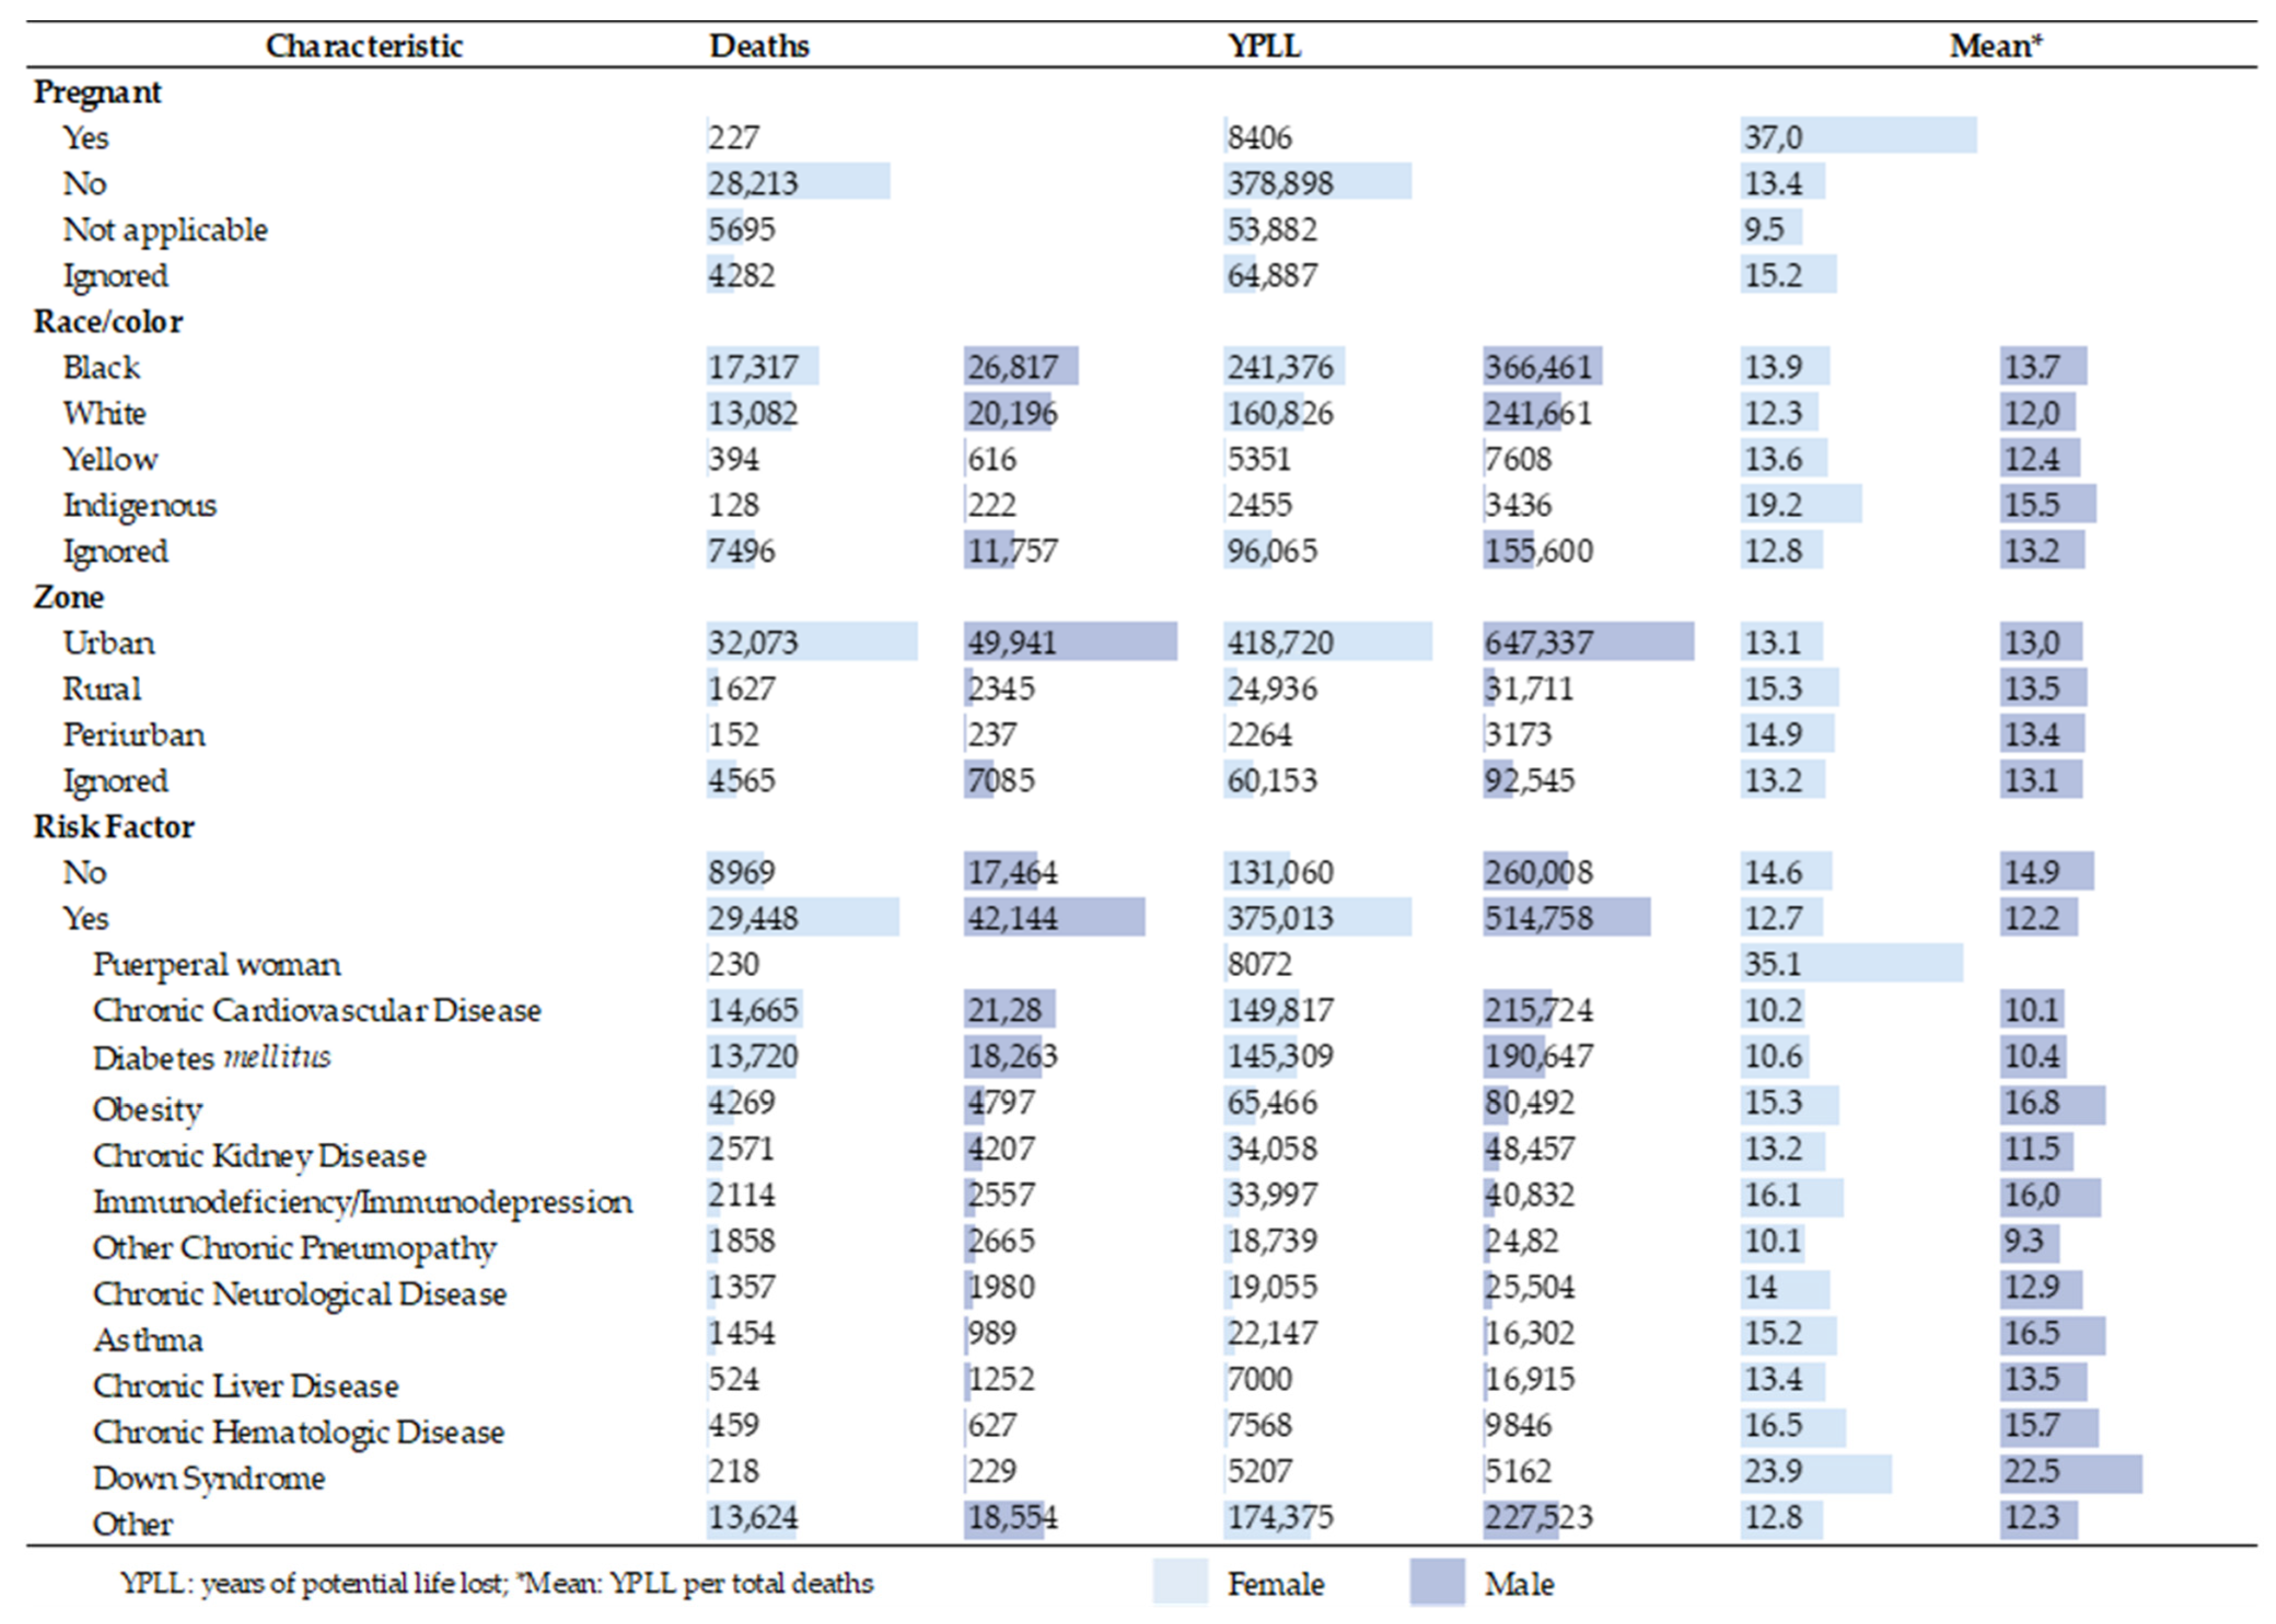
| Yes | 227 (0.6) | 8406 (1.7) | 37.0 | 227 (0.6) | 8406 (1.7) | 37.0 | |||
| No | 28,213 (73.4) | 378,898 (74.9) | 13.4 | 28,213 (73.4) | 378,898 (74.9) | 13.4 | |||
| Not applicable | 5695 (14.8) | 53,882 (10.6) | 9.5 | 5695 (14.8) | 53,882 (10.6) | 9.5 | |||
| Ignored | 4282 (11.1) | 64,887 (12.8) | 15.2 | 4282 (11.1) | 64,887 (12.8) | 15.2 | |||
| Race/color | |||||||||
| Black | 17,317 (45.1) | 241,376 (47.7) | 13.9 | 26,817 (45.0) | 366,461 (47.3) | 13.7 | 44,134 (45.0) | 607,837 (47.5) | 13.8 |
| White | 13,082 (34.1) | 160,826 (31.8) | 12.3 | 20,196 (33.9) | 241,661 (31.2) | 12.0 | 33,278 (33.9) | 402,487 (31.4) | 12.1 |
| Yellow | 394 (1.0) | 5351 (1.1) | 13.6 | 616 (1.0) | 7608 (1.0) | 12.4 | 1010 (1.0) | 12,959 (1.0) | 12.8 |
| Indigenous | 128 (0.3) | 2455 (0.5) | 19.2 | 222 (0.4) | 3436 (0.4) | 15.5 | 350 (0.4) | 5891 (0.5) | 16.8 |
| Ignored | 7496 (19.5) | 96,065 (19.0) | 12.8 | 11,757 (19.7) | 155,600 (20.1) | 13.2 | 19,253 (19.6) | 251,665 (19.6) | 13.1 |
| Zone | |||||||||
| Urban | 32,073 (83.5) | 418,720 (82.7) | 13.1 | 49,941 (83.8) | 647,337 (83.6) | 13.0 | 82,014 (83.7) | 1,066,057 (83.2) | 13.0 |
| Rural | 1627 (4.2) | 24,936 (4.9) | 15.3 | 2345 (3.9) | 31711 (4.1) | 13.5 | 3972 (4.1) | 56,647 (4.4) | 14.3 |
| Periurban | 152 (0.4) | 2264 (0.4) | 14.9 | 237 (0.4) | 3173 (0.4) | 13.4 | 389 (0.4) | 5437 (0.4) | 14.0 |
| Ignored | 4565 (11.9) | 60,153 (11.9) | 13.2 | 7085 (11.9) | 92,545 (11.9) | 13.1 | 11,650 (11.9) | 152,698 (11.9) | 13.1 |
| Risk Factor | |||||||||
| No | 8969 (23.3) | 131,060 (25.9) | 14.6 | 17,464 (29.3) | 260,008 (33.6) | 14.9 | 26,433 (27.0) | 391,068 (30.5) | 14.8 |
| Yes | 29,448 (76.7) | 375,013 (74.1) | 12.7 | 42,144 (70.7) | 514,758 (66.4) | 12.2 | 71,592 (73.0) | 889,771 (69.5) | 12.4 |
| Puerperal woman | 230 (0.6) | 8072 (2.2) | 35.1 | 230 (0.2) | 8072 (0.9) | 35.1 | |||
| Chronic Cardiovascular Disease | 14,665 (38.2) | 149,817 (39.9) | 10.2 | 21,280 (35.7) | 215,724 (41.9) | 10.1 | 35,945 (36.7) | 365,541 (41.1) | 10.2 |
| Diabetes mellitus | 13,720 (35.7) | 145,309 (38.7) | 10.6 | 18,263 (30.6) | 190,647 (37.0) | 10.4 | 31,983 (32.6) | 335,956 (37.8) | 10.5 |
| Obesity | 4269 (11.1) | 65,466 (17.5) | 15.3 | 4797 (8.0) | 80,492 (15.6) | 16.8 | 9066 (9.2) | 145,958 (16.4) | 16.1 |
| Chronic Kidney Disease | 2571 (6.7) | 34,058 (9.1) | 13.2 | 4207 (7.1) | 48,457 (9.4) | 11.5 | 6778 (6.9) | 82,515 (9.3) | 12.2 |
| Immunodeficiency/Immunodepression | 2114 (5.5) | 33,997 (9.1) | 16.1 | 2557 (4.3) | 40,832 (7.9) | 16.0 | 4671 (4.8) | 74,829 (8.4) | 16.0 |
| Other Chronic Pneumopathy | 1858 (4.8) | 18,739 (5.0) | 10.1 | 2665 (4.5) | 24,820 (4.8) | 9.3 | 4523 (4.6) | 43,559 (4.9) | 9.6 |
| Chronic Neurological Disease | 1357 (3.5) | 19,055 (5.1) | 14.0 | 1980 (3.3) | 25,504 (5.0) | 12.9 | 3337 (3.4) | 44,559 (5.0) | 13.4 |
| Asthma | 1454 (3.8) | 22,147 (5.9) | 15.2 | 989 (1.7) | 16,302 (3.2) | 16.5 | 2443 (2.5) | 38,449 (4.3) | 15.7 |
| Chronic Liver Disease | 524 (1.4) | 7000 (1.9) | 13.4 | 1252 (2.1) | 16,915 (3.3) | 13.5 | 1776 (1.8) | 23,915 (2.7) | 13.5 |
| Chronic Hematologic Disease | 459 (1.2) | 7568 (2.0) | 16.5 | 627 (1.1) | 9846 (1.9) | 15.7 | 1086 (1.1) | 17,414 (2.0) | 16.0 |
| Down Syndrome | 218 (0.6) | 5207 (1.4) | 23.9 | 229 (0.4) | 5162 (1.0) | 22.5 | 447 (0.5) | 10,369 (1.2) | 23.2 |
| Other | 13,624 (35.5) | 174,375 (46.5) | 12.8 | 18,554 (31.1) | 227,523 (44.2) | 12.3 | 32,178 (32.8) | 401,898 (45.2) | 12.5 |
| Age Group (Years) | Sex (%) | ||||||||
|---|---|---|---|---|---|---|---|---|---|
| Female | YPLL | Mean | Male | YPLL | Mean | Total | YPLL | Mean | |
| 38,417 (392) | 506,073 (39.5) | 13.2 | 59,608 (60.8) | 774,766 (60.5) | 13.0 | 98,025 (100) | 1,280,839 (100) | 13.1 | |
| 1–4 | 73 (0.2) | 4980 (1.0) | 68.2 | 67 (0.1) | 4541 (0.6) | 67.8 | 140 (0.1) | 9521 (0.7) | 68.0 |
| 5–9 | 31 (0.1) | 1952 (0.4) | 63.0 | 59 (0.1) | 3743 (0.5) | 63.4 | 90 (0.1) | 5695 (0.4) | 63.3 |
| 10–14 | 62 (0.2) | 3585 (0.7) | 57.8 | 75 (0.1) | 4322 (0.6) | 57.6 | 137 (0.1) | 7907 (0.6) | 57.7 |
| 15–19 | 182 (0.5) | 9599 (1.9) | 52.7 | 173 (0.3) | 9101 (1.2) | 52.6 | 355 (0.4) | 18,700 (1.5) | 52.7 |
| 20–24 | 372 (1.0) | 17,807 (3.5) | 47.9 | 384 (0.6) | 18,330 (2.4) | 47.7 | 756 (0.8) | 36,137 (2.8) | 47.8 |
| 25–29 | 545 (1.4) | 23,361 (4.6) | 42.9 | 695 (1.2) | 29,724 (3.8) | 42.8 | 1240 (1.3) | 53,085 (4.1) | 42.8 |
| 30–34 | 951 (2.5) | 35,919 (7.1) | 37.8 | 1326 (2.2) | 50,067 (6.5) | 37.8 | 2277 (2.3) | 85,986 (6.7) | 37.8 |
| 35–39 | 1541 (4.0) | 50,557 (10.0) | 32.8 | 2259 (3.8) | 74,127 (9.6) | 32.8 | 3800 (3.9) | 124,684 (9.7) | 32.8 |
| 40–44 | 2140 (5.6) | 59,702 (11.8) | 27.9 | 3415 (5.7) | 95,154 (12.3) | 27.9 | 5555 (5.7) | 154,856 (12.1) | 27.9 |
| 45–49 | 2798 (7.3) | 63,966 (12.6) | 22.9 | 4682 (7.9) | 107,085 (13.8) | 22.9 | 7480 (7.6) | 171,051 (13.4) | 22.9 |
| 50–54 | 3906 (10.2) | 69,770 (13.8) | 17.9 | 6546 (11.0) | 116,846 (15.1) | 17.8 | 10,452 (10.7) | 186,616 (14.6) | 17.9 |
| 55–59 | 5637 (14.7) | 72,589 (14.3) | 12.9 | 9255 (15.5) | 119,403 (15.4) | 12.9 | 14,892 (15.2) | 191,992 (15.0) | 12.9 |
| 60–64 | 7975 (20.8) | 62,924 (12.4) | 7.9 | 12,378 (20.8) | 97,683 (12.6) | 7.9 | 20,353 (20.8) | 160,607 (12.5) | 7.9 |
| 65–69 | 9975 (26.0) | 29,362 (5.8) | 2.9 | 15,139 (25.4) | 44,640 (5.8) | 2.9 | 25,114 (25.6) | 74,002 (5.8) | 2.9 |
| ≥70 | 2229 (5.8) | 0 (0.0) | 0.0 | 3155 (5.3) | 0 (0.0) | 0.0 | 5384 (5.5) | 0 (0.0) | 0.0 |
| Risk Factor | Female | Male | |||
|---|---|---|---|---|---|
| no. | % | no. | % | ||
| Puerperal woman | Yes | 230 | 0.6 | ||
| No | 17,067 | 44.4 | |||
| Missing | 21,120 | 55.0 | |||
| Chronic Cardiovascular Disease | Yes | 14,665 | 38.2 | 21,280 | 35.7 |
| No | 8371 | 21.8 | 12,036 | 20.2 | |
| Missing | 15,381 | 40.0 | 26,292 | 44.1 | |
| Diabetes mellitus | Yes | 13,720 | 35.7 | 18,263 | 30.6 |
| No | 8926 | 23.2 | 13,954 | 23.4 | |
| Missing | 15,771 | 41.1 | 27,391 | 46.0 | |
| Obesity | Yes | 4269 | 11.1 | 4797 | 8.0 |
| No | 13,830 | 36.0 | 21,025 | 35.3 | |
| Missing | 20,318 | 52.9 | 33,786 | 56.7 | |
| Chronic Kidney Disease | Yes | 2571 | 6.7 | 4207 | 7.1 |
| No | 15,419 | 40.1 | 22,149 | 37.2 | |
| Missing | 20,427 | 53.2 | 33,252 | 55.8 | |
| Immunodeficiency/Immunodepression | Yes | 2114 | 5.5 | 2557 | 4.3 |
| No | 15,593 | 40.6 | 23,128 | 38.8 | |
| Missing | 20,710 | 53.9 | 33,923 | 56.9 | |
| Other Chronic Pneumopathy | Yes | 1858 | 4.8 | 26,65 | 4.5 |
| No | 15,890 | 41.4 | 23,214 | 38.9 | |
| Missing | 20,669 | 53.8 | 33,729 | 56.6 | |
| Chronic Neurological Disease | Yes | 1357 | 3.5 | 1980 | 3.3 |
| No | 16,174 | 42.1 | 23,605 | 39.6 | |
| Missing | 20,886 | 54.4 | 34,023 | 57.1 | |
| Asthma | Yes | 1454 | 3.8 | 989 | 1.7 |
| No | 16,094 | 41.9 | 24,253 | 40.7 | |
| Missing | 20,869 | 54.3 | 34366 | 57.7 | |
| Chronic Liver Disease | Yes | 524 | 1.4 | 1252 | 2.1 |
| No | 16,716 | 43.5 | 24,059 | 40.4 | |
| Missing | 21,177 | 55.1 | 34,297 | 57.5 | |
| Chronic Hematologic Disease | Yes | 459 | 1.2 | 627 | 1.1 |
| No | 16,807 | 43.7 | 24,565 | 41.2 | |
| Missing | 21,151 | 55.1 | 34,416 | 57.7 | |
| Down Syndrome | Yes | 218 | 0.6 | 229 | 0.4 |
| No | 17,070 | 44.4 | 24,904 | 41.8 | |
| Missing | 21,129 | 55.0 | 34475 | 57.8 | |
| Other | Yes | 13,624 | 35.5 | 18,554 | 31.1 |
| No | 8308 | 21.6 | 12,446 | 20.9 | |
| Missing | 16,485 | 42.9 | 28,608 | 48.0 | |
References
- Khan, I.; Haleem, A.; Javaid, M. Analysing COVID-19 pandemic through cases, deaths, and recoveries. J. Oral Biol. Craniofac. Res. 2020, 10, 450–469. [Google Scholar] [CrossRef] [PubMed]
- Xu, W.; Wu, J.; Cao, L. COVID-19 pandemic in China: Context, experience and lessons. Health Policy Technol. 2020. [Google Scholar] [CrossRef]
- Acter, T.; Uddin, N.; Das, J.; Akhter, A.; Choudhury, T.R.; Kim, S. Evolution of severe acute respiratory syndrome coronavirus 2 (SARS-CoV-2) as coronavirus disease 2019 (COVID-19) pandemic: A global health emergency. Sci. Total Environ. 2020, 730, 138996. [Google Scholar] [CrossRef] [PubMed]
- Marois, G.; Muttarak, R.; Scherbov, S. Assessing the potential impact of COVID-19 on life expectancy. PLoS ONE 2020, 15, e0238678. [Google Scholar] [CrossRef]
- Mofijur, M.; Fattah, I.M.R.; Alam, M.A.; Islam, A.B.M.S.; Ong, H.C.; Rahman, S.M.A.; Najafi, G.; Ahmed, S.F.; Uddin, M.A.; Mahlia, T.M.I. Impact of COVID-19 on the social, economic, environmental and energy domains: Lessons learnt from a global pandemic. Sustain. Prod. Consum. 2021, 26, 343–359. [Google Scholar] [CrossRef] [PubMed]
- Barboza, G.E.; Schiamberg, L.B.; Pachl, L. A spatiotemporal analysis of the impact of COVID-19 on child abuse and neglect in the city of Los Angeles, California. Child Abuse Negl. 2020. [Google Scholar] [CrossRef]
- Croda, J.; de Oliveira, W.K.; Frutuoso, R.L.; Mandetta, L.H.; Baia-da-Silva, D.C.; Brito-Sousa, J.D.; Monteiro, W.M.; Lacerda, M.V.G. COVID-19 in Brazil: Advantages of a socialized unified health system and preparation to contain cases. Rev. Soc. Bras. Med. Trop. 2020, 53, e20200167. [Google Scholar] [CrossRef]
- Bastos, L.S.; Niquini, R.P.; Lana, R.M.; Villela, D.A.M.; Cruz, O.G.; Coelho, F.C.; Codeço, C.T.; Gomes, M.F.C. COVID-19 e hospitalizações por SRAG no Brasil: Uma comparação até a 12ª semana epidemiológica de 2020. Cad. Saude Publica 2020, 36, e00070120. [Google Scholar] [CrossRef] [PubMed] [Green Version]
- Johns Hopkins University & Medicine. COVID-19 Dashboard by the Center for Systems Science and Engineering (CSSE) at Johns Hopkins University (JHU). Available online: https://coronavirus.jhu.edu/map.html (accessed on 4 November 2020).
- Ministério da Saúde. Coronavírus COVID-19: Definição de Caso e Notificação. Available online: https://coronavirus.saude.gov.br/definicao-de-caso-e-notificacao (accessed on 4 November 2020).
- Rumisha, S.F.; George, J.; Bwana, V.M.; Mboera, L.E.G. Years of potential life lost and productivity costs due to premature mortality from six priority diseases in Tanzania, 2006–2015. PLoS ONE 2020, 15, e0234300. [Google Scholar] [CrossRef]
- Romeder, J.-M.; McWhinnie, J.R. Potential Years of Life Lost Between Ages 1 and 70: An Indicator of Premature Mortality for Health Planning. Int. J. Epidemiol. 1977, 6, 143–151. [Google Scholar] [CrossRef]
- França, E.B.; Ishitani, L.H.; Teixeira, R.A.; de Abreu, D.M.X.; Corrêa, P.R.L.; Marinho, F.; Vasconcelos, A.M.N. Óbitos por COVID-19 no Brasil: Quantos e quais estamos identificando? Rev. Bras. Epidemiol. 2020, 23, e200053. [Google Scholar] [CrossRef]
- Nogueira, P.J.; Nobre, M.D.A.; Nicola, P.J.; Furtado, C.; Vaz Carneiro, A. Excess Mortality Estimation During the COVID-19 Pandemic: Preliminary Data from Portugal. Acta Med. Port. 2020, 33, 376–383. [Google Scholar] [CrossRef]
- Datasus. SRAG 2020—Banco de Dados de Síndrome Respiratória Aguda Grave—Incluindo dados da COVID-19: Vigilância de Síndrome Respiratória Aguda Grave (SRAG). Available online: https://opendatasus.saude.gov.br/dataset/bd-srag-2020 (accessed on 29 September 2020).
- Instituto Brasileiro de Geografia e Estatística. Estimativas Populacionais para os Municípios Brasileiros em 01.07.2020. Available online: https://www.ibge.gov.br/estatisticas/sociais/populacao/9103-estimativas-de-populacao.html?=&t=downloads (accessed on 14 October 2020).
- Datasus. Sistema de Informações Sobre Mortalidade (SIM). Available online: http://www2.datasus.gov.br/DATASUS/index.php?area=0205&id=6937 (accessed on 6 April 2021).
- World Health Organization. International Statistical Classification of Diseases and Related Health Problems. Available online: https://icd.who.int/browse10/2019/en (accessed on 6 April 2021).
- Vital Strategies; World Health Organization. Revealing the Toll of COVID-19: A Technical Package for Rapid Mortality Surveillance and Epidemic Response. Available online: https://preventepidemics.org/wp-content/uploads/2020/05/RMS_Report.pdf (accessed on 6 April 2020).
- ARPEN. Portal Oficial do Registro Civil: Óbitos—Brasil—2020. Available online: https://transparencia.registrocivil.org.br/registros (accessed on 6 April 2021).
- Instituto Brasileiro de Geografia e Estatística. Sistema de Estatísticas Vitais | IBGE. Available online: https://www.ibge.gov.br/estatisticas/sociais/populacao/26176-estimativa-do-sub-registro.html?edicao=29630&t=resultados (accessed on 12 January 2021).
- Andrade, S.S.C.d.A.; de Mello-Jorge, M.H.P. Mortality and potential years of life lost by road traffic injuries in Brazil, 2013. Rev. Saude Publica 2016, 50, 59. [Google Scholar] [CrossRef] [PubMed] [Green Version]
- Bochner, R.; Freire, M.M. Análise dos óbitos decorrentes de intoxicação ocorridos no Brasil de 2010 a 2015 com base no Sistema de Informação sobre Mortalidade (SIM). Cien. Saude Colet. 2020, 25, 761–772. [Google Scholar] [CrossRef]
- Perea, L.M.E.; Boing, A.C.; Peres, M.A.; Boing, A.F. Potential years of life lost due to oropharyngeal cancer in Brazil: 1979 to 2013. Rev. Saude Publica 2019, 53, 67. [Google Scholar] [CrossRef] [Green Version]
- Bassett, M.T.; Chen, J.T.; Krieger, N. Variation in racial/ethnic disparities in COVID-19 mortality by age in the United States: A cross-sectional study. PLoS Med. 2020, 17, e1003402. [Google Scholar] [CrossRef] [PubMed]
- Centers for Disease Control and Prevention. MMWR, Racial and Ethnic Disparities in COVID-19 Incidence by Age, Sex, and Period among Persons Aged <25 Years—16 U.S. Jurisdictions, January 1–December 31, 2020; Centers for Disease Control and Prevention: Atlanta, GA, USA, 2021.
- Baqui, P.; Bica, I.; Marra, V.; Ercole, A.; van der Schaar, M. Ethnic and regional variations in hospital mortality from COVID-19 in Brazil: A cross-sectional observational study. Lancet Global Health 2020, 8, e1018–e1026. [Google Scholar] [CrossRef]
- Pierce, J.B.; Harrington, K.; McCabe, M.E.; Petito, L.C.; Kershaw, K.N.; Pool, L.R.; Allen, N.B.; Khan, S.S. Racial/ethnic minority and neighborhood disadvantage leads to disproportionate mortality burden and years of potential life lost due to COVID-19 in Chicago, Illinois. Health Place 2021, 68, 102540. [Google Scholar] [CrossRef] [PubMed]
- Wrigley-Field, E. US racial inequality may be as deadly as COVID-19. Proc. Natl. Acad. Sci. USA 2020, 117, 21854–21856. [Google Scholar] [CrossRef]
- De Oliveira, R.G.; Da Cunha, A.P.; Gadelha, A.G.D.S.; Carpio, C.G.; de Oliveira, R.B.; Corrêa, R.M. Desigualdades raciais e a morte como horizonte: Considerações sobre a COVID-19 e o racismo estrutural. Cad. Saude Publica 2020, 36, e00150120. [Google Scholar] [CrossRef]
- Pifarré, I.; Arolas, H.; Acosta, E.; López-Casasnovas, G.; Lo, A.; Nicodemo, C.; Riffe, T.; Myrskylä, M. Years of life lost to COVID-19 in 81 countries. Sci. Rep. 2021, 11, 3504. [Google Scholar] [CrossRef]
- Karimi, L.; Makvandi, S.; Vahedian-Azimi, A.; Sathyapalan, T.; Sahebkar, A. Effect of COVID-19 on Mortality of Pregnant and Postpartum Women: A Systematic Review and Meta-Analysis. J. Pregnancy 2021, 2021, 8870129. [Google Scholar] [CrossRef]
- Takemoto, M.L.S.; Menezes, M.d.O.; Andreucci, C.B.; Nakamura-Pereira, M.; Amorim, M.M.R.; Katz, L.; Knobel, R. The tragedy of COVID-19 in Brazil: 124 maternal deaths and counting. Int. J. Gynaecol. Obstet. 2020. [Google Scholar] [CrossRef] [PubMed]
- Tanacan, A.; Erol, S.A.; Turgay, B.; Anuk, A.T.; Secen, E.I.; Yegin, G.F.; Ozyer, S.; Kirca, F.; Dinc, B.; Unlu, S.; et al. The rate of SARS-CoV-2 positivity in asymptomatic pregnant women admitted to hospital for delivery: Experience of a pandemic center in Turkey. Eur. J. Obstet. Gynecol. Reprod. Biol. 2020, 253, 31–34. [Google Scholar] [CrossRef]
- De Melo, G.C.; de Araújo, K.C.G.M. COVID-19 infection in pregnant women, preterm delivery, birth weight, and vertical transmission: A systematic review and meta-analysis. Cad. Saude Publica 2020, 36, e00087320. [Google Scholar] [CrossRef]
- Sutton, D.; Bertozzi-Villa, C.; Lasky, J.; Fuchs, K.; Friedman, A. Outcomes and epidemiology of COVID-19 infection in the obstetric population. Semin. Perinatol. 2020, 151283. [Google Scholar] [CrossRef]
- Datasus. Sistema de Informações sobre Nascidos Vivos (SINASC). Available online: http://www2.datasus.gov.br/DATASUS/index.php?area=0205&id=6936 (accessed on 7 July 2021).
- Abate, S.M.; Checkol, Y.A.; Mantefardo, B. Global prevalence and determinants of mortality among patients with COVID-19: A systematic review and meta-analysis. Ann. Med. Surg. (Lond.) 2021, 64, 102204. [Google Scholar] [CrossRef] [PubMed]
- De Siqueira, J.V.V.; Almeida, L.G.; Zica, B.O.; Brum, I.B.; Barceló, A.; de Siqueira Galil, A.G. Impact of obesity on hospitalizations and mortality, due to COVID-19: A systematic review. Obes. Res. Clin. Pract. 2020, 14, 398–403. [Google Scholar] [CrossRef]
- Cheng, D.; Calderwood, C.; Skyllberg, E.; Ainley, A. Clinical characteristics and outcomes of adult patients admitted with COVID-19 in East London: A retrospective cohort analysis. BMJ Open Respir. Res. 2021, 8. [Google Scholar] [CrossRef] [PubMed]
- Gupta, A.; Nayan, N.; Nair, R.; Kumar, K.; Joshi, A.; Sharma, S.; Singh, J.; Kapoor, R. Diabetes Mellitus and Hypertension Increase Risk of Death in Novel Corona Virus Patients Irrespective of Age: A Prospective Observational Study of Co-morbidities and COVID-19 from India. SN Compr. Clin. Med. 2021, 1–8. [Google Scholar] [CrossRef]
- Sieber, P.; Flury, D.; Güsewell, S.; Albrich, W.C.; Boggian, K.; Gardiol, C.; Schlegel, M.; Sieber, R.; Vernazza, P.; Kohler, P. Characteristics of patients with Coronavirus Disease 2019 (COVID-19) and seasonal influenza at time of hospital admission: A single center comparative study. BMC Infect. Dis. 2021, 21, 271. [Google Scholar] [CrossRef] [PubMed]
- World Obesity Federation. COVID-19 and Obesity: The 2021 Atlas. March 2021: The Cost of Not Addressing the Global Obesity Crisis. Available online: https://www.worldobesityday.org/assets/downloads/COVID-19-and-Obesity-The-2021-Atlas.pdf (accessed on 18 June 2021).
- Silva, G.A.E.; Jardim, B.C.; Santos, C.V.B.D. Excesso de mortalidade no Brasil em tempos de COVID-19. Cien. Saude Colet. 2020, 25, 3345–3354. [Google Scholar] [CrossRef] [PubMed]


| Characteristics | Female, no. (%) | Male, no. (%) | Total, no. (%) | X2 Square | df | p |
|---|---|---|---|---|---|---|
| 38,417 (39.2) | 59,608 (60.8) | 98,025 (100) | ||||
| Race/color | ||||||
| Black | 17,317 (45.1) | 26,817 (45.0) | 44,134 (45.0) | 1.796 | 4 | 0.773 |
| White | 13,082 (34.1) | 20,196 (33.9) | 33,278 (33.9) | |||
| Yellow | 394 (1.0) | 616 (1.0) | 1010 (1.0) | |||
| Indigenous | 128 (0.3) | 222 (0.4) | 350 (0.4) | |||
| Ignored | 7496 (19.5) | 11,757 (19.7) | 19,253 (19.6) | |||
| Education (years) | ||||||
| No schooling/Illiterate | 1082 (2.8) | 1230 (2.1) | 2312 (2.4) | 206.919 | 6 | 0.000 |
| 1–5 years | 4466 (11.6) | 6098 (10.2) | 10,564 (10.8) | |||
| 6–9 years | 3304 (8.6) | 5126 (8.6) | 8430 (8.6) | |||
| 10–12 years | 4288 (11.2) | 7502 (12.6) | 11,790 (12.0) | |||
| >12 years old | 1446 (3.8) | 2896 (4.9) | 4342 (4.4) | |||
| Not applicable | 44 (0.1) | 41 (0.1) | 85 (0.1) | |||
| Ignored | 23,787 (61.9) | 36,715 (61.6) | 60,502 (61.7) | |||
| Age Group | ||||||
| 01–04 | 73 (0.2) | 67 (0.1) | 140 (0.1) | 138.169 | 14 | 0.000 |
| 05–09 | 31 (0.1) | 59 (0.1) | 90 (0.1) | |||
| 10–14 | 62 (0.2) | 75 (0.1) | 137 (0.1) | |||
| 15–19 | 182 (0.5) | 173 (0.3) | 355 (0.4) | |||
| 20–24 | 372 (1.0) | 384 (0.6) | 756 (0.8) | |||
| 25–29 | 545 (1.4) | 695 (1.2) | 1240 (1.3) | |||
| 30–34 | 951 (2.5) | 1326 (2.2) | 2277 (2.3) | |||
| 35–39 | 1541 (4.0) | 2259 (3.8) | 3800 (3.9) | |||
| 40–44 | 2140 (5.6) | 3415 (5.7) | 5555 (5.7) | |||
| 45–49 | 2798 (7.3) | 4682 (7.9) | 7480 (7.6) | |||
| 50–54 | 3906 (10.2) | 6546 (11.0) | 10,452 (10.7) | |||
| 55–59 | 5637 (14.7) | 9255 (15.5) | 14,892 (15.2) | |||
| 60–64 | 7975 (20.8) | 12,378 (20.8) | 20,353 (20.8) | |||
| 65–69 | 9975 (26.0) | 15,139 (25.4) | 25,114 (25.6) | |||
| ≥70 | 2229 (5.8) | 3155 (5.3) | 5384 (5.5) | |||
| Risk Factor | ||||||
| No | 8969 (23.3) | 17,464 (29.3 | 26,433 (27.0) | 420.173 | 1 | 0.000 |
| Yes | 29,448 (76.7) | 42,144 (70.7) | 71,592 (73.0) | |||
| Region of Residence | ||||||
| North | 3674 (9.6) | 6345 (10.6) | 10,019 (10.2) | 35.475 | 4 | 0.000 |
| Northeast | 8901 (23.2) | 13310 (22.3) | 22211 (22.7) | |||
| Midwest | 3287 (8.6) | 5081 (8.5) | 8368 (8.5) | |||
| Southeast | 18,121 (47.2) | 27,882 (46.8) | 46,003 (46.9) | |||
| South | 4434 (11.5) | 6990 (11.7) | 11,424 (11.7) | |||
| Zone | ||||||
| Urban | 32,073 (83.5) | 49,941 (83.8) | 82,014 (83.7) | 5.473 | 3 | 0.140 |
| Rural | 1627 (4.2) | 2345 (3.9) | 3972 (4.1) | |||
| Periurban | 152 (0.4) | 237 (0.4) | 389 (0.4) | |||
| Ignored | 4565 (11.9) | 7085 (11.9) | 11,650 (11.9) | |||
Publisher’s Note: MDPI stays neutral with regard to jurisdictional claims in published maps and institutional affiliations. |
© 2021 by the authors. Licensee MDPI, Basel, Switzerland. This article is an open access article distributed under the terms and conditions of the Creative Commons Attribution (CC BY) license (https://creativecommons.org/licenses/by/4.0/).
Share and Cite
Castro, A.P.B.d.; Moreira, M.F.; Bermejo, P.H.d.S.; Rodrigues, W.; Prata, D.N. Mortality and Years of Potential Life Lost Due to COVID-19 in Brazil. Int. J. Environ. Res. Public Health 2021, 18, 7626. https://doi.org/10.3390/ijerph18147626
Castro APBd, Moreira MF, Bermejo PHdS, Rodrigues W, Prata DN. Mortality and Years of Potential Life Lost Due to COVID-19 in Brazil. International Journal of Environmental Research and Public Health. 2021; 18(14):7626. https://doi.org/10.3390/ijerph18147626
Chicago/Turabian StyleCastro, André Peres Barbosa de, Marina Figueiredo Moreira, Paulo Henrique de Souza Bermejo, Waldecy Rodrigues, and David Nadler Prata. 2021. "Mortality and Years of Potential Life Lost Due to COVID-19 in Brazil" International Journal of Environmental Research and Public Health 18, no. 14: 7626. https://doi.org/10.3390/ijerph18147626