
Target Date Funds, Drawdown Risk, and Central Bank Intervention: Evidence during the COVID-19 Pandemic
1
College of Letters and Science, University of California—Santa Barbara, Santa Barbara, CA 93106, USA
2
College of Business, Missouri State University, Springfield, MO 65897, USA
*
Author to whom correspondence should be addressed.
J. Risk Financial Manag. 2022, 15(9), 408; https://doi.org/10.3390/jrfm15090408
Submission received: 18 July 2022
/
Revised: 6 September 2022
/
Accepted: 7 September 2022
/
Published: 13 September 2022
(This article belongs to the Special Issue Household Finance II)
Abstract
:Target Date Funds (TDFs) have become the default investment choice in retirement accounts for most households. Later-dated TDFs (e.g., further away from the present day) allocate a more significant percentage of each dollar invested into equities relative to fixed income. As the TDF moves closer to the designated retirement date, the TDF embarks on its’ glide path. We study the impact of the COVID-19 Pandemic and Federal Reserve intervention on the max drawdowns experienced by TDFs during 2020. Later-dated funds experienced more significant drawdowns relative to near-dated funds. Moving out one target date fund increased the drawdown by approximately 1.90%. Approximately 80% of TDFs experienced their max drawdown on 23 March 2020. The max drawdowns of the TDFs are then studied in the following three sub-periods: (1) before the first Federal Reserve Intervention (2 March 2020), (2) after the first intervention and before the second intervention (16 March 2020), and (3) the period after the second intervention. TDFs experienced the greatest drawdowns after the first intervention by the Federal Reserve (approximately 19%) relative to the other two periods (approximately 7%). Fees associated with the TDFs tend not to influence the drawdowns except for the near-dated funds, where the low-fee funds performed better. Finally, near-dated funds recovered from their max drawdowns around September 2020, whereas later-dated funds did not fully recover until December 2020.
JEL Classification:
G10; G11; G231. Introduction
Saving and investing for retirement can make investors seem helpless when confronted with more options than they can comprehend. Therefore, various financial instruments and accounts have been created to help investors meet their future spending needs and life goals. The mutual fund is one of the first financial instruments created and targeted to help investors reduce this anxiety. The creation of the modern mutual fund can be traced back to 1924 (Bianco Research 2018). Tradable index funds and exchange traded funds (ETFs) availability followed as retirement account options. However, the vastness of indices, mutual funds, and ETFs available to investors can overload retail investors with the potential to lead them to “choice overload” (Iyengar and Lepper 2000). Choice overload occurs when individuals would be better off with fewer options as the overload overwhelms them and typically leads to them either not deciding or making a sub-optimal choice (Schwartz 2004). This phenomenon has been shown to reduce 401(k) plan participation and lead to a lack of retirement savings and investing (Iyengar et al. 2004). Target Date Funds (TDFs) were created to help overcome this indecisiveness and choice overload (Investment Company Institute 2014).1
The Pension Protection Act of 2006 had implications for retirement plans. This legislation includes automatic enrollment in retirement plans for participants. Accordingly, in 2007 the Department of Labor provided four qualified default investment alternatives (QDIA), including the availability of TDFs (Jones Day 2007).2 Since adopting the Act, TDFs have become the most used QDIA for retirement funds, given the design to provide age-appropriate asset allocation for retirement plan participants over time (U.S. Government Accountability Office 2011). Including these funds has increased retirement plan participants’ exposure to equity and bond markets while decreasing the amount of cash and individual company stock holdings in the retirement plans for many households. The change in the composition of the retirement portfolios has reduced the idiosyncratic risk of retirement portfolios and helped ease the burden for individuals in managing their retirement accounts (Mitchell and Utkus 2021). Eliminating the decision on asset allocation and when to rebalance is helpful as investors tend to make one investment choice and are hesitant to make changes over time (Agnew et al. 2003).
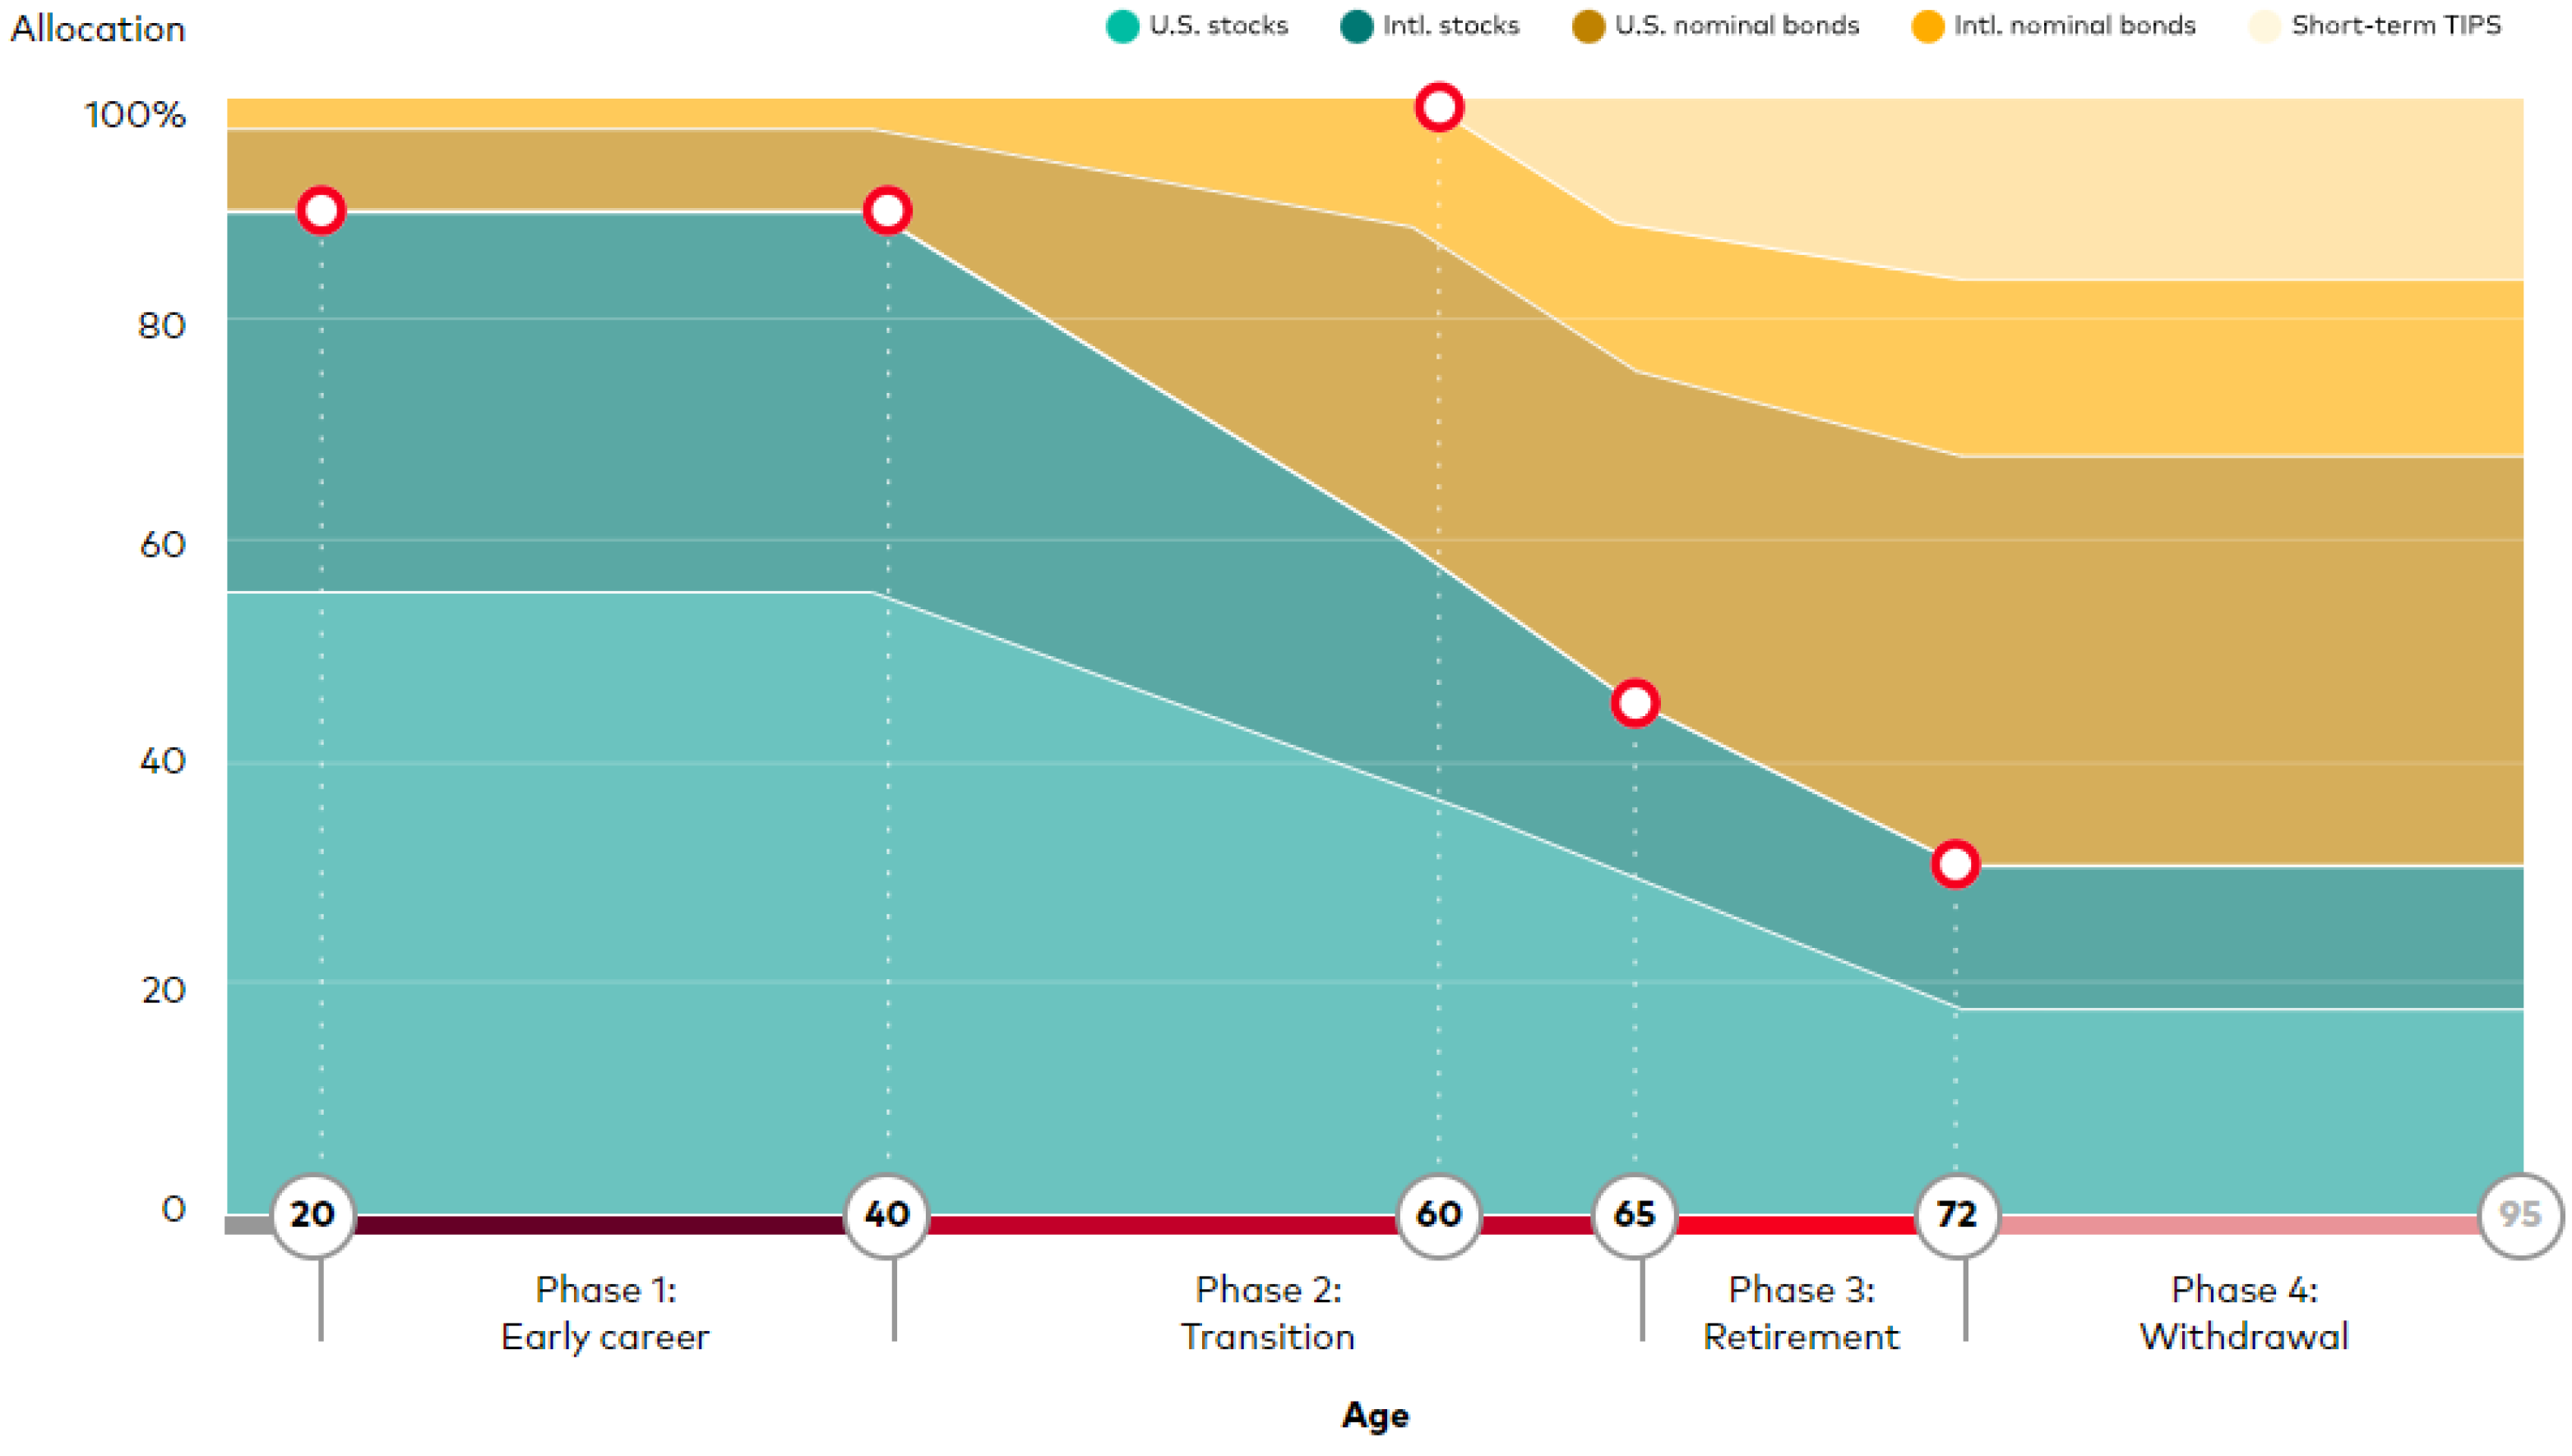
The simplicity of TDFs by providing a timeline that closely mirrors the investors’ prospective retirement date helps make choosing the appropriate TDF easy. Additionally, TDFs provide systematic rebalancing performed by the fund managers to simplify the investment further and help reduce portfolio risk due to asset allocation targets. TDFs whose target retirement date is further away (i.e., later-dated funds) invest more aggressively by allocating a higher percentage of the fund’s assets under management (AUM) into equity markets. As time progresses, the managers of the TDF begin to adjust the fund’s asset allocation. As a result, the fund’s AUM exposure to the equity market decreases while the percentage invested in the fixed income markets increases. These changes in asset allocation over time are known as the fund’s glide path. An example of a TDF glide path is shown in Figure 1. The goal of the glide path is to reflect the investors’ ability to handle different levels of risk at different points in their careers. The risk level tolerance of investors is typically higher earlier in their careers and becomes lower as the individual moves closer to retirement.
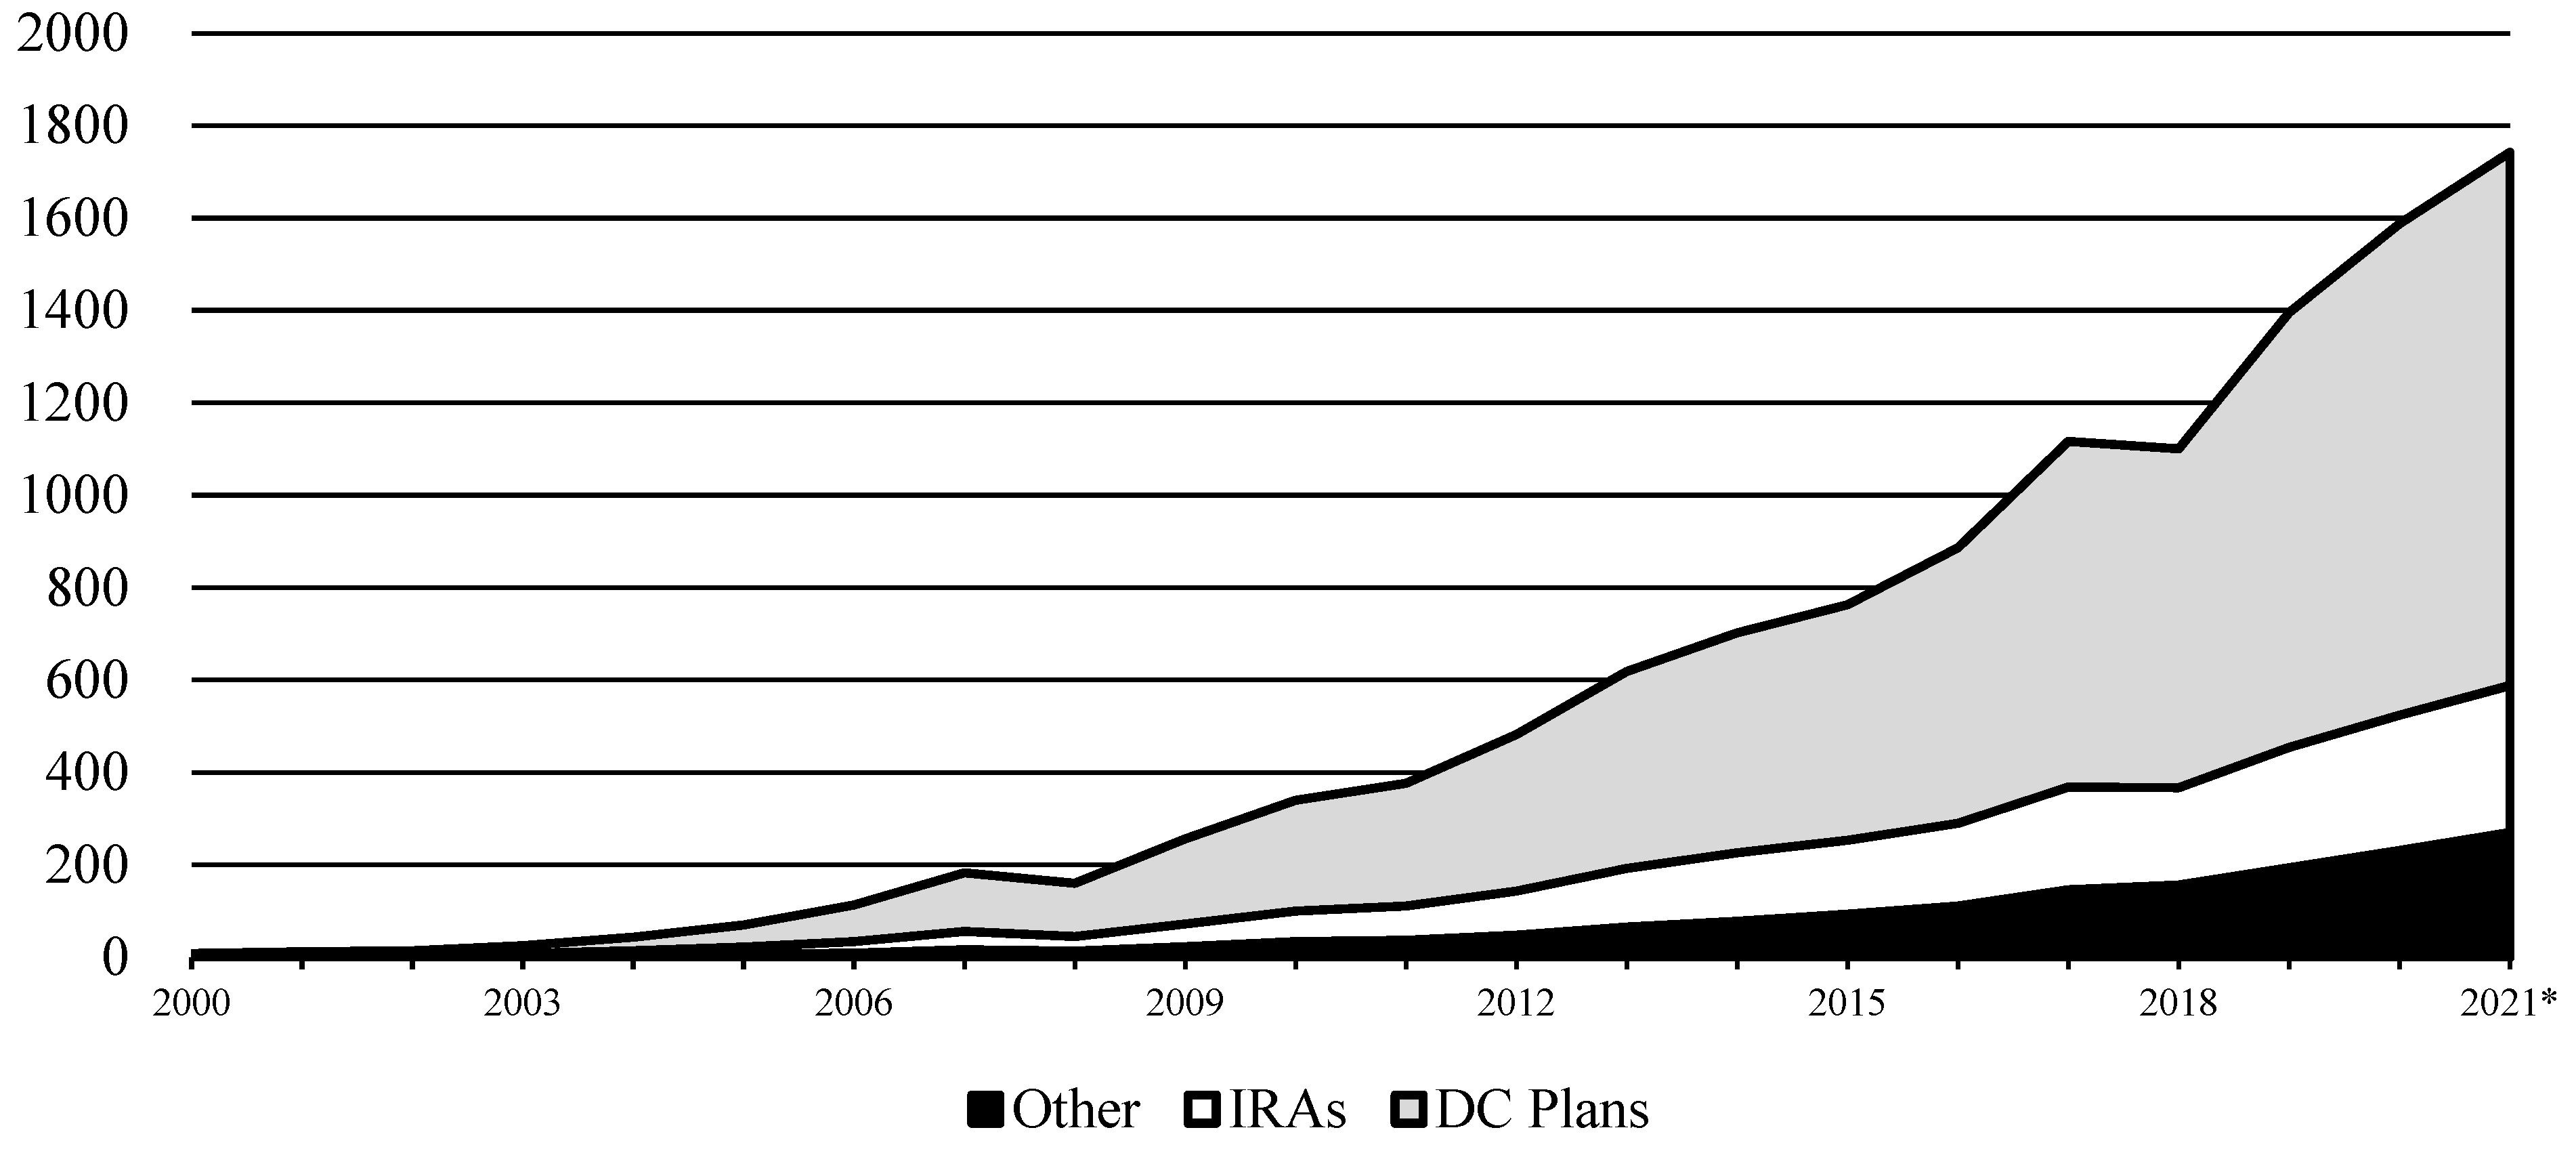
The further away from retirement, an individual can accept higher risks with the expectations for potentially more significant returns. However, an investor’s desire to protect and not lose the accumulated retirement funds from earlier in their career increases as the target retirement date approaches. Thus, the investor is willing to accept potential lower returns in exchange for less risk. Therefore, TDFs with fewer years until their designated target date (i.e., near-dated funds) are expended to provide more downside protection than TDFs that are farther from the target date (i.e., later-dated funds). For example, one would expect that during normal times a 2025 TDF would experience lower returns but also the potential for less significant drawdowns relative to a 2065 TDF. TDFs have become a popular retirement investment fund for households as the amount invested in TDFs has grown significantly over time. In 2001, approximately only $10 billion in retirement accounts were invested in TDFs. The value invested in TDFs has increased to approximately $1.416 trillion since the end of the first quarter of 2021 as depicted in Figure 2 (Investment Company Institute 2021a).
In 2018, according to the Investment Company Institute (2021b), TDFs, on average, accounted for 50.5% of 401(k) account balances for individuals in their twenties. In comparison, investors in their sixties allocated 22.9% of their 401(k) balances to TDFs. Even though there is a considerable variation in the percentage of an account allocated to TDFs, it still illustrates the vast adoption of TDFs as a significant source for retirement accounts. Even though TDFs were utilized less in the past and tend to make up a lower percentage of retirement accounts for older investors, the amount invested in dollar terms is significant. The mean account dollar value in 2019 for individuals under 30 was $30,000, while the mean value was approximately $400,000 for those in their sixties (Federal Reserve Board 2020).
Younger investors (e.g., households) should become more aware of and familiar with TDFs as the funds are likely to continue to gain popularity as the preferred retirement fund choice. By the end of 2018, 54.4% of participants in their 20s had between 90% and 100% of their retirement assets in TDFs. As the age of participants increases, the percentage of participants with between 90% and 100% of their assets in TDFs decreases monotonically.
For example, 48.3% of participants in their thirties had between 90% and 100% of their assets in TDFs. 39.2% of participants in their 40s had between 90% and 100% of their assets in TDFs. This trend continues as participants in their sixties, 33.9%, had between 90% and 100% of their assets in TDFs (Holden et al. 2021). The data in Table 1 helps visualize the importance of TDFs for households, as at least one of every three individuals investing for retirement uses TDFs as their sole (or primary) investment vehicle.
Given the asset allocation and construction of TDFs, one would expect near-dated funds (i.e., funds closer to their target date or past their target date) to be safer investments and have less downside risk potential during normal market times. However, these financial instruments may not necessarily behave as they were created in the presence of a systemic shock or a “black swan” event to financial markets, such as the COVID-19 Pandemic. This type of shock or “black swan” event is defined as a combination of the event being (1) an outlier, (2) extreme impact, and (3) predictable after the fact (Taleb 2007). Therefore, throughout this research, we classify the COVID-19 Pandemic’s impact on the financial markets during March 2020 following Taleb (2007) as a “black swan” event.
This research aims to explore whether the drawdown of financial markets during the COVID-19 Pandemic between February and March of 2020 was homogenous across different classifications of TDFs (i.e., near-dated funds versus later-dated funds). Shoven and Walton (2021) are one of the first to investigate how TDFs reacted during this period. We first aim to substantiate their findings. We then move on to understand differences in the maximum drawdowns experienced by TDFs across various periods during 2020, considering the two interventions in the financial markets made by the Federal Reserve. The first Federal Reserve intervention occurred on 2 March 2020, with the Federal Open Market Committee (FOMC) lowering the Fed Funds Target Rate (FFTR) by 50 basis points for a goal range of 1.00 to 1.25%. Lowering the FFTR was to help achieve maximum employment and price stability goals. However, market conditions continued to deteriorate, prompting the FOMC to lower the FFTR again. This time by 100 basis points with a goal range of 0.00 to 0.25% on 16 March 2020.
Our initial sample for the maximum drawdowns of TDFs is the entire year of 2020. We then create three sub-periods and new measures of a fund’s maximum drawdown to investigate how the Central Bank interventions impacted the drawdowns of the TDFs during these periods. The first sub-sample period is identified as “Period A” and reflects the beginning of the 2020 year up to 2 March 2020 (the first intervention). The second sub-sample period identified as “Period B” is the period following the first FOMC intervention and prior to the second FOMC intervention, resulting in a sub-sample period of 3 March through 15 March 2020. Finally, the third and final sub-sample period is categorized as “Period C”, which is the sample period following the second FOMC intervention (16 March 2020).
We find that despite the “black swan” event due to the COVID-19 Pandemic, even in the presence of Central Bank intervention, closer dated TDFs experience less significant drawdowns relative to later-dated funds across the entire year and the three sub-periods, pre-FOMC invention (Period A), post-first FOMC intervention (Period B), and post-second FOMC intervention (Period C). This finding does not indicate that certain TDFs did not experience drawdowns as all the TDFs did. However, nearest date funds averaged a mean drawdown of approximately 15%, while further dated funds averaged a mean drawdown of approximately 33%. Even in the presence of a “black swan” event, near-dated target funds still protected better against drawdown risk than later-dated funds across all four periods studied and even in the presence of Central Bank intervention. Ultimately, retirement investors should feel comfortable and assured that the highly adopted TDFs not only work as constructed during normal market times, but also in the face of a market-wide shock when drawdown risk would be needed most.
We discuss the relevant literature on TDFs and provide the research questions explored in this research in Section 2. Then, in Section 3, we describe the data and data collection processes. Next, we present and discuss the empirical results in Section 4. Lastly, Section 5 provides the conclusion and potential avenues for future research regarding TDFs.
2. Prior Literature and Research Questions
The growth and importance of TDFs in individual retirement accounts have increased the number of articles in the finance literature. TDFs integrate a mandated glide path to ensure an appropriate asset allocation for individuals expecting to retire around particular target dates (e.g., Blanchett 2007; Miller et al. 2011). However, Elton et al. (2015) document no consensus on the appropriate allocation percentage between equity and bonds for specific TDFs. This lack of consensus has led to discrepancies in asset allocation across the same target date. Allocation discrepancies are due to the flexibility provided by the mandate regarding the glide path. For instance, American Funds state in a summary prospectus for their 2065 TDF, “The investment adviser anticipates that the fund will invest its assets within a range that deviates no more than 10% above or below the investment approach set forth…”3
TDFs are also mostly “funds-of-funds,” which means that TDFs invest in other funds relative to individual securities. Thus, TDFs incur the costs of holding the funds in addition to their costs. Chang et al. (2021) explore the relationship between TDF costs and loads across three Morningstar ratings. Chang et al. (2021) find that TDFs with no load charges and that are low cost receive higher Morningstar star ratings. This finding holds for Morningstar Analyst and Morningstar Quantitative ratings as well. Next, Shoven and Walton (2021) find that the performance of high-cost TDFs tends to deviate significantly from their passive benchmark. Alternatively, the performance of lower-cost TDFs tends to match the returns of the passive benchmark more closely.
The growing prominence and size of TDFs directly impact financial markets. Parker et al. (2021) show that TDFs influence the mutual funds they hold. Individual securities held by those funds are directly affected, specifically through price impact. Parker et al. conclude that continued investing in TDFs, resulting in more assets under management, could affect return dynamics. This impact includes the relationships between stock and bond returns. Spitzer and Singh (2008, 2011) raise concern that TDF performance is inferior to alternative fixed allocations during the withdrawal and accumulation phases. However, Mitchell and Utkus (2021) show that retirement investors prefer the ease of a simple investment choice that rebalances and provides asset allocation guidance when included as a choice in a retirement account.
We contribute to the growing literature on defined contribution accounts and TDFs (e.g., Sandhya 2011; Elton et al. 2015; Tang and Lin 2015; Balduzzi and Reuter 2019). This research is closely related to the two recent articles by Shoven and Walton (2021) and Mao and Wong (2022). Shoven and Walton (2021) provide a thorough analysis of the evolution of TDFs from 2010 through 2020. They conduct style analyses and differences in Sharpe ratios. Shoven and Walton also examine TDFs during the specific period of 19 February through 23 March 2020. They find that near-dated TDFs experienced losses in values between 20% and 25% relative to further-dated TDFs that lost between 30% and 35% during this window. Mao and Wong (2022) investigate why TDFs performed better during the COVID-19 selloff of 2020 compared to the Financial Crisis selloff of 2008. They find a reduction in the level and cross-sectional dispersion during the most recent COVID-19 selloff. They cite this reason for the better performance along with fund managers catering to investor demand for lower risk exposure following the financial crisis. Mao and Wang estimate returns for 2020 TDFs of approximately −10.31%. This estimate is significantly different from the results of Shoven and Walton (2021). We extend both works as they do not investigate and determine the dates of the max drawdowns for the TDFs. These two articles also do not consider the impacts of the Federal Reserve interventions occurring on 2 March and 16 March 2020. We aim to contribute to the literature by better understanding how TDFs reacted before interventions after the interventions and whether the impact was homogenous across target dates. Finally, our paper contributes to the line of literature that focuses on defined contribution (DC) plans and investment options (e.g., Madrian and Shea 2001; Agnew et al. 2003; Elton et al. 2006; Pool et al. 2016). TDFs are often the default investment choice for defined contribution plan participants (Mitchell and Utkus 2021).
Our first set of research questions focuses on the maximum drawdowns of TDFs (using two different classification methods) during 2020. The first is whether the maximum drawdowns TDFs during 2020 in reaction to the COVID-19 selloff were homogenous across fund date categories or heterogeneous? We investigate this using fund date categories (e.g., Target-Date 2025, 2030) and the fund’s portfolio classification where the TDF is regarding its’ glide path (e.g., Withdrawal, Retirement, Transition). The null hypothesis is that there were no differences in the maximum drawdown across fund classifications and would suggest that 2020 TDFs would experience similar drawdowns as 2060 TDFs. The fund categories are self-defined by the fund itself and the target date associated with the fund. We classify funds into the appropriate fund category using the selected target date and fund classification provided by Morningstar. The alternative hypothesis is that there are differences in the maximum drawdown across fund classifications. The alternative hypothesis would support the supposition that the maximum drawdown of near-dated funds differed from later-dated funds. If so, what are the differences between TDFs across the 2020 year? Another research question we investigate: When did TDFs by classification reach their maximum drawdown during the COVID-19 selloff, and how long did it take for TDFs to recover from their maximum drawdowns?
The second set of research questions concentrates on the TDFs maximum drawdown using three sub-periods during 2020 reflecting the Federal Reserve’s intervention into financial markets. For example, were the drawdowns equal across the three periods, or were the drawdowns different across sub-periods? Finally, we investigate the impact (if any) that fees had on the maximum drawdowns of TDFs across the entire sample period and the three sub-periods.
3. Data
In this study, we use Morningstar’s Advisor Workstation to identify the universe of US-based mutual funds classified as TDFs. Our sample universe begins with 2598 funds. We collect the ticker, fund category, and fee level for each fund from Morningstar. We do not use Morningstar’s drawdown as it is provided quarterly and does not provide granular data so that we can identify the appropriate answers to our research questions. Using the tickers from Morningstar, we then collect the daily price data for each fund in our sample using Bloomberg terminals for the period starting 2 January 2020, through 31 December 2020. Next, we exclude any fund with missing price data during the year and drop any funds belonging to a fund category with less than ten members as defined by Morningstar from our sample. This cleaning process yields 2217 TDFs representing 12 different fund categories resulting in 558,684 data points.
The primary variable of interest in this study is the maximum drawdown of a fund. Using the daily prices collected from Bloomberg, we compute for each fund the maximum drawdown over the sample periods. The maximum drawdown is defined as follows:
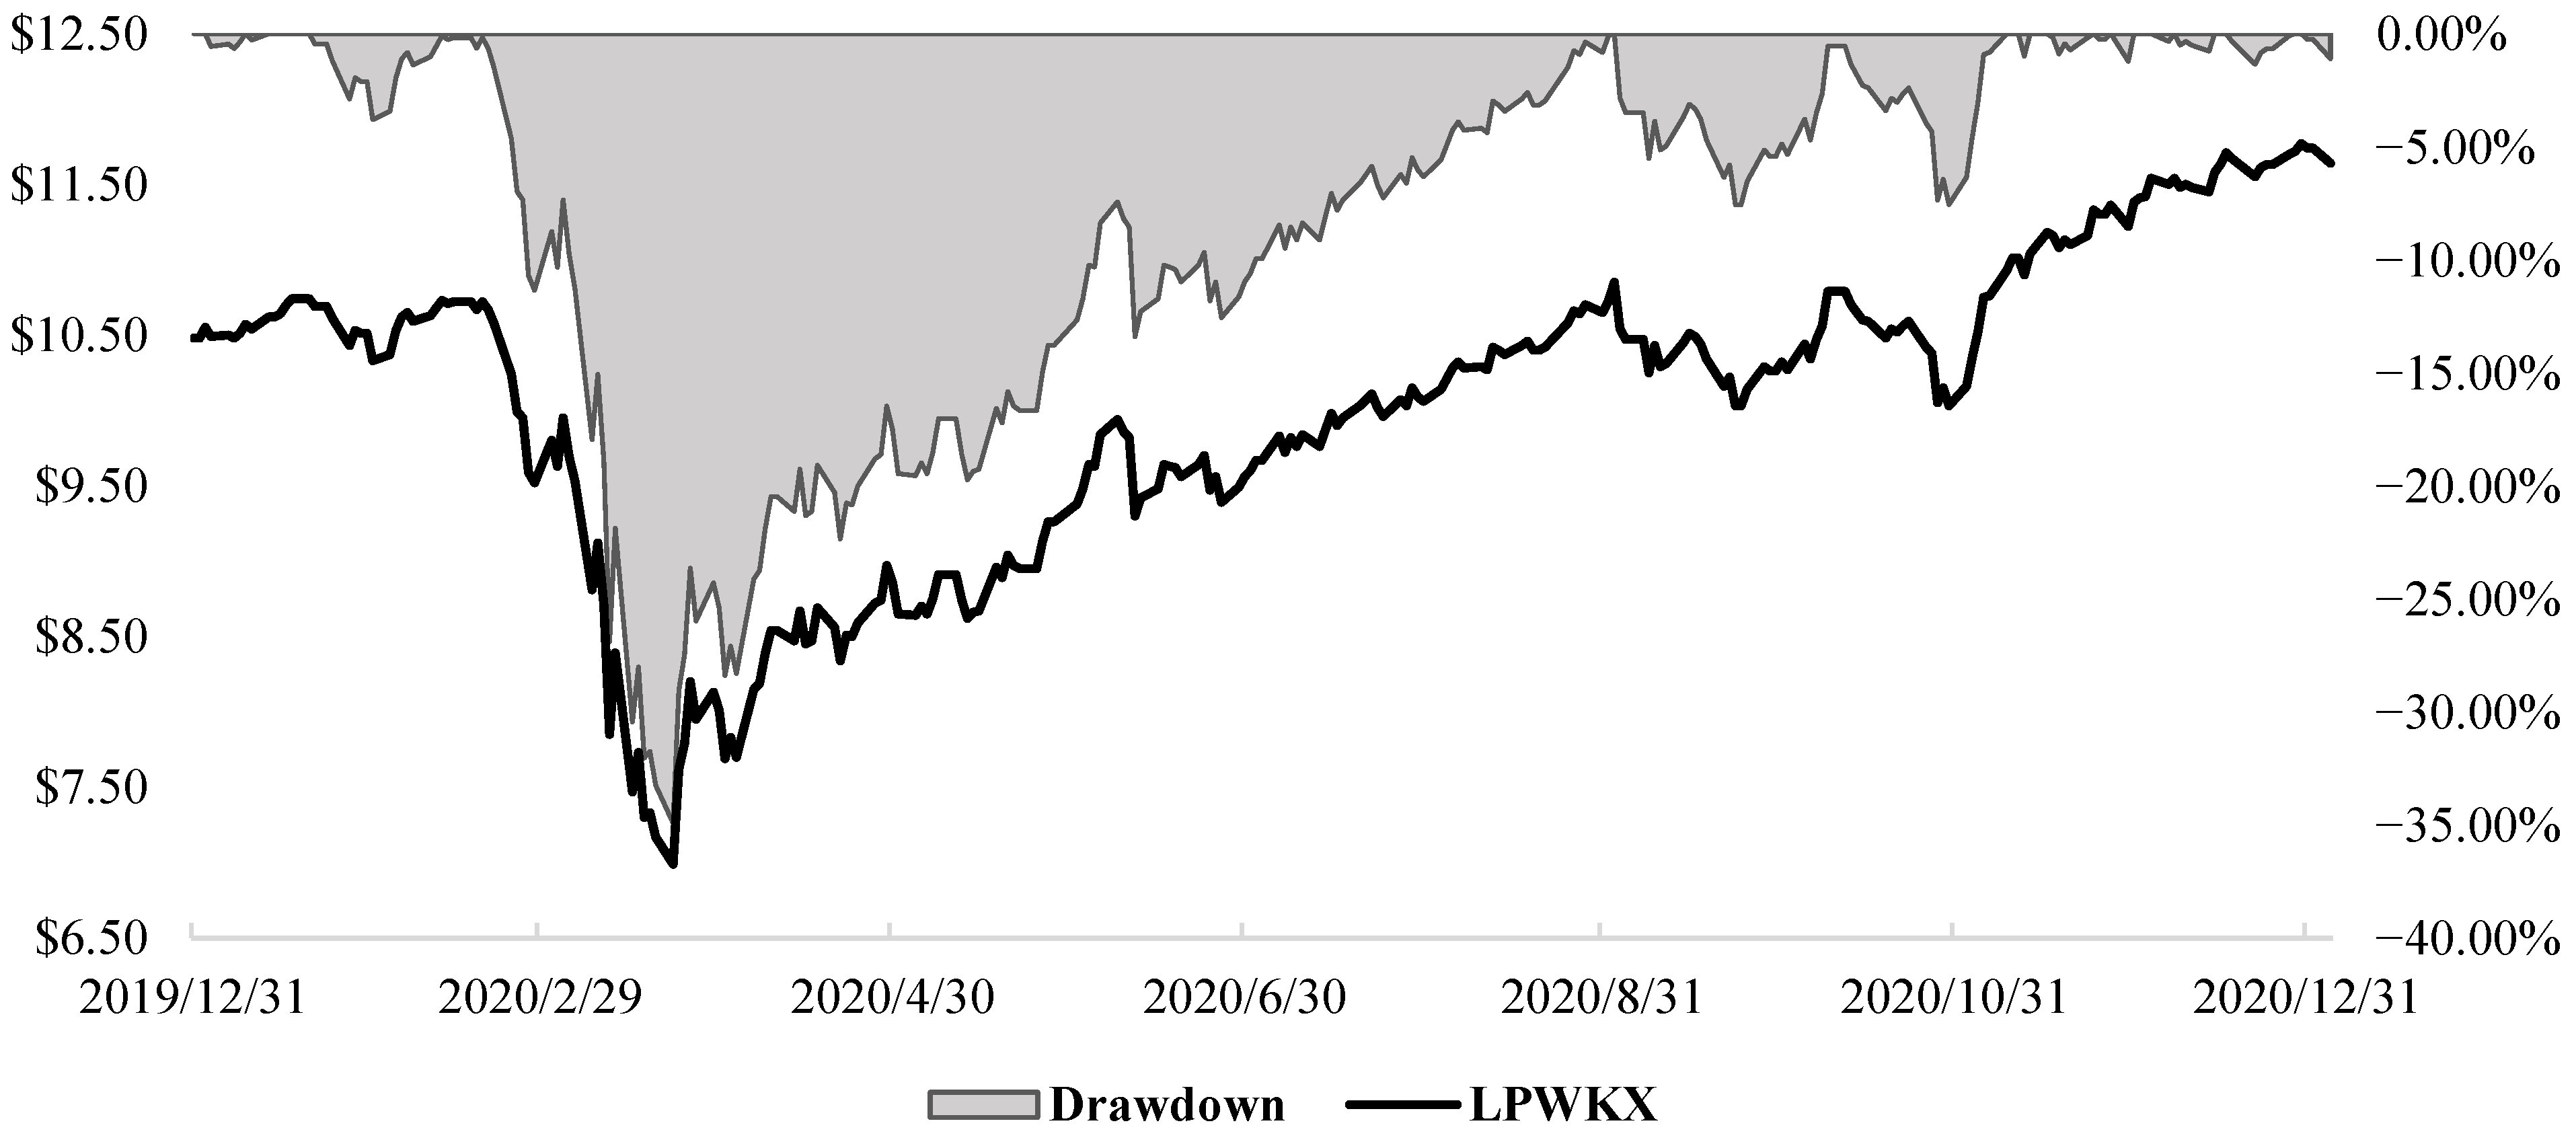
where is the fund’s maximum drawdown over the respective period of time T for sample period j, is the fund’s price at time t (0 ≤ t ≤ T), and is the highest price the fund recorded over a period of time up to time t. We calculate this maximum drawdown for each fund four times. The first drawdown calculated is for the entire year. The second drawdown value for the first sub-sample period is identified as “Period A” and reflects the beginning of the 2020 year up to 2 March 2020 (the first Federal Reserve intervention). The third drawdown value is determined for the second sub-sample period referred to as “Period B,” which is the period following the first intervention and prior to the second intervention, resulting in a sub-sample period of 3 March through 15 March 2020. The fourth and final drawdown measure is calculated for the third sub-sample period, categorized as “Period C,” which is the period following the second intervention (16 March 2020). Figure 3 provides a visual example of the price and drawdown calculation for BlackRock LifePath® Dynamic 2065 Fund Class K Shares (LPWKX), a fund in the sample, over the entire sample period. The left-axis reflects the price for BlackRock LifePath® Dynamic 2065 Fund Class K Shares (Ticker: LPWKX) and formatted per share. The drawdown amount of LPWKX is reflected via the right-axis and in percentage form.
4. Empirical Results
Our analysis starts with investigating the average maximum drawdown across fund categories. Panel A of Table 2 shows summary statistics of maximum drawdown by fund category and portfolio classification according to Morningstar. We find that our sample’s average maximum drawdown of TDFs increases monotonically with the target date. For example, 2015 TDFs had an average maximum drawdown of 18.21% over the sample period. Whereas 2060 TDFs experienced an average maximum drawdown of 33.79% over the same period, nearly twice as high as the 2015 TDFs. The difference between TDFs across target dates is apparent. We also find that TDFs in categories with “nearby” maturities record average maximum drawdowns similar. For instance, 2050 TDFs experienced an average maximum drawdown of −33.31%, while 2055 TDFs had an average maximum drawdown of −33.60% over our sample period. The drawdown recorded by near-dated funds is not as severe as those experienced by later-dated funds. This evidence supports that the maximum drawdown of TDFs during the COVID-19 selloff was not uniform across funds and had differential effects.4 The non-uniformity should provide safety and reassurance to households that invest in TDFs that the closer they are to retirement, their appropriate fund works as it should, even in the presence of a "black swan" event.
Next, we classify TDFs into portfolios depending on where the fund falls within its’ glide path. This classification forms four portfolios in line with the 4 phases of the glide path presented in Figure 1. We define the first portfolio fund set as “Phase 4” funds, representing the “Withdrawal” period and containing 2000–2010 TDFs. Next, we define the second portfolio as the “Phase 3” portfolio, consisting of 2015 and 2020 TDFs portraying the “Retirement” period. Next, the third portfolio is identified as “Phase 2” or the “Transition” portfolio, consisting of TDFs with target dates of 2025, 2030, 2035, and 2040. Finally, the fourth portfolio is specified as “Phase 1” or the “Early Career” portfolio, comprising TDFs with target dates 2045, 2050, 2055, 2060, and 2065 and beyond.
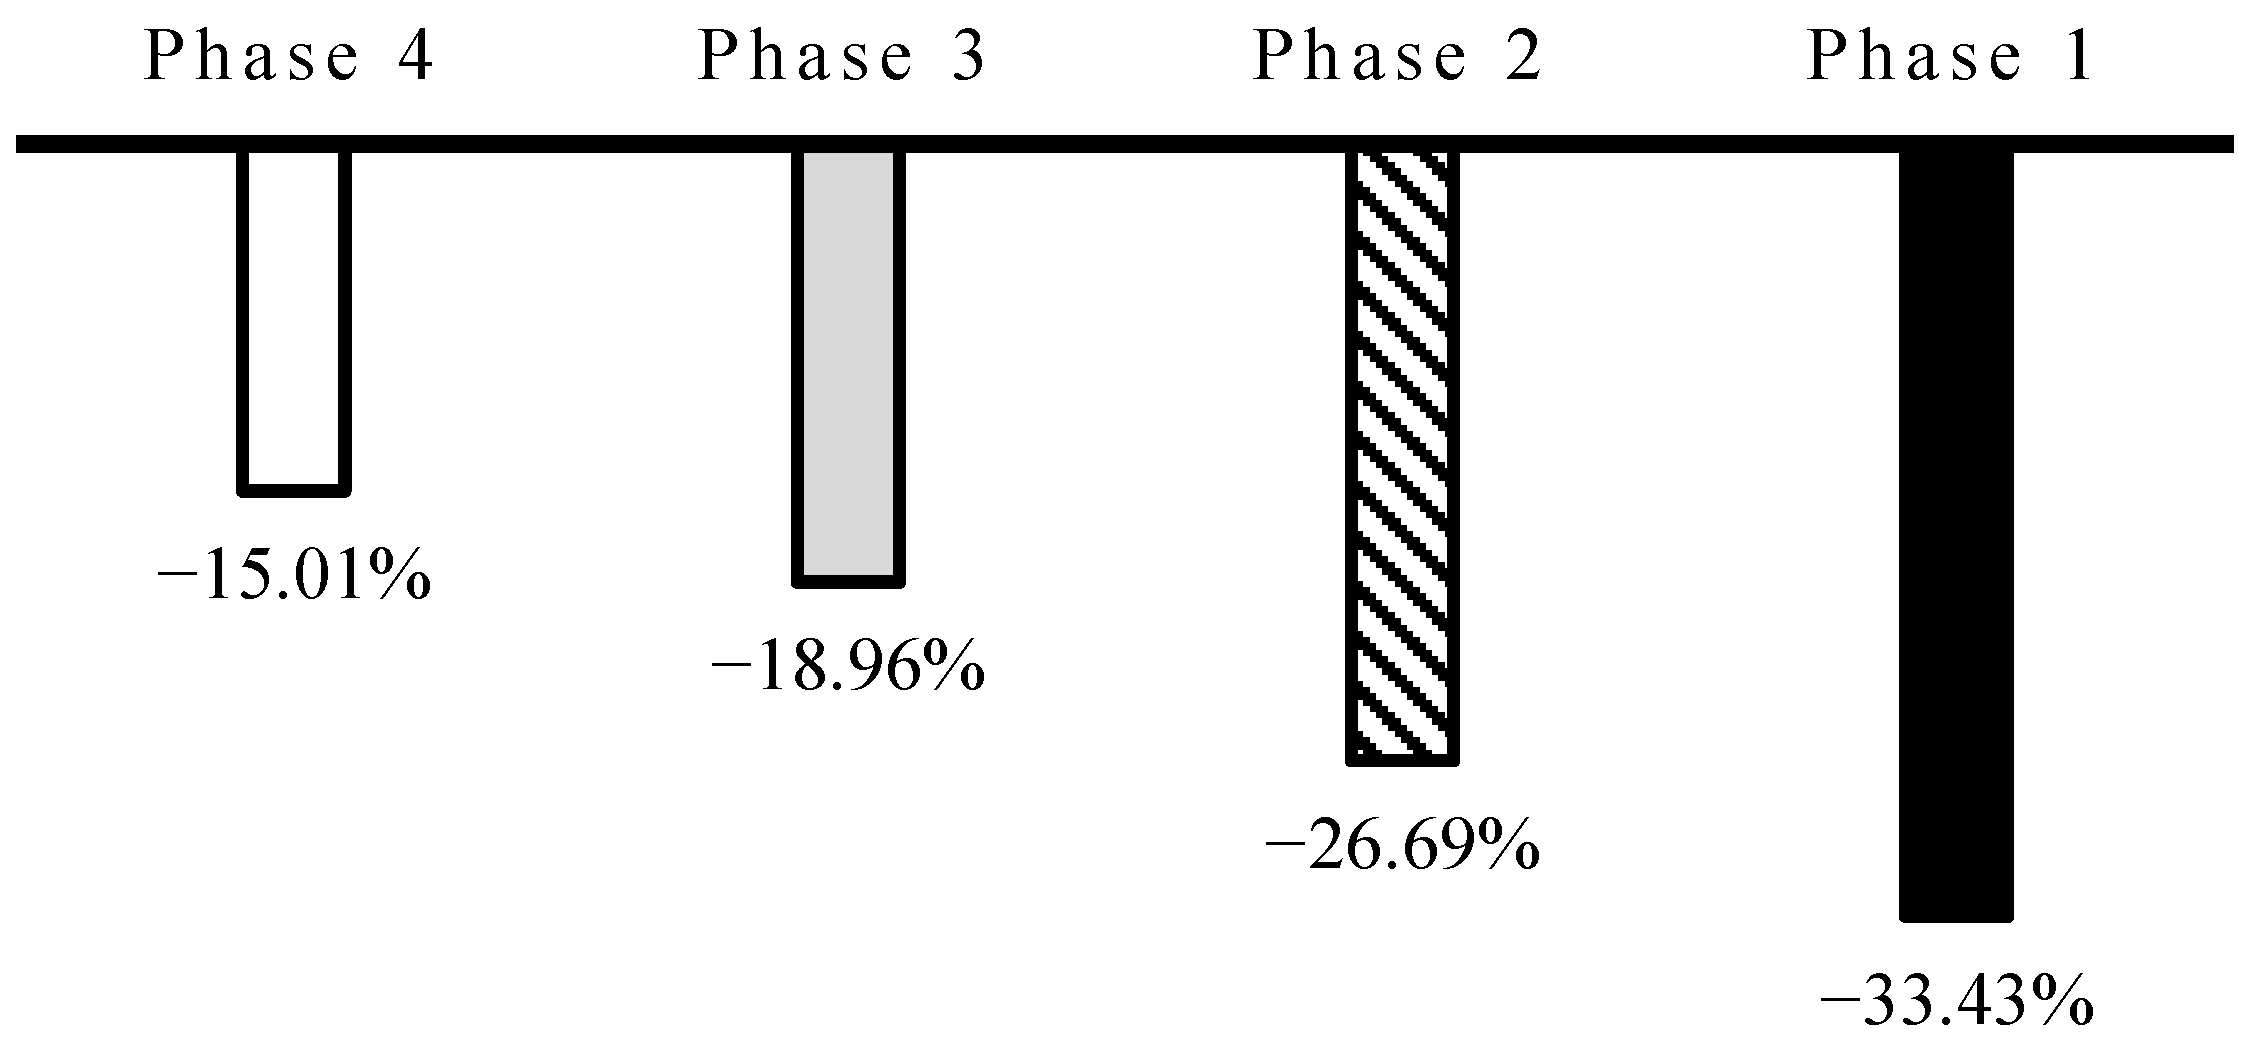
Panel B of Table 2 presents summary statistics for the four portfolios described, where the variable of interest continues to the fund’s maximum drawdown. Aggregating the TDFs into the four glide path phases offers similar results to those in Panel A of Table 1. Notably, we find that TDFs in the Phase 4 portfolio recorded an average maximum drawdown (15.01%) over the sample period, which is less than half of the drawdown funds in the Phase 1 portfolio (33.43%); a difference of approximately 18%. Figure 4 shows the average maximum drawdown for each portfolio classification. TDFs with higher allocation attributed to equity markets experienced a more significant drawdown than their counterparts with greater allocations towards the fixed income market.5 Panels A and B of Table 2 reinforce the proposition that TDFs, even in the presence of a “black swan” event, behaved the way they were constructed as they behave in normal market conditions.
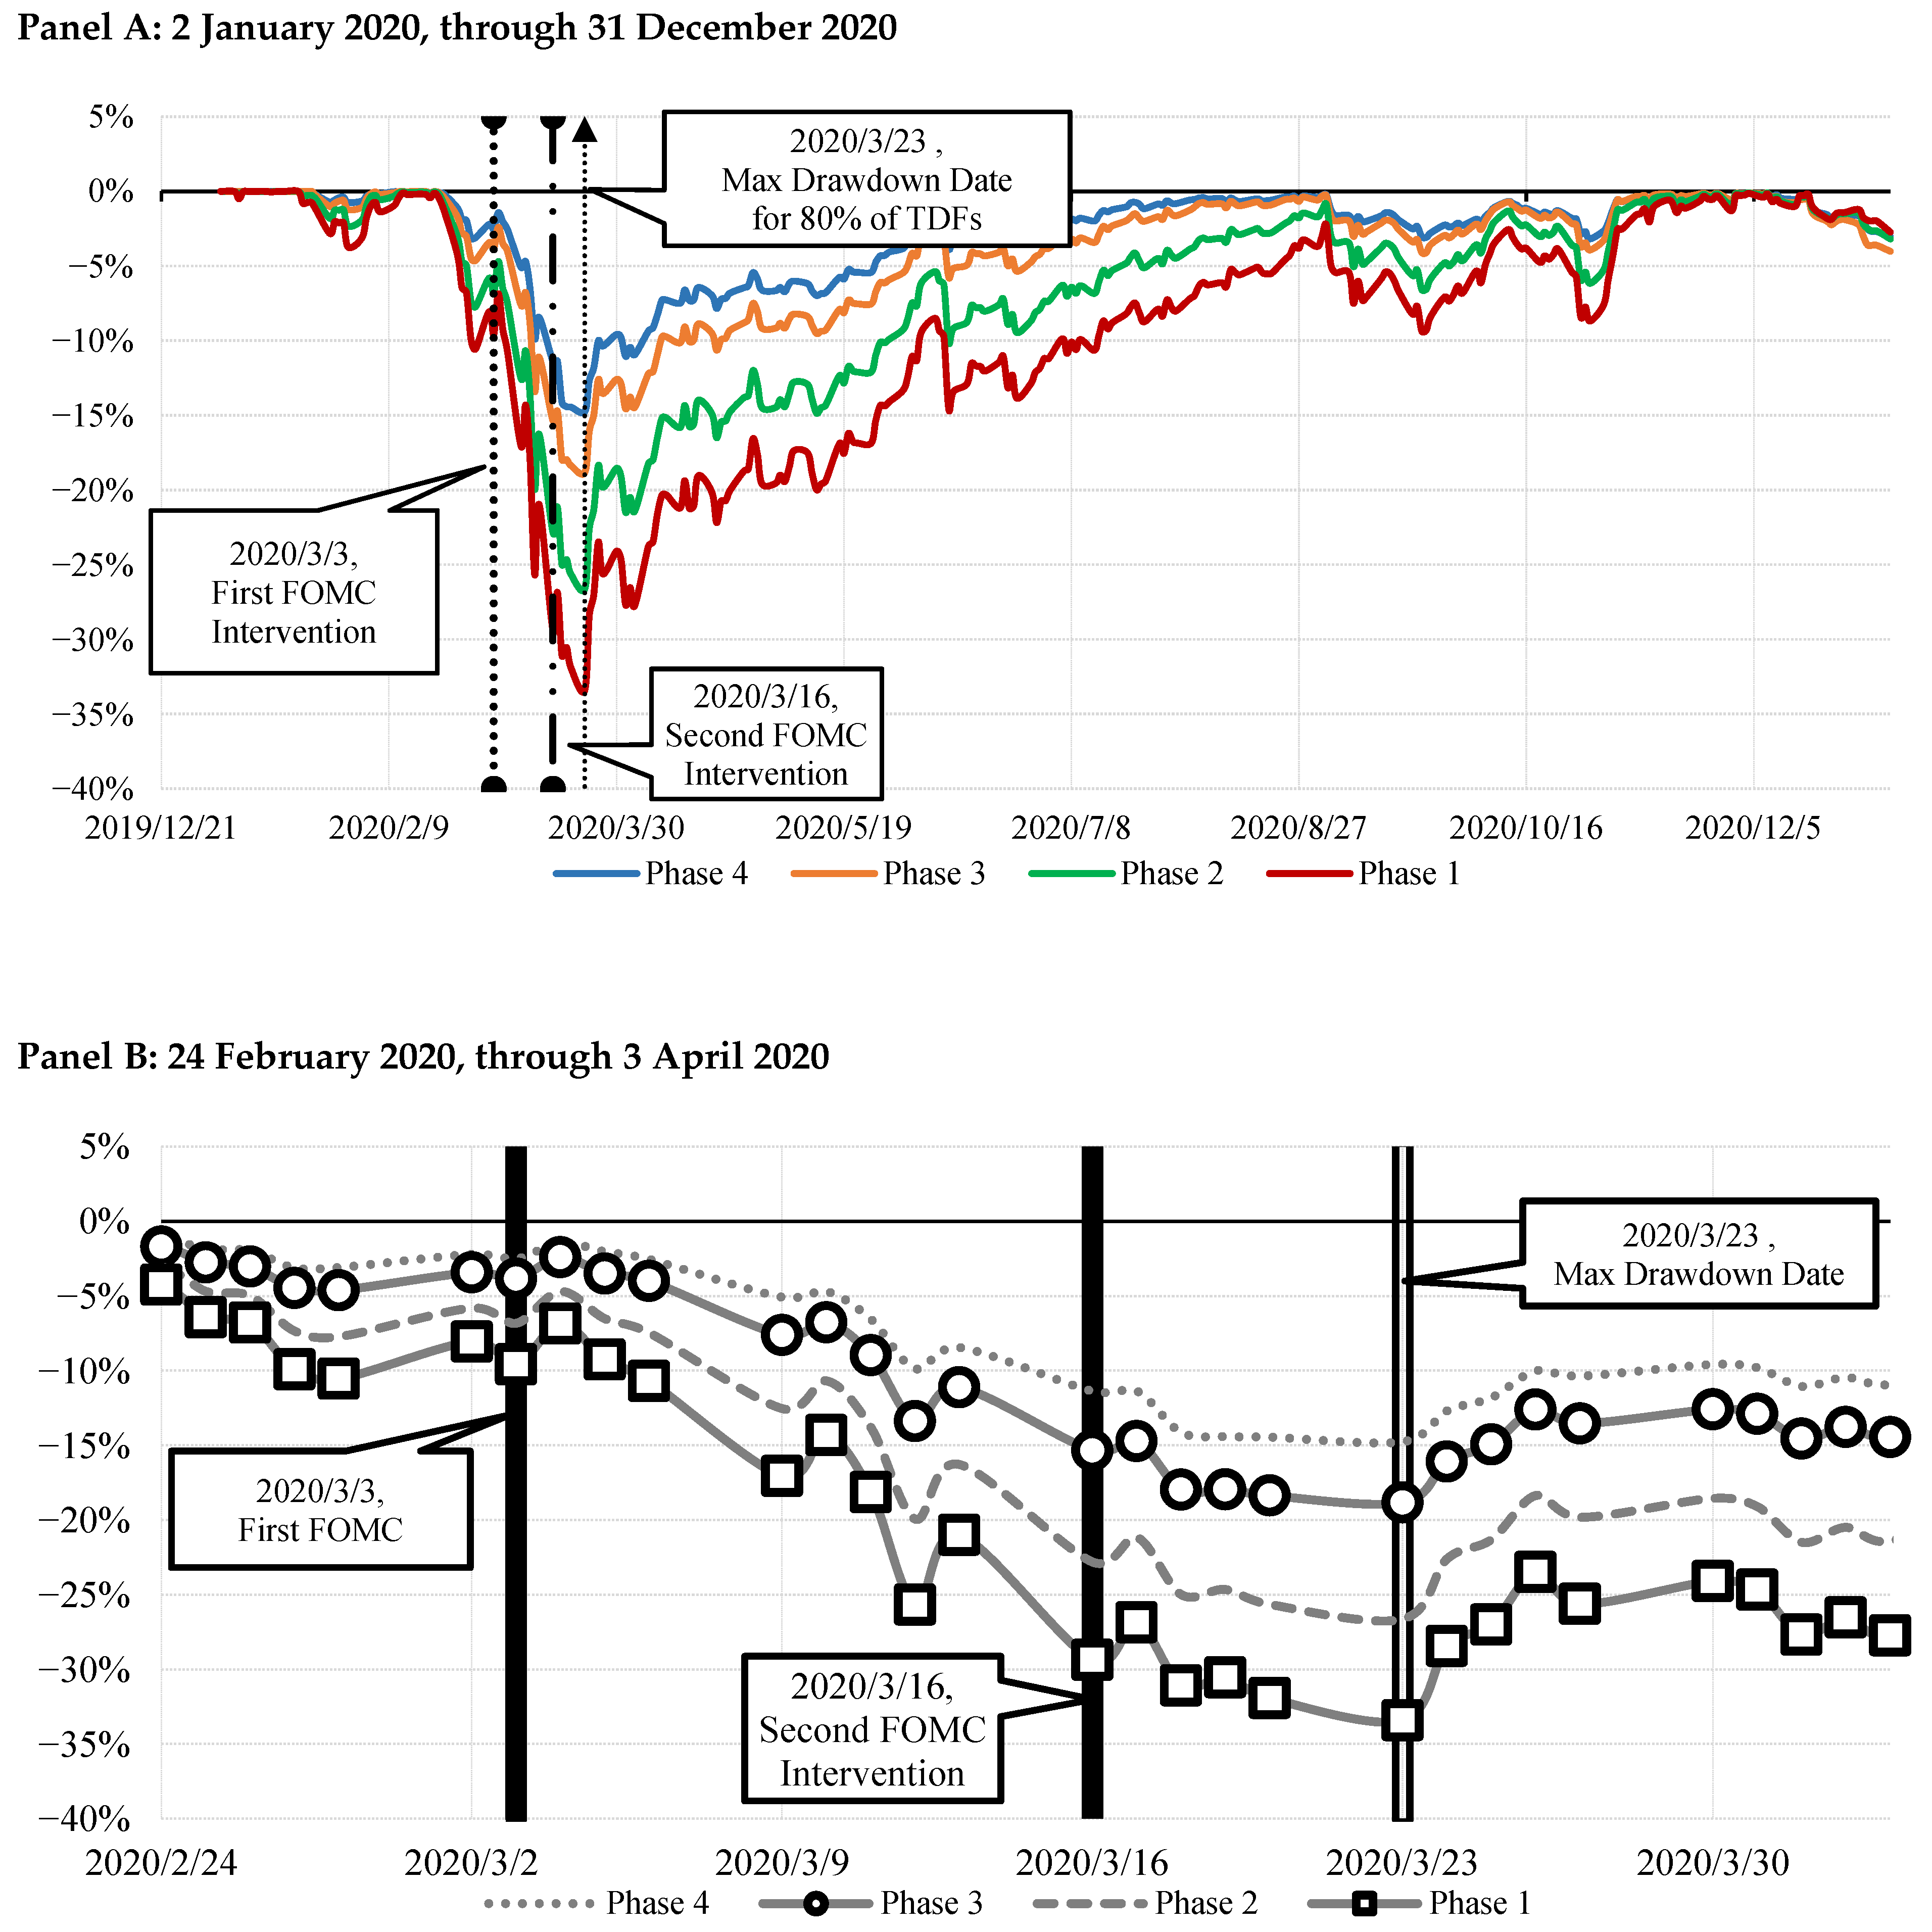
Next, we examine the impact that Federal Reserve Interventions had on helping stabilize financial markets through the lens of TDFs. The Federal Reserve first intervened on 2 March 2020, with the Federal Open Market Committee lowering the Fed Funds Target Rate by 50 basis points. Then, the Federal Reserve intervened again on 16 March 2020, by lowering the FFTR by 100 basis points. We start with an exploration of the dates at which the TDFs, by portfolio classification, 2020 reached their maximum drawdown. The results are reported in Table 2. Approximately 80% of TDFs hit their maximum drawdown on 23 March 2020. This date is one week after the second Federal Reserve intervention. Interestingly, while many of the near-dated TDFs reached their maximum drawdown before 23 March 2020, many later date counterpart funds took until March 23 to reach their maximum drawdown.
Continuing to investigate the maximum drawdown by fund category, we graph the 2020 drawdown value by portfolio classification via daily observations in Figure 5. Panel A of Figure 5 looks at the maximum drawdown values for each of the four portfolio classifications throughout the year. Identified are the two FOMC interventions and when most funds reached the maximum drawdown. The “Withdrawal” and “Retirement” portfolios recovered from their drawdowns around September 2020. The “Transition” and “Early Career” portfolios did not fully recover until December 2020. Panel B of Figure 5 enhances the graph of Panel A by focusing on the period from 24 February 2020, through 3 April 2020. This enhancement allows a better visual investigation of how the different TDF portfolio categories reacted to Federal Reserve intervention.
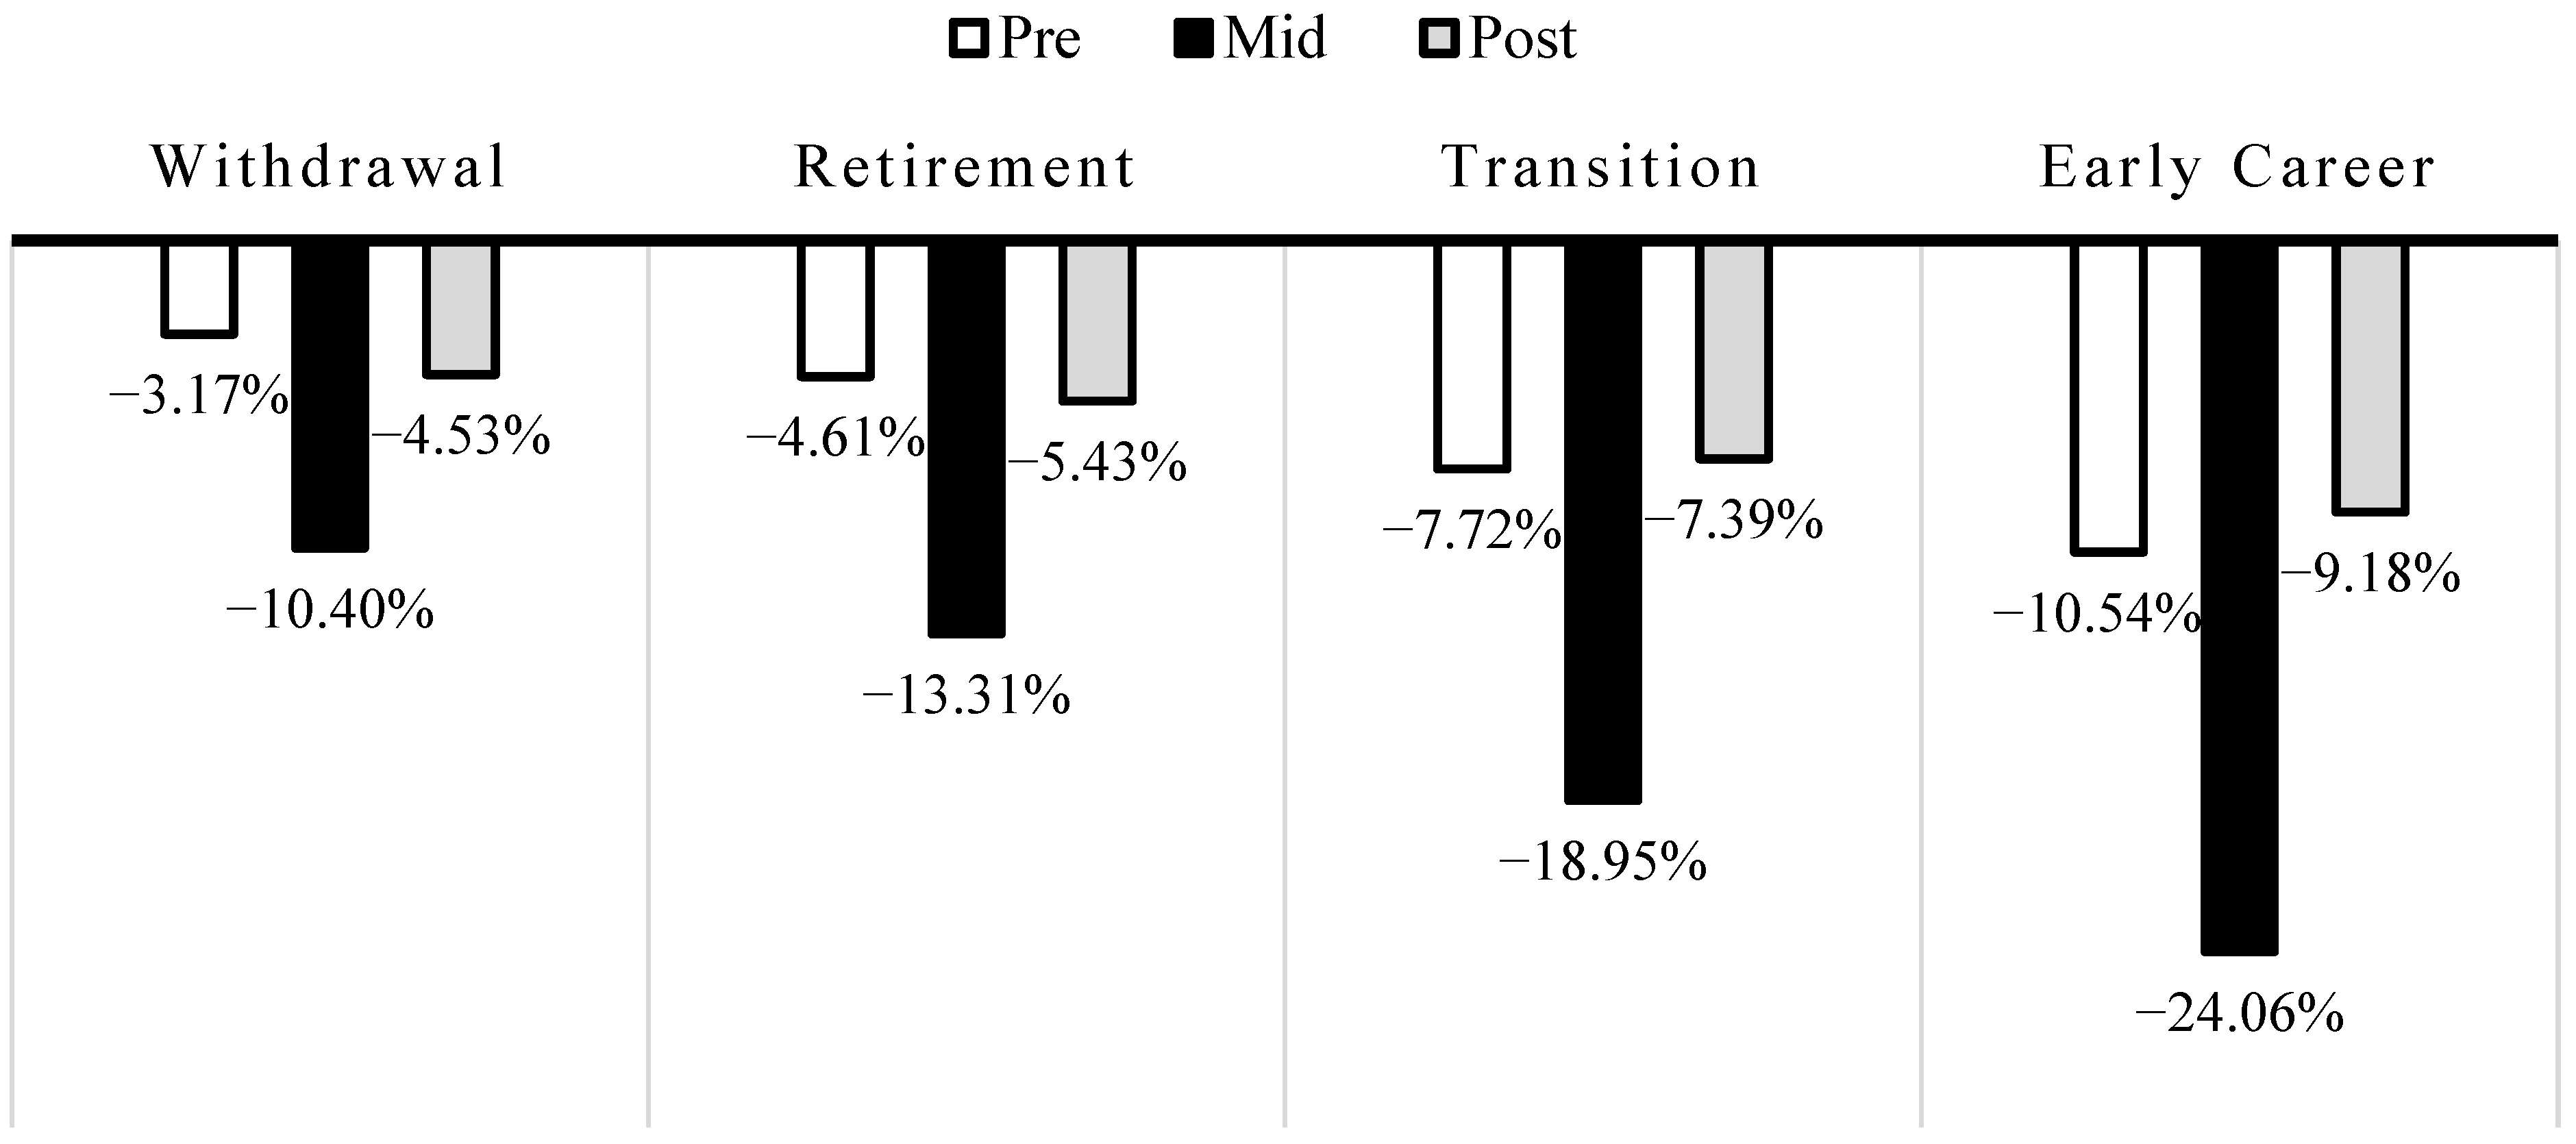
At the portfolio level, we examine the difference in maximum drawdown between the four portfolio classifications according to their glide path. We calculate the maximum drawdown for three separate periods. The first sub-sample period is identified as Period A and reflects the beginning of the 2020 year up to 2 March 2020 (the first Federal Reserve intervention). The second sub-sample period identified as Period B is the period following the first intervention and prior to the second intervention, resulting in a sub-sample period of 3 March through 15 March 2020. The final drawdown measure is calculated for the third sub-sample period, categorized as Period 3, which is the period following the second intervention (16 March 2020). These summary statistics are provided in Table 3.
In Panel A of Table 3, the Phase 4 portfolio funds experienced a maximum drawdown of 3.17% prior to the first intervention. The average maximum drawdown for the Phase 1 portfolio funds was approximately 10.54%, a difference of approximately 7.37%. Panels B and C of Table 3 show similar patterns where the drawdowns were not uniform across portfolio categories.6 In Period B, we find that the Phase 1 portfolio fund drawdown is the largest of all windows (24.06%). This finding is consistent across portfolio classification, suggesting that the period between interventions (i.e., Period B) is the window where the most significant drawdowns occurred for TDFs.
Figure 6 provides visual evidence of the maximum drawdowns by each portfolio category for each sub-sample period. A point of interest from Figure 6 is that the drawdown for the Phase 4 and Phase 3 portfolios is more significant during Period C relative to Period A. In contrast, it is the opposite for the Phase 2 and Phase 1 fund portfolios. These two portfolios experienced more significant drawdowns during Period A than during Period C. One could extrapolate from Table 4 and Figure 6 that the first intervention did not do enough to stabilize financial markets, whereas the second intervention helped alleviate pressures in the financial markets.
We now turn to cross-sectional regression analysis for the TDF drawdowns. This method is appropriate in the analysis as we are trying to understand where the differential drawdowns across portfolios come from in the sample as there is only one data point per fund for the sample period (as calculated in Equation (1)). In Panel A of Table 4, we operationalize each TDF category (e.g., Target-Date 2015, 2020) as a binary variable. For example, if the TDF has a target date of 2035, then the variable, Target-Date 2035, takes the value of one or zero, otherwise. This variable creation is done for each fund category as defined by Morningstar. The intercept in the regression is the average drawdown for the Target-Date 2000–2010 funds (base case). The drawdowns for the other funds are then compared to this reference group. Model 1 covers the entire sample period of 2020. Model 2 represents Period A, Model 3 focuses on Period B, and Model 4 targets Period C. The dependent variable in all models is the maximum drawdown calculated for each period according to Equation (1). We cluster robust standard errors in each model by fund target date category. For example, in Model 1, the drawdown for the Target-Date 2065+ funds was more significant than the base case by an additional 19.57%. During the sub-period with the most significant drawdown, Period B, the Target-Date 2060 funds experienced a drawdown 14.02% greater than the base case.
In order to derive a linear trend from moving from one fund category to another by one target date, we create the TDF Category Trend variable. Once again, we use linear regression to see what the differential drawdown in the funds experienced as one moves from one target date to the next target date. This is a count variable that is coded as a “1” for 2015 TDFs, “2” for 2020 TDFs, through “10” for 2060 TDFs, and “11” for 2065+ TDFs. The regression is then estimated with the dependent variable of the respective maximum drawdown and the independent variable being the TDF Category Trend. The estimates of these regressions are presented in Models 5 through 8 of Table 4. Across all four models, TDF Category Trend is statistically significant at the 1% level. The interpretation of this variable would suggest that for the entire sample (Model 5), moving from a 2025 TDF to a 2030 TDF would increase the maximum drawdown by 1.89% for 2020. In Model 8, moving from a 2025 TDF to a 2030 TDF would only increase the maximum drawdown by 0.48% following the second intervention.
Next, we re-estimate the regressions (Table 5) in Table 6, but change the definition of the independent variables. Instead of focusing on the fund categories, the focus is shifted to the glide path category classifications. Each portfolio category is coded as a binary variable. A linear regression analysis is estimated again to understand the differential drawdowns experienced by fund categories. For example, the Phase 2 variable represents funds found in the “Transition” portion of the glide path, consisting of TDFs with target dates of 2025, 2030, 2035, and 2040, receiving a value of “1” or “0” otherwise. Robust standard errors are clustered by fund target date category. The results in Models 1 through 4 of Table 6 show a monotonically increase in the maximum drawdown as the portfolio category moves away in regard to the retirement target date. For example, in Model 1, the Phase 4 portfolio funds experienced a drawdown of 15.01%, identified as the intercept, while the average Phase 1 fund drawdown was 18.42% greater. We create the RPC Trend variable to derive a linear trend from moving from one portfolio phase to another by one glide path category. This variable is a count variable that is coded as a “1” for funds classified as Phase 3, as “2” for funds identified as in Phase 2, and as “3” for funds classified as Phase 1 funds. The regression is then estimated with the dependent variable of the respective maximum drawdown and the independent variable being RPC Trend. The estimates of these regressions are presented in Models 5 through 8 of Table 6, with the intercept being the drawdown for Phase 4 TDFs. Focusing on Model 6, the maximum drawdown for Phase 4 funds was 2.65%, while the drawdown for Phase 3 funds was 2.59% more significant (approximately 5.24%).
Finally, we turn our attention to fee levels. The fee level designation used in the analysis is the defined fee level from Morningstar. Morningstar classifies funds as one of five fee classifications: (1) Low, (2) Below Average, (3) Average, (4) Above Average, and (5) High. The maximum drawdowns summary statistics by fee level are reported in Table 7. Once again, we analyze the data across four periods (i.e., full, Period A, Period B, and Period C). In Panel A, for example, TDFs with “High” fee levels experienced an average maximum drawdown of 27.14%. In comparison, TDFs classified with a “Low” level recorded an average maximum drawdown of -26.63% over the entire sample period. There is no obvious pattern or relationship across fee levels in all four panels. For example, there is no differential across fee levels in Panels A, B, and C. However, there is a significant differential among the fee levels in Panel D (or Period C).7
We examine the difference in average maximum drawdown between TDFs of different fee levels and across different portfolio classifications via regression analysis. In Table 8, we operationalize each fee level category (e.g., Below Average, Average) as a binary variable. For example, if the fund was identified as a "High" fee fund, then the variable, High, takes the value of one or zero, otherwise. This is done for each fee category. The intercept estimate in the regression is the average drawdown for the Low fee level funds. It is apparent in all models that the drawdown for Low fee level funds is significantly different from zero. The other fund drawdowns are then compared to this fee level group. Model 1 refers to the entire sample period of 2020. Model 2 represents Period A, Model 3 focuses on Period B, and Model 4 targets Period C. The dependent variable in all models is the maximum drawdown calculated for each period according to Equation (1). The robust standard errors in each model are clustered by fund target date category. The results in Table 8 reiterate the univariate analysis provided in Table 7. The only period that shows a differential in the fund’s maximum drawdown by fee level is during Period C, where Average and Above Average fee levels experienced a more significant drawdown of 0.49% and 0.51%, respectively, relative to the Low fee funds. The low adjusted R2 values as well as the lack of consistent significance across the variables in Table 8 reinforce the findings from the univariate analysis conducted in Table 7.
Next, we analyze the maximum drawdowns for funds by their portfolio classification (e.g., Phase 4, Phase 3) according to their location on the glide path. Results from this regression analysis are shown in Table 9. Panel A provides the estimates for Phase 4 and Phase 3 portfolio funds. Panel B shows the estimates for Phase 2 and Phase 1 portfolio funds. In Panel A, Models 1 through 4 (Phase 4 portfolios), the Low-level fee portfolios experienced less significant drawdowns relative to other fee levels. For funds that fall into the Phase 2 portfolio category, the impact that fees had on fund drawdowns is driven by Period C (Model 8). This can be interpreted as the fee level only having a differential impact during more normal market times instead of during periods of extreme volatility and uncertainty in the financial market. This finding is also in Panel B (Phase 2 portfolios). In Phase 1 portfolio regressions (Models 5 through 8), fee levels differ significantly from Low-level fee funds. However, there is not much consistency across models and fee levels. Fee levels do not seem to impact the performance of TDFs during periods of high volatility and uncertainty except for funds classified as Phase 4 funds. The Low fee phenomenon shown in prior literature is only apparent after funds reached their maximum drawdowns in 2020.
5. Conclusions
TDFs have become the default retirement fund for most retirement plan participants and comprise a significant percentage of household retirement accounts. However, these retail investors need to understand the risk-return relationship when investing in these funds for retirement. These funds must work as constructed even during a potential “black swan” event that impacts the entire financial market. We investigate whether TDFs maintain their drawdown risk relationship across target dates in a “black swan” event and across different periods in the presence of Central Bank intervention. Understanding how TDFs behave during a “black swan” event is essential, especially for those closer to their retirement date and expecting their fund to protect their retirement funds as the investments were designed.
We find that even during a “black swan” event, near-dated TDFs protect better against downside risk than later-dated funds. The design of TDFs regarding the glide path along with the risk-return allocation across financial assets maintains its’ purpose even in the presence of a significant shock to the financial markets followed by a large market selloff. Households and investors that place a sizable portion (if not all) into TDFs should feel a sense of security and assurance that their fund of choice should protect them as they move throughout their careers towards retirement. The fee levels of TDFs did not play a significant role in the drawdown risk of the fund except after market turmoil subsided. It could have been thought that maybe High fee level funds would perform better during a “black swan” event. However, that is not the case, as funds that charge higher fees still tend to underperform their Low fee counterparts.
TDFs should continue to be popular retirement account investments since one would expect the assets under management (AUM) will continue to increase. However, this increase in AUM for TDFs may lead to a decrease in volatility in the equity markets. Whether TDFs of near-dated funds protect better against downside risk than later-dated funds in the presence of a “black swan” event shall be questioned again (Parker et al. 2021). This potential lack of active investing or fundamental analysis may lead to less efficient financial markets. For now, the assumption that the TDF risk-return dynamic construction remains intact during normal and during periods of significant volatility and heightened uncertainty even in the presence of interventions by The Federal Reserve.
Author Contributions
Conceptualization, A.K.I., S.A.H. and C.L.M.; methodology, S.A.H. and C.L.M.; software, A.K.I., S.A.H. and C.L.M.; validation, A.K.I., S.A.H. and C.L.M.; formal analysis, A.K.I., S.A.H. and C.L.M.; investigation, A.K.I., S.A.H. and C.L.M.; resources, A.K.I., S.A.H. and C.L.M.; data curation, A.K.I., S.A.H. and C.L.M.; writing—original draft preparation, A.K.I., S.A.H. and C.L.M.; writing—review and editing, S.A.H. All authors have read and agreed to the published version of the manuscript.
Funding
This research received no funding.
Institutional Review Board Statement
Not applicable.
Informed Consent Statement
Not applicable.
Data Availability Statement
The universe of US-based mutual funds classified as TDFs are retrieved from Morningstar’s Advisor Workstation subscripted by Missouri State University. The daily price data for each fund are obtained via a Bloomberg terminal subscripted by Missouri State University.
Conflicts of Interest
The authors declare no conflict of interest.
| 1 | For reference see: https://www.ici.org/faqs/faq/other/faqs_target_date (accessed on 25 August 2021). |
| 2 | For reference see: https://www.jonesday.com/en/insights/2007/11/dol-issues-final-rules-for-qualified-default-investment-alternatives (accessed on 25 August 2021). |
| 3 | Available at: https://www.sec.gov/Archives/edgar/data/0001380175/000005193120000242/aftd2065497k.htm (accessed on 25 August 2021). |
| 4 | We run a one-way analysis of variance (ANOVA) and find evidence that the means of the maximum drawdowns of the TDFs by category are not the same (F-Statistic = 1194.81; Prob (F-Statistic = 0.0000)). These results are not included for brevity and are available upon request. |
| 5 | We run a one-way analysis of variance (ANOVA) and find evidence that the means of the maximum drawdowns of the TDFs by portfolio classification are not the same (F-Statistic = 2513.00; Prob (F-Statistic = 0.0000)). These results are not included for brevity and are available upon request. |
| 6 | We run a one-way analysis of variance (ANOVA) for each panel and find evidence that the means of the maximum drawdowns of the TDFs by portfolio classification are not the same (Panel A: F-Statistic = 3639.80; Prob (F-Statistic = 0.0000) | Panel B: F-Statistic = 2133.92; Prob (F-Statistic = 0.0000) | Panel C: F-Statistic = 1017.21; Prob (F-Statistic = 0.0000)). These results are not included for brevity and are available upon request. |
| 7 | We run a one-way analysis of variance (ANOVA) for each panel (Panel A: F-Statistic = 1.84; Prob (F-Statistic = 0.1188) | Panel B: F-Statistic = 0.26; Prob (F-Statistic = 0.9058) | Panel C: F-Statistic = 1.60; Prob (F-Statistic = 0.1717) | Panel D: F-Statistic = 5.57; Prob (F-Statistic = 0.0002)). These results are not included for brevity and are available upon request. |
References
- Agnew, Julie, Pierluigi Balduzzi, and Annika Sundén. 2003. Portfolio choice and trading in a large 401(k) plan. American Economic Review 93: 193–215. [Google Scholar] [CrossRef]
- Balduzzi, Pierluigi, and Jonathan Reuter. 2019. Heterogeneity in target date funds: Strategic risk-taking or risk matching? Review of Financial Studies 32: 300–37. [Google Scholar] [CrossRef]
- Bianco Research. 2018. A Brief History of Equity Mutual Funds. Available online: https://www.biancoresearch.com/a-brief-history-of-equity-mutual-funds-2/ (accessed on 25 August 2021).
- Blanchett, David. 2007. Dynamic allocation strategies for distribution portfolios: Determining the optimal distribution glide path. Journal of Financial Planning 20: 68–81. [Google Scholar]
- Chang, Edward, Thomas Krueger, and Doug Witte. 2021. Importance of costs in target date fund selection using three Morningstar ratings. Journal of Retirement 8: 66–83. [Google Scholar] [CrossRef]
- Elton, Edwin, Martin Gruber, and Christopher Blake. 2006. The adequacy of investment choices offered by 401(k) plans. Journal of Public Economics 90: 1299–314. [Google Scholar] [CrossRef]
- Elton, Edwin, Martin Gruber, Andre De Souza, and Christopher Blake. 2015. Target date funds: Characteristics and performance. Review of Asset Pricing Studies 5: 254–72. [Google Scholar] [CrossRef]
- Federal Reserve Board. 2020. The Fed-Chart: Survey of Consumer Finances, 1989–2019. Available online: https://www.federalreserve.gov/econres/scf/dataviz/scf/chart/#series:Retirement_Accounts;demographic:agecl;population:1,2,3,4,5,6;units:mean (accessed on 25 August 2021).
- Holden, Sarah, Jack VanDerhei, and Steven Bass. 2021. 401 (k) plan asset allocation, account balances, and loan activity in 2018. EBRI Issue Brief 526: 1–36. [Google Scholar] [CrossRef]
- Investment Company Institute (ICI). 2014. Target Date Funds: FAQs. Available online: https://www.ici.org/faqs/faq/other/faqs_target_date (accessed on 25 August 2021).
- Investment Company Institute (ICI). 2021a. Release: Quarterly Retirement Market Data, First Quarter 2021. Available online: https://www.ici.org/research/stats/retirement (accessed on 25 August 2021).
- Investment Company Institute (ICI). 2021b. 2021 Investment Company FACT BOOK. Available online: https://www.ici.org/system/files/2021-05/2021_factbook.pdf (accessed on 25 August 2021).
- Iyengar, Sheena, and Mark Lepper. 2000. When choice is demotivating: Can one desire too much of a good thing? Journal of Personality and Social Psychology 79: 995–1006. [Google Scholar] [CrossRef] [PubMed]
- Iyengar, Sheena, Gur Huberman, and Wei Jiang. 2004. How much choice is too much? Contributions to 401(k) retirement plans. Pension Design and Structure 83: 84–87. [Google Scholar] [CrossRef]
- Jones Day. 2007. DOL Issues Final Rules for Qualified Default Investment Alternatives. Available online: https://www.jonesday.com/en/insights/2007/11/dol-issues-final-rules-for-qualified-default-investment-alternatives (accessed on 25 August 2021).
- Madrian, Brigitte, and Dennis Shea. 2001. The power of suggestion: Inertia in 401(k) participation and savings behavior. Quarterly Journal of Economics 116: 1149–87. [Google Scholar] [CrossRef]
- Mao, Mike Qinghao, and Ching Hin Wong. 2022. Why have target-date funds performed better in the COVID-19 selloff than the 2008 selloff? Journal of Banking & Finance 135: 106367. [Google Scholar] [CrossRef]
- Miller, Jonathan, Martin Rosenburgh, and Andrew Spieler. 2011. Target Date Funds: Can One Just Glide into Retirement. Journal of International Business and Law 10: 349–58. [Google Scholar]
- Mitchell, Olivia, and Stephen Utkus. 2021. Target-date funds and portfolio choice in 401(k) plans. Journal of Pension Economics and Finance, 1–18. [Google Scholar] [CrossRef]
- Parker, Jonathan, Antoinette Schoar, and Yang Sun. 2021. Retail Financial Innovation and Stock Market Dynamics: The Case of Target Date Funds (No. w28028). Cambridge: National Bureau of Economic Research. [Google Scholar]
- Pool, Veronika, Clemens Sialm, and Irina Stefanescu. 2016. It pays to set the menu: Mutual fund investment options in 401(k) plans. Journal of Finance 71: 1779–812. [Google Scholar] [CrossRef]
- Sandhya, Vallaphuzha. 2011. Agency problems in target-date funds. SSRN Electronic Journal. [Google Scholar] [CrossRef]
- Schwartz, Barry. 2004. The Paradox of Choice: Why More Is Less. Bredebro: Ecco. [Google Scholar]
- Shoven, John, and Daniel Walton. 2021. An analysis of the performance of target date funds. Journal of Retirement 8: 43–65. [Google Scholar] [CrossRef]
- Spitzer, John, and Sandeep Singh. 2008. Shortfall risk of target-date funds during retirement. Financial Services Review 17: 143–53. [Google Scholar]
- Spitzer, John, and Sandeep Singh. 2011. Assessing the effectiveness of lifecycle (target-date) funds during the accumulation phase. Financial Services Review 20: 327–41. [Google Scholar]
- Taleb, Nassim. 2007. The Black Swan: The Impact of the Highly Improbable. New York: Random House, vol. 2. [Google Scholar]
- Tang, Ning, and Yen-Ting Lin. 2015. The efficiency of target-date funds. Journal of Asset Management 16: 131–48. [Google Scholar] [CrossRef]
- U.S. Government Accountability Office (U.S. GAO). 2011. Defined Contribution Plans: Key Information on Target Date Funds as Default Investments Should Be Provided to Plan Sponsors and Participants. Available online: https://www.gao.gov/products/gao-11-118 (accessed on 25 August 2021).
Figure 1.
Example of Glide Path for a Target Date Fund. Source: Vanguard® (https://institutional.vanguard.com/investment/solutions/target-date-funds accessed on 25 August 2021).
Figure 1.
Example of Glide Path for a Target Date Fund. Source: Vanguard® (https://institutional.vanguard.com/investment/solutions/target-date-funds accessed on 25 August 2021).

Figure 2.
Target Date Fund Investing ($USD billion). Source: Investment Company Institute (https://www.ici.org/research/stats/retirement accessed on 25 August 2021). * Data for 2021 is as of the end of the third quarter.
Figure 2.
Target Date Fund Investing ($USD billion). Source: Investment Company Institute (https://www.ici.org/research/stats/retirement accessed on 25 August 2021). * Data for 2021 is as of the end of the third quarter.

Figure 3.
LPWKX Price and Drawdown over Sample Period.

Figure 4.
Average Maximum Drawdown by Portfolios over Sample Period.

Figure 5.
Maximum Drawdown over Sample Period by Portfolio Classification.

Figure 6.
Average Maximum Drawdown by Portfolios over Sub-Sample Periods.


Table 1.
Target Date Fund Choice by Investor Age.
| Panel A: Percentage of Account Balance Invested in Balanced Funds | |||||||||||
| Age Group | Zero | >0 to 10 | >10 to 20 | >20 to 30 | >30 to 40 | >40 to 50 | >50 to 60 | >60 to 70 | >70 to 80 | >80 to 90 | >90 to 100 |
| 20s | 33.60% | 2.00% | 1.30% | 1.20% | 0.90% | 0.90% | 1.00% | 0.70% | 0.80% | 0.80% | 56.60% |
| 30s | 30.70% | 3.30% | 2.50% | 2.20% | 1.70% | 1.50% | 1.50% | 1.20% | 1.50% | 1.60% | 52.10% |
| 40s | 35.80% | 5.00% | 3.70% | 3.20% | 2.20% | 1.80% | 1.70% | 1.30% | 1.60% | 1.80% | 41.80% |
| 50s | 36.90% | 5.80% | 4.20% | 3.70% | 2.50% | 2.10% | 1.90% | 1.40% | 1.60% | 1.80% | 38.10% |
| 60s | 39.00% | 5.60% | 3.90% | 3.50% | 2.40% | 2.10% | 1.80% | 1.30% | 1.40% | 1.60% | 37.50% |
| All | 35.10% | 4.40% | 3.20% | 2.80% | 2.00% | 1.70% | 1.60% | 1.20% | 1.40% | 1.60% | 44.80% |
| Panel B: Percentage of Account Balance Invested in Target-Date Funds | |||||||||||
| Age Group | Zero | >0 to 10 | >10 to 20 | >20 to 30 | >30 to 40 | >40 to 50 | >50 to 60 | >60 to 70 | >70 to 80 | >80 to 90 | >90 to 100 |
| 20s | 38.50% | 0.90% | 0.70% | 0.80% | 0.80% | 0.70% | 0.80% | 0.60% | 0.80% | 0.80% | 54.40% |
| 30s | 39.10% | 1.80% | 1.50% | 1.60% | 1.50% | 1.20% | 1.30% | 1.00% | 1.30% | 1.50% | 48.30% |
| 40s | 44.50% | 3.10% | 2.20% | 2.10% | 1.70% | 1.40% | 1.40% | 1.20% | 1.40% | 1.70% | 39.20% |
| 50s | 47.70% | 3.70% | 2.50% | 2.40% | 1.80% | 1.50% | 1.40% | 1.20% | 1.40% | 1.70% | 34.80% |
| 60s | 49.90% | 3.60% | 2.30% | 2.20% | 1.60% | 1.40% | 1.30% | 1.00% | 1.20% | 1.40% | 33.90% |
| All | 44.20% | 2.70% | 1.90% | 1.90% | 1.50% | 1.30% | 1.30% | 1.00% | 1.20% | 1.50% | 41.50% |
| Panel C: Percentage of Account Balance Invested in Non-Target-Date Balanced Funds | |||||||||||
| Age Group | Zero | >0 to 10 | >10 to 20 | >20 to 30 | >30 to 40 | >40 to 50 | >50 to 60 | >60 to 70 | >70 to 80 | >80 to 90 | >90 to 100 |
| 20s | 94.20% | 1.50% | 0.90% | 0.50% | 0.20% | 0.20% | 0.10% | 0.10% | 0.10% | 0.05% | 2.10% |
| 30s | 89.90% | 2.50% | 1.60% | 0.90% | 0.40% | 0.30% | 0.20% | 0.20% | 0.20% | 0.10% | 3.60% |
| 40s | 88.80% | 3.40% | 2.30% | 1.40% | 0.60% | 0.40% | 0.30% | 0.10% | 0.10% | 0.10% | 2.40% |
| 50s | 86.50% | 3.70% | 2.60% | 1.80% | 0.80% | 0.60% | 0.40% | 0.20% | 0.20% | 0.20% | 3.10% |
| 60s | 86.50% | 3.50% | 2.40% | 1.80% | 0.90% | 0.60% | 0.40% | 0.20% | 0.20% | 0.10% | 3.30% |
| All | 88.80% | 3.00% | 2.00% | 1.30% | 0.60% | 0.40% | 0.30% | 0.20% | 0.20% | 0.10% | 3.10% |
Note: The data source contains 14.6 million participants and is measured at the year-end of the 2018 EBRI/ICI 401(k) database. Source: EBRI/ICI Participant-Directed Retirement Plan Data Collection Project.
Table 2.
Maximum Drawdown Statistics (Entire Sample Period).
| Panel A: Target Date Fund Category Max Drawdown | |||||
| Fund Category | N | Mean | STD | Min | Max |
| Target-Date 2000–2010 | 270 | −0.1501 | 0.0355 | −0.2475 | −0.0792 |
| Target-Date 2015 | 114 | −0.1821 | 0.0249 | −0.2376 | −0.1373 |
| Target-Date 2020 | 164 | −0.1948 | 0.0241 | −0.2475 | −0.0792 |
| Target-Date 2025 | 206 | −0.2197 | 0.0286 | −0.2745 | −0.0891 |
| Target-Date 2030 | 208 | −0.2525 | 0.0284 | −0.2941 | −0.0990 |
| Target-Date 2035 | 200 | −0.2864 | 0.0297 | −0.3137 | −0.1275 |
| Target-Date 2040 | 202 | −0.3104 | −0.0284 | −0.3529 | −0.1471 |
| Target-Date 2045 | 200 | −0.3271 | 0.0276 | −0.3627 | −0.1569 |
| Target-Date 2050 | 203 | −0.3331 | −0.0247 | −0.3627 | −0.1667 |
| Target-Date 2055 | 201 | −0.3360 | 0.0249 | −0.3627 | −0.1667 |
| Target-Date 2060 | 196 | −0.3379 | 0.0252 | −0.3725 | −0.1667 |
| Target-Date 2065+ | 53 | −0.3458 | 0.0157 | −0.3725 | −0.3168 |
| All | 2217 | −0.2689 | 0.0733 | −0.3725 | −0.0792 |
| Panel B: Max Drawdown by Portfolio Classification | |||||
| Portfolios | N | Mean | STD | Min | Max |
| Phase 4 | 270 | −0.1501 | 0.0355 | −0.2475 | −0.0792 |
| Phase 3 | 278 | −0.1896 | 0.0252 | −0.2475 | −0.0792 |
| Phase 2 | 816 | −0.2669 | 0.0447 | −0.3529 | −0.0891 |
| Phase 1 | 853 | −0.3343 | 0.0256 | −0.3725 | −0.1569 |
| All | 2217 | −0.2689 | 0.0733 | −0.3725 | −0.0792 |
Table 3.
Maximum Drawdown Date by Fund Category.
| Fund Category | March 18 | March 19 | March 20 | March 23 |
|---|---|---|---|---|
| Target-Date 2000–2010 | 84 | 50 | 41 | 95 |
| Target-Date 2015 | 32 | 1 | 19 | 62 |
| Target-Date 2020 | 33 | 4 | 43 | 84 |
| Target-Date 2025 | 31 | 12 | 36 | 127 |
| Target-Date 2030 | 13 | 0 | 15 | 180 |
| Target-Date 2035 | 3 | 0 | 13 | 184 |
| Target-Date 2040 | 2 | 0 | 8 | 192 |
| Target-Date 2045 | 2 | 0 | 3 | 195 |
| Target-Date 2050 | 2 | 0 | 0 | 201 |
| Target-Date 2055 | 2 | 0 | 0 | 199 |
| Target-Date 2060 | 2 | 0 | 0 | 194 |
| Target-Date 2065+ | 0 | 0 | 0 | 53 |
Table 4.
Maximum Drawdown Statistics by Portfolio Classification (Three Sub-Sample Periods).
| Panel A: Period A (3 January 2020, through 2 March 2020) | |||
| Portfolios | N | Mean | STD |
| Phase 4 | 270 | −0.0317 | 0.0100 |
| Phase 3 | 278 | −0.0461 | 0.0089 |
| Phase 2 | 816 | −0.0772 | 0.0163 |
| Phase 1 | 853 | −0.1054 | 0.0067 |
| All | 2217 | −0.0786 | 0.0286 |
| Panel B: Period B (3 March 2020, through 16 March 2020) | |||
| Portfolios | N | Mean | STD |
| Phase 4 | 270 | −0.1040 | 0.0213 |
| Phase 3 | 278 | −0.1331 | 0.0185 |
| Phase 2 | 816 | −0.1895 | 0.0357 |
| Phase 1 | 853 | −0.2406 | 0.0242 |
| All | 2217 | −0.1917 | 0.0555 |
| Panel C: Period C (17 March 2020, through 31 December 2020) | |||
| Portfolios | N | Mean | STD |
| Phase 4 | 270 | −0.0453 | 0.0166 |
| Phase 3 | 278 | −0.0543 | 0.0138 |
| Phase 2 | 816 | −0.0739 | 0.0150 |
| Phase 1 | 853 | −0.0918 | 0.0120 |
| All | 2217 | −0.0748 | 0.0216 |
Table 5.
Fund Category Drawdown Regressions.
| (1) | (2) | (3) | (4) | (5) | (6) | (7) | (8) | |
|---|---|---|---|---|---|---|---|---|
| Full | Period A | Period B | Period C | Full | Period A | Period B | Period C | |
| Intercept | −0.1501 ** | −0.0317 ** | −0.1040 ** | −0.0453 ** | −0.1543 ** | −0.0324 ** | −0.1064 ** | −0.0457 ** |
| (0.0000) | (0.0000) | (0.0000) | (0.0000) | (0.0064) | (0.0024) | (0.0046) | (0.0018) | |
| Target-Date 2015 | −0.0320 ** | −0.0118 ** | −0.0243 ** | −0.0086 ** | ||||
| (0.0000) | (0.0000) | (0.0000) | (0.0000) | |||||
| Target-Date 2020 | −0.0446 ** | −0.0163 ** | −0.0323 ** | −0.0092 ** | ||||
| (0.0000) | (0.0000) | (0.0000) | (0.0000) | |||||
| Target-Date 2025 | −0.0696 ** | −0.0276 ** | −0.0500 ** | −0.0163 ** | ||||
| (0.0000) | (0.0000) | (0.0000) | (0.0000) | |||||
| Target-Date 2030 | −0.1024 ** | −0.0383 ** | −0.0746 ** | −0.0236 ** | ||||
| (0.0000) | (0.0000) | (0.0000) | (0.0000) | |||||
| Target-Date 2035 | −0.1362 ** | −0.0532 ** | −0.1000 ** | −0.0339 ** | ||||
| (0.0000) | (0.0000) | (0.0000) | (0.0000) | |||||
| Target-Date 2040 | −0.1603 ** | −0.0634 ** | −0.1185 ** | −0.0408 ** | ||||
| (0.0000) | (0.0000) | (0.0000) | (0.0000) | |||||
| Target-Date 2045 | −0.1770 ** | −0.0708 ** | −0.1311 ** | −0.0449 ** | ||||
| (0.0000) | (0.0000) | (0.0000) | (0.0000) | |||||
| Target-Date 2050 | −0.1830 ** | −0.0734 ** | −0.1356 ** | −0.0468 ** | ||||
| (0.0000) | (0.0000) | (0.0000) | (0.0000) | |||||
| Target-Date 2055 | −0.1859 ** | −0.0744 ** | −0.1379 ** | −0.0474 ** | ||||
| (0.0000) | (0.0000) | (0.0000) | (0.0000) | |||||
| Target-Date 2060 | −0.1878 ** | −0.0753 ** | −0.1402 ** | −0.0470 ** | ||||
| (0.0000) | (0.0000) | (0.0000) | (0.0000) | |||||
| Target-Date 2065+ | −0.1957 ** | −0.0777 ** | −0.1431 ** | −0.0448 ** | ||||
| (0.0000) | (0.0000) | (0.0000) | (0.0000) | |||||
| TDF Category Trend | −0.0189 ** | −0.0076 ** | −0.0141 ** | −0.0048 ** | ||||
| (0.0012) | (0.0005) | (0.0009) | (0.0003) | |||||
| Adj. R2 | 0.856 | 0.919 | 0.824 | 0.649 | 0.808 | 0.869 | 0.780 | 0.604 |
| N | 2217 | 2217 | 2217 | 2217 | 2217 | 2217 | 2217 | 2217 |
Robust standard errors are clustered by fund category, and the standard errors are presented in parentheses below the respective coefficients. The symbol ** denotes statistical significance at the 0.01 level using a 2-tailed test.
Table 6.
Portfolio Category Drawdown Regressions.
| (1) | (2) | (3) | (4) | (5) | (6) | (7) | (8) | |
|---|---|---|---|---|---|---|---|---|
| Full | Period A | Period B | Period C | Full | Period A | Period B | Period C | |
| Intercept | −0.1501 ** | −0.0317 ** | −0.1040 ** | −0.0453 ** | −0.1394 ** | −0.0265 ** | −0.0956 ** | −0.0419 ** |
| (0.0000) | (0.0000) | (0.0000) | (0.0000) | (0.0106) | (0.0047) | (0.0081) | (0.0031) | |
| Phase 3 | −0.0395 ** | −0.0144 ** | −0.0291 ** | −0.0090 ** | ||||
| (0.0045) | (0.0016) | (0.0029) | (0.0002) | |||||
| Phase 2 | −0.1168 ** | −0.0455 ** | −0.0855 ** | −0.0285 ** | ||||
| (0.0179) | (0.0072) | (0.0135) | (0.0049) | |||||
| Phase 1 | −0.1842 ** | −0.0737 ** | −0.1366 ** | −0.0464 ** | ||||
| (0.0022) | (0.0009) | (0.0017) | (0.0005) | |||||
| RPC Trend | −0.0642 ** | −0.0259 ** | −0.0477 ** | −0.0163 ** | ||||
| (0.0032) | (0.0015) | (0.0025) | (0.0031) | |||||
| Adj. R2 | 0.773 | 0.831 | 0.743 | 0.579 | 0.765 | 0.820 | 0.735 | 0.571 |
| N | 2217 | 2217 | 2217 | 2217 | 2217 | 2217 | 2217 | 2217 |
Robust standard errors are clustered by fund category, and the standard errors are presented in parentheses below the respective coefficients. The symbol ** denotes statistical significance at the 0.01 level using a 2-tailed test.
Table 7.
Maximum Drawdown Statistics by Fee Level.
| Panel A: Full Sample Period (3 January 2020, through 31 December 2020) | |||
| Fee Level | N | Mean | STD |
| High | 428 | −0.2714 | 0.0718 |
| Above Average | 436 | −0.2752 | 0.0711 |
| Average | 429 | −0.2692 | 0.0718 |
| Below Average | 462 | −0.2630 | 0.0746 |
| Low | 462 | −0.2663 | 0.0765 |
| All | 2217 | −0.2689 | 0.0733 |
| Panel B: Period A (3 January 2020, through 2 March 2020) | |||
| Fee Level | N | Mean | STD |
| High | 428 | −0.0789 | 0.0287 |
| Above Average | 436 | −0.0790 | 0.0279 |
| Average | 429 | −0.7895 | 0.0278 |
| Below Average | 462 | −0.0774 | 0.0287 |
| Low | 462 | −0.0789 | 0.0296 |
| All | 2217 | −0.0786 | 0.0286 |
| Panel C: Period B (3 March 2020, through 16 March 2020) | |||
| Fee Level | N | Mean | STD |
| High | 428 | −0.1930 | 0.0544 |
| Above Average | 436 | −0.1960 | 0.0543 |
| Average | 429 | −0.1915 | 0.0562 |
| Below Average | 462 | −0.1868 | 0.0563 |
| Low | 462 | −0.1914 | 0.0561 |
| All | 2217 | −0.1917 | 0.0555 |
| Panel D: Period C (17 March 2020, through 31 December 2020) | |||
| Fee Level | N | Mean | STD |
| High | 428 | −0.0744 | 0.0201 |
| Above Average | 436 | −0.0775 | 0.0208 |
| Average | 429 | −0.0773 | 0.0222 |
| Below Average | 462 | −0.0728 | 0.0210 |
| Low | 462 | −0.0724 | 0.0230 |
| All | 2217 | −0.0748 | 0.0216 |
Table 8.
Fee Level Drawdown Regressions.
| (1) | (2) | (3) | (4) | |
|---|---|---|---|---|
| Full | Period A | Period B | Period C | |
| Intercept | −0.2663 ** | −0.0789 ** | −0.1914 ** | −0.0724 ** |
| (0.0036) | (0.0014) | (0.0026) | (0.0011) | |
| Below Average | 0.0033 | 0.0014 | 0.0046 | −0.0004 |
| (0.0050) | (0.0019) | (0.0037) | (0.0015) | |
| Average | −0.0030 | −0.0001 | −0.0001 | −0.0049 ** |
| (0.0050) | (0.0019) | (0.0038) | (0.0015) | |
| Above Average | −0.0090 + | −0.0001 | −0.0046 | −0.0051 ** |
| (0.0049) | (0.0019) | (0.0037) | (0.0015) | |
| High | −0.0051 | −0.0000 | −0.0016 | −0.0020 |
| (0.0050) | (0.0020) | (0.0037) | (0.0014) | |
| Adj. R2 | 0.002 | −0.001 | 0.001 | 0.008 |
| N | 2217 | 2217 | 2217 | 2217 |
Robust standard errors are clustered by fund category, and the standard errors are presented in parentheses below the respective coefficients. The symbols + and ** denote statistical significance at the 0.10 and 0.01 levels, respectively, using a 2-tailed test.
Table 9.
Fee Level Drawdown Regressions by Phase.
| Panel A: Phase 4 and Phase 3 Regressions | ||||||||
| Phase 4 Funds | Phase 3 Funds | |||||||
| (1) | (2) | (3) | (4) | (5) | (6) | (7) | (8) | |
| Full | Period A | Period B | Period C | Full | Period A | Period B | Period C | |
| Intercept | −0.1322 ** | −0.0288 ** | −0.0952 ** | −0.0364 ** | −0.1792 ** | −0.0446 ** | −0.1282 ** | −0.0473 ** |
| (0.0039) | (0.0012) | (0.0025) | (0.0016) | (0.0026) | (0.0012) | (0.0018) | (0.0013) | |
| Below Average | −0.0174 * | −0.0035 + | −0.0103 ** | −0.0073 * | −0.0082 + | −0.0008 | −0.0029 | −0.0052 ** |
| (0.0067) | (0.0019) | (0.0039) | (0.0028) | (0.0046) | (0.0017) | (0.0035) | (0.0020) | |
| Average | −0.0190 ** | −0.0028 | −0.0082 * | −0.0109 ** | −0.0189 ** | −0.0038 * | −0.0112 ** | −0.0139 ** |
| (0.0059) | (0.0018) | (0.0038) | (0.0027) | (0.0042) | (0.0017) | (0.0030) | (0.0027) | |
| Above Average | −0.0300 ** | −0.0050 ** | −0.0154 ** | −0.0150 ** | −0.0133 ** | −0.0019 | −0.0046 | −0.0099 ** |
| (0.0062) | (0.0019) | (0.0038) | (0.0028) | (0.0045) | (0.0017) | (0.0034) | (0.0022) | |
| High | −0.0239 ** | −0.0035 + | −0.0103 ** | −0.0122 ** | −0.0116 ** | −0.0011 | −0.0061 * | −0.0064 ** |
| (0.0059) | (0.0018) | (0.0038) | (0.0027) | (0.0040) | (0.0017) | (0.0028) | (0.0022) | |
| Adj. R2 | 0.067 | 0.012 | 0.041 | 0.084 | 0.049 | 0.007 | 0.026 | 0.103 |
| N | 270 | 270 | 270 | 270 | 278 | 278 | 278 | 278 |
| Panel B: Phase 2 and Phase 1 Regressions | ||||||||
| Phase 2 Portfolios | Phase 1 Portfolios | |||||||
| (1) | (2) | (3) | (4) | (5) | (6) | (7) | (8) | |
| Full | Period A | Period B | Period C | Full | Period A | Period B | Period C | |
| Intercept | −0.2646 ** | −0.0770 ** | −0.1900 ** | −0.0714 ** | −0.3348 ** | −0.1062 ** | −0.2410 ** | −0.0919 ** |
| (0.0031) | (0.0013) | (0.0024) | (0.0012) | (0.0015) | (0.0005) | (0.0015) | (0.0007) | |
| Below Average | 0.0051 | 0.0014 | 0.0067 + | −0.0009 | 0.0050 + | 0.0011 | 0.0046 + | 0.0019 + |
| (0.0048) | (0.0018) | (0.0038) | (0.0016) | (0.0028) | (0.0007) | (0.0027) | (0.0011) | |
| Average | −0.0029 | −0.0006 | 0.0008 | −0.0053 ** | 0.0045 | 0.0014 * | 0.0032 | −0.0005 |
| (0.0049) | (0.0018) | (0.0039) | (0.0018) | (0.0030) | (0.0007) | (0.0029) | (0.0014) | |
| Above Average | −0.0076 | −0.0004 | −0.0029 | −0.0039 * | −0.0052 * | 0.0010 | −0.0048 ** | −0.0023 + |
| (0.0046) | (0.0018) | (0.0036) | (0.0016) | (0.0020) | (0.0007) | (0.0018) | (0.0013) | |
| High | −0.0074 | −0.0019 | −0.0031 | −0.0027 + | −0.0017 | 0.0004 | −0.0010 | 0.0014 |
| (0.0047) | (0.0018) | (0.0036) | (0.0016) | (0.0023) | (0.0007) | (0.0021) | (0.0011) | |
| Adj. R2 | 0.007 | −0.001 | 0.005 | 0.012 | 0.018 | 0.001 | 0.014 | 0.010 |
| N | 816 | 816 | 816 | 816 | 853 | 853 | 853 | 853 |
Robust standard errors are clustered by fund category, and the standard errors are presented in parentheses below the respective coefficients. The symbols +, *, and ** denote statistical significance at the 0.10, 0.05, and 0.01 levels, respectively, using a 2-tailed test.
Publisher’s Note: MDPI stays neutral with regard to jurisdictional claims in published maps and institutional affiliations. |
© 2022 by the authors. Licensee MDPI, Basel, Switzerland. This article is an open access article distributed under the terms and conditions of the Creative Commons Attribution (CC BY) license (https://creativecommons.org/licenses/by/4.0/).
Share and Cite
MDPI and ACS Style
Iyer, A.K.; Hoelscher, S.A.; Mbanga, C.L. Target Date Funds, Drawdown Risk, and Central Bank Intervention: Evidence during the COVID-19 Pandemic. J. Risk Financial Manag. 2022, 15, 408. https://doi.org/10.3390/jrfm15090408
AMA Style
Iyer AK, Hoelscher SA, Mbanga CL. Target Date Funds, Drawdown Risk, and Central Bank Intervention: Evidence during the COVID-19 Pandemic. Journal of Risk and Financial Management. 2022; 15(9):408. https://doi.org/10.3390/jrfm15090408
Chicago/Turabian StyleIyer, Arjun K., Seth A. Hoelscher, and Cédric L. Mbanga. 2022. "Target Date Funds, Drawdown Risk, and Central Bank Intervention: Evidence during the COVID-19 Pandemic" Journal of Risk and Financial Management 15, no. 9: 408. https://doi.org/10.3390/jrfm15090408