Breath Analysis of COVID-19 Patients in a Tertiary UK Hospital by Optical Spectrometry: The E-Nose CoVal Study

 , , ,
, , , 
Abstract
:1. Introduction
2. Materials and Methods
2.1. Patient Group
2.2. Breath Sampling
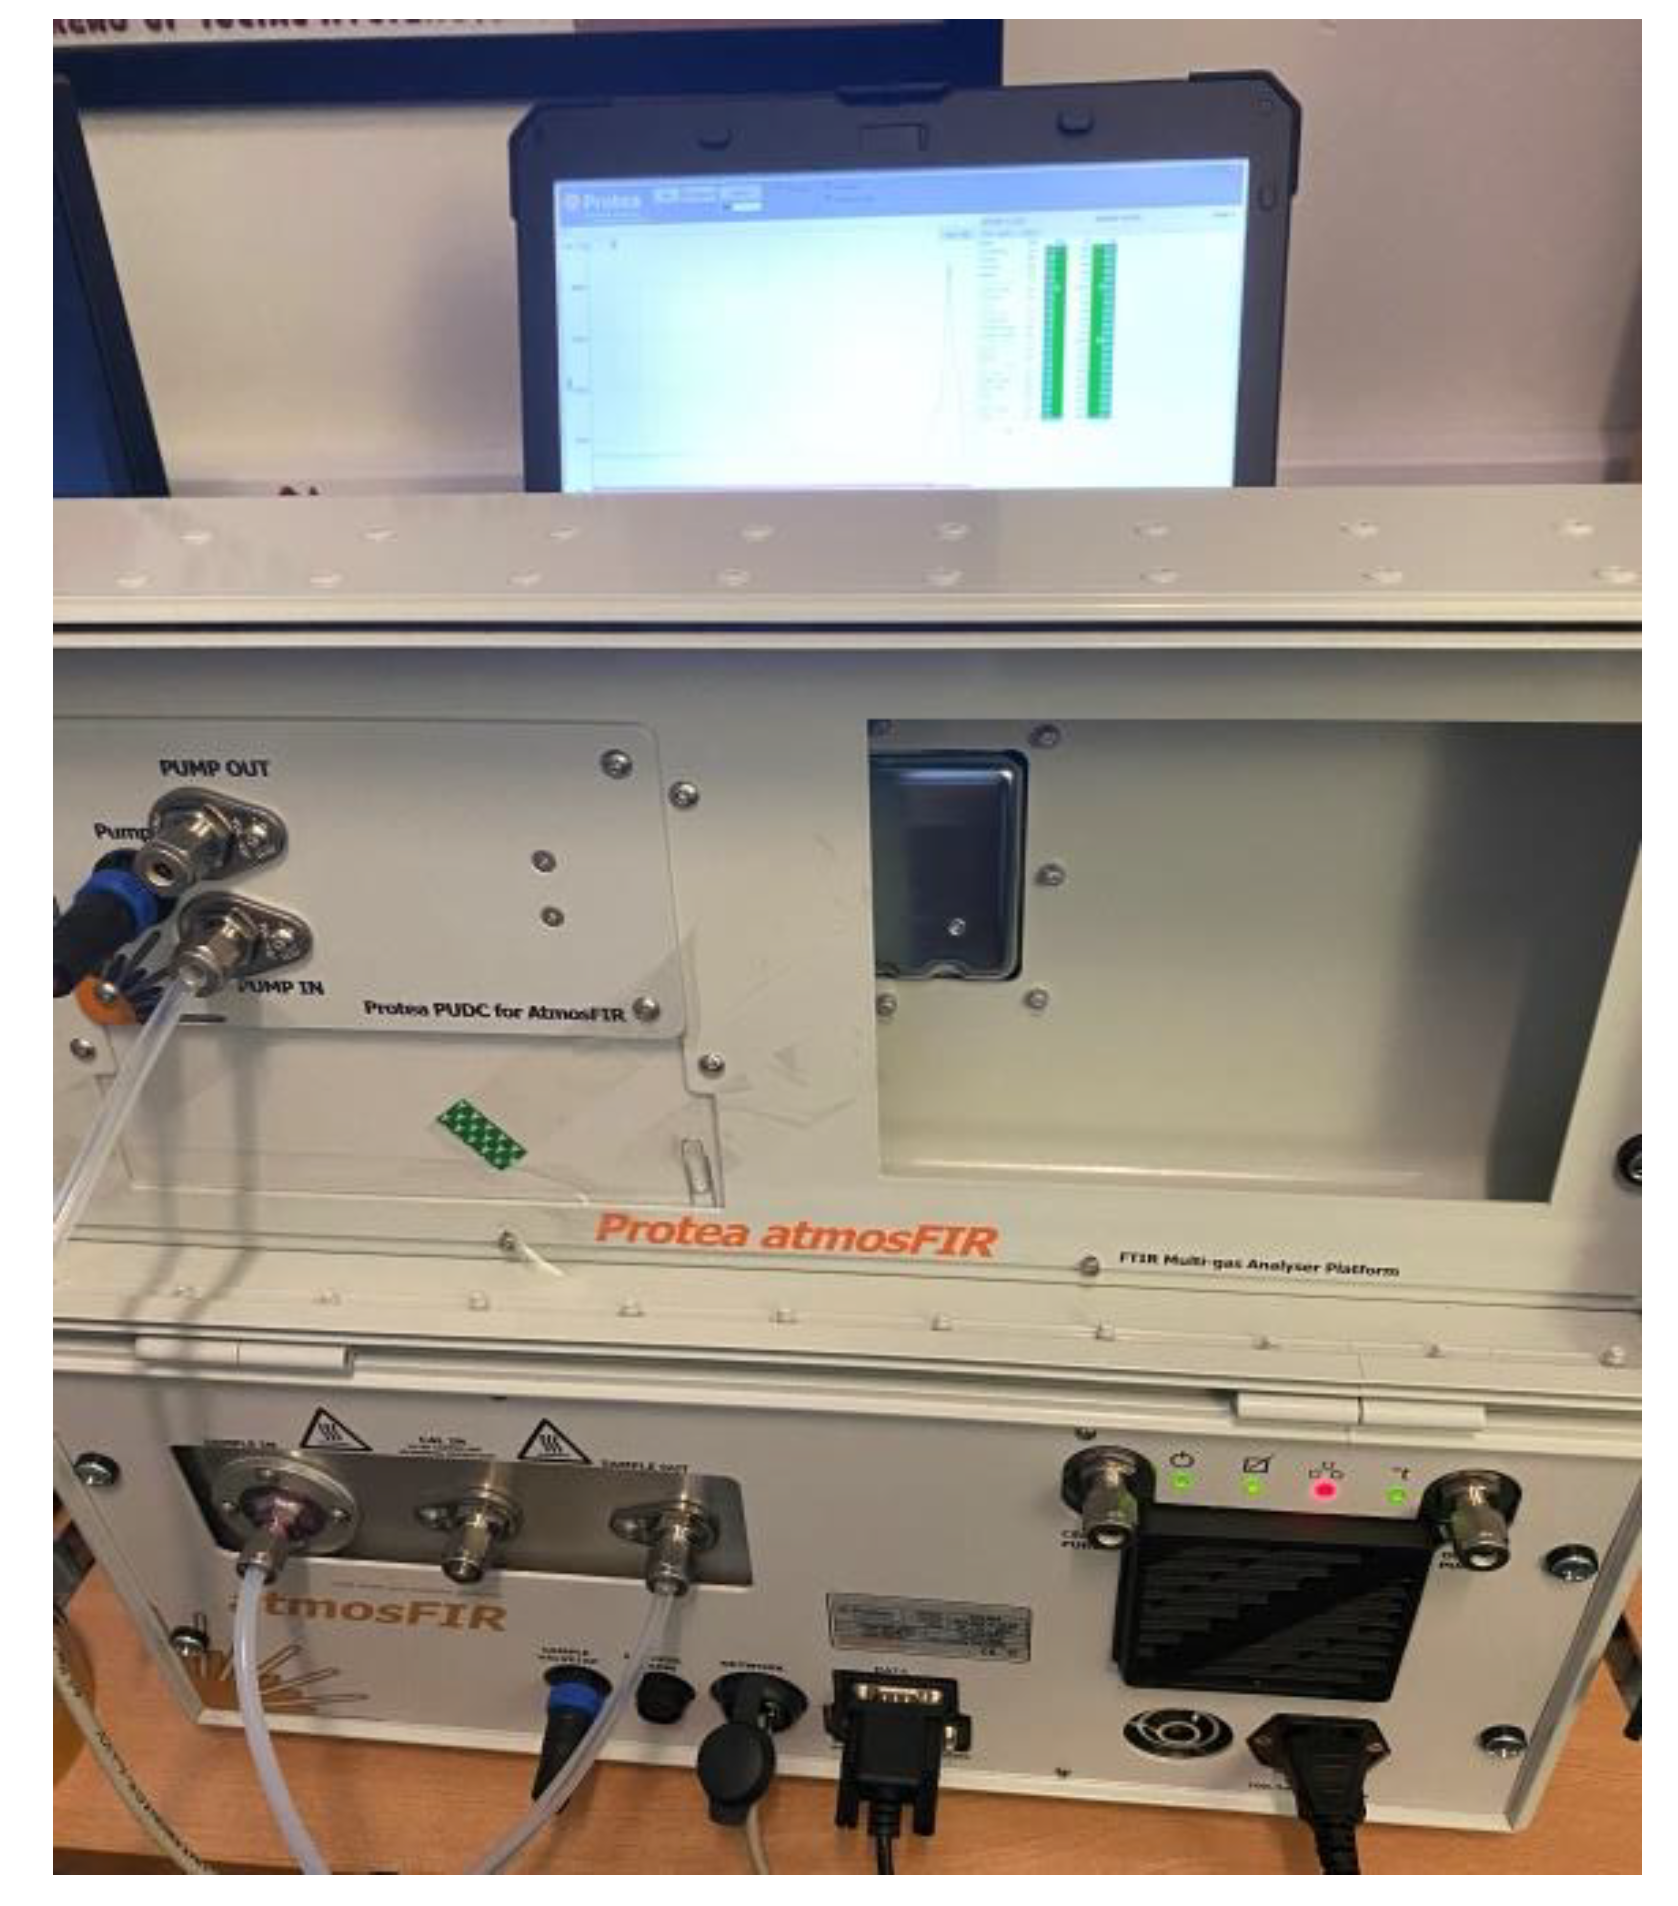
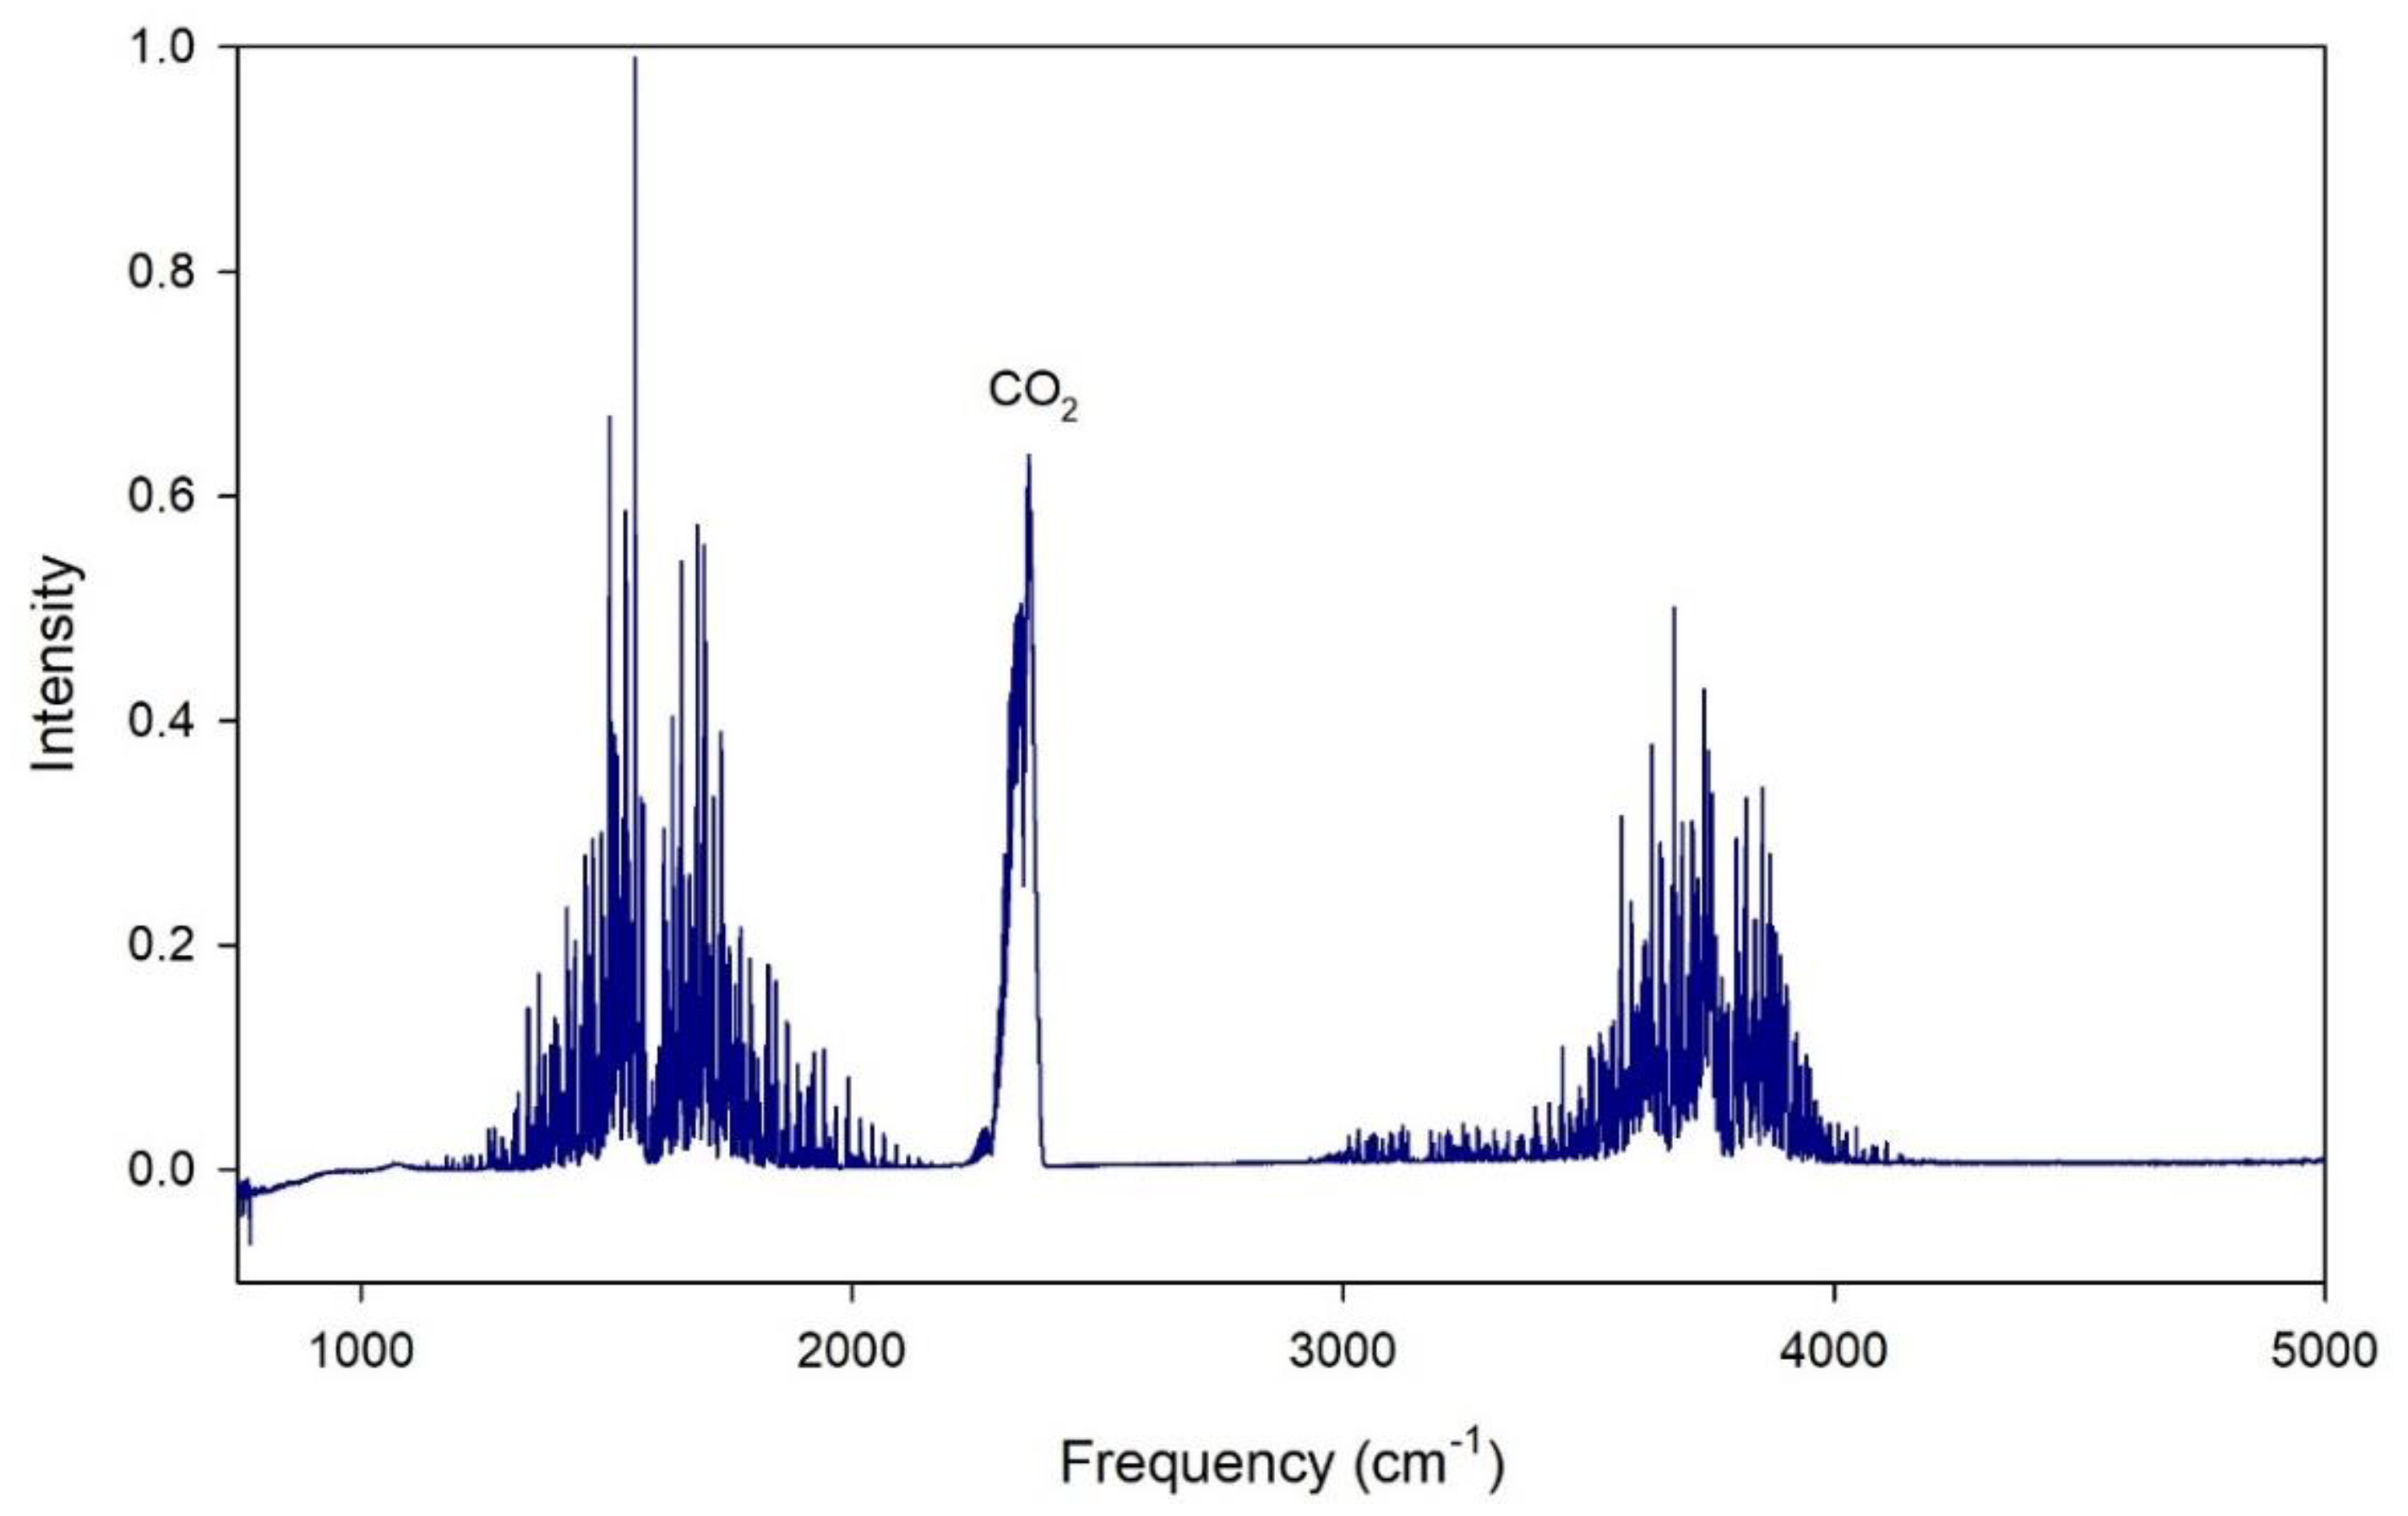
2.3. Breath Analyser
2.4. Data Analysis
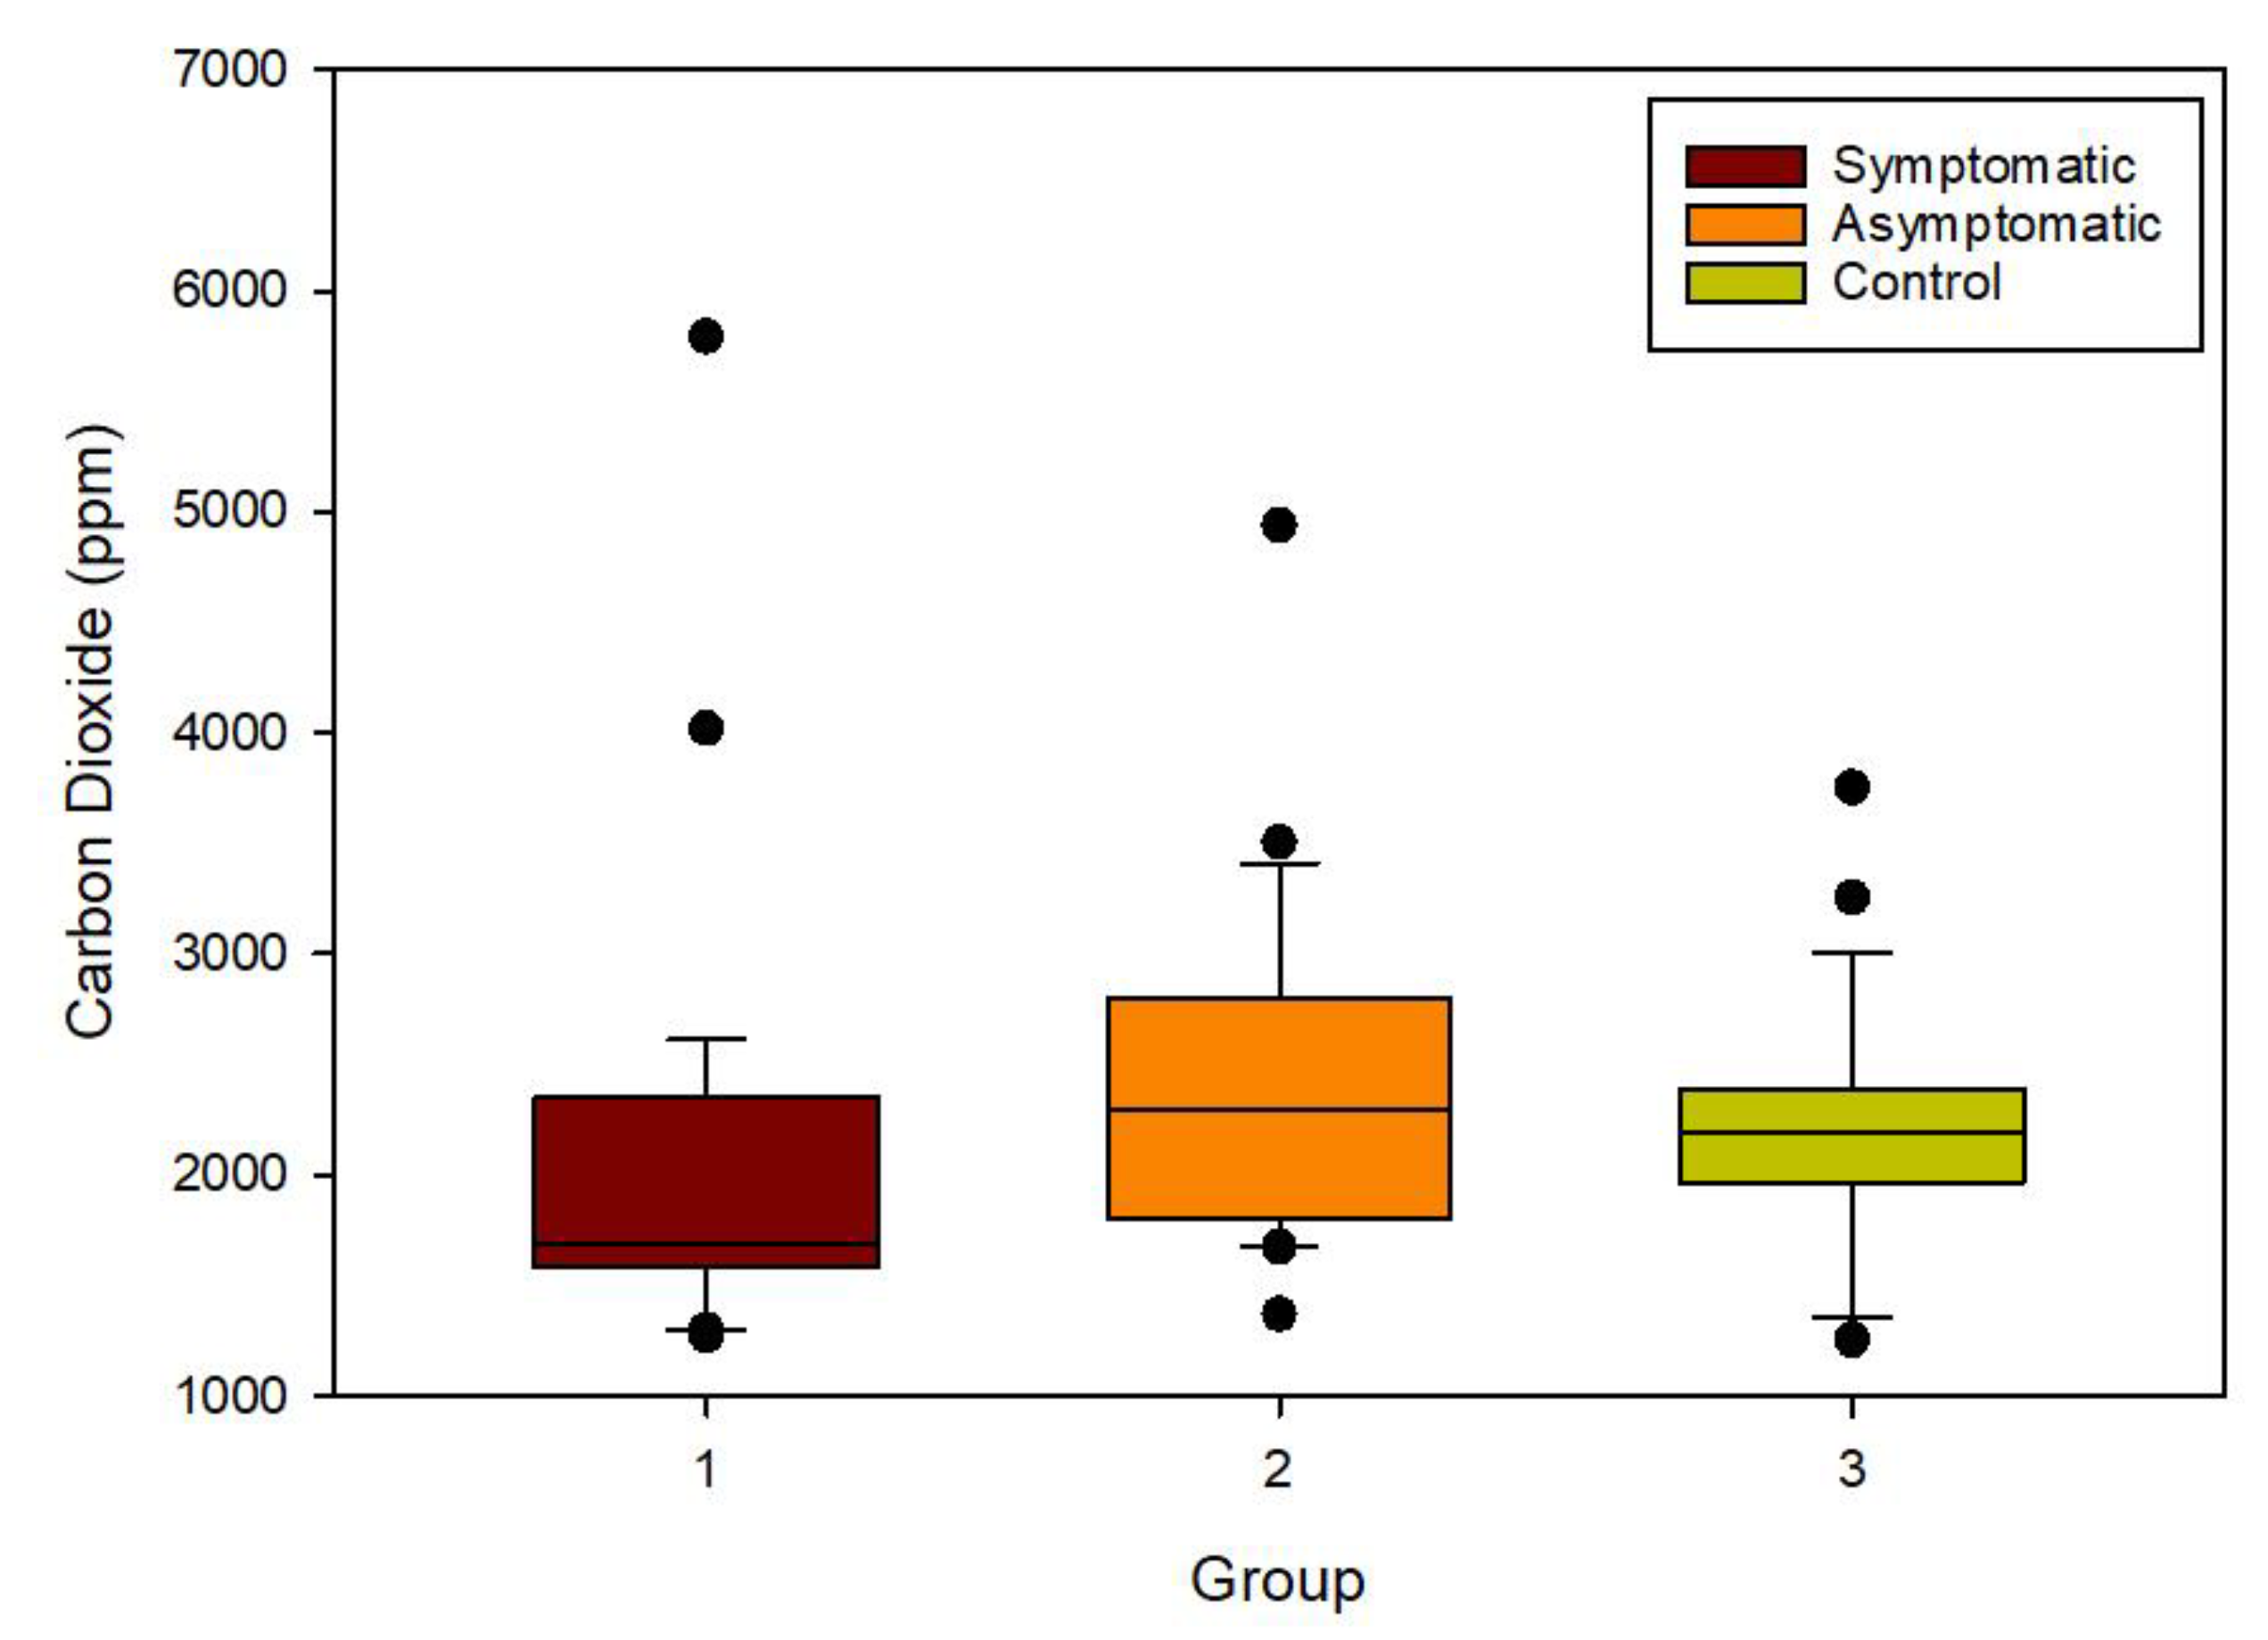
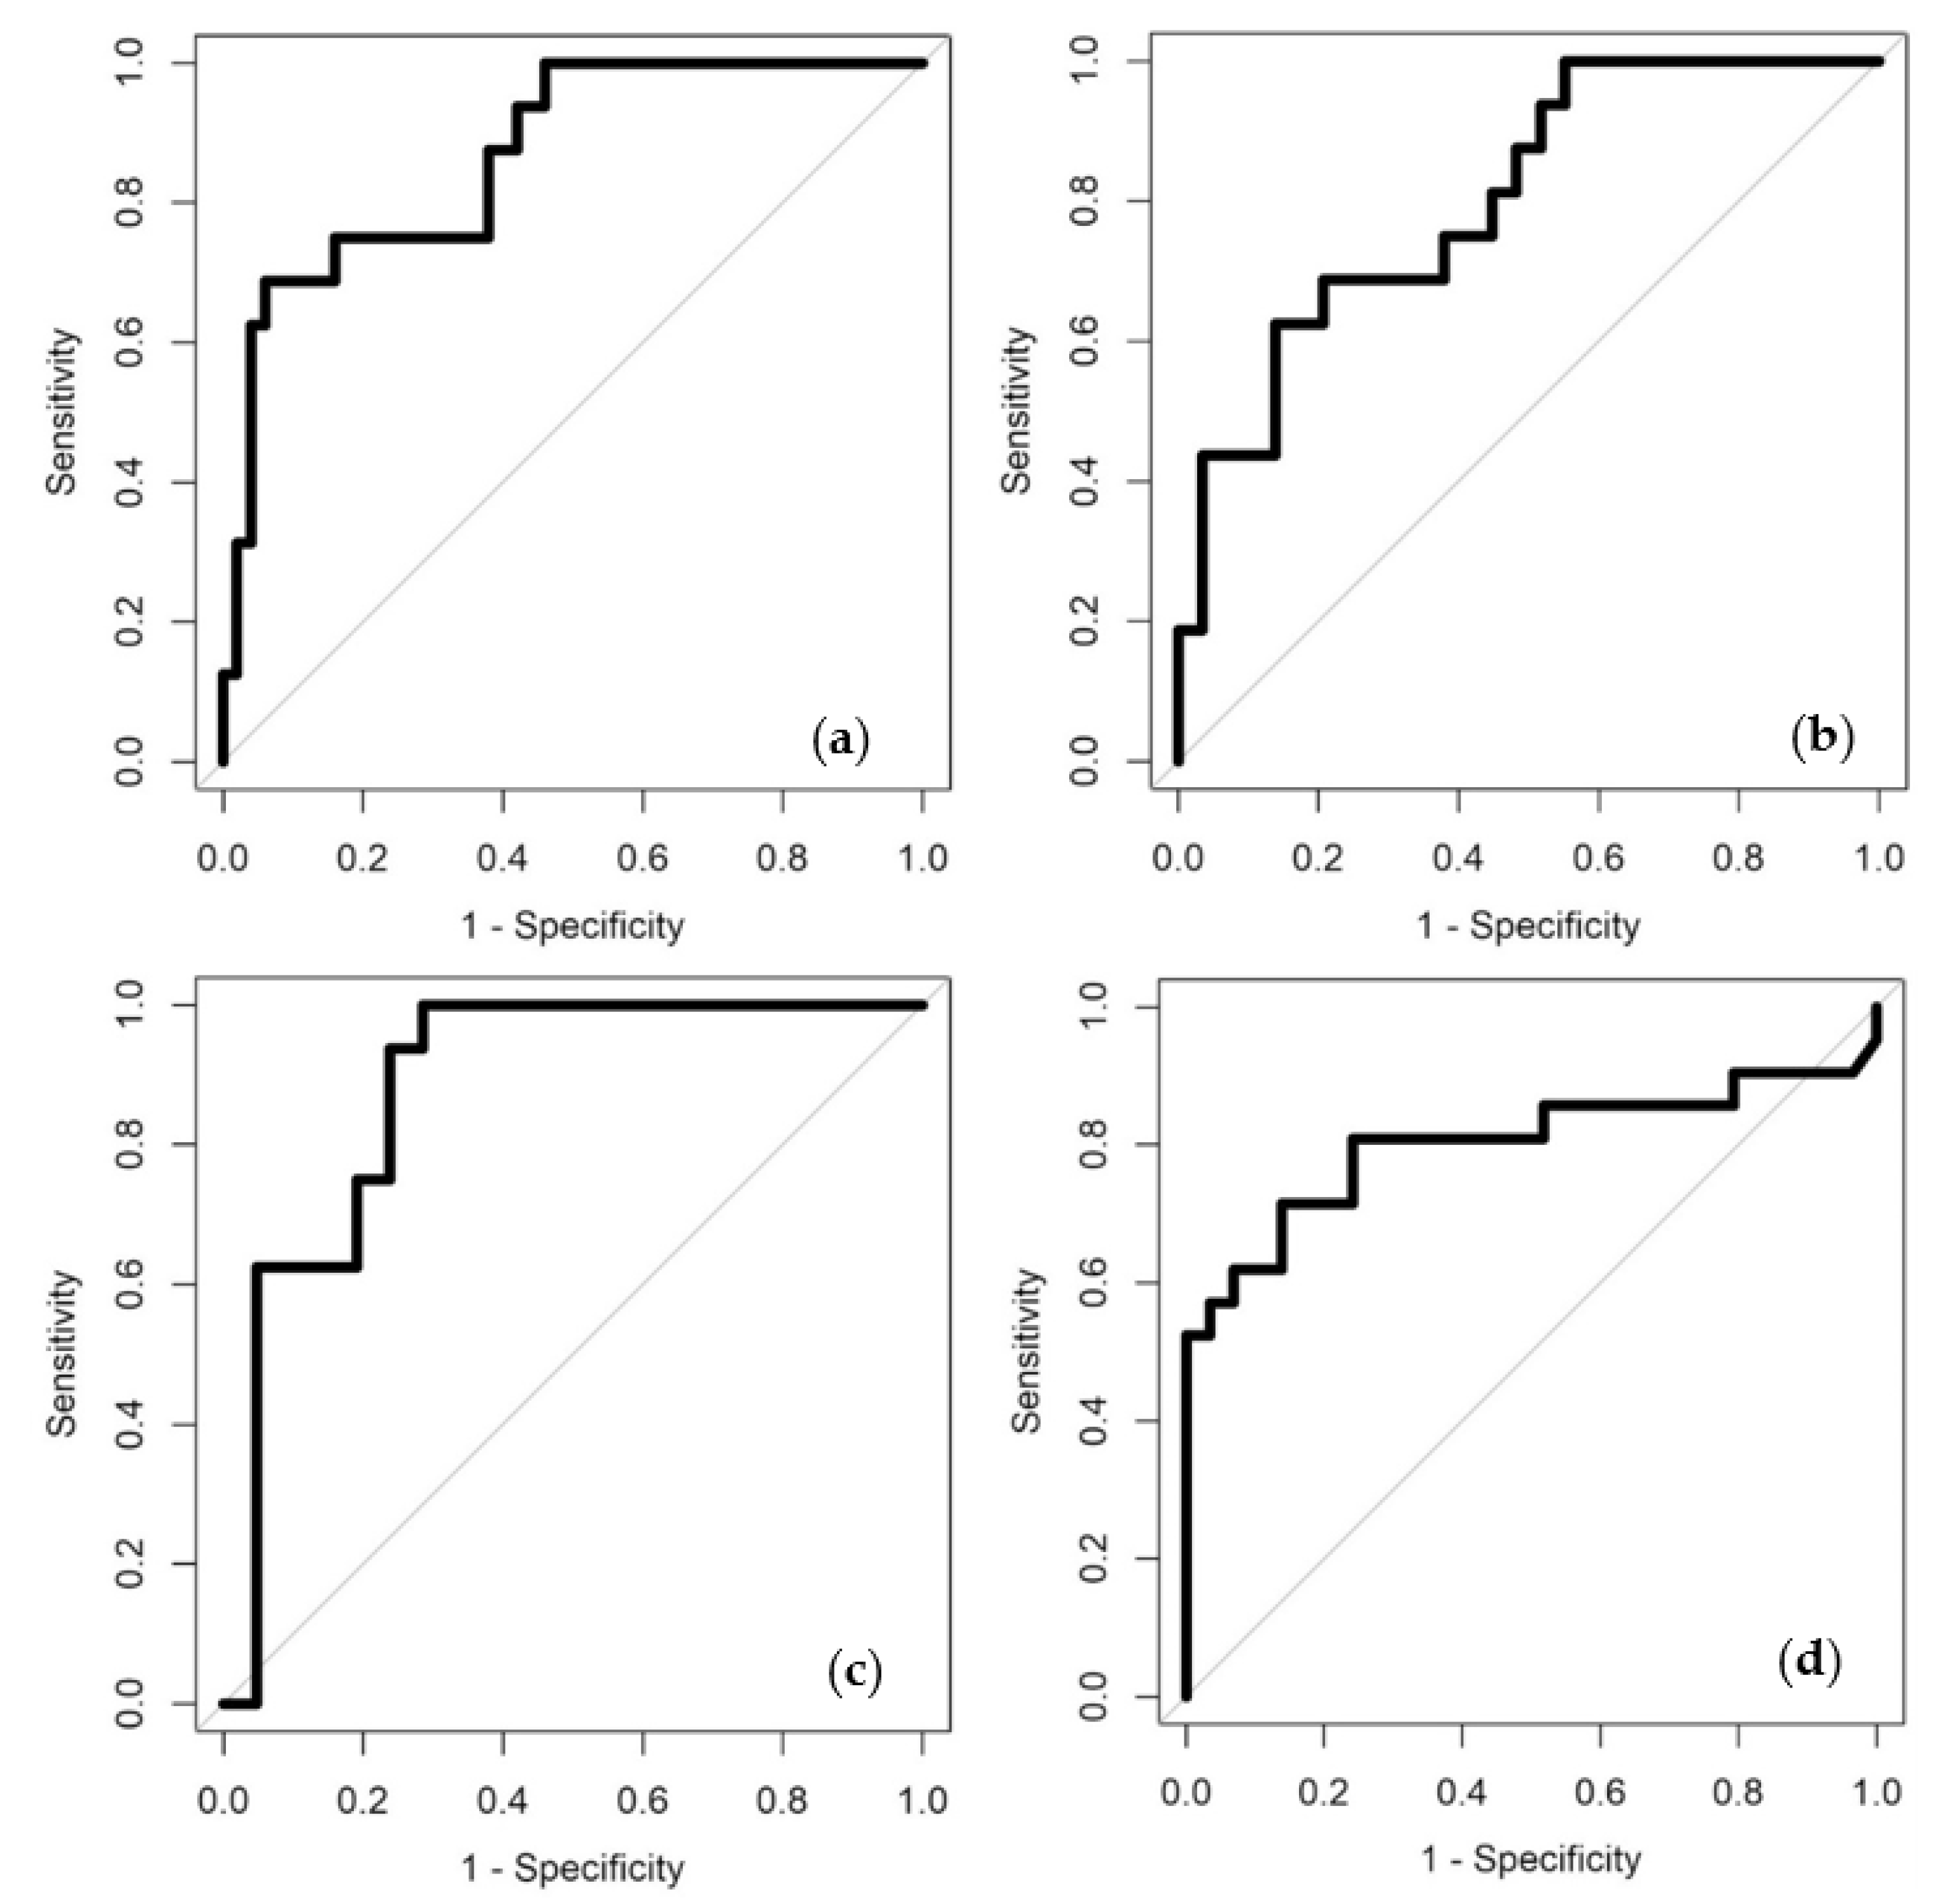
3. Results
4. Discussion
5. Conclusions
Author Contributions
Funding
Institutional Review Board Statement
Informed Consent Statement
Data Availability Statement
Acknowledgments
Conflicts of Interest
References
- Subali, A.D.; Wiyono, L.; Yusuf, M.; Zaky, M.F.A. The potential of volatile organic compounds-based breath analysis for COVID-19 screening: A systematic review & meta-analysis. Diagn. Microbiol. Infect. Dis. 2021, 102, 115589. [Google Scholar] [CrossRef] [PubMed]
- Vandenberg, O.; Martiny, D.; Rochas, O.; van Belkum, A.; Kozlakidis, Z. Considerations for diagnostic COVID-19 tests. Nat. Rev. Microbiol. 2021, 19, 171–183. [Google Scholar] [CrossRef] [PubMed]
- Giri, B.; Pandey, S.; Shrestha, R.; Pokharel, K.; Ligler, F.S.; Neupane, B.B. Review of analytical performance of COVID-19 detection methods. Anal. Bioanal. Chem. 2020, 413, 35–48. [Google Scholar] [CrossRef] [PubMed]
- Tang, Y.; Xu, K.; Zhao, B.; Zhang, M.; Gong, C.; Wan, H.; Wang, Y.; Yang, Z. A novel electronic nose for the detection and classification of pesticide residue on apples. RSC Adv. 2021, 11, 20874–20883. [Google Scholar] [CrossRef]
- Labanska, M.; van Amsterdam, S.; Jenkins, S.; Clarkson, J.P.; Covington, J.A. Preliminary Studies on Detection of Fusarium Basal Rot Infection in Onions and Shallots Using Electronic Nose. Sensors 2022, 22, 5453. [Google Scholar] [CrossRef]
- Zhao, R.; Qin, J.; Chen, T.; Wang, L.; Wu, J. Experimental study on co-combustion of low rank coal semicoke and oil sludge by TG-FTIR. Waste Manag. 2020, 116, 91–99. [Google Scholar] [CrossRef] [PubMed]
- Moufid, M.; Bouchikhi, B.; Tiebe, C.; Bartholmai, M.; El Bari, N. Assessment of outdoor odor emissions from polluted sites using simultaneous thermal desorption-gas chromatography-mass spectrometry (TD-GC-MS), electronic nose in conjunction with advanced multivariate statistical approaches. Atmospheric Environ. 2021, 256, 118449. [Google Scholar] [CrossRef]
- Esfahani, S.; Wicaksono, A.; Mozdiak, E.; Arasaradnam, R.P.; Covington, J.A. Non-Invasive Diagnosis of Diabetes by Volatile Organic Compounds in Urine Using FAIMS and Fox4000 Electronic Nose. Biosensors 2018, 8, 121. [Google Scholar] [CrossRef] [Green Version]
- Wilson, A.D. Developing Electronic-nose Technologies for Clinical Practice. J. Med. Surg. Pathol. 2018, 3, 169–171. [Google Scholar] [CrossRef]
- Wulandari, S.A.; Pramitasari, R.; Madnasri, S. Susilo Electronic Noses for Diabetes Mellitus Detection: A Review. Int. Semin. Appl. Technol. Inf. Commun. 2020, 364–369. [Google Scholar] [CrossRef]
- Wintjens, A.G.W.E.; Hintzen, K.F.H.; Engelen, S.M.E.; Lubbers, T.; Savelkoul, P.H.M.; Wesseling, G.; van der Palen, J.A.M.; Bouvy, N.D. Applying the electronic nose for pre-operative SARS-CoV-2 screening. Surg. Endosc. 2020, 35, 6671–6678. [Google Scholar] [CrossRef] [PubMed]
- Slingers, G.; De Vries, R.; Vigeveno, R.M.; Mulder, S.; Farzan, N.; Vintges, D.R.; Goeman, J.J.; Bruisten, S.; Van Den Corput, B.; Geelhoed, M.J.J.; et al. Ruling Out SARS-CoV-2 Infeciton Using Exhaled Breath Analysis by Electronic Nose in a Public Health Setting. Epidemiology and translational advances inSARS-COV-2. Am. Thorac. Soc. 2021, 203, A3768. [Google Scholar]
- Kwiatkowski, A.; Borys, S.; Sikorska, K.; Drozdowska, K.; Smulko, J.M. Clinical studies of detecting COVID-19 from exhaled breath with electronic nose. Sci. Rep. 2022, 12, 1–9. [Google Scholar] [CrossRef] [PubMed]
- Shan, B.; Broza, Y.Y.; Li, W.; Wang, Y.; Wu, S.; Liu, Z.; Wang, J.; Gui, S.; Wang, L.; Zhang, Z.; et al. Multiplexed Nanomaterial-Based Sensor Array for Detection of COVID-19 in Exhaled Breath. ACS Nano 2020, 14, 12125–12132. [Google Scholar] [CrossRef]
- Steppert, C.; Steppert, I.; Sterlacci, W.; Bollinger, T. Rapid detection of SARS-CoV-2 infection by multicapillary column coupled ion mobility spectrometry (MCC-IMS) of breath. A proof of concept study. J. Breath Res. 2021, 15, 027105. [Google Scholar] [CrossRef]
- Ruszkiewicz, D.M.; Sanders, D.; O’Brien, R.; Hempel, F.; Reed, M.J.; Riepe, A.C.; Bailie, K.; Brodrick, E.; Darnley, K.; Ellerkmann, R.; et al. Diagnosis of COVID-19 by analysis of breath with gas chromatography-ion mobility spectrometry—A feasibility study. Eclinicalmedicine 2020, 29–30, 100609. [Google Scholar] [CrossRef]
- Chen, H.; Qi, X.; Zhang, L.; Li, X.; Ma, J.; Zhang, C.; Feng, H.; Yao, M. COVID-19 screening using breath-borne volatile organic compounds. J. Breath Res. 2021, 15, 047104. [Google Scholar] [CrossRef]
- Ibrahim, W.; Cordell, R.L.; Wilde, M.J.; Richardson, M.; Carr, L.; Dasi, A.S.D.; Hargadon, B.; Free, R.C.; Monks, P.S.; Brightling, C.E.; et al. Diagnosis of COVID-19 by exhaled breath analysis using gas chromatography-mass spectrometry. ERJ Open Res. 2021, 7, 00139–02021. [Google Scholar] [CrossRef]
- Grassin-Delyle, S.; Roquencourt, C.; Moine, P.; Saffroy, G.; Carn, S.; Heming, N.; Fleuriet, J.; Salvator, H.; Naline, E.; Couderc, L.-J.; et al. Metabolomics of exhaled breath in critically ill COVID-19 patients: A pilot study. Ebiomedicine 2020, 63, 103154. [Google Scholar] [CrossRef]
- Yang, T.; Chen, W.; Wang, P. A review of all-optical photoacoustic spectroscopy as a gas sensing method. Appl. Spectrosc. Rev. 2020, 56, 143–170. [Google Scholar] [CrossRef]
- Maiti, K.S.; Roy, S.; Lampe, R.; Apolonski, A. Breath signatures of cerebral palsy patients revealed with mid-infrared FTIR spectroscopy. In Proceedings of the Conference on Lasers and Electro-Optics Europe and European Quantum Electronics Conference, Munich, Germany, 23–27 June 2019; p. cl_4_5. [Google Scholar]
- Ben Shlomo, I.; Frankenthal, H.; Laor, A.; Greenhut, A.K. Detection of SARS-CoV-2 infection by exhaled breath spectral analysis: Introducing a ready-to-use point-of-care mass screening method. Eclinicalmedicine 2022, 45, 101308. [Google Scholar] [CrossRef] [PubMed]
- Tyagi, H.; Daulton, E.; Bannaga, A.S.; Arasaradnam, R.P.; Covington, J.A. Urinary Volatiles and Chemical Characterisation for the Non-Invasive Detection of Prostate and Bladder Cancers. Biosensors 2021, 11, 437. [Google Scholar] [CrossRef] [PubMed]
- Daulton, E.; Wicaksono, A.N.; Tiele, A.; Kocher, H.M.; Debernardi, S.; Crnogorac-Jurcevic, T.; Covington, J.A. Volatile organic compounds (VOCs) for the non-invasive detection of pancreatic cancer from urine. Talanta 2020, 221, 121604. [Google Scholar] [CrossRef]
- Sethi, S.; Nanda, R.; Chakraborty, T. Clinical Application of Volatile Organic Compound Analysis for Detecting Infectious Diseases. Clin. Microbiol. Rev. 2013, 26, 462–475. [Google Scholar] [CrossRef] [PubMed] [Green Version]
- Lewis, J.M.; Savage, R.S.; Beeching, N.; Beadsworth, M.B.J.; Feasey, N.; Covington, J. Identifying volatile metabolite signatures for the diagnosis of bacterial respiratory tract infection using electronic nose technology: A pilot study. PLoS ONE 2017, 12, e0188879. [Google Scholar] [CrossRef]
- Sahota, A.S.; Gowda, R.; Arasaradnam, R.P.; Daulton, E.; Savage, R.S.; Skinner, J.R.; Adams, E.; Ward, S.A.; Covington, J.A. A simple breath test for tuberculosis using ion mobility: A pilot study. Tuberculosis 2016, 99, 143–146. [Google Scholar] [CrossRef] [PubMed] [Green Version]
- Tiele, A.; Wicaksono, A.; Kansara, J.; Arasaradnam, R.P.; Covington, J.A. Breath Analysis Using eNose and Ion Mobility Technology to Diagnose Inflammatory Bowel Disease—A Pilot Study. Biosensors 2019, 9, 55. [Google Scholar] [CrossRef] [Green Version]
- Amor, R.E.; Nakhleh, M.K.; Barash, O.; Haick, H. Breath analysis of cancer in the present and the future. Eur. Respir. Rev. 2019, 28, 190002. [Google Scholar] [CrossRef]
- Guest, C.; Dewhirst, S.Y.; Lindsay, S.W.; Allen, D.J.; Aziz, S.; Baerenbold, O.; Bradley, J.; Chabildas, U.; Chen-Hussey, V.; Clifford, S.; et al. Using trained dogs and organic semi-conducting sensors to identify asymptomatic and mild SARS-CoV-2 infections: An observational study. J. Travel Med. 2022, 29, taac043. [Google Scholar] [CrossRef]


| Group | Symptomatic | Asymptomatic | Controls |
|---|---|---|---|
| Number of samples and percentage | 36 (42.4%) | 23 (27.1%) | 26 (30.5%) |
| Mean Age (years) | 56.7 | 66.7 | 53.3 |
| Gender; Male/Female | 20:16 | 14:9 | 20:6 |
| Vaccinated | 26 (72.4%) | 21 (91.3%) | 24 (92.3%) |
| Nationality | |||
| British | 24 (66.7%) | 18 (78.2%) | 19 (73.1%) |
| Caribbean | 0 | 1 (4.35%) | 0 |
| Indian | 1 (2.7%) | 0 | 3 (11.5%) |
| Iranian | 3 (8.4%) | 0 | 0 |
| Irish | 1 (2.7%) | 2 (8.7%) | 1 (3.85%) |
| Latvian | 0 | 0 | 2 (7.7%) |
| Pakistani | 0 | 1 (4.35%) | 0 |
| Portuguese | 1 (2.7%) | 0 | 0 |
| Somalian | 0 | 1 (4.35%) | 0 |
| Unknown/not declared | 6 (16.8%) | 0 | 1 (3.85%) |
| Smoking History | |||
| Current Smoker | 2 (5.6%) | 4 (17.4%) | 11 (42.3%) |
| Ex-smoker | 9 (25%) | 5 (21.7%) | 4 (15.4%) |
| Never smoked | 25 (69.4%) | 14 (60.9%) | 11 (42.3%) |
| Drug History Total number of medications taken per group and the average number of medications per patient | 160 (4.3 per patient) | 72 (3.1 per patient) | 50 (1.9 per patient) |
| Range of the number of medications taken per patient | 0–11 | 0–11 | 0–7 |
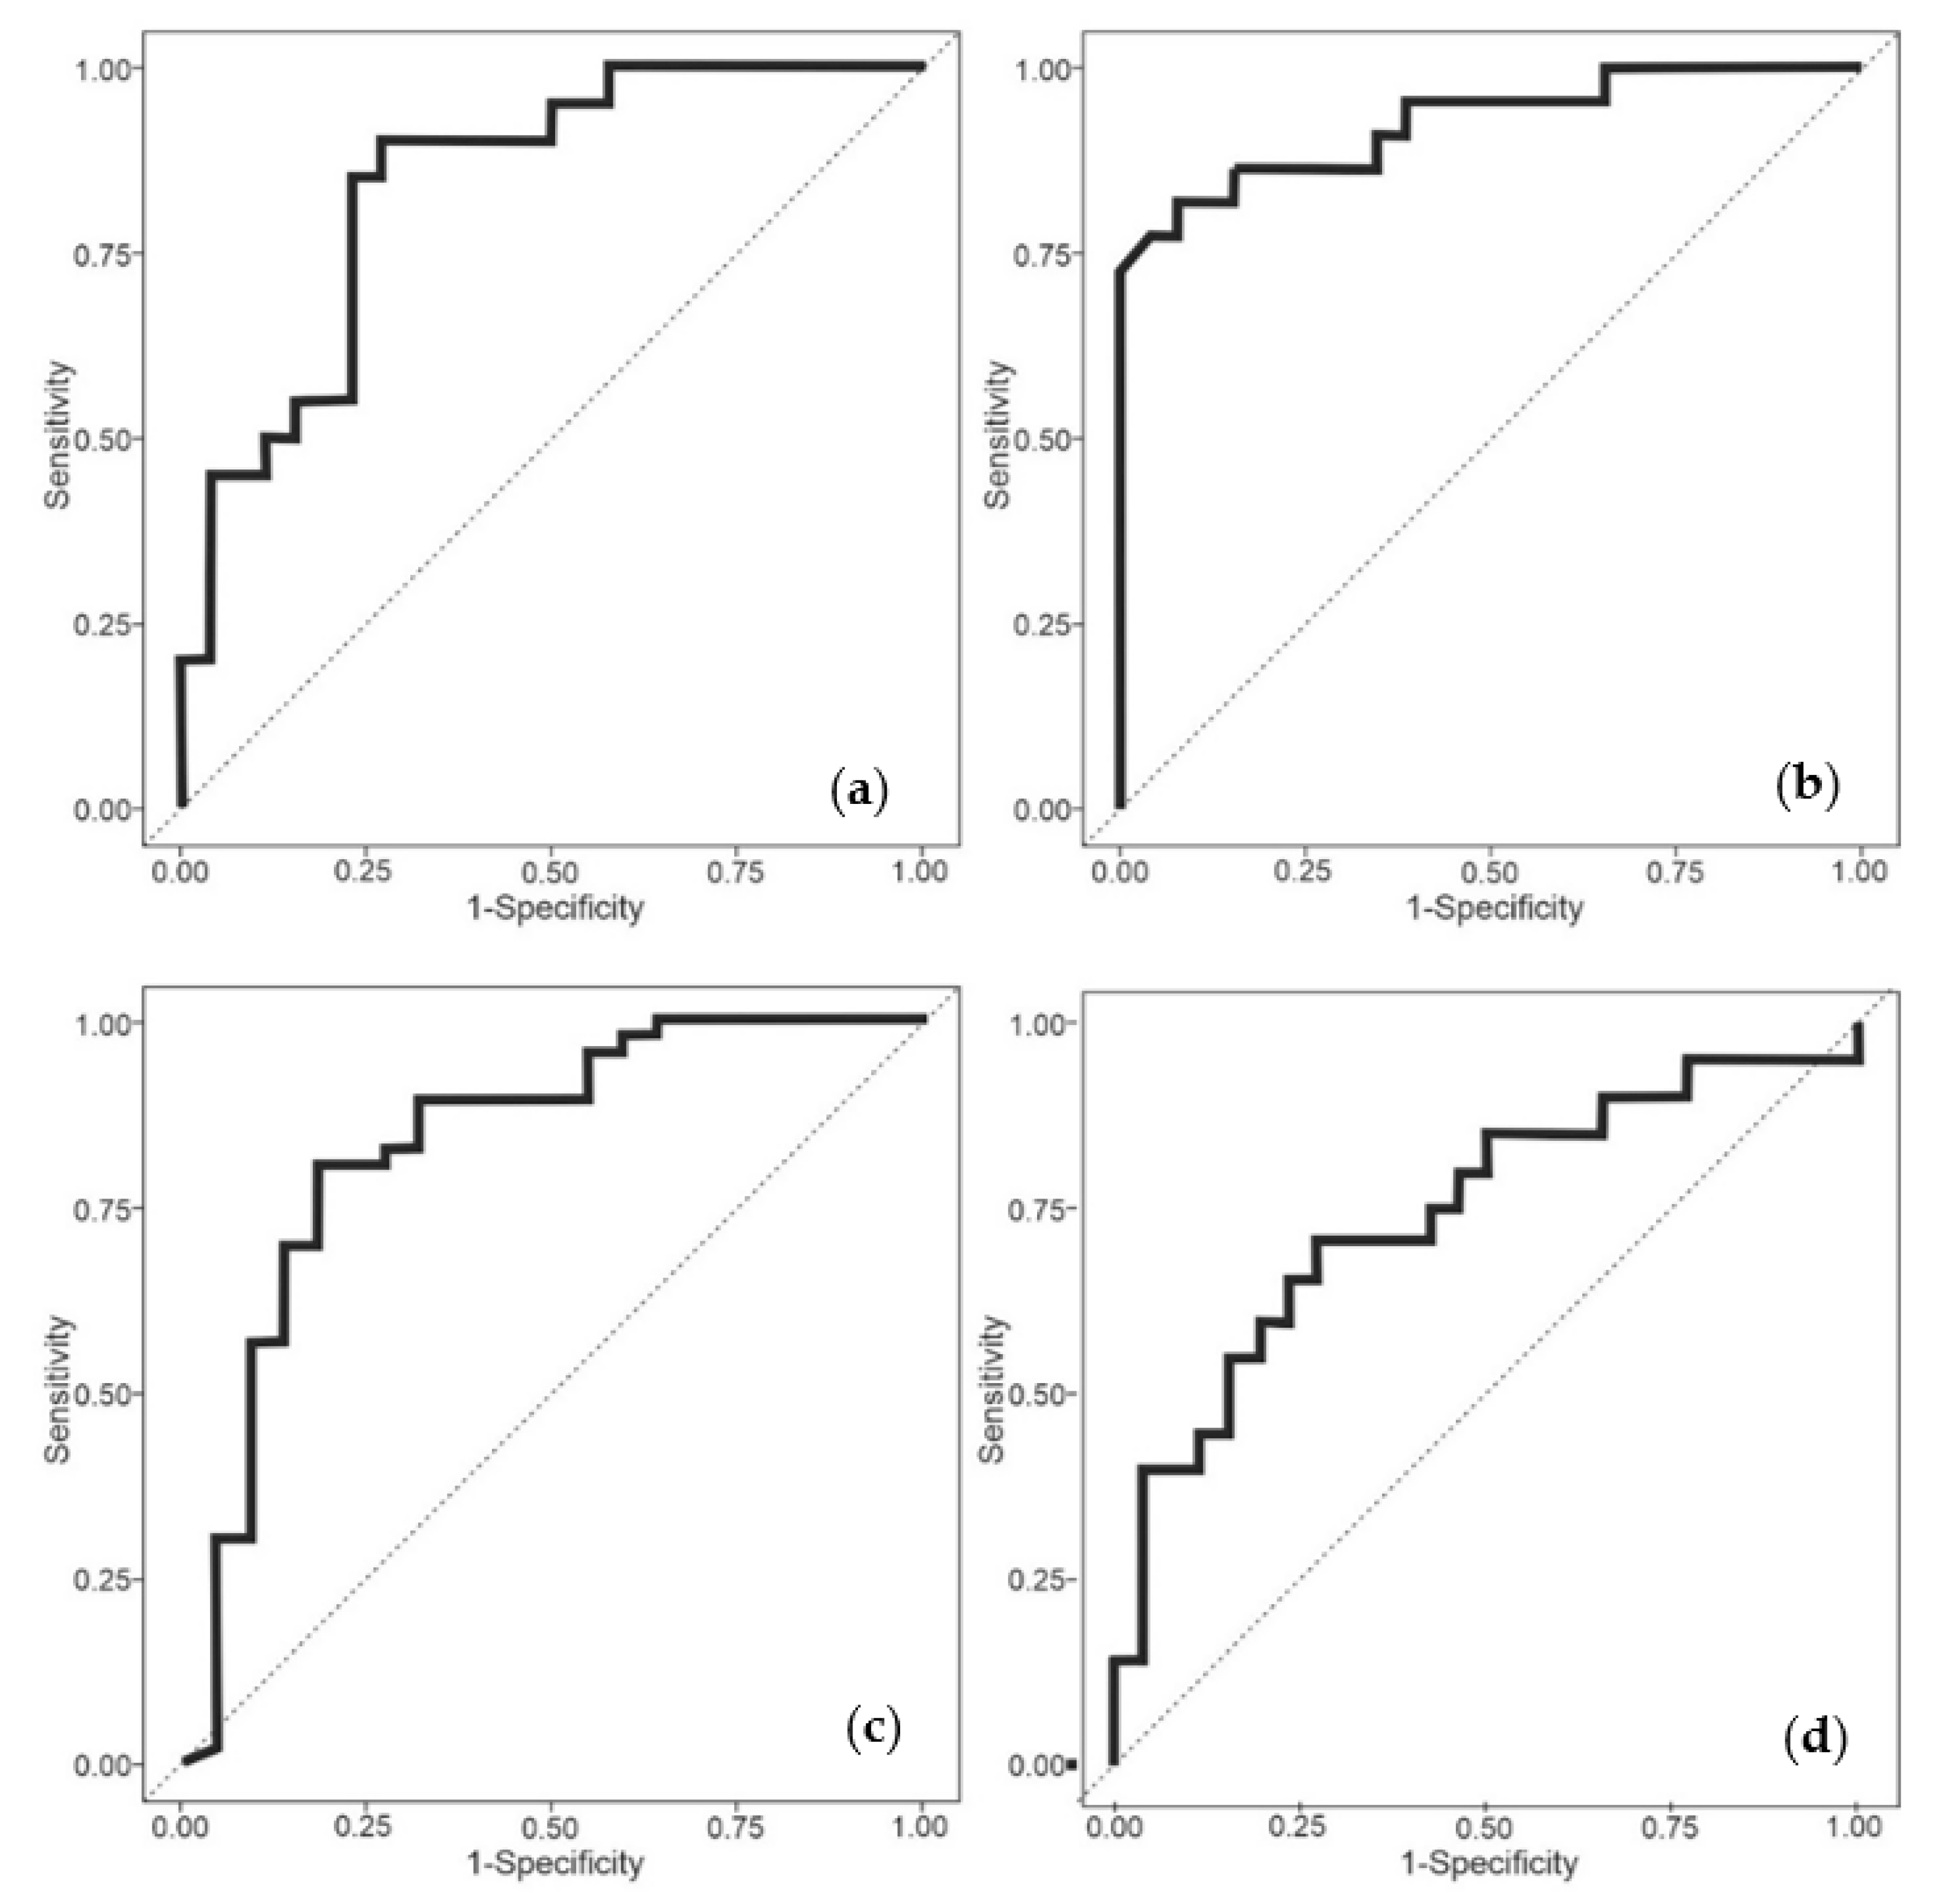
| Comparisons | Classifiers | AUC | Sensitivity | Specificity | PPV | NPV |
|---|---|---|---|---|---|---|
| COVID-19 positive (symptomatic and asymptomatic) vs. COVID-19 negative (control) | SLR | 0.76 (0.61–0.92) | 0.69 (0.41–0.89) | 0.88 (0.76–0.95) | 0.65 | 0.90 |
| RF | 0.87 (0.77–0.97) | 0.69 (0.41–0.89) | 0.94 (0.83–0.99) | 0.79 | 0.90 | |
| COVID-19 positive (symptomatic) vs. COVID-19 negative (control) | SLR | 0.80 (0.67–0.93) | 0.63 (0.35–0.85) | 0.86 (0.68–0.96) | 0.71 | 0.81 |
| RF | 0.77 (0.62–0.92) | 0.69 (0.41–0.89) | 0.86 (0.68–0.96) | 0.73 | 0.83 | |
| COVID-19 positive (asymptomatic) vs. COVID-19 negative (control) | SLR | 0.83 (0.69–0.97) | 0.88 (0.62–0.98) | 0.76 (0.53–0.92) | 0.74 | 0.89 |
| RF | 0.88 (0.77–1) | 0.88 (0.62–0.98) | 0.76 (0.53–0.92) | 0.74 | 0.89 | |
| COVID-19 positive (symptomatic) vs. COVID-19 positive (asymptomatic) | SLR | 0.78 (0.65–0.92) | 0.71 (0.48–0.89) | 0.79 (0.60–0.92) | 0.71 | 0.79 |
| RF | 0.80 (0.66–0.95) | 0.71 (0.48–0.89) | 0.86 (0.68–0.96) | 0.79 | 0.81 |
| Comparisons | Classifiers | AUC | Sensitivity | Specificity | PPV | NPV |
|---|---|---|---|---|---|---|
| COVID-19 positive (symptomatic and asymptomatic) vs. COVID-19 negative (control) | SLR | 0.88 (0.80–0.95) | 1.00 (1–1) | 0.50 (0.32–0.68) | 0.80 | 1.00 |
| RF | 0.84 (0.74–0.93) | 0.89 (0.81–0.96) | 0.50 (0.33–0.69) | 0.79 | 0.69 | |
| COVID-19 positive (symptomatic) vs. COVID-19 negative (control) | SLR | 0.91 (0.83–0.98) | 0.68 (0.50–0.83) | 0.96 (0.89–1) | 0.94 | 0.78 |
| RF | 0.93 (0.85–0.98) | 0.82 (0.67–0.95) | 0.85 (0.72–0.96) | 0.81 | 0.85 | |
| COVID-19 positive (asymptomatic) vs. COVID-19 negative (control) | SLR | 0.76 (0.62–0.88) | 0.75 (0.58–0.90) | 0.64 (0.46–0.80) | 0.65 | 0.74 |
| RF | 0.74 (0.61–0.86) | 0.65 (0.47–0.82) | 0.73 (0.58–0.87) | 0.65 | 0.73 | |
| COVID-19 positive (symptomatic) vs. COVID-19 positive (asymptomatic) | SLR | 0.84 (0.74–0.93) | 0.70 (0.52–0.87) | 0.77 (0.62–0.90) | 0.77 | 0.84 |
| RF | 0.74 (0.61–0.86) | 0.65 (0.47–0.82) | 0.73 (0.58–0.87) | 0.65 | 0.73 |
Disclaimer/Publisher’s Note: The statements, opinions and data contained in all publications are solely those of the individual author(s) and contributor(s) and not of MDPI and/or the editor(s). MDPI and/or the editor(s) disclaim responsibility for any injury to people or property resulting from any ideas, methods, instructions or products referred to in the content. |
© 2023 by the authors. Licensee MDPI, Basel, Switzerland. This article is an open access article distributed under the terms and conditions of the Creative Commons Attribution (CC BY) license (https://creativecommons.org/licenses/by/4.0/).
Share and Cite
Laird, S.; Debenham, L.; Chandla, D.; Chan, C.; Daulton, E.; Taylor, J.; Bhat, P.; Berry, L.; Munthali, P.; Covington, J.A. Breath Analysis of COVID-19 Patients in a Tertiary UK Hospital by Optical Spectrometry: The E-Nose CoVal Study. Biosensors 2023, 13, 165. https://doi.org/10.3390/bios13020165
Laird S, Debenham L, Chandla D, Chan C, Daulton E, Taylor J, Bhat P, Berry L, Munthali P, Covington JA. Breath Analysis of COVID-19 Patients in a Tertiary UK Hospital by Optical Spectrometry: The E-Nose CoVal Study. Biosensors. 2023; 13(2):165. https://doi.org/10.3390/bios13020165
Chicago/Turabian StyleLaird, Steven, Luke Debenham, Danny Chandla, Cathleen Chan, Emma Daulton, Johnathan Taylor, Palashika Bhat, Lisa Berry, Peter Munthali, and James A. Covington. 2023. "Breath Analysis of COVID-19 Patients in a Tertiary UK Hospital by Optical Spectrometry: The E-Nose CoVal Study" Biosensors 13, no. 2: 165. https://doi.org/10.3390/bios13020165