Article Text

Abstract
Objective To evaluate COVID-19 infection and mortality disparities in ethnic and racial subgroups in a state-wise manner across the USA.
Methods Publicly available data from The COVID Tracking Project at The Atlantic were accessed between 9 September 2020 and 14 September 2020. For each state and the District of Columbia, % infection, % death, and % population proportion for subgroups of race (African American/black (AA/black), Asian, American Indian or Alaska Native (AI/AN), and white) and ethnicity (Hispanic/Latino, non-Hispanic) were recorded. Crude and normalised disparity estimates were generated for COVID-19 infection (CDI and NDI) and mortality (CDM and NDM), computed as absolute and relative difference between % infection or % mortality and % population proportion per state. Choropleth map display was created as thematic representation proportionate to CDI, NDI, CDM and NDM.
Results The Hispanic population had a median of 158% higher COVID-19 infection relative to their % population proportion (median 158%, IQR 100%–200%). This was followed by AA, with 50% higher COVID-19 infection relative to their % population proportion (median 50%, IQR 25%–100%). The AA population had the most disproportionate mortality, with a median of 46% higher mortality than the % population proportion (median 46%, IQR 18%–66%). Disproportionate impact of COVID-19 was also seen in AI/AN and Asian populations, with 100% excess infections than the % population proportion seen in nine states for AI/AN and seven states for Asian populations. There was no disproportionate impact in the white population in any state.
Conclusions There are racial/ethnic disparities in COVID-19 infection/mortality, with distinct state-wise patterns across the USA based on racial/ethnic composition. There were missing and inconsistently reported racial/ethnic data in many states. This underscores the need for standardised reporting, attention to specific regional patterns, adequate resource allocation and addressing the underlying social determinants of health adversely affecting chronically marginalised groups.
- epidemiology
- health policy
- COVID-19
Data availability statement
Data are available in a public, open access repository. Publicly available data from 'The COVID Tracking Project at The Atlantic' were compiled between 10 September 2020 and 14 September 2020 for this study (https://covidtracking.com/race/dashboard). The data also included information regarding racial and ethnic composition of US states and the District of Columbia derived from US Census Bureau’s 2018 5-year estimates. The COVID Tracking Project at The Atlantic’s data and website content are published under a Creative Commons CC BY 4.0 licence (CC BY 4.0).
This is an open access article distributed in accordance with the Creative Commons Attribution Non Commercial (CC BY-NC 4.0) license, which permits others to distribute, remix, adapt, build upon this work non-commercially, and license their derivative works on different terms, provided the original work is properly cited, appropriate credit is given, any changes made indicated, and the use is non-commercial. See: http://creativecommons.org/licenses/by-nc/4.0/.
Statistics from Altmetric.com
Strengths and limitations of this study
This study provides estimates of racial and ethnic disparities in COVID-19 infection and mortality in a state-wise manner across the USA.
Crude and normalised disparity estimates were generated for COVID-19 infection and mortality, computed as absolute and normalised difference between % infection or % mortality and % population proportion for each racial and ethnic group by state.
Choropleth map display was created as thematic representation proportionate to the magnitude of disparity estimate for each state, providing a comprehensive overview of disparities across the nation.
We used publicly available data from The COVID Tracking Project, derived from state reporting agencies, with inherent limitations related to inconsistent and incomplete reporting, particularly affecting the Asian and American Indian/Alaska Native populations.
These data lack clinical and sociodemographic information to precisely understand the impact of social determinants of health, age and other risk factors on these disparities.
Introduction
Since January 2020, when the first COVID-19-positive patient was identified in the USA, there have been over 29 million reported cases and over 500 000 reported fatalities as of date.1 Although COVID-19 can affect all ages regardless of medical comorbidities, hospitalised patients are more likely to be older and demonstrate at least one medical comorbidity.2 It has also become increasingly evident that, in addition to traditional risk factors, there are widespread racial and ethnic disparities in COVID-19 infection and mortality rates, with disproportionately higher impact among vulnerable racial and ethnic minority populations.3–7 A recent study based on the US Department of Veterans Affairs data showed an excess burden of SARS-CoV-2 infection in African American/black and Hispanic populations that was not entirely explained by underlying medical conditions, residence or site of care; however, the study did not find disparities in excess 30-day mortality across racial and ethnic subgroups.8 This observation however is not aligned with a prior report from the Centers for Disease Control and Prevention, which showed poor outcomes in the African American/black population with 1.4 times increased risk of hospitalisation, twice the risk of intensive care unit (ICU) care or ventilator support, and 1.36 times increased risk of death compared with the white population.9 Gross et al3 found a robust association between African American/black race, Latinx ethnicity and estimated age-adjusted COVID-19 mortality. Overall mortality was highest in African American/black, with 1 in 1020 facing death attributed to COVID-19, followed by Indigenous Americans, Pacific Islanders and Latinos.3 In addition, a study based on community-level disparities in urban US counties in large metropolitan areas showed excess infections and mortality that are not explained by income, bolstering the complex causal pathways that culminate into these striking disparities.10
Given the racial and ethnic diversity of the US population, its variable composition and thus unique challenges faced by racial/ethnic minorities in each state, it is imperative to examine the extent of disparities in COVID-19 infections and mortality by race and ethnicity on a national scale in a state-wise manner. Due to low population proportion of certain racial/ethnic groups in specific states, they are prone to be overlooked in aggregate estimates. Furthermore, racial/ethnic composition of hospitalised patients might differ considerably from that of the general population. In this context, state-wise analyses from national population-based samples are critical for adequate resource allocation and targeted policy implementation for improving health outcomes. Consequently, we evaluated the extent of racial and ethnic disparities in COVID-19 infection and mortality as a function of racial/ethnic composition of the general population across all US states and the District of Columbia.
Materials and methods
Study design, setting and data source
This is an observational study based on state-reported, population-based data on COVID-19 infection and mortality compiled by ‘The COVID Tracking Project’. The data source used is publicly available through ‘The COVID Tracking Project’ between 10 September 2020 and 14 September 2020 (https://covidtracking.com/race/dashboard). The COVID Tracking Project at The Atlantic’s data and website content are published under a Creative Commons CC BY 4.0 licence (CC BY 4.0).
Participants
The study population comprises individuals who are positive for COVID-19 infection or were reported to have COVID-19-related mortality based on state-reported data as compiled by The COVID Tracking Project. Data regarding racial and ethnic composition of populations in US states and the District of Columbia in percentage were from the US Census Bureau’s 2018 5-year estimates, compiled by The COVID Tracking Project. Data around the 9 September 2020 and 14 September 2020 reporting timelines were used for this study. For each state and the District of Columbia, % infection, % death, and % population proportion for subgroups of race and ethnicity were recorded (online supplemental table 1). The % COVID-19 infection or mortality in each group is defined as: [number of infection or deaths in each group/total number of COVID-19 infections or deaths] × 100.
Supplemental material
Race was categorised into African American/black (AA/black), Asian, American Indian or Alaska Native (AI/AN), and white. Ethnicity was characterised into Hispanic/Latino and non-Hispanic.
Please note the following variations in racial and ethnic categorisations:
Some states categorise ‘Hispanic or Latino’ ethnicity of any race including black population of Hispanic ethnicity. All other race categories were defined as not Hispanic or Latino. These states are Arizona, California, Colorado, Connecticut, Delaware, Florida, Georgia, Illinois, Maryland, Massachusetts, Mississippi, Nevada, New Hampshire, New Jersey, New Mexico, New York, Rhode Island, South Dakota, Texas, Utah, Washington and Wyoming.
Some states report ‘Asian’ as a pan-racial category, including Asian, Pacific Islander and Native Hawaiian: Arizona, Connecticut, Delaware, Michigan, Oklahoma, Virginia and Wisconsin. Montana classifies the AI/AN population as a pan-racial category including AI, AN, Pacific Islander and Native Hawaiian. This limits the accuracy of comparison with percentage population; however, the estimated disparity index was generated for these states, given the population percentage of Native Hawaiian and Pacific Islanders is <1% and not likely to significantly impact the metric.
Inclusion and exclusion criteria
States reporting race and ethnicity data for a minimum of 50% or more of their COVID-19 cases and deaths were included in the analyses. States that used non-mutually exclusive race categories, used or did not specify the usage of other for AI/AN and/or Asian population, or had numbers that were <1% were excluded from the analyses, as applicable.
Fifty-one states and the District of Columbia provide race/ethnicity data for cases and deaths. The following exclusions were made, where applicable:
Utah and Wyoming report non-mutually exclusive categories for race and ethnicity and hence were entirely excluded from the analyses.
Texas reported race and ethnicity data on less than 3% of its COVID-19 cases and hence was excluded from analyses for COVID-19 cases.
Texas, West Virginia, Florida, Hawaii, Indiana, Maryland, New Jersey, Pennsylvania and New York either include AI/AN and/or Asian race categories in ‘other’ or do not specify if these are included in ‘other’ and hence were excluded from the specific analyses on these racial groups.
Numbers that are too small for a reliable disparity estimation (<1%), including percentage population, infection or mortality, were excluded from the analyses.
Additional detailed data can be accessed at https://covidtrackingcom/race/dashboard.
Patient and public involvement
There was no direct patient or public involvement in the design and conduct of this study.
Statistical analysis
State-wise crude and normalised disparity estimates were generated for COVID-19 infection (CDI and NDI) and mortality (CDM and NDM), computed as absolute and normalised difference in percentage points between % infection or mortality in each racial and ethnic subgroup and % population proportion of the same racial/ethnic subgroup. Normalised disparity estimate was generated to account for differences in population size for racial/ethnic subgroups. CDI, NDI, CDM and NDM were reported as median and IQR. Choropleth map display was created as thematic representation proportionate to the magnitude of disparity estimate for each state, providing a comprehensive overview of disparities across the nation. Percentage estimates that make up <1% of the state population or COVID-19 cases or mortality were excluded from analyses.
Results
Racial/ethnic disparities in COVID-19 infection
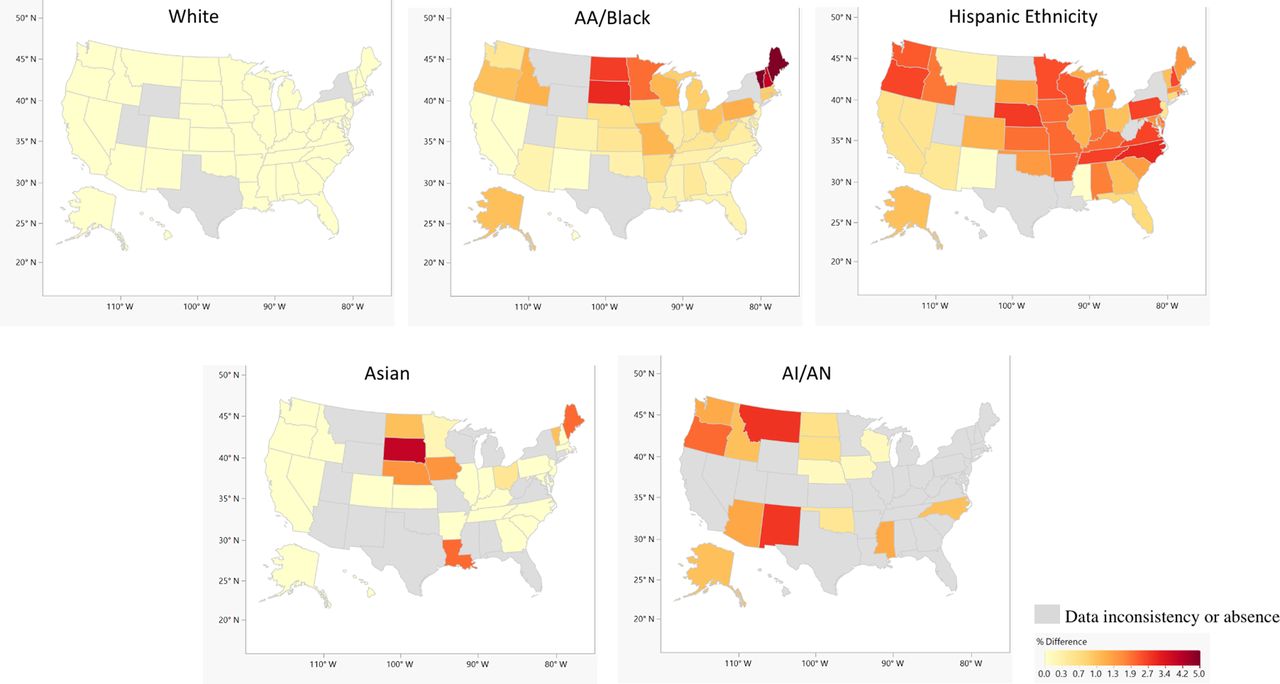
COVID-19 infection was disproportionately high in the Hispanic, AA/black, AI/AN and Asian populations, relative to their population proportion in many states (figures 1 and 2).

Choropleth map showing crude disparity estimates for COVID-19 infections, computed as absolute percentage point difference between % COVID-19 infection and % population proportion by ethnic/racial groups across US states and the District of Columbia. AA, African American; AI, American Indian; AN, Alaska Native.

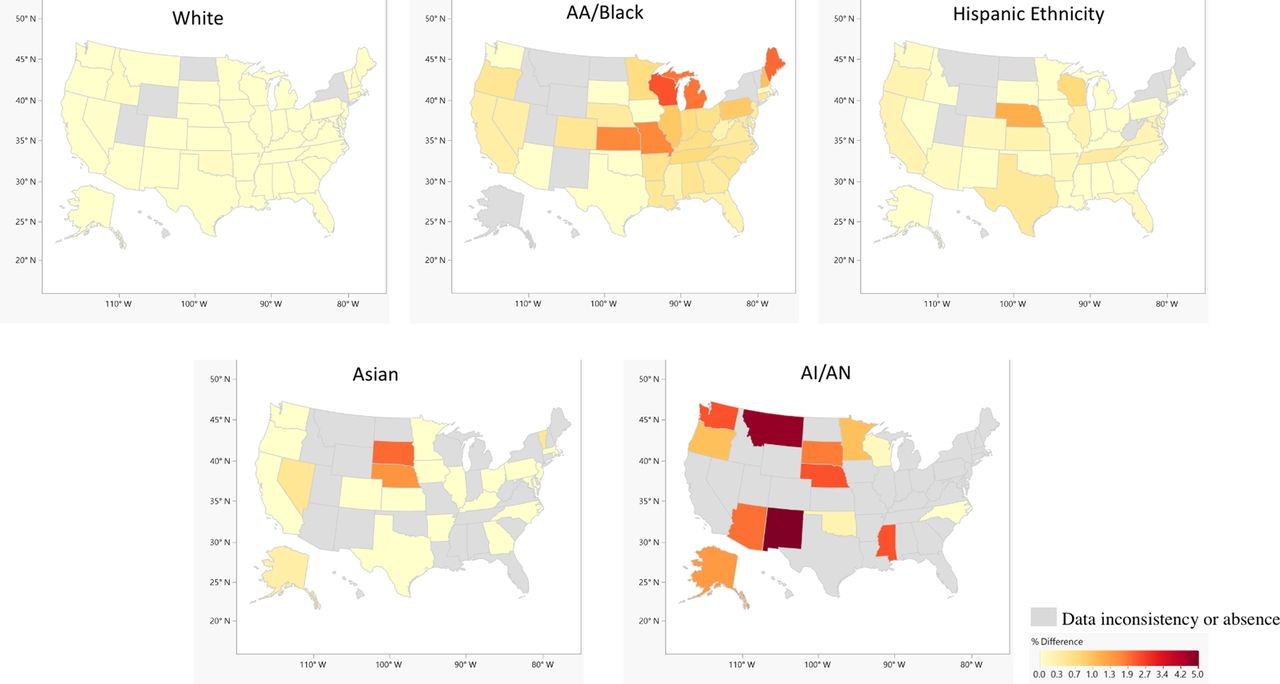
Choropleth map showing normalised disparity estimates for COVID-19 infections computed as CDI normalised by % population proportion of each ethnic/racial group across US states and the District of Columbia. AA, African American; AI, American Indian; AN, Alaska Native; CDI, crude disparity estimates for COVID-19 infection.
Overall across the nation, the Hispanic population experienced the highest CDI and NDI, followed by the AA/black population. The Hispanic population had a median CDI of 14% and an IQR of 8%–19%, and the AA/black population had a median CDI of 5% and an IQR of 3%–9%. Similarly, both Hispanic and AA/black populations experienced higher NDI. The Hispanic population had a median NDI of 158% and an IQR of 100%–200%, in contrast to the AA/black population median NDI of 50% and IQR of 25%–100%.
The Hispanic population experienced ≥100% NDI in 35 out of 44 analysed states, while the AA/black population experienced ≥100% NDI in 14 states across the nation. In contrast, the overall median CDI in the white population was −18% and the IQR −23% to −13%, and the median NDI was −26% and the IQR −39% to −17%, respectively.
Disproportionate impact of COVID-19 was also seen in the AI/AN and Asian populations in many states (figures 1 and 2), with 100% or more NDI in nine states for the AI/AN population and in seven states for the Asian population.
Choropleth maps show the most striking disparity in COVID-19 infections in the AA/black population in the state of Maine, where 22% of the total COVID-19 infections were seen in the AA/black population, who otherwise only accounts for 1% of the total population (figure 1).
Racial/ethnic disparities in COVID-19 mortality
Overall, across all states, the AA/black population had the most disproportionately high COVID-19 mortality (figures 3 and 4). The AA/black population had a CDM median of 5% (IQR: 1%–11%) and an NDM median of 46% (IQR: 18%–66%). Hispanic, white, AI/AN and Asian populations showed 0 or <0 median CDM and NDM. However, some states showed disparities in mortality even in these subgroups, such as the Hispanic population with 17% CDM and 43% NDM in Texas, while the AI/AN subgroups had 45% CDM and 500% NDM in New Mexico. The Asian population had 4% CDM and 50% NDM in Nevada. Choropleth map reveals the most striking disparity in COVID-19 mortality was present in the AI/AN population in the states of Montana and New Mexico (figures 3 and 4). In Montana, 34% of the total COVID-19 deaths were seen in the AI/AN population, who otherwise only accounts for 6% of the total population. In New Mexico, 54% of the total COVID-19 deaths were seen in the AI/AN population, who otherwise only accounts for 9% of the total population (figure 4).

Choropleth map showing crude disparity estimates for COVID-19 mortality, computed as absolute percentage point difference between % COVID-19-related mortality and % population proportion by ethnic/racial groups across US states and the District of Columbia. AA, African American; AI, American Indian; AN, Alaska Native.

Choropleth map showing normalised disparity estimates for COVID-19 mortality, computed as CDM normalised by % population proportion of each ethnic/racial group across US states and the District of Columbia. AA, African American; AI, American Indian; AN, Alaska Native; CDM, crude disparity estimate for COVID-19 mortality.
Discussion
We found widespread racial and ethnic disparities in COVID-19 infection and mortality. We summarised these findings in a state-wise manner across the USA. Our findings are consistent with previous similar reports.3–7 11
Hispanic and AA/black populations were the most disproportionately impacted by COVID-19 infections. The AA/black population was the most disproportionately affected by COVID-19-related mortality across the nation. AI/AN and Asian populations also showed disproportionately higher infection and mortality in some states, although this is susceptible to underestimation since many states with less than 1% representation for these subgroups were excluded from the analyses. In addition, the mortality disparity estimates in our study were not age-adjusted. This can underestimate the mortality for populations that have greater proportion of younger individuals, as previously shown.3 We also found widespread inconsistencies in reporting from state agencies, causing missing or incomparable data particularly affecting the Asian and AI/AN subgroups.
We do not have specific information on social determinants of health (SDOH) to understand the exact aetiologies of these disparities. However, based on a vast body of prior evidence, SDOH has a significant impact in driving these disparities, mediated via the environment, occupation and access to care, and higher burden of comorbidities in chronically marginalised populations.12–14
The higher burden of comorbidities is also known to adversely impact disease severity in COVID-19.15 Comorbidities such as obesity, hypertension and diabetes may result in a chronic, proinflammatory state that compounds the cytokine release syndrome observed in COVID-19.16 17 These comorbidities have underlying SDOH predictors, related to food insecurity, economic and environmental instability, and psychosocial stress, chronically accentuating the chronic allostatic load on racial/ethnic minority populations.18 The impact of these factors can be further exacerbated by lack of access to quality and timely care in these minority population subgroups.6 19 20
Access to healthcare is another determinant of these disparities. Often minority populations rely on government-funded healthcare facilities for their medical needs. Many of these have under-resourced infrastructure, not equipped to mobilise at an operational scale, which is necessary for a rapidly spreading potentially lethal infection like COVID-19. This is particularly relevant for the AI/AN population, who relies heavily on the Indian Health Service (IHS) to provide medical care in tribal reservations, including the Navajo Nation, the largest reservation severely impacted by COVID-19. IHS facilities are unable to respond to a crisis of this magnitude due to limited hospital beds and ICUs. In addition, IHS facility may be inaccessible to those in remote areas and IHS does not cover care provided by non-IHS providers or facilities, a critical factor that was not addressed in the funds provided by the The Coronavirus Aid, Relief, and Economic Security Act (CARES Act) stimulus bill.5
Communication challenges due to limited English proficiency and lower health literacy result in additional barriers to seeking and adhering to treatment.21–23 Furthermore, these groups are more likely to be ‘front-line workers’ (eg, grocery, public transport or healthcare employees) without the flexibility of remote employment.24 25 It is important to note that socioeconomic differences are not a singular explanation for disparities. For example, a recent study found use of public transportation as an independent predictor of COVID-19 disparities even after adjusting for income, poverty rates, education, occupation or access to insurance in AA/black and AI/AN populations.26 Commuting to work in public transportation and living in crowding households are not conducive to physical distancing, which is critical for mitigating exposure to a contagious respiratory illness such as COVID-19.5–7
Our study has several limitations, mostly stemming from inconsistent and incomplete reporting of race/ethnicity data. There were inconsistencies in race/ethnic categorisation across states. The categories were not mutually exclusive, with overlap between race and ethnicity. Many states do not clarify the composition of the category labelled as ‘others’, or may include Asian as ‘pan-racial’, effectively combining Asian, Pacific Islander and Native American subgroups. Some states reported race/ethnicity data on only a minority of cases at the time of data query. This particularly impacted Asian and AI/AN populations, highlighting an urgent need for standardisation and complete reporting of racial and ethnic data. Some groups, such as AI/AN and Asian populations, had low representation in many states (<1%) and had to be excluded from analyses. We do not have detailed clinical and sociodemographic information to precisely understand the impact of SDOH, age and other risk factors.
Our findings highlight the magnitude and extent of COVID-19 disparities across the nation in a state-wise manner. This reinforces the need for mitigating interventions tailored to the needs of states, based on the specific regional patterns of COVID-19-related estimated disparity. This is key to ensure adequate representation in resource allocation and implementation of public health policy.
In conclusion, AA/black, Hispanic, AI/AN and Asian populations are disproportionately impacted by COVID-19 infection and mortality. We provide a state-wise summary of COVID-19 disparity estimates across the USA, highlighting state-specific patterns of disparities. Hispanic and AA/black populations are most disproportionately impacted by COVID-19. We also observed higher infection and mortality in AI/AN and Asians in some states. We acknowledge that the assessment of disparities in groups such as in AI/AN and Asians can be underestimated in states with <1% population representation of these groups. Missing and inconsistent reporting of racial and ethnic data was seen in many states, particularly with AI/AN and Asian populations. This underscores the urgent need for standardised complete reporting of racial and ethnic data across the nation to facilitate a well-informed public health response to this global crisis.
Data availability statement
Data are available in a public, open access repository. Publicly available data from 'The COVID Tracking Project at The Atlantic' were compiled between 10 September 2020 and 14 September 2020 for this study (https://covidtracking.com/race/dashboard). The data also included information regarding racial and ethnic composition of US states and the District of Columbia derived from US Census Bureau’s 2018 5-year estimates. The COVID Tracking Project at The Atlantic’s data and website content are published under a Creative Commons CC BY 4.0 licence (CC BY 4.0).
Ethics statements
Acknowledgments
We appreciate the 'The COVID Tracking Project at The Atlantic' for making the race/ethnicity data on COVID-19 publicly available (https://covidtracking.com/race/dashboard).
References
Supplementary materials
Supplementary Data
This web only file has been produced by the BMJ Publishing Group from an electronic file supplied by the author(s) and has not been edited for content.
Footnotes
Contributors Data compilation and verification: ZX, SA, KS. Statistical analyses: AS, PD. Manuscript preparation: ZX, ZJ, JEJ, SUK, FSV, KN, PD. Study conception and design: KN, PD.
Funding The authors have not declared a specific grant for this research from any funding agency in the public, commercial or not-for-profit sectors.
Map disclaimer The depiction of boundaries on the map(s) in this article does not imply the expression of any opinion whatsoever on the part of BMJ (or any member of its group) concerning the legal status of any country, territory, jurisdiction or area or of its authorities. The map(s) are provided without any warranty of any kind, either express or implied.
Competing interests None declared.
Provenance and peer review Not commissioned; externally peer reviewed.
Supplemental material This content has been supplied by the author(s). It has not been vetted by BMJ Publishing Group Limited (BMJ) and may not have been peer-reviewed. Any opinions or recommendations discussed are solely those of the author(s) and are not endorsed by BMJ. BMJ disclaims all liability and responsibility arising from any reliance placed on the content. Where the content includes any translated material, BMJ does not warrant the accuracy and reliability of the translations (including but not limited to local regulations, clinical guidelines, terminology, drug names and drug dosages), and is not responsible for any error and/or omissions arising from translation and adaptation or otherwise.