
The Chaotic Behavior of the Spread of Infection during the COVID-19 Pandemic in Japan
 , , , , ,
Abstract
:1. Introduction
1.1. Objectives
1.2. Background
1.3. Literature Review
2. Methods
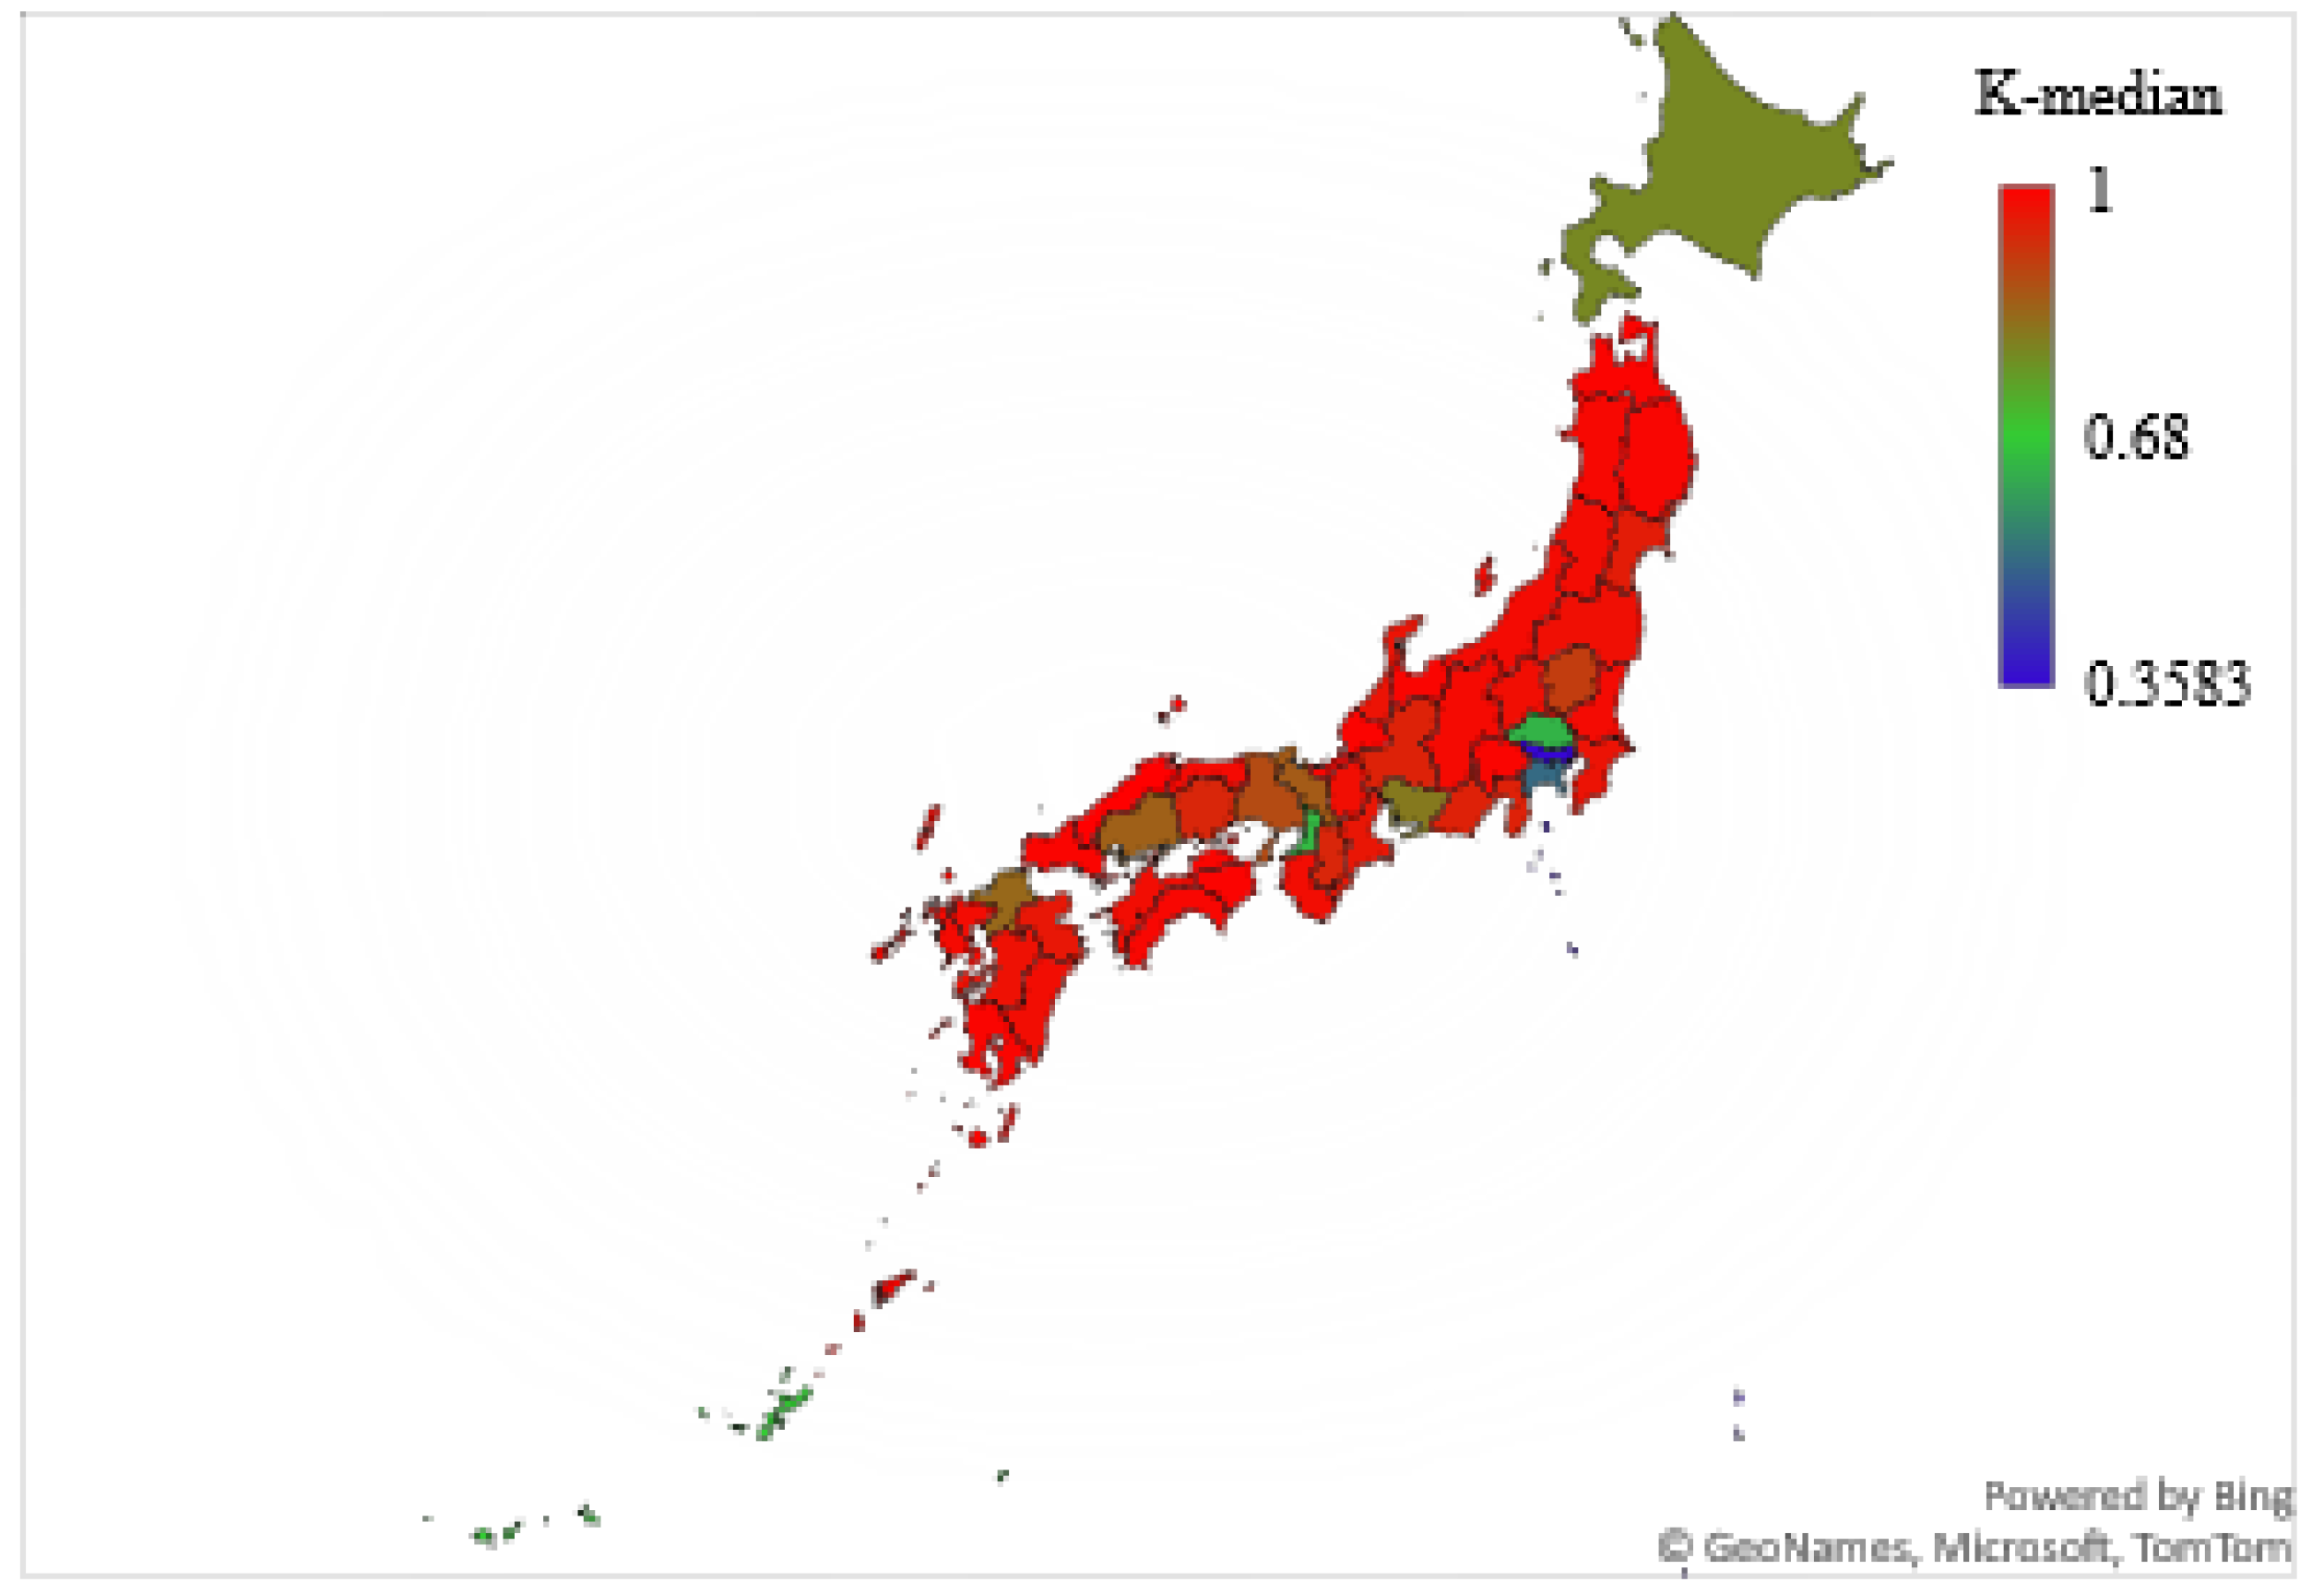
2.1. Determination of Deterministic Chaos with the 0–1 Test
2.2. COVID-19 Data Source and Processing
3. Results
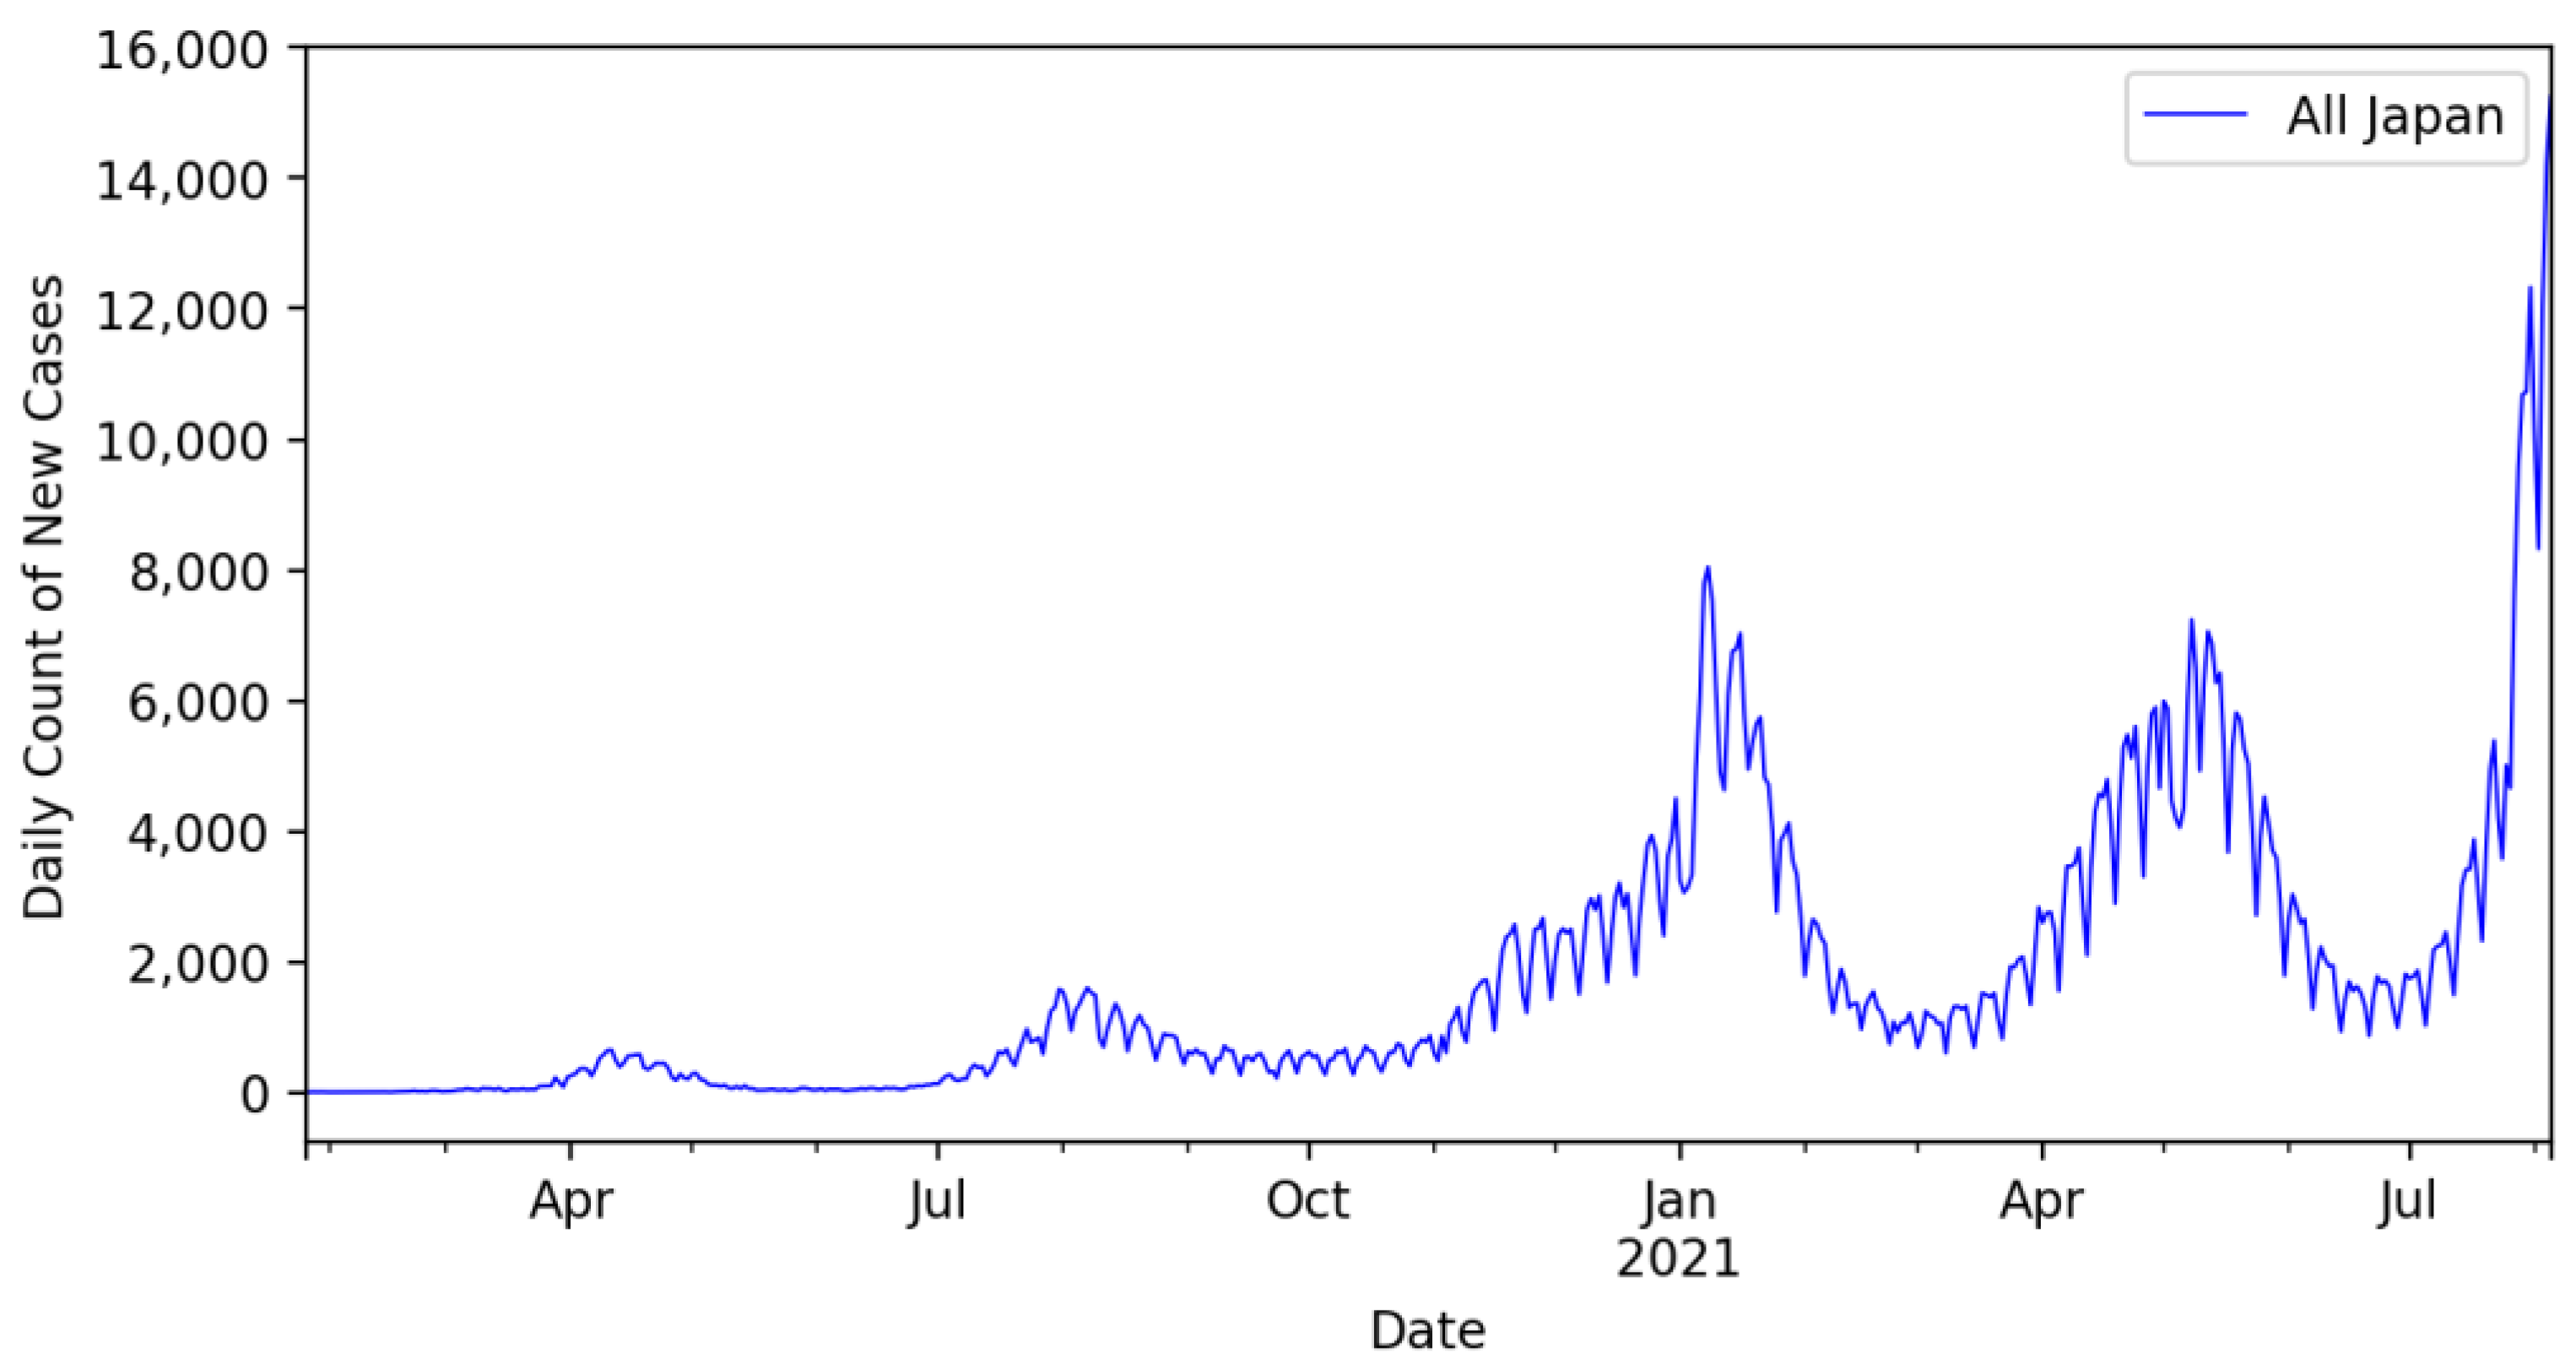
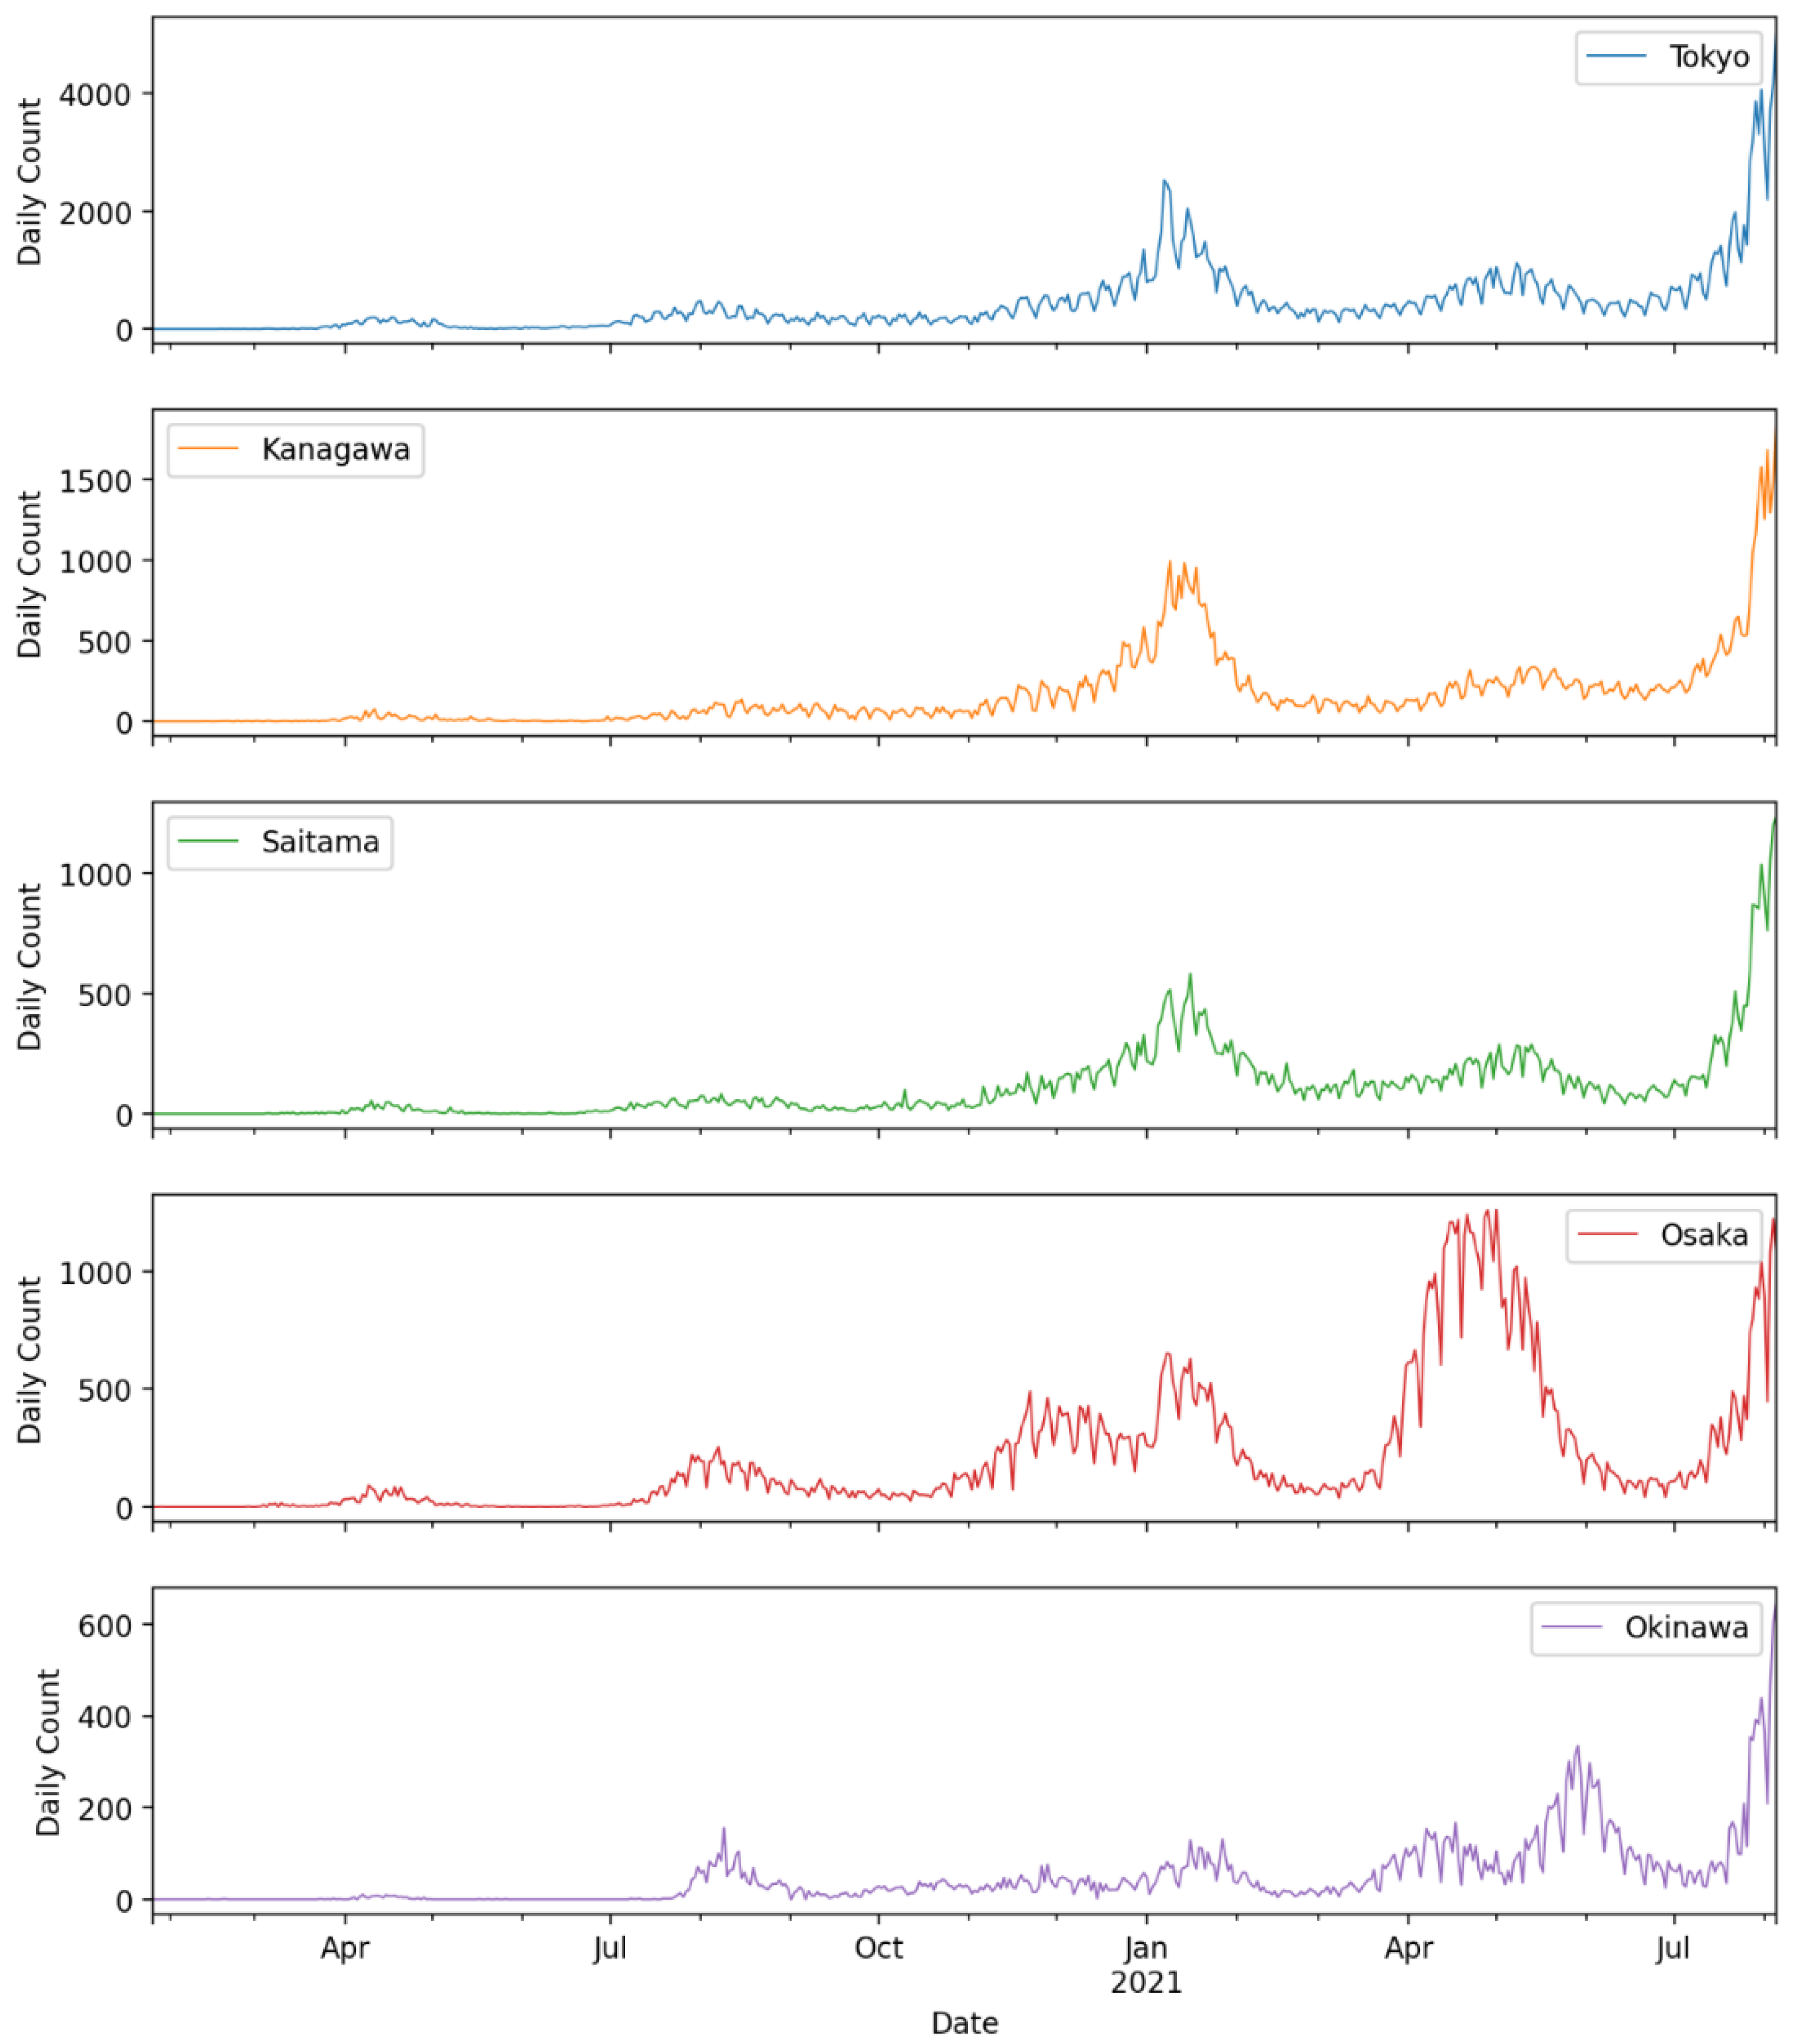
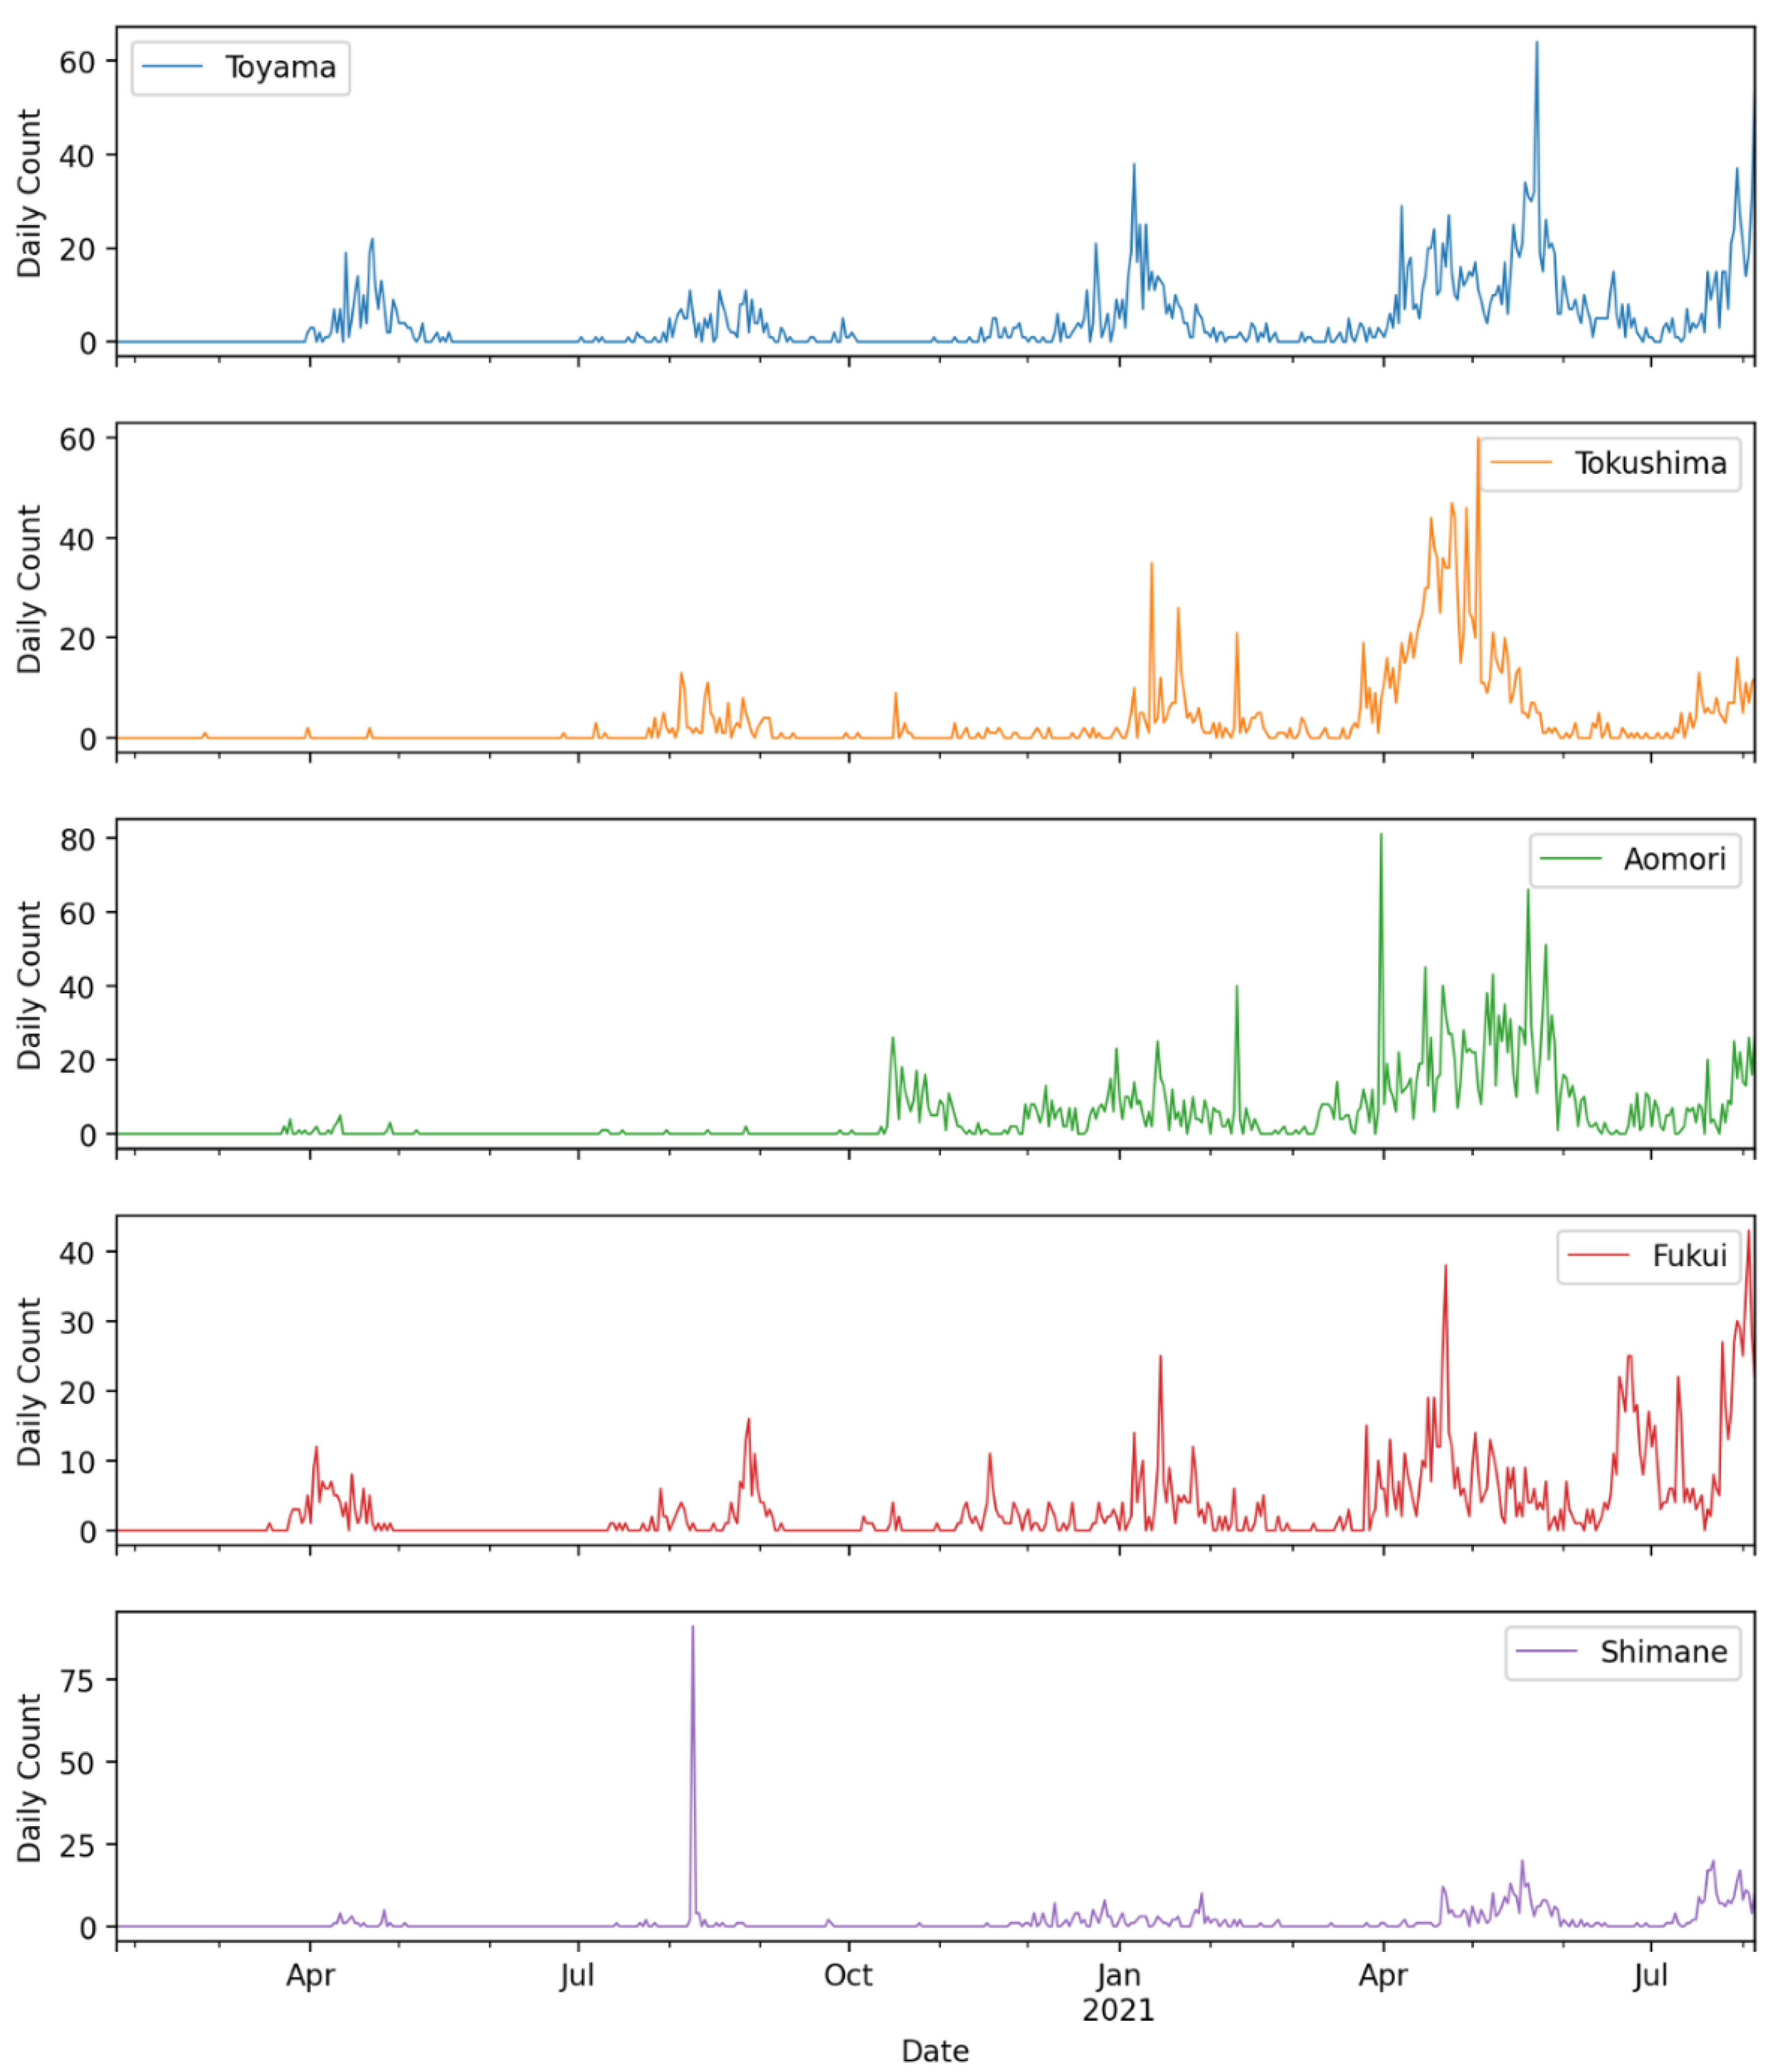
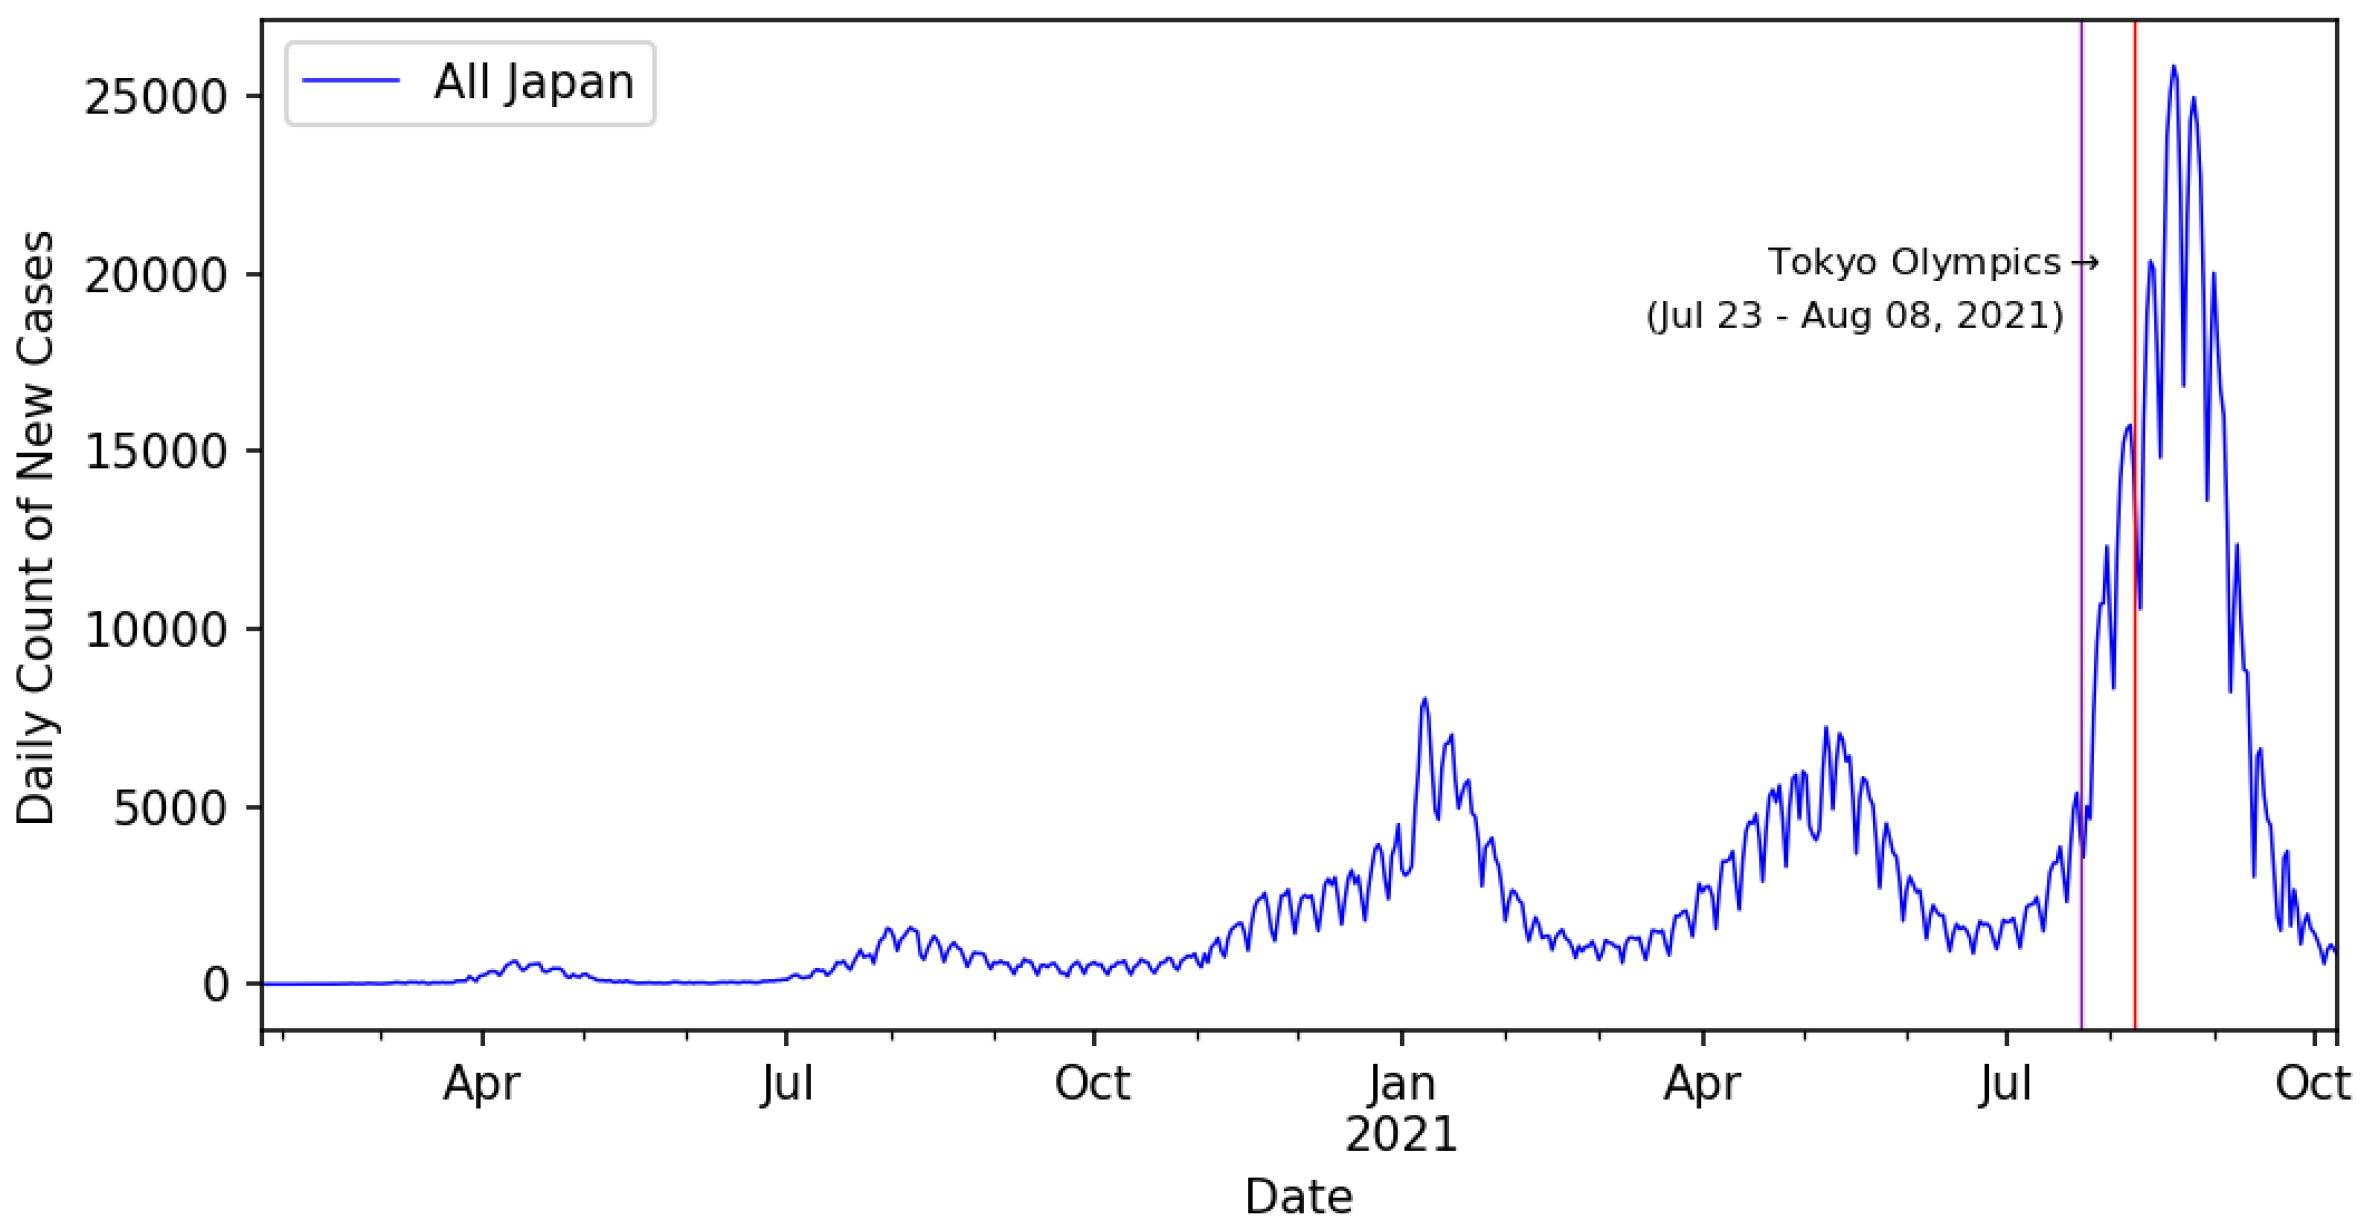
3.1. Spread of SARS-CoV-2 Infection in Japan
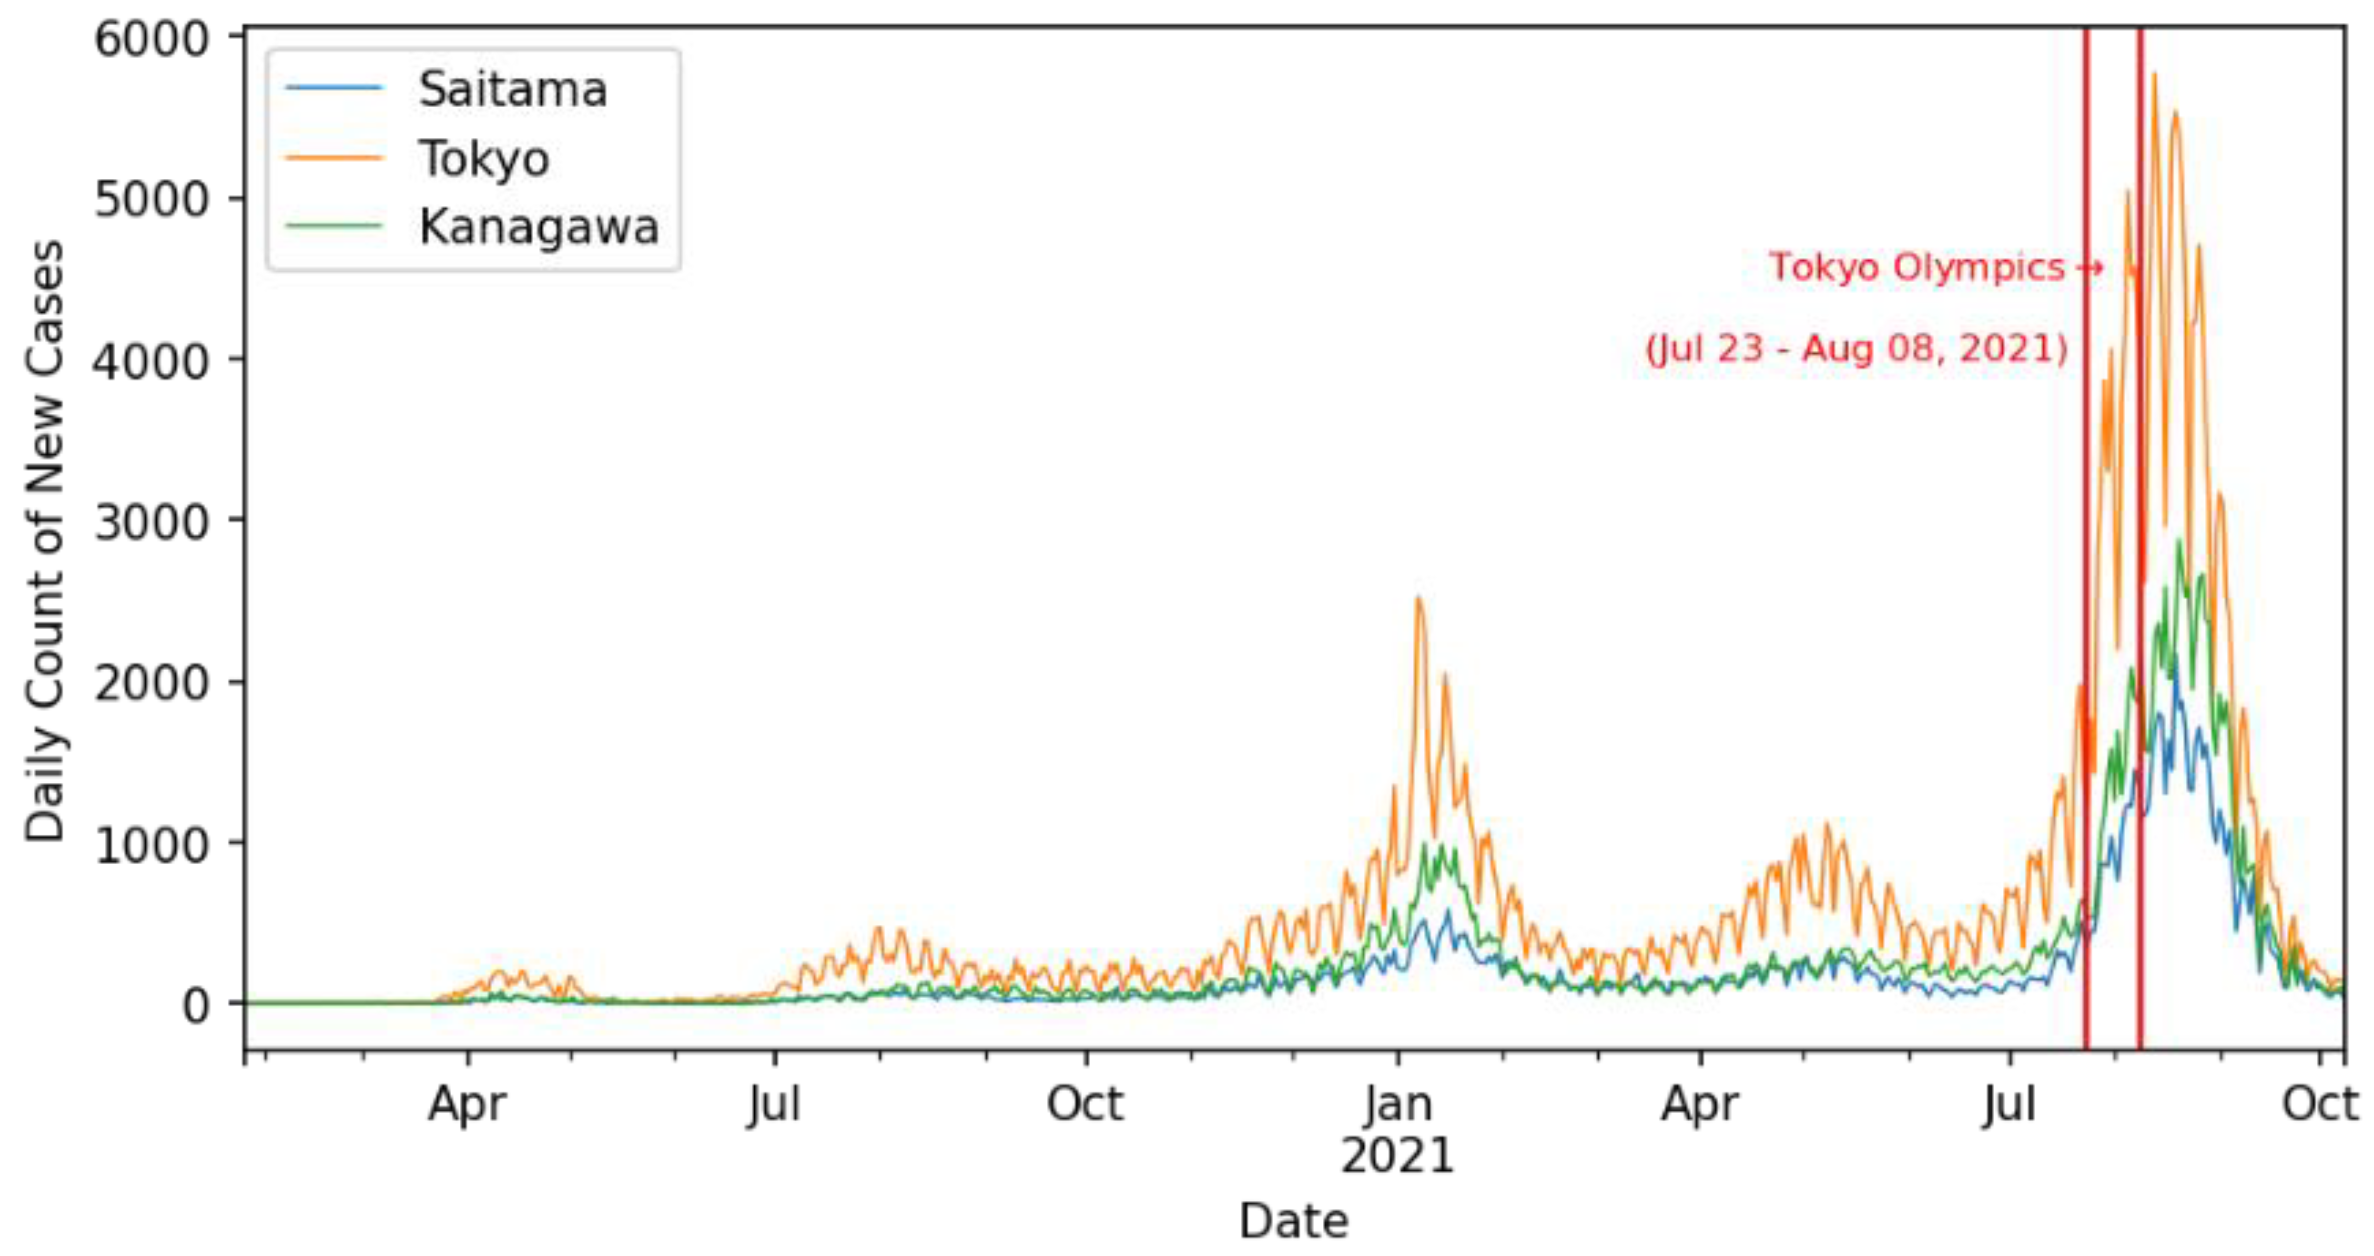
3.2. Spread of SARS-CoV-2 Infection after the Tokyo Olympics
4. Discussion
5. Conclusions
Author Contributions
Funding
Institutional Review Board Statement
Informed Consent Statement
Data Availability Statement
Conflicts of Interest
Appendix A
References
- Nakao, K. Ranking of Restaurants with Reduced Sales in Corona. Available online: https://toyokeizai.net/articles/-/423485 (accessed on 2 August 2021).
- Tokyo Shoko Research Survey on “Bankruptcy Trends in the Food Service Industry” (January–May 2021). Available online: https://www.tsr-net.co.jp/news/analysis/20210607_01.html (accessed on 2 August 2021).
- Tokyo Shoko Research Survey of “Bankruptcy Trends in the Accommodation Industry” 2020 (January–December). Available online: https://www.tsr-net.co.jp/news/analysis/20210112_01.html (accessed on 2 August 2021).
- Tokyo Shoko Research “Travel Industry Bankruptcy Trends” Survey 2020 (January–December). Available online: https://www.tsr-net.co.jp/news/analysis/20210112_02.html (accessed on 2 August 2021).
- Imahashi, R. COVID Adviser Warns Tokyo about Allowing Olympic Spectators. Available online: https://asia.nikkei.com/Spotlight/Tokyo-2020-Olympics/COVID-adviser-warns-Tokyo-about-allowing-Olympic-spectators (accessed on 2 August 2021).
- Keh, A. Olympics Updates: Coronavirus Cases Cloud Tokyo Games, The New York Times: New York, NY, USA, 2021.
- Regalado, F. COVID Infections Haunt Olympics despite Precautions—Nikkei Asia. Available online: https://asia.nikkei.com/Spotlight/Tokyo-2020-Olympics/COVID-infections-haunt-Olympics-despite-precautions (accessed on 2 August 2021).
- Tokyo Shimbun Reasons Why Chairman Omi Stabs the Olympics “Holding Ariki” I’m Worried about the Behavior of Overseas Media and Sponsors. Available online: https://www.tokyo-np.co.jp/article/108458 (accessed on 2 August 2021).
- Asahi Shimbun Survey: 83% Against Holding Tokyo Olympics This Summer|The Asahi Shimbun: Breaking News, Japan News and Analysis. Available online: https://www.asahi.com/ajw/articles/14351670 (accessed on 2 August 2021).
- Asahi Shimbun Editorial: Prime Minister Suga, Please Call off the Olympics This Summer|The Asahi Shimbun: Breaking News, Japan News and Analysis. Available online: https://www.asahi.com/ajw/articles/14357907 (accessed on 2 August 2021).
- Asahi Shimbun Editorial: Government Has Blinders on as It Plows Ahead with Reckless Olympics|The Asahi Shimbun: Breaking News, Japan News and Analysis. Available online: https://www.asahi.com/ajw/articles/14346727 (accessed on 2 August 2021).
- Boykoff, J. Perspective|Tokyo Is Learning That the Only Force Stronger than a Pandemic Is the Olympics, Washington Post: Washington, DC, USA, 2021.
- Felsenthal, E. Front Line Workers Tell Their Own Stories in the New Issue of Time. Available online: https://time.com/5818271/ (accessed on 2 August 2021).
- Imahashi, R. Will the Olympics Be “Safe and Secure” or a Superspreader Event? Nikkei Asia. Available online: https://asia.nikkei.com/Spotlight/Tokyo-2020-Olympics/Will-the-Olympics-be-safe-and-secure-or-a-superspreader-event (accessed on 2 August 2021).
- Independent Global News No Tokyo Olympics: As COVID Spikes in Japan, Calls Grow to Cancel Games. IOC Refuses. Who Profits? Available online: https://www.democracynow.org/2021/5/27/cancel_tokyo_olympics (accessed on 2 August 2021).
- Rasheed, Z. How Safe Are the Tokyo Olympics from COVID-19? Available online: https://www.aljazeera.com/news/2021/7/23/how-safe-are-the-tokyo-olympics-from-covid-19 (accessed on 2 August 2021).
- How COVID-19 Could Impede the Catch-Up of Poor Countries with Rich Ones. Available online: https://www.economist.com/finance-and-economics/2021/05/20/how-covid-19-could-impede-the-catch-up-of-poor-countries-with-rich-ones (accessed on 20 May 2021).
- Government CIO Portals Inoculation Status of New Corona Vaccine (General Inoculation (Including Elderly People)). Available online: https://public.tableau.com/views/vrs-dashboard/sheet0?:embed=y&:showVizHome=no&:host_url=https%3A%2F%2Fpublic.tableau.com%2F&:embed_code_version=3&:tabs=no&:toolbar=yes&:animate_transition=yes&:display_static_image=no&:display_spinner=no&:display_overlay=yes&:display_count=yes&:language=ja&:device=desktop&:loadOrderID=0 (accessed on 2 August 2021).
- Ritchie, H.; Ortiz-Ospina, E.; Beltekian, D.; Mathieu, E.; Hasell, J.; Macdonald, B.; Giattino, C.; Appel, C.; Rodés-Guirao, L.; Roser, M. Coronavirus Pandemic (COVID-19); Our World in Data: Oxford, UK, 2020. [Google Scholar]
- Zimbalist, A. Circus Maximus: The Economic Gamble Behind Hosting the Olympics and the World Cup; Brookings Institution Press: Washington, DC, USA, 2015. [Google Scholar]
- Flyvbjerg, B.; Budzier, A.; Lunn, D. Regression to the Tail: Why the Olympics Blow Up. Environ. Plan. A Econ. Space 2021, 53, 233–260. [Google Scholar] [CrossRef]
- Scandizzo, P.L.; Pierleoni, M.R. Assessing the Olympic Games: The Economic Impact and Beyond. J. Econ. Surv. 2018, 32, 649–682. [Google Scholar] [CrossRef]
- Jenkins, S. Perspective|Japan Should Cut Its Losses and Tell the IOC to Take Its Olympic Pillage Somewhere Else; Washington Post: Washington, DC, USA, 2021. [Google Scholar]
- TBS News the City Requests to Secure a Corona Bed Due to the Rapid Spread of Infection. Available online: https://news.yahoo.co.jp/articles/39dd22c816ee7eb35d76bc0482ec55af601cb05f (accessed on 2 August 2021).
- The Guardian Olympics Chief Mixes up Japanese and Chinese at Tokyo Games Presser. Available online: http://www.theguardian.com/world/2021/jul/13/olympics-chief-refers-to-people-of-japan-as-chinese (accessed on 2 August 2021).
- The Guardian Thomas Bach Promises ‘Safe and Secure’ Olympics as Tokyo Covid Cases Soar. Available online: http://www.theguardian.com/sport/2021/jul/14/thomas-bach-promises-safe-and-secure-olympics-as-tokyo-covid-cases-soar (accessed on 2 August 2021).
- Davahli, M.R.; Fiok, K.; Karwowski, W.; Aljuaid, A.M.; Taiar, R. Predicting the Dynamics of the COVID-19 Pandemic in the United States Using Graph Theory-Based Neural Networks. Int. J. Environ. Res. Public Health 2021, 18, 3834. [Google Scholar] [CrossRef]
- Davahli, M.R.; Karwowski, W.; Fiok, K. Optimizing COVID-19 Vaccine Distribution across the United States Using Deterministic and Stochastic Recurrent Neural Networks. PLoS ONE 2021, 16, e0253925. [Google Scholar] [CrossRef] [PubMed]
- Bracke, S.; Puls, A.; Inoue, M. COVID-19 Pandemic: Analyzing of Spreading Behavior, the Impact of Restrictions and Prevention Measures in Germany and Japan. medRxiv 2021, 2–9. [Google Scholar] [CrossRef]
- Amengual, O.; Atsumi, T. COVID-19 Pandemic in Japan. Rheumatol. Int. 2021, 41, 1–5. [Google Scholar] [CrossRef]
- Looi, M.-K. Covid-19: Japan Declares State of Emergency as Tokyo Cases Soar. BMJ 2020, 369, m1447. [Google Scholar] [CrossRef] [Green Version]
- Tashiro, A.; Shaw, R. COVID-19 Pandemic Response in Japan: What Is behind the Initial Flattening of the Curve? Sustainability 2020, 12, 5250. [Google Scholar] [CrossRef]
- Loewenthal, G.; Abadi, S.; Avram, O.; Halabi, K.; Ecker, N.; Nagar, N.; Mayrose, I.; Pupko, T. COVID-19 Pandemic-Related Lockdown: Response Time Is More Important than Its Strictness. EMBO Mol. Med. 2020, 12, e13171. [Google Scholar] [CrossRef]
- Iwasaki, A.; Grubaugh, N.D. Why Does Japan Have So Few Cases of COVID-19? EMBO Mol. Med. 2020, 12, e12481. [Google Scholar] [CrossRef]
- Saito, S.; Asai, Y.; Matsunaga, N.; Hayakawa, K.; Terada, M.; Ohtsu, H.; Tsuzuki, S.; Ohmagari, N. First and Second COVID-19 Waves in Japan: A Comparison of Disease Severity and Characteristics: Comparison of the Two COVID-19 Waves in Japan. J. Infect. 2020, 82, 84–123. [Google Scholar] [CrossRef] [PubMed]
- Karako, K.; Song, P.; Chen, Y.; Tang, W.; Kokudo, N. Overview of the Characteristics of and Responses to the Three Waves of COVID-19 in Japan during 2020–2021. Biosci. Trends 2021, 15, 1–8. [Google Scholar] [CrossRef] [PubMed]
- Han, E.; Tan, M.M.J.; Turk, E.; Sridhar, D.; Leung, G.M.; Shibuya, K.; Asgari, N.; Oh, J.; García-Basteiro, A.L.; Hanefeld, J.; et al. Lessons Learnt from Easing COVID-19 Restrictions: An Analysis of Countries and Regions in Asia Pacific and Europe. Lancet 2020, 396, 1525–1534. [Google Scholar] [CrossRef]
- Yan, B.; Zhang, X.; Wu, L.; Zhu, H.; Chen, B. Why Do Countries Respond Differently to COVID-19? A Comparative Study of Sweden, China, France, and Japan. Am. Rev. Public Adm. 2020, 50, 762–769. [Google Scholar] [CrossRef]
- Reich, M.R. Pandemic Governance in Japan and the United States: The Control-Tower Metaphor. Health Syst. Reform 2020, 6, e1829314. [Google Scholar] [CrossRef] [PubMed]
- Shimizu, K.; Wharton, G.; Sakamoto, H.; Mossialos, E. Resurgence of COVID-19 in Japan. BMJ 2020, 370, m3221. [Google Scholar] [CrossRef]
- Machida, M.; Nakamura, I.; Kojima, T.; Saito, R.; Nakaya, T.; Hanibuchi, T.; Takamiya, T.; Odagiri, Y.; Fukushima, N.; Kikuchi, H.; et al. Acceptance of a COVID-19 Vaccine in Japan during the COVID-19 Pandemic. Vaccines 2021, 9, 210. [Google Scholar] [CrossRef] [PubMed]
- Bonasera, A.; Zhang, S. Chaos, Percolation and the Coronavirus Spread. Front. Phys. 2020, 8, 171. [Google Scholar] [CrossRef]
- Sapkota, N.; Karwowski, W.; Davahli, M.R.; Al-Juaid, A.; Taiar, R.; Murata, A.; Wróbel, G.; Marek, T. The Chaotic Behavior of the Spread of Infection During the COVID-19 Pandemic in the United States and Globally. IEEE Access 2021, 9, 80692–80702. [Google Scholar] [CrossRef]
- Matouk, A.E. Complex Dynamics in Susceptible-Infected Models for COVID-19 with Multi-Drug Resistance. Chaos Solitons Fractals 2020, 140, 110257. [Google Scholar] [CrossRef]
- Raj, V.; Renjini, A.; Swapna, M.S.; Sreejyothi, S.; Sankararaman, S. Nonlinear Time Series and Principal Component Analyses: Potential Diagnostic Tools for COVID-19 Auscultation. Chaos Solitons Fractals 2020, 140, 110246. [Google Scholar] [CrossRef] [PubMed]
- Pedro, S.A.; Abelman, S.; Ndjomatchoua, F.T.; Sang, R.; Tonnang, H.E. Stability, Bifurcation and Chaos Analysis of Vector-Borne Disease Model with Application to Rift Valley Fever. PLoS ONE 2014, 9, e108172. [Google Scholar] [CrossRef] [PubMed]
- Billings, L.; Schwartz, I.B. Exciting Chaos with Noise: Unexpected Dynamics in Epidemic Outbreaks. J. Math. Biol. 2002, 44, 31–48. [Google Scholar] [CrossRef]
- Grenfell, B.T.; Bjørnstad, O.N.; Finkenstädt, B.F. Dynamics of Measles Epidemics: Scaling Noise, Determinism, and Predictability with the TSIR Model. Ecol. Monogr. 2002, 72, 185–202. [Google Scholar] [CrossRef]
- Eilersen, A.; Jensen, M.H.; Sneppen, K. Chaos in Disease Outbreaks among Prey. Sci. Rep. 2020, 10, 3907. [Google Scholar] [CrossRef] [Green Version]
- He, S.; Banerjee, S. Epidemic Outbreaks and Its Control Using a Fractional Order Model with Seasonality and Stochastic Infection. Phys. A Stat. Mech. Its Appl. 2018, 501, 408–417. [Google Scholar] [CrossRef]
- Yi, N.; Zhang, Q.; Mao, K.; Yang, D.; Li, Q. Analysis and Control of an SEIR Epidemic System with Nonlinear Transmission Rate. Math. Comput. Model. 2009, 50, 1498–1513. [Google Scholar] [CrossRef]
- Li, L.; Sun, G.-Q.; Jin, Z. Bifurcation and Chaos in an Epidemic Model with Nonlinear Incidence Rates. Appl. Math. Comput. 2010, 216, 1226–1234. [Google Scholar] [CrossRef]
- Thiel, M.; Kurths, J.; Romano, M.C.; Károlyi, G.; Moura, A. Nonlinear Dynamics and Chaos: Advances and Perspectives; Springer: Berlin/Heidelberg, Germany, 2010. [Google Scholar]
- He, S.; Peng, Y.; Sun, K. SEIR Modeling of the COVID-19 and Its Dynamics. Nonlinear Dyn. 2020, 101, 1667–1680. [Google Scholar] [CrossRef]
- Ahmed, E.; Matouk, A.E. Complex Dynamics of Some Models of Antimicrobial Resistance on Complex Networks. Math. Methods Appl. Sci. 2021, 44, 1896–1912. [Google Scholar] [CrossRef]
- Gottwald, G.A.; Melbourne, I. On the Implementation of the 0–1 Test for Chaos. SIAM J. Appl. Dyn. Syst. 2009, 8, 129–145. [Google Scholar] [CrossRef]
- MHLW Visualizing the Data: Information on COVID-19 Infections. Available online: https://covid19.mhlw.go.jp/public/opendata/newly_confirmed_cases_daily.csv (accessed on 10 August 2021).


| Date | Prefecture | Newly Confirmed Cases | |
|---|---|---|---|
| First five records | 26 January 2020 | All | 1 |
| 26 January 2020 | Hokkaido | 0 | |
| 26 January 2020 | Aomori | 0 | |
| 26 January 2020 | Iwate | 0 | |
| 26 January 2020 | Miyagi | 0 | |
| Last five records | 5 August 2021 | Kumamoto | 127 |
| 5 August 2021 | Oita | 31 | |
| 5 August 2021 | Miyazaki | 36 | |
| 5 August 2021 | Kagoshima | 51 | |
| 5 August 2021 | Okinawa | 648 |
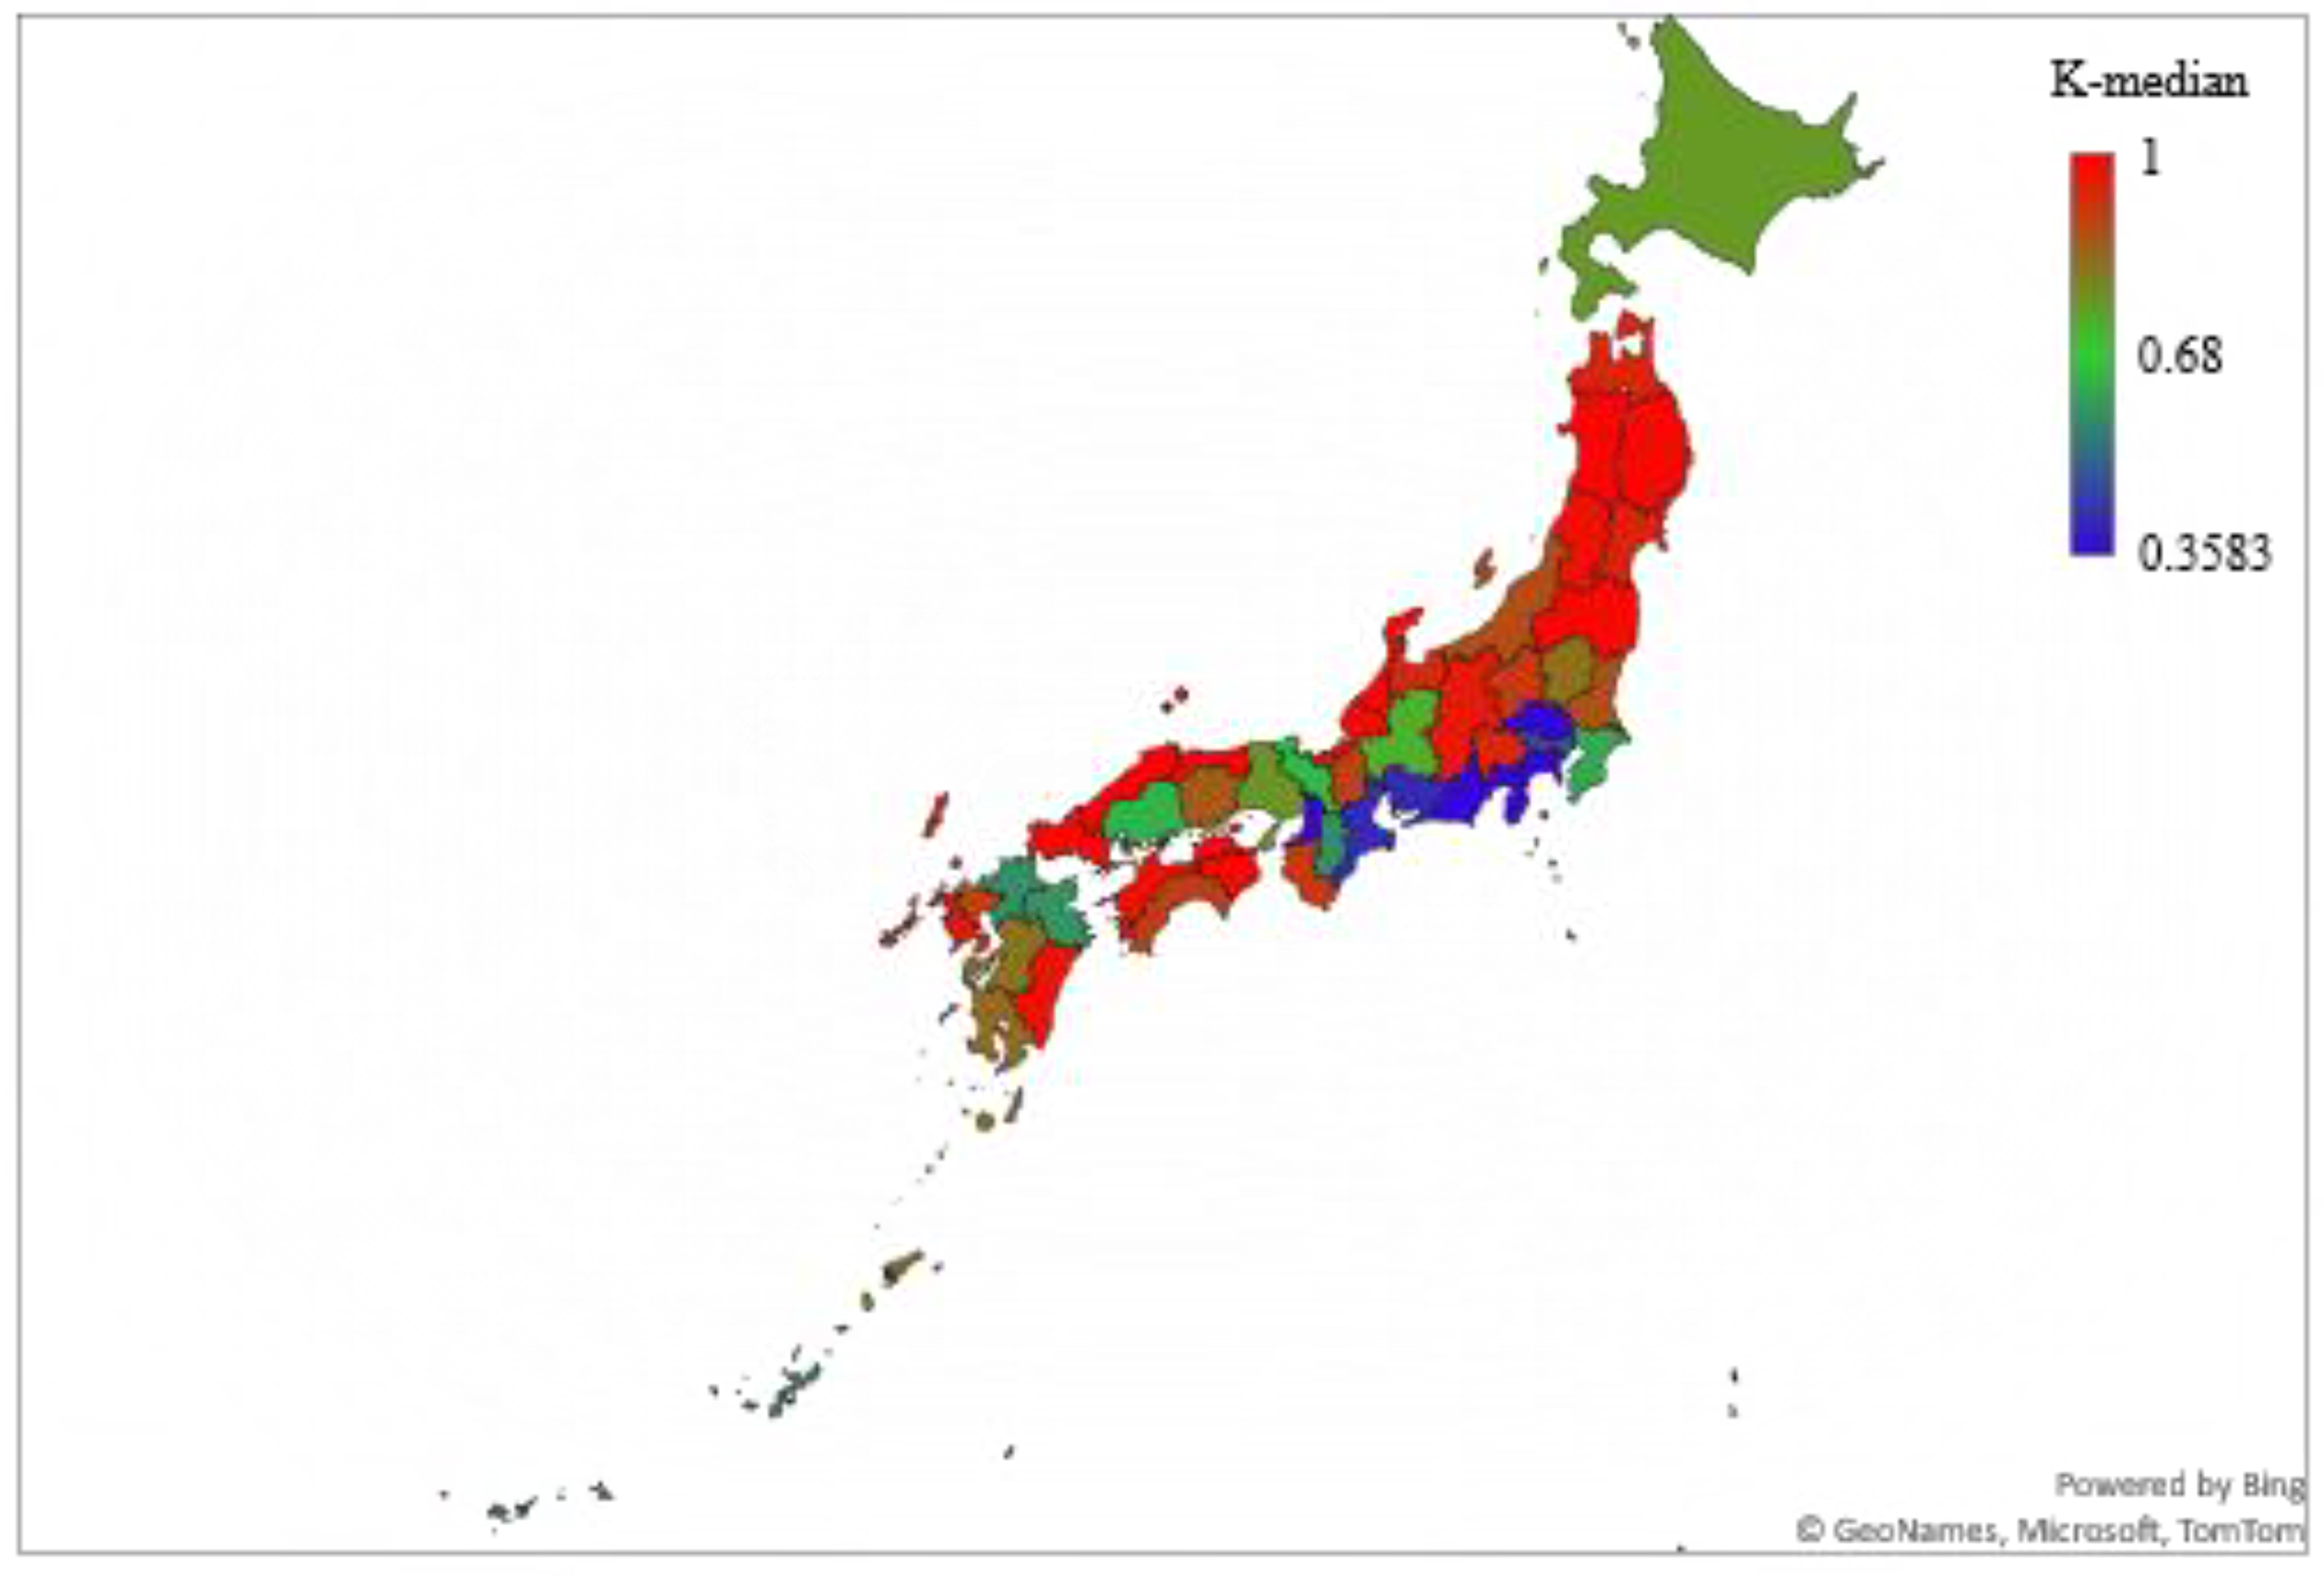
| Prefecture | K-Median |
|---|---|
| Tokyo | 0.3583 |
| Kanagawa | 0.5200 |
| Saitama | 0.6402 |
| Osaka | 0.6484 |
| Okinawa | 0.6793 |
| Hokkaido | 0.7869 |
| Aichi | 0.8094 |
| Fukuoka | 0.8375 |
| Hiroshima | 0.8498 |
| Kyoto | 0.8577 |
| Hyogo | 0.8828 |
| Tochigi | 0.9040 |
| Nara | 0.9397 |
| Okayama | 0.9401 |
| Gifu | 0.9472 |
| Shizuoka | 0.9486 |
| Miyagi | 0.9556 |
| Oita | 0.9632 |
| Mie | 0.9661 |
| Ishikawa | 0.9705 |
| Chiba | 0.9709 |
| Kumamoto | 0.9728 |
| Fukushima | 0.9759 |
| Gunma | 0.9784 |
| Shiga | 0.9785 |
| Wakayama | 0.9789 |
| Ehime | 0.9798 |
| Miyazaki | 0.9801 |
| Saga | 0.9809 |
| Yamagata | 0.9810 |
| Ibaraki | 0.9826 |
| Niigata | 0.9828 |
| Tottori | 0.9836 |
| Nagasaki | 0.9844 |
| Nagano | 0.9846 |
| Akita | 0.9882 |
| Kochi | 0.9892 |
| Iwate | 0.9904 |
| Kagoshima | 0.9919 |
| Kagawa | 0.9925 |
| Yamaguchi | 0.9926 |
| Yamanashi | 0.9929 |
| Toyama | 0.9929 |
| Tokushima | 0.9930 |
| Aomori | 0.9933 |
| Fukui | 0.9940 |
| Shimane | 0.9996 |
Publisher’s Note: MDPI stays neutral with regard to jurisdictional claims in published maps and institutional affiliations. |
© 2022 by the authors. Licensee MDPI, Basel, Switzerland. This article is an open access article distributed under the terms and conditions of the Creative Commons Attribution (CC BY) license (https://creativecommons.org/licenses/by/4.0/).
Share and Cite
Sapkota, N.; Murata, A.; Karwowski, W.; Davahli, M.R.; Fiok, K.; Aljuaid, A.M.; Marek, T.; Ahram, T. The Chaotic Behavior of the Spread of Infection during the COVID-19 Pandemic in Japan. Int. J. Environ. Res. Public Health 2022, 19, 12804. https://doi.org/10.3390/ijerph191912804
Sapkota N, Murata A, Karwowski W, Davahli MR, Fiok K, Aljuaid AM, Marek T, Ahram T. The Chaotic Behavior of the Spread of Infection during the COVID-19 Pandemic in Japan. International Journal of Environmental Research and Public Health. 2022; 19(19):12804. https://doi.org/10.3390/ijerph191912804
Chicago/Turabian StyleSapkota, Nabin, Atsuo Murata, Waldemar Karwowski, Mohammad Reza Davahli, Krzysztof Fiok, Awad M. Aljuaid, Tadeusz Marek, and Tareq Ahram. 2022. "The Chaotic Behavior of the Spread of Infection during the COVID-19 Pandemic in Japan" International Journal of Environmental Research and Public Health 19, no. 19: 12804. https://doi.org/10.3390/ijerph191912804