
Dynamic Causality Analysis of COVID-19 Pandemic Risk and Oil Market Changes


1
Department of Information Systems, Business Statistics and Operations Management, The Hong Kong University of Science and Technology, Clear Water Bay, Hong Kong, China
2
Department of Social Sciences, The Education University of Hong Kong, Tai Po, Hong Kong, China
*
Author to whom correspondence should be addressed.
J. Risk Financial Manag. 2022, 15(6), 240; https://doi.org/10.3390/jrfm15060240
Submission received: 22 April 2022
/
Revised: 18 May 2022
/
Accepted: 23 May 2022
/
Published: 27 May 2022
(This article belongs to the Special Issue Risk and Financial Management of COVID-19 in Business, Economics and Finance)
Abstract
:Crude oil draws attention in recent research as its demand may indicate world economic growth trend in the post-COVID-19 era. In this paper, we study the dynamic lead–lag relationship between the COVID-19 pandemic and crude oil future prices. We perform rolling-sample tests to evidence whether two pandemic risk scores derived from network analysis, including a preparedness risk score and a severity risk score, Granger-cause changes in oil future prices. In our empirical analysis, we observe 49% to 60% of days in 2020 to 2021 during which the pandemic scores significantly affected oil futures. We also find an asymmetric lead–lag relationship, indicating that there is a tendency for oil futures to move significantly when the pandemic is less severe but not when it is more severe. This study adopts preparedness risk score and severity risk score as proxy variables to measure the impact of the COVID-19 pandemic risk on oil market. The asymmetric lead–lag behavior between pandemic risk and oil future prices provides insights on oil demand and consumption during the COVID-19 pandemic.
1. Introduction
Since the declaration of the global pandemic by the World Health Organization (WHO) on 11 March 2020, coronavirus disease 2019 (COVID-19) has been affecting various social, commercial, and economic activities. Despite the execution of vaccination schemes across the globe, the spread of COVID-19 continued or even accelerated due to variants such as Delta (Mahase 2021) and Omicron (Pulliam et al. 2022). As of 5 April 2022, there were more than 489 million cases and over 6 million deaths reported (WHO 2022).
The global pandemic affects not only infections and deaths, but also the stability of financial markets. In this paper, we attempt to study the dynamic lead–lag relationship between the COVID-19 pandemic and crude oil future prices. We use two pandemic scores, including preparedness risk score (PRS) and severity risk score (SRS) from So et al. (2021) as proxy variables of COVID-19 pandemic risk and study its effect on oil market changes. Specifically, we perform a rolling-window Granger causality test (So et al. 2021; Song et al. 2021) to determine the days or time periods when pandemic risk measures constructed by the network analysis in Song et al. (2021) can lead oil future return movement. We also provide visualization to evidence the level of impact.
The structure of the paper is as follows. Section 2 provides a literature review. Section 3 presents the pandemic risk measures and details of the rolling-window causality test. Section 4 details the empirical results of the Granger causality test over time. Section 5 discusses the results. Section 6 concludes.
2. Literature Review
2.1. The Impact of COVID-19 on Global Financial Markets
The COVID-19 pandemic has had tremendous impact on the global economy (Ashraf and Goodell 2021) and financial markets (Lento and Gradojevic 2022; Puławska 2021; Zhang et al. 2020). Various studies have demonstrated a wide range of effects in the banking industry, stock markets, and commodities. Jeris and Nath (2021) investigated US banks during the COVID-19 pandemic. Specifically, Štifanić et al. (2020) documented impacts of the pandemic on stock market forecasting. Chu et al. (2021) and So et al. (2021) studied the impact of the pandemic on stock markets using network analysis and Abuzayed et al. (2021) used systemic distress risk spillover. In addition, Sadefo Kamdem et al. (2020), Zhang and Wang (2021), and Iqbal et al. (2022) studied the effect of the COVID-19 pandemic on commodity volatility. Researchers have adopted different analytical techniques to investigate the relationship between COVID-19 and stock or commodity markets and measure the corresponding impact. Liu et al. (2022) and Yang et al. (2021) used spillover analysis to inspect the stock market risk contagion; Karamti and Belhassine (2022) and Khan et al. (2022) applied wavelet analysis to examine the time–frequency connectedness between COVID-19 and some financial markets; Chowdhury et al. (2022) used event study to measure the effect of COVID-19 on the changes in economy policy uncertainty; Alqahtani et al. (2020) investigated the stock markets of Gulf Cooperation Council countries and Brent oil price using GARCH model and Granger causality; Atri et al. (2021) used the autoregressive distributed lag modeling approach to analyze the impact of COVID-19 news and media coverage on oil and gold prices; and Bouri et al. (2021) studied the return connectedness across various assets around the COVID-19 outbreak based on time-varying parameter vector auto-regression.
2.2. COVID-19 Pandemic Risk and the Oil Market
Among all commodities in the market, crude oil draws particular attention because its demand may indicate world economic growth trend in the post COVID-19 era, as crude oil prices have influence on the economic policy uncertainty of different countries (Su et al. 2021); therefore, knowledge of crude oil prices may help to rebalance the energy landscape. While crude oil price movement can be indirectly affected by the pandemic, it may also be an indicator of the prosperity of the global economy during and post pandemic. Some research has studied the relationship between the pandemic and the oil market. Akhtaruzzaman et al. (2021) examined the oil price risk exposure. Benlagha and El Omari (2022) investigated the connectedness of stock markets with gold and oil while Dutta et al. (2021) studied the correlations between crude oil and climate bonds during the COVID-19 outbreak. Relatively few studies developed a relationship between the COVID-19 pandemic risk and crude oil market movement. Our research attempts to fill in such research gap. To examine the COVID-19 impact, many researchers used the infection or death information in the modeling processes (Christopoulos et al. 2021; Khan et al. 2022). To provide valuable insights for analysis, some papers used different proxy variables as the model inputs for investigating some potential relations in the analysis. For example, Lang et al. (2021) used Twitter-based market uncertainty index to predict oil futures’ volatility; Bai et al. (2021) adopted the infectious disease equity market volatility tracker to measure the effect of infectious diseases pandemic on volatility of stock markets; and Bouri et al. (2020) employed a daily newspaper-based index of uncertainty to associate with infectious diseases. So et al. (2021) developed two pandemic scores, including preparedness risk score (PRS), which accounts for the risk of asymptomatic transmission or presymptomatic transmission due to possible interaction between people in the two countries and severity risk score (SRS), which quantifies the number of possible interactions between currently infected cases of one country and all people at risk in another country, if the two countries are linked together, based on COVID-19 public available data such as total number of confirmed cases, number of recovered cases and accumulated number of deaths due to COVID-19 in each country; therefore, we employed these two scores as proxy variables of COVID-19 pandemic risk in the current study. The program code used to produce the Granger causality results can be accessed in the GitHub repository at https://github.com/covid-19-analytics/COVID-19-OilMarket-GrangerCausality.
3. Materials and Methods
3.1. Measures of Pandemic Risk
To investigate any lead–lag relationship between the COVID-19 pandemic risk and crude oil market movement, we adopt the PRS and SRS in So et al. (2021) as measures of pandemic risk. The PRS and SRS were derived from pandemic network analysis where correlations of changes in the number of COVID-19 confirmed cases were used to define network links. Both PRS and SRS use the official numbers of confirmed COVID-19 cases and deaths from the WHO and are updated weekly in the COVID-19 online dashboard at https://covid-19-dev.github.io/ enabling us to keep track of the latest status of COVID-19. The PRS integrates pandemic network connectedness and people at risk of countries for preparedness. The SRS accounts for the severity of the COVID-19 pandemic using both the pandemic network connectedness and the number of confirmed COVID-19 cases. The details of the calculations of PRS and SRS can be found in So et al. (2021). The crude oil market movement was captured by the time series of the crude oil WTI (NYM$/bbl) front month futures contract price. The PRS, SRS, and the oil futures price at time t are denoted by , , and , respectively. The pandemic risk time series were extracted from the COVID-19 online dashboard and was obtained from the database provided by Bloomberg.
3.2. Granger Causality Analysis
We obtained the three time series from 2 February 2020 to 11 January 2022. The daily changes in the pandemic risk scores and futures price are defined by the logarithmic returns: , , and . In computing , the negative oil price on 20 April 2020 was changed to 0.001. We performed a rolling-sample Granger causality test (Granger 1980; Granger et al. 2000; So et al. 2021; Song et al. 2021) based on the following model.
where p is a time lag parameter. We tested the null hypothesis , versus the alternative hypothesis was nonzero to examine the Granger causality from the PRS and SRS to oil price movement. To determine the statistical significance at time t on whether and Granger-cause , we fit the model in (1) using observations in w days (, , …, , , …, , , …, ), for , where w is the window width. In the above rolling-sample scheme, we detect any significant lead–lag relationship between (, ) and at time t using the recent past w observations. To study the sensitivity of the statistical test results of the Granger causality test on , we consider three window widths: w = 42, 49, and 56 days, and eight time lags, p = . In other words, we produce time series of p-values from the Granger causality tests for different combinations of p and w to understand how the lead–lag pattern between the pandemic risk scores and the crude oil futures changes over time.
4. Results
The numbers of tested days are 449, 442, and 435, and the numbers of significant () tested days are 219, 220, and 259, respectively, for the window widths of w = 42, 49, and 56. The US public holidays and weekends on 2 February 2020 to 11 January 2022 are excluded from investigation. Using rolling-sample analysis, we obtain the result that logarithmic changes of PRS and SRS Granger-cause the oil futures returns in 49%, 50%, and 60% of the tested days in w = 42, 49, and 56, respectively.
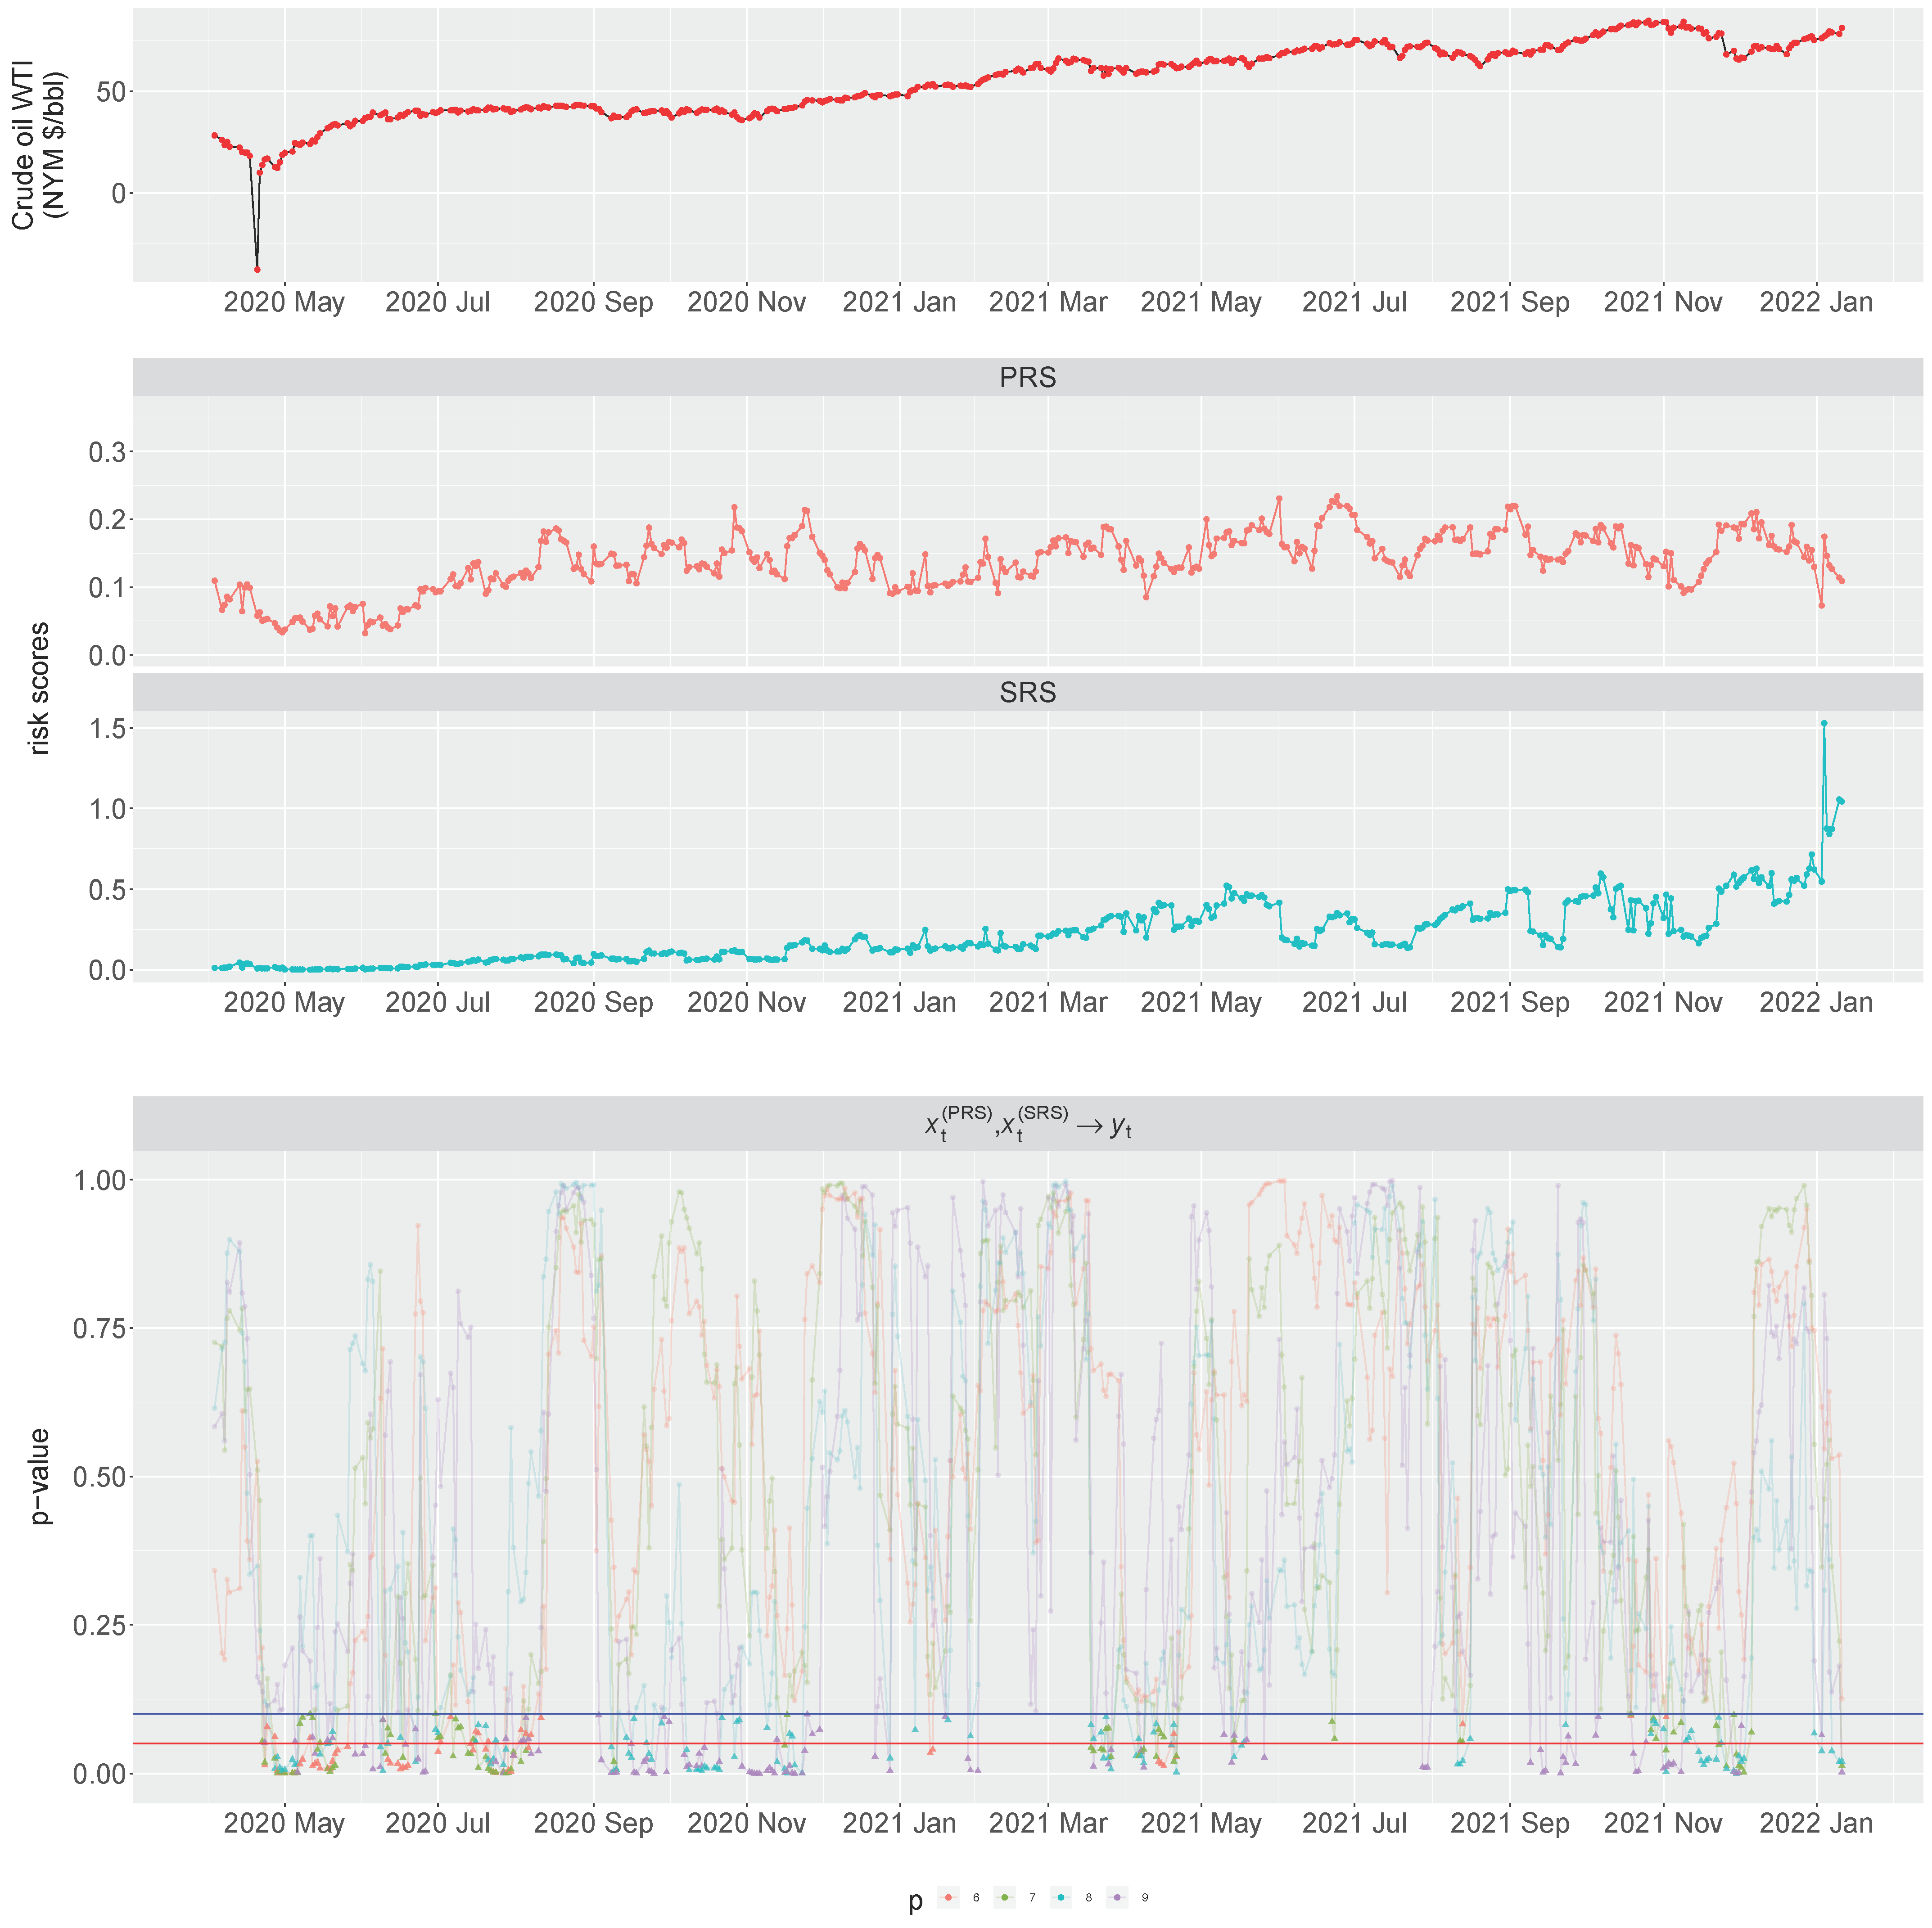
Table 1 shows the summary statistics of the crude oil WTI (NYM $/bbl) front month futures contract price and the pandemic risk scores. The summary statistics include the minimum, the first quartile (Q1), median, the third quartile (Q3), maximum, mean, standard deviation, kurtosis, and skewness. Figure 1, Figure 2 and Figure 3 present time series plots of oil futures, PRS, SRS, and Granger causality test p-values. The three figures correspond to the three window widths of 42, 49, and 56. In each plot of the time series of p-values, we consider different time lag p and we include two reference horizontal lines at 0.05 and 0.1 for identifying significant Granger causality from PRS and SRS to oil futures in the rolling-window analysis. In all three figures, the time series plots of oil futures, PRS, and SRS are the same, except that the starting points of the time series are the first day we perform the Granger causality test, which is dependent on the window width. The oil futures price exhibits an increasing trend from May 2020 to December 2021. The SRS extracted from https://covid-19-dev.github.io/, which is based on the network methodology in So et al. (2021), has been varying from 0 to 1.5 and is still showing some footprint of slowly rising trend even at the end of 2021, when COVID-19 had been declared as a global pandemic for close to two years. Regarding the Granger causality results, we are particularly interested in those days when we find statistical significance at 5% or 10% levels, that is, the days we obtain sufficient evidence to support the hypothesis of Granger causing of PRS and SRS to oil futures changes.
Figure 1 shows the results for . We observe in the figure some clusters of significant p-values in periods including May to early August 2020, September to November 2020, late March to early April 2021 and late October to November 2021.
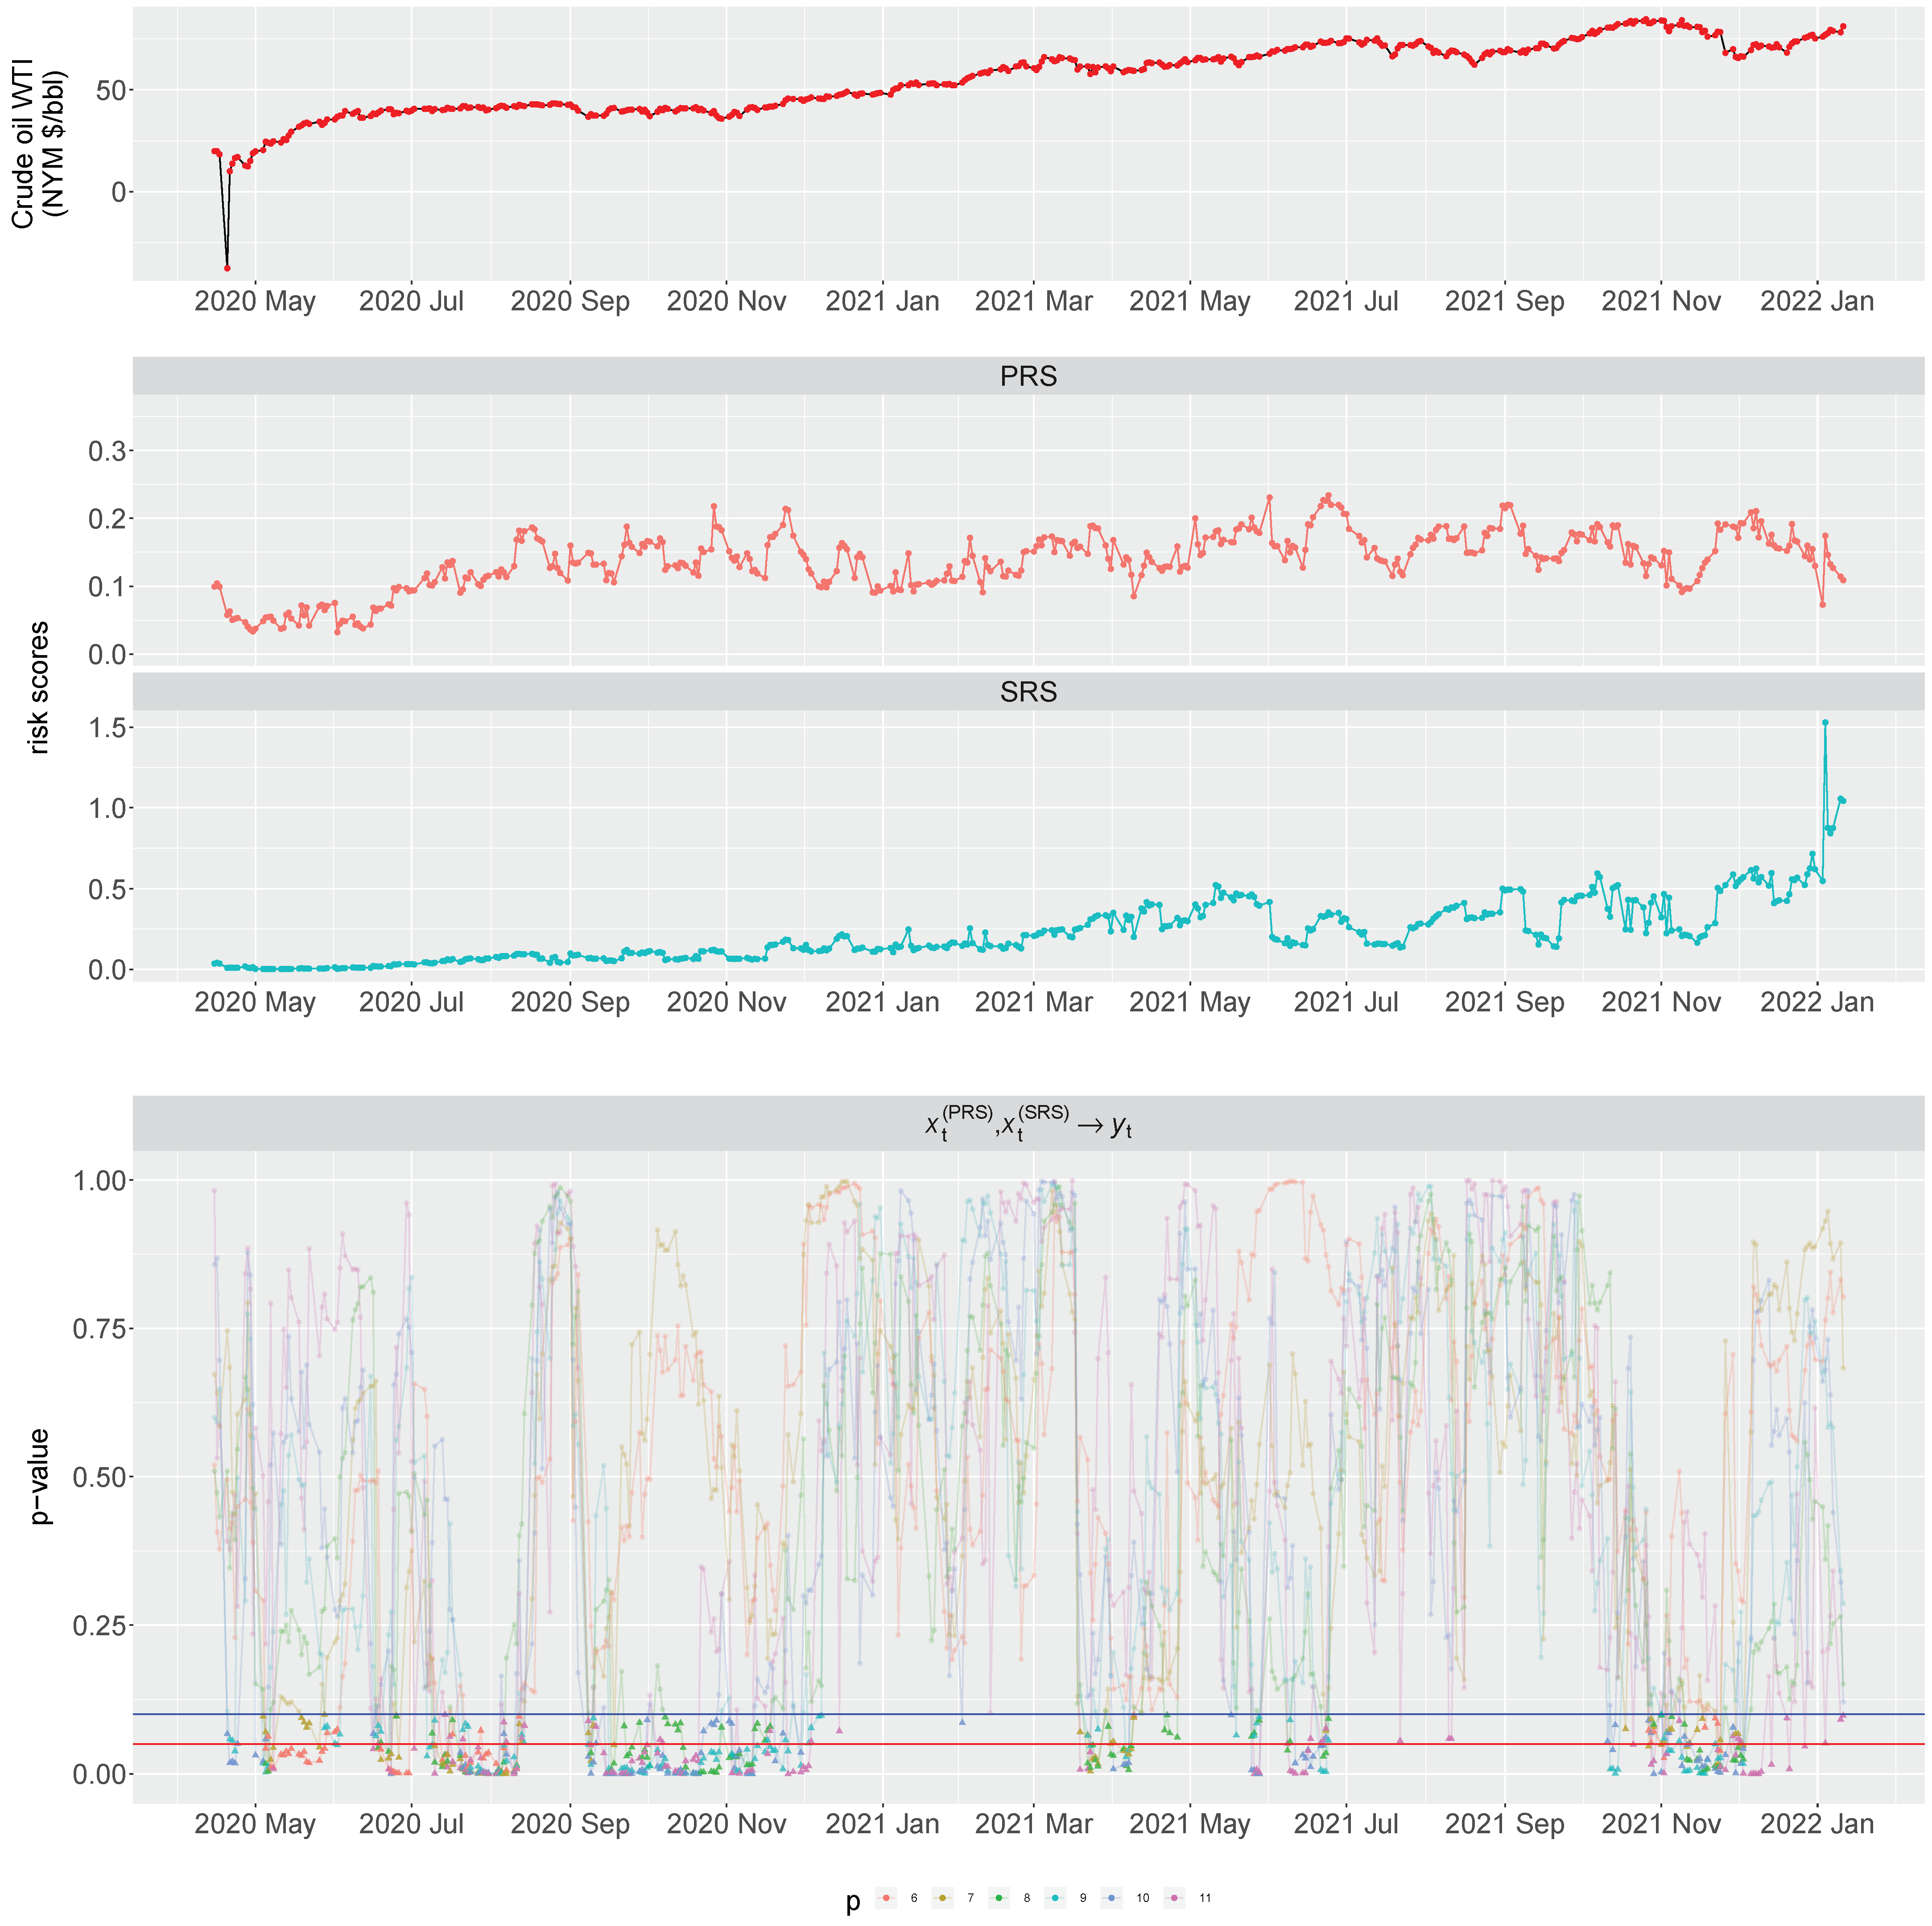
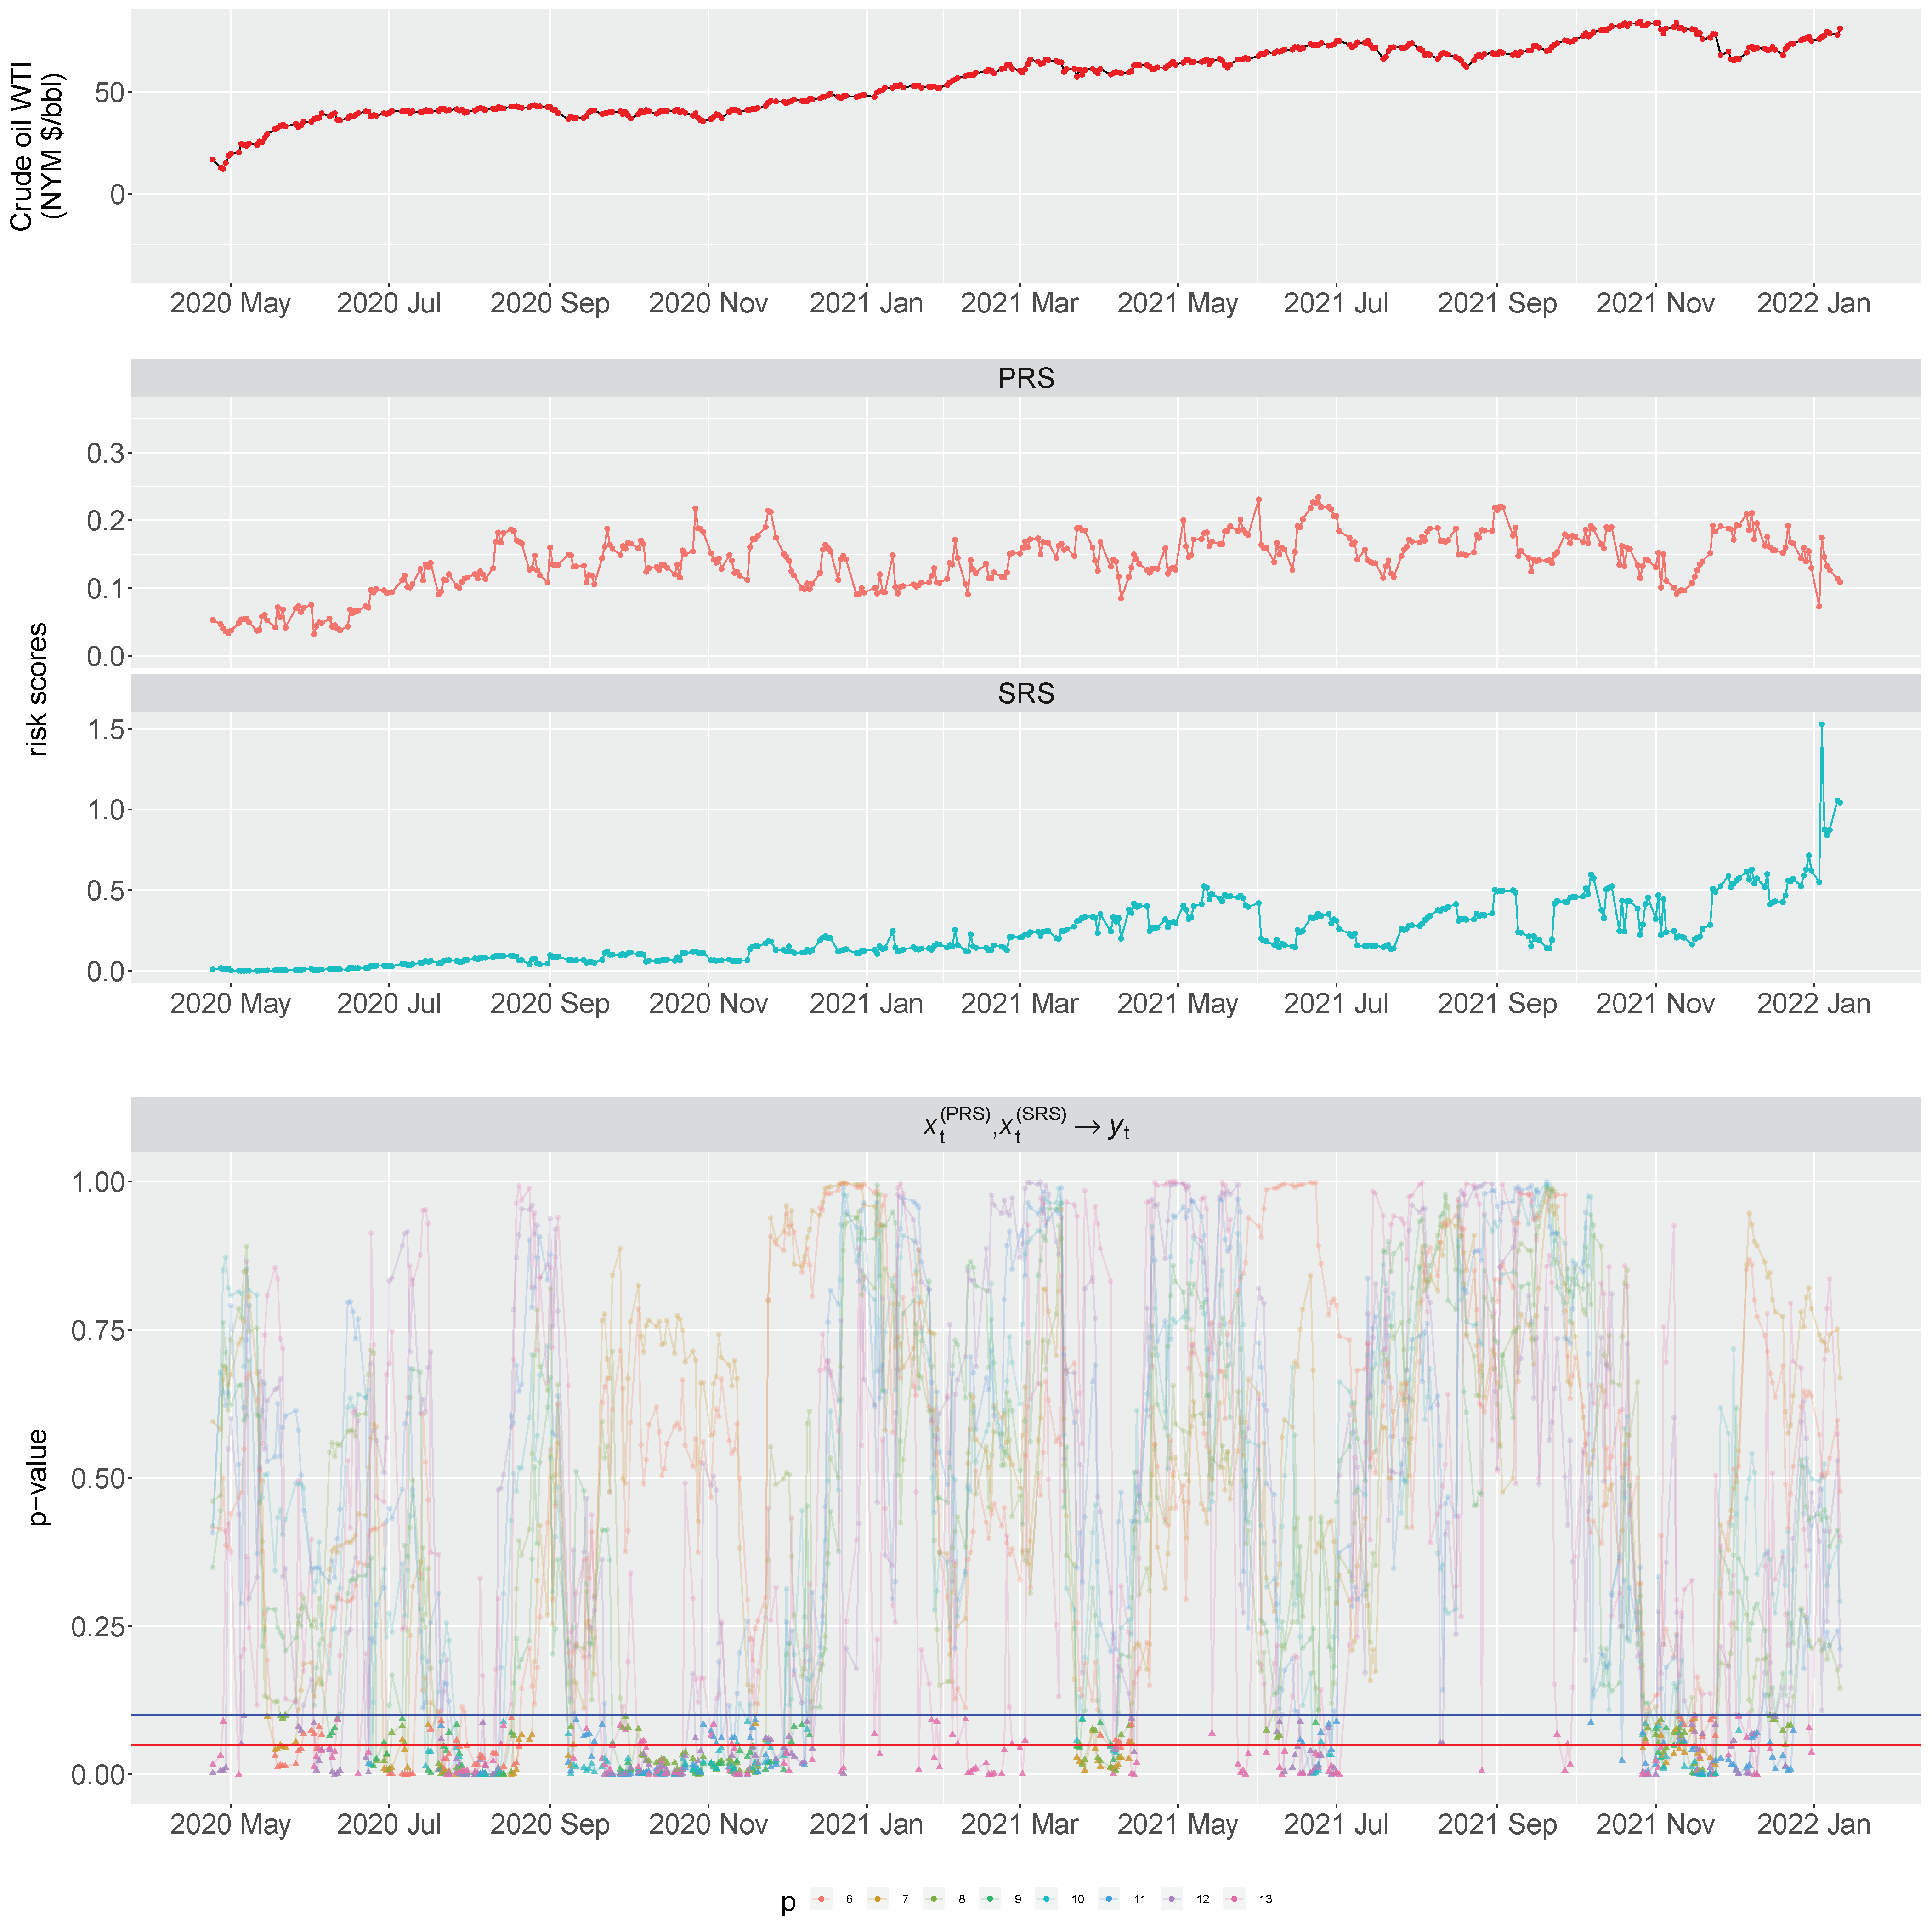
Figure 2 and Figure 3 show the results for and 56, respectively. Similar results in Granger causality tests can be found (i.e., clusters of significant p-values in periods of May to early August 2020, September to November 2020, late March to early April 2021, and late October to November 2021), demonstrating that the tests are robust to the choice of w.
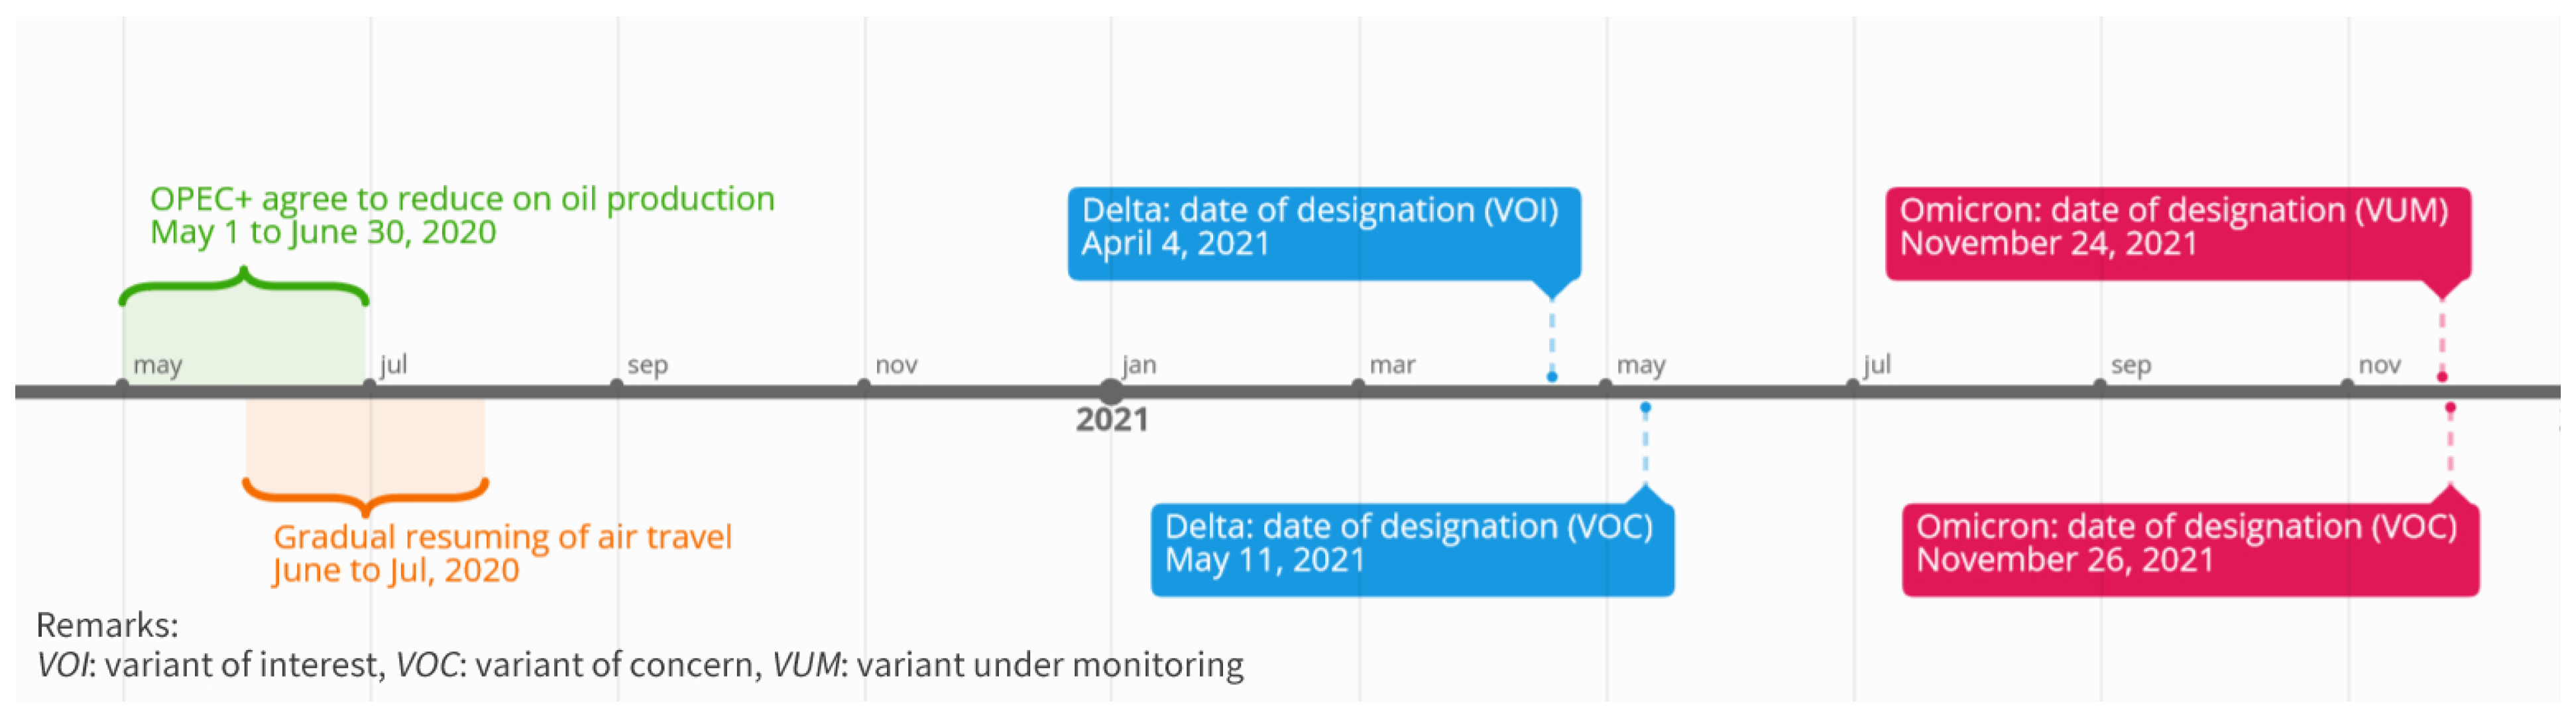
In late March to early August 2020, there is a rising trend in both PRS and SRS, signifying higher COVID-19 pandemic risk. This may trigger OPEC+ to agree on the reduction in oil production in May and June 2020 (Arshizadeh et al. 2021; Jefferson 2020). Together with the gradual resuming of air travel in June and July 2020 (Chu et al. 2021), it is not surprising to see significant causal patterns from the pandemic risk scores to oil futures changes. In September to November 2020, the PRS, SRS, and oil futures are relatively stable but we still observe some significant days, though the evidence is not as strong as in the second and third quarters of 2020. In mid April to May 2021, possibly because of the influence of the Delta variant of COVID-19 (Mahase 2021), we see obvious increase in SRS and a mild rebound in PRS; however, before the increase in the pandemic risk during April to May 2021, we observe a cluster of days of significant Granger causality tests in late March to early April 2021 when oil futures moved upward. In late November to early December 2021, we observe substantial increase in both PRS and SRS, and an obvious decline in oil futures prices. On the COVID-19 dashboard at https://covid-19-dev.github.io/, we see an obvious increase in the risk contribution from around 25% to more than 50% based on the SRS from Europe, which may explain the higher pandemic risk possibly due to another wave of the pandemic in Europe in October and November 2021. Indeed, WHO labeled the new COVID-19 strain called Omicron as a variant under monitoring and variant of concern on 24 November and 26 November, 2021, respectively. Figure 4 shows a timeline of some key events related to COVID-19 or the oil market.
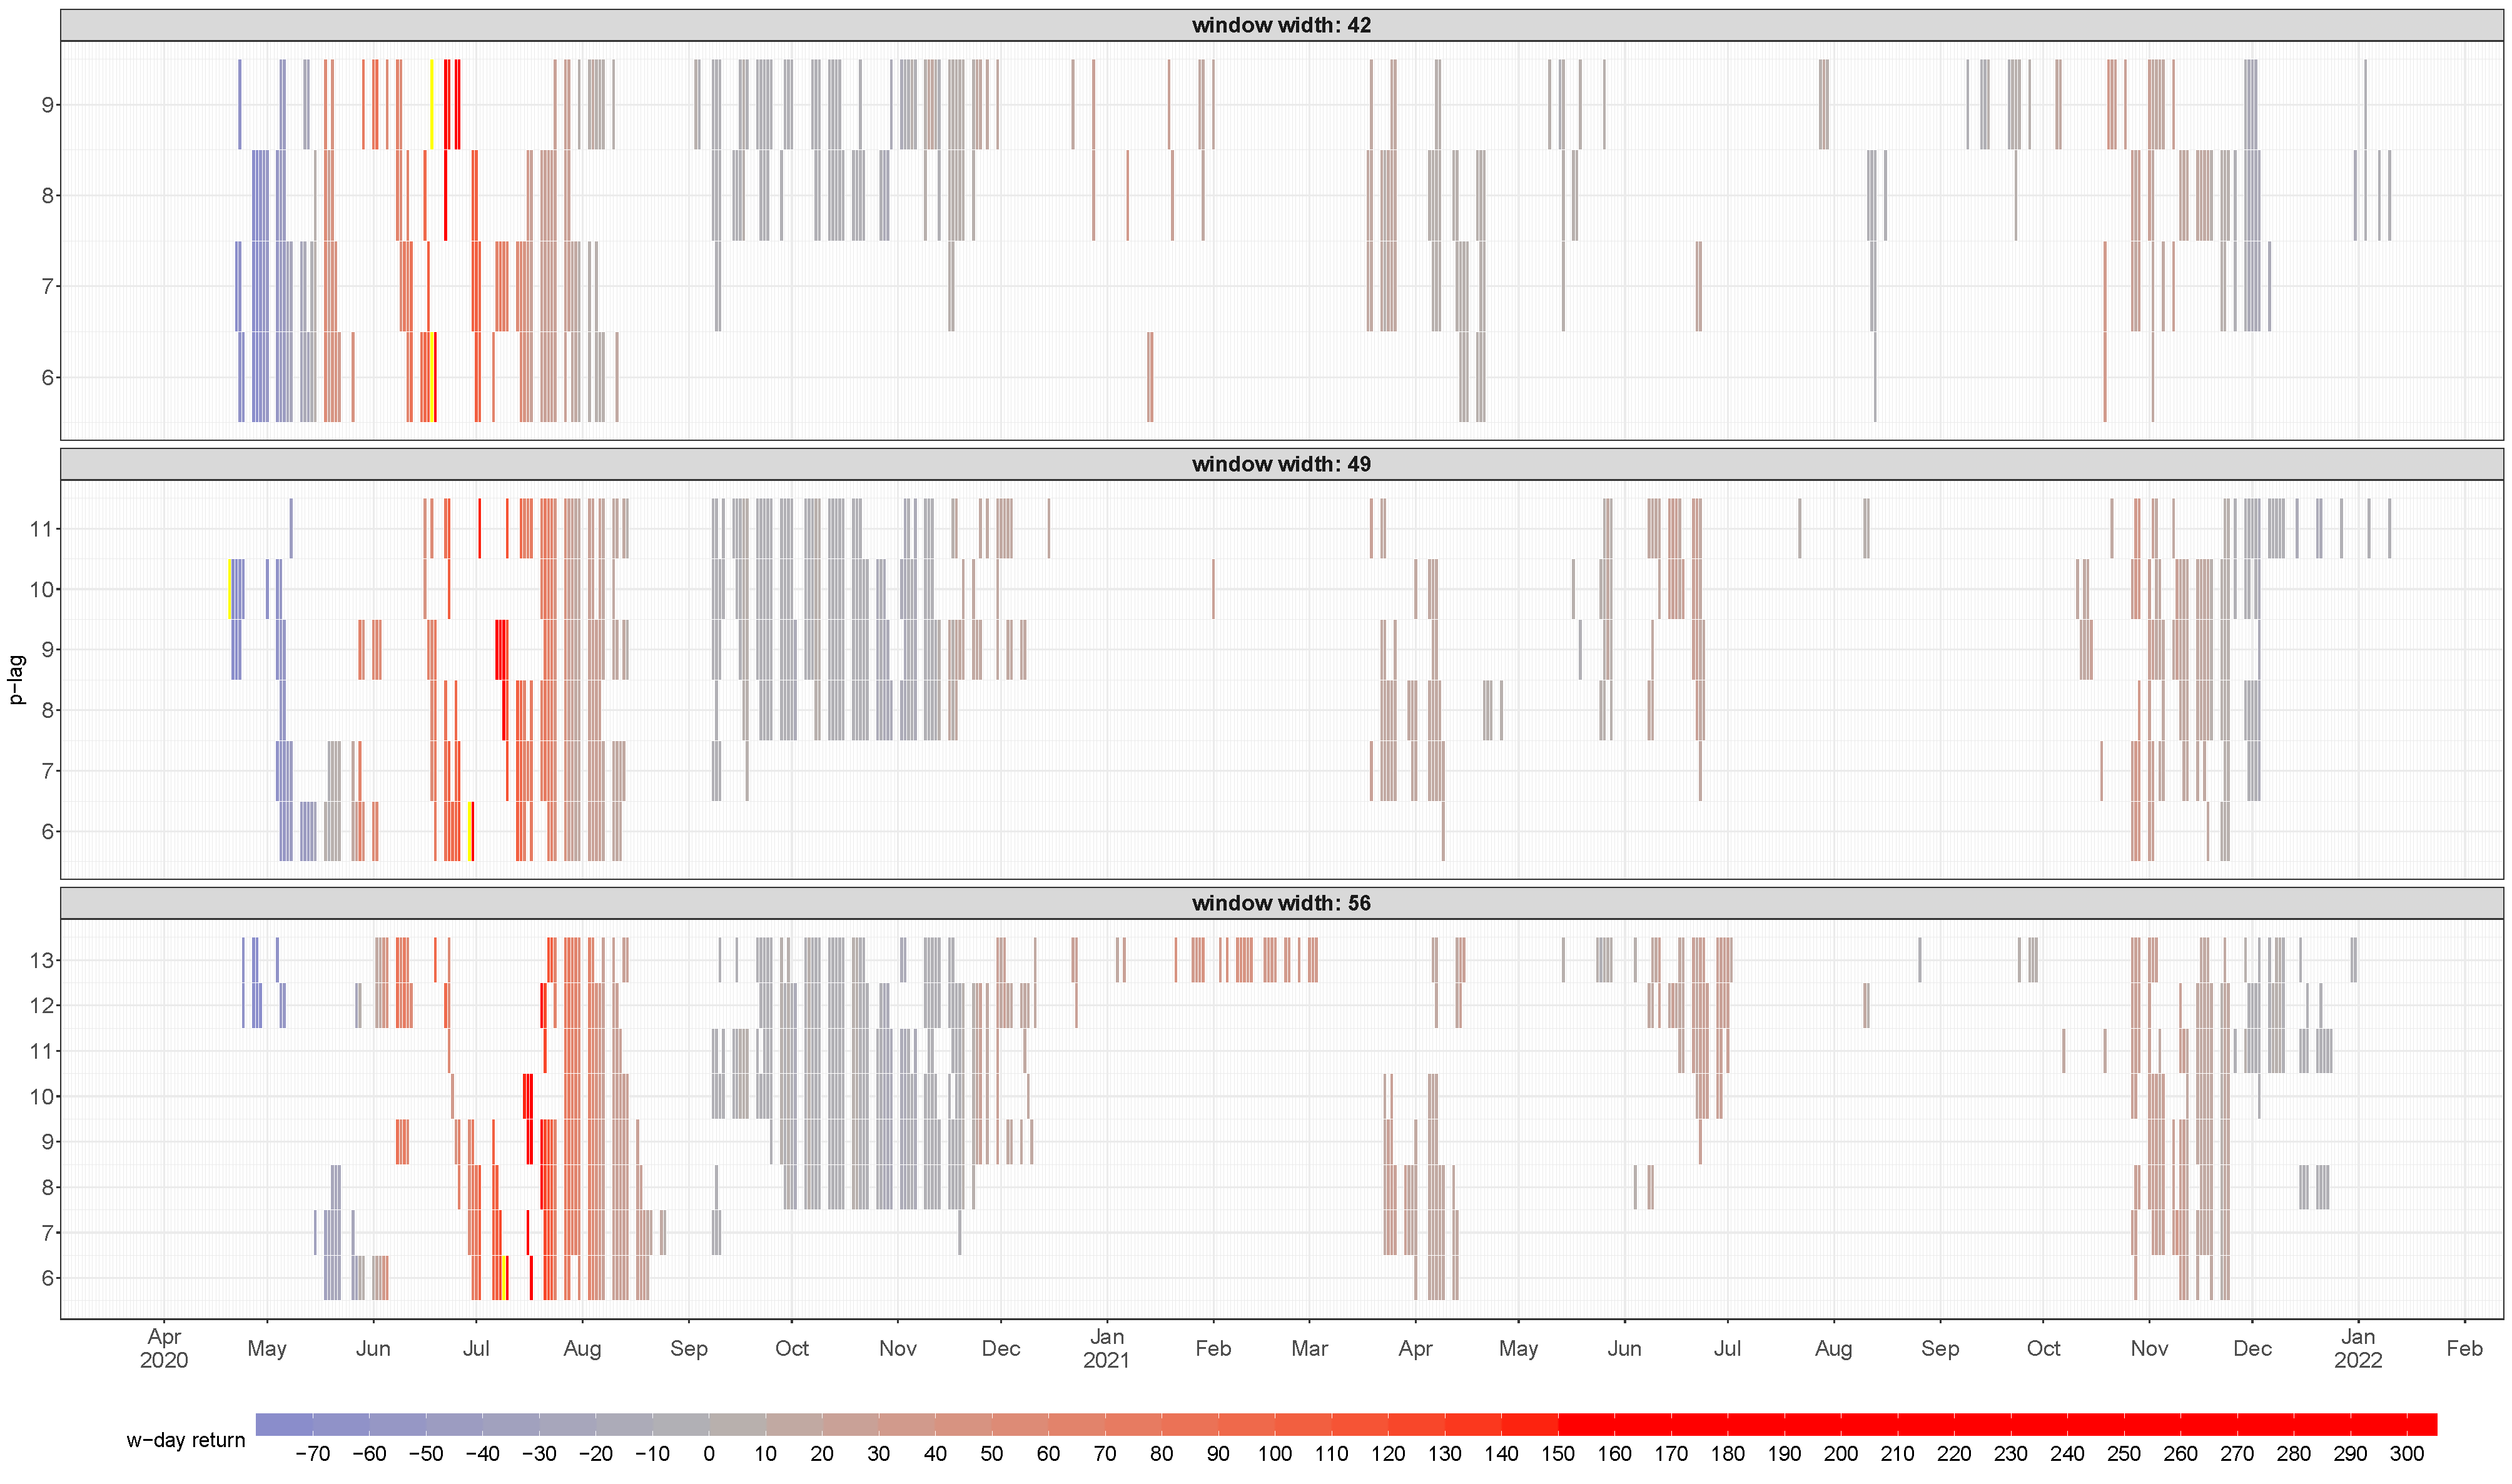
To understand the actual impact of the pandemic risk scores PRS and SRS on oil futures, we calculate the w-day returns, = when t is the day when the Granger causality test is significant at . Figure 5 gives a heatmap of the w-day returns and Table 2 shows summary statistics of the w-day returns, including the minimum, the first quartile (Q1), median, mean, the third quartile (Q3), the maximum, and the proportion of positive and negative w-day returns. The range of the in the significant days is wide, lying from roughly −80% to 305%. The distribution of is skewed to the right such that medians are positive and proportions of positive are at least 64%. In 50% of the significant days, is at least 6.54%. Determining from Q3, is at least 21.56% in 25% of the significant days. We also find that the magnitude of Q3 is much larger than that of Q1. Although there is minor difference in the summary statistics in Table 2 for w = 42, 49, and 56, the results are largely consistent and robust with respect to the choice of w. In the heatmap in Figure 5, the red regions signify positive . A cluster of red regions is identified in June and July 2020. From the time series of oil futures prices in Figure 1, Figure 2 and Figure 3, there is a significant rebound of oil futures prices in May 2020 and there is a decline in the pandemic risk scores, PRS and SRS in late April and May 2020. Another cluster of red regions appears in April 2021 before the Delta variant (named by the WHO on 31 May 2021) influenced the global pandemic in the second half of 2021. The third red cluster lies in late October to early November 2021 before Omicron was first reported to the WHO on 24 November 2021 (He et al. 2021). The blue regions in the heatmap show the days when we see negative . An early “blue" cluster is in May 2020, when there is a severe impact from the outbreak of the COVID-19 pandemic in April and May 2020. In late November and early December 2021 when we record increase in SRS and decline in oil futures prices, the influence of Omicron on oil futures prices started showing mild impact and only a slight blue region in early December 2021 is observed.
5. Discussion
In this paper, we investigated the dynamic lead–lag relationship between two pandemic risk scores derived from network analysis, including the preparedness risk score and severity risk score, and oil futures prices. We performed rolling-sample Granger causality tests to identify days when the lead–lag relationship is statistically significant. In our empirical study, we observed that in 49% to 60% of the days from 2020 to 2021, the Granger causality test is significant. The significant days form several clusters of significance in 2020 and 2021. In those significant days, at least 64% of the 42-day, 49-day, and 56-day returns are positive.
When the pandemic is becoming less severe, triggering lower pandemic risk scores, there may be a tendency for oil futures to go up; however, when the pandemic becomes more severe (similar to what we see during the impact of the Omicron variant in December 2021), a similar effect of the pandemic risk scores on oil futures is only clearly observed in early 2020. The contribution of this paper is two-fold. First, the research results demonstrate the asymmetric lead–lag relationship between COVID-19 pandemic and crude oil futures prices, which implies that the impact of COVID-19 on crude oil futures prices is different at different risk stages. The findings provide researchers and policymakers with valuable information to develop preventive strategies on oil price fluctuations. Second, our research took the lead to study pandemic risk on oil market changes and contributed to the existing knowledge regarding the two pandemic risk scores for oil market changes, which is critical for researchers and policymakers to seek new variables to improve forecasting of oil future prices.
In the current study, we considered the oil market changes. We anticipate that researchers may expand the current study to look into other energy types and conduct more research to further understand the relationship between COVID-19 pandemic risk and energy market or boarder financial markets. In addition, we used two pandemic scores, PRS and SRS, as proxy variables to measure the impact of COVID-19 pandemic risk. It would be an interesting research direction to investigate pandemic risk use other risk measures.
6. Conclusions
This study explored the COVID-19 pandemic risk on oil market changes. The research indicates that the newly developed preparedness risk score and severity risk score are useful to forecast oil futures. Moreover, the asymmetric lead–lag behavior between pandemic risk and oil futures price can contribute to commodity risk management during the COVID-19 pandemic. For the containment of the spread of COVID-19, countries have been implementing different measures, including restrictions on movement (both road and flights), reductions in economic activities, and/or social distancing (Hayat et al. 2021; Kalyuzhnova and Lee 2020; Sarkodie and Owusu 2021). These measures will therefore affect the consumption and demand of energy (e.g., crude oil), which may bring uncertainty to the global economy (Bagchi et al. 2020; Su et al. 2021). The current study provides insight for researchers and policymakers on the effect of COVID-19 pandemic risk on the oil market, especially during the days when a new variant of COVID-19 was found.
Author Contributions
M.K.P.S.: Conceptualization, Methodology, Writing—review & editing, Supervision. J.N.L.C.: Data curation, Writing—original draft, Visualization. A.M.Y.C.: Methodology, Validation, Writing—original draft. All authors have read and agreed to the published version of the manuscript.
Funding
This research was partially funded by the Hong Kong University of Science and Technology research grant “Risk Analytics and Applications” (grant number SBMDF21BM07). The funding body had no role in study design, data collection and analysis, preparation of the manuscript, or the decision to publish.
Data Availability Statement
The data presented in this study are available on request from the corresponding author.
Conflicts of Interest
The authors declare no conflict of interest.
References
- Abuzayed, Bana, Elie Bouri, Nedal Al-Fayoumi, and Naji Jalkh. 2021. Systemic risk spillover across global and country stock markets during the COVID-19 pandemic. Economic Analysis and Policy 71: 180–97. [Google Scholar] [CrossRef]
- Akhtaruzzaman, Md, Sabri Boubaker, Mardy Chiah, and Angel Zhong. 2021. COVID-19 and oil price risk exposure. Finance Research Letters 42: 101882. [Google Scholar] [CrossRef] [PubMed]
- Alqahtani, Abdullah, Amine Lahiani, and Ali Salem. 2020. Crude oil and GCC stock markets: New evidence from GARCH co-integration and Granger causality approaches. International Journal of Energy Sector Management 14: 745–56. [Google Scholar] [CrossRef]
- Arshizadeh, Saba, Saba Hamid Gorgani, Pedram Taheri, Mohammadamin Givgol, Shayan Shahrokhi, and Ashkan Abdalisousan. 2021. The impact of COVID-19 on oil supply in the short term. Advanced Journal of Science and Engineering 2: 120–35. [Google Scholar]
- Ashraf, Badar Nadeem, and John W. Goodell. 2021. COVID-19 social distancing measures and economic growth: Distinguishing short-and long-term effects. Finance Research Letters 2021: 102639. [Google Scholar] [CrossRef]
- Atri, Hanen, Saoussen Kouki, and Mohamed Imen Gallali. 2021. The impact of COVID-19 news, panic and media coverage on the oil and gold prices: An ARDL approach. Resources Policy 72: 102061. [Google Scholar] [CrossRef] [PubMed]
- Bagchi, Bhaskar, Susmita Chatterjee, Raktim Ghosh, and Dhrubaranjan Dandapat. 2020. Coronavirus Outbreak and the Great Lockdown: Impact on Oil Prices and Major Stock Markets Across the Globe. Singapore: Springer. [Google Scholar]
- Bai, Lan, Yu Wei, Guiwu Wei, Xiafei Li, and Songyun Zhang. 2021. Infectious disease pandemic and permanent volatility of international stock markets: A long-term perspective. Finance Research Letters 40: 101709. [Google Scholar] [CrossRef]
- Benlagha, Noureddine, and Salaheddine El Omari. 2022. Connectedness of stock markets with gold and oil: New evidence from COVID-19 pandemic. Finance Research Letters 46: 102373. [Google Scholar] [CrossRef]
- Bouri, Elie, Oguzhan Cepni, David Gabauer, and Rangan Gupta. 2021. Return connectedness across asset classes around the COVID-19 outbreak. International Review of Financial Analysis 73: 101646. [Google Scholar] [CrossRef]
- Bouri, Elie, Riza Demirer, Rangan Gupta, and Christian Pierdzioch. 2020. Infectious diseases, market uncertainty and oil market volatility. Energies 13: 4090. [Google Scholar] [CrossRef]
- Chowdhury, Emon Kalyan, Bablu Kumar Dhar, and Alessandro Stasi. 2022. Volatility of the US stock market and business strategy during COVID-19. Business Strategy & Development, 1–11. [Google Scholar] [CrossRef]
- Christopoulos, Apostolos G., Petros Kalantonis, Ioannis Katsampoxakis, and Konstantinos Vergos. 2021. COVID-19 and the energy price volatility. Energies 14: 6496. [Google Scholar] [CrossRef]
- Chu, Amanda M. Y., Agnes Tiwari, Jacky N. L. Chan, and Mike K. P. So. 2021. Are travel restrictions helpful to control the global COVID-19 outbreak? Travel Medicine and Infectious Disease 41: 102021. [Google Scholar] [CrossRef] [PubMed]
- Chu, Amanda M. Y., Lupe S. H. Chan, and Mike K. P. So. 2021. Stochastic actor-oriented modelling of the impact of COVID-19 on financial network evolution. Stat 10: e408. [Google Scholar] [CrossRef] [PubMed]
- Dutta, Anupam, Elie Bouri, and Md Hasib Noor. 2021. Climate bond, stock, gold, and oil markets: Dynamic correlations and hedging analyses during the COVID-19 outbreak. Resources Policy 74: 102265. [Google Scholar] [CrossRef]
- Granger, Clive W. J. 1980. Testing for causality: A personal viewpoint. Journal of Economic Dynamics and Control 2: 329–52. [Google Scholar] [CrossRef]
- Granger, Clive W. J., Bwo Nung Huangb, and Chin Wei Yang. 2000. A bivariate causality between stock prices and exchange rates: Evidence from recent Asianflu. The Quarterly Review of Economics and Finance 40: 337–54. [Google Scholar] [CrossRef]
- Hayat, Muhammad Azmat, Huma Ghulam, Maryam Batool, Muhammad Zahid Naeem, Abdullah Ejaz, Cristi Spulbar, and Ramona Birau. 2021. Investigating the causal linkages among inflation, interest rate, and economic growth in Pakistan under the influence of COVID-19 pandemic: A wavelet transformation approach. Journal of Risk and Financial Management 14: 277. [Google Scholar] [CrossRef]
- He, Xuemei, Weiqi Hong, Xiangyu Pan, Guangwen Lu, and Xiawei Wei. 2021. SARS-CoV-2 Omicron variant: Characteristics and prevention. MedComm 2: 838–45. [Google Scholar] [CrossRef]
- Iqbal, Najaf, Elie Bouri, Oksana Grebinevych, and David Roubaud. 2022. Modelling extreme risk spillovers in the commodity markets around crisis periods including COVID19. Annals of Operations Research, 1–30. [Google Scholar] [CrossRef]
- Jefferson, Michael. 2020. A crude future? COVID-19s challenges for oil demand, supply and prices. Energy Research & Social Science 68: 101669. [Google Scholar] [CrossRef]
- Jeris, Saeed Sazzad, and Ridoy Deb Nath. 2021. US banks in the time of COVID-19: Fresh insights from the wavelet approach. Eurasian Economic Review 11: 349–61. [Google Scholar] [CrossRef]
- Kalyuzhnova, Yelena, and Julian Lee. 2020. Will COVID-19 change oil markets forever? In A New World Post COVID-19. Venice: Fondazione Università Ca’ Foscari. [Google Scholar] [CrossRef]
- Karamti, Chiraz, and Olfa Belhassine. 2022. COVID-19 pandemic waves and global financial markets: Evidence from wavelet coherence analysis. Finance Research Letters 45: 102136. [Google Scholar] [CrossRef] [PubMed]
- Khan, Khalid, Chi-Wei Su, and Meng Nan Zhu. 2022. Examining the behaviour of energy prices to COVID-19 uncertainty: A quantile on quantile approach. Energy 239: 122430. [Google Scholar] [CrossRef]
- Lang, Qiaoqi, Xinjie Lu, Feng Ma, and Dengshi Huang. 2021. Oil futures volatility predictability: Evidence based on Twitter-based uncertainty. Finance Research Letters, 102536. [Google Scholar] [CrossRef]
- Lento, Camillo, and Nikola Gradojevic. 2022. The profitability of technical analysis during the COVID-19 market meltdown. Journal of Risk and Financial Management 15: 192. [Google Scholar] [CrossRef]
- Liu, Yuntong, Yu Wei, Qian Wang, and Yi Liu. 2022. International stock market risk contagion during the COVID-19 pandemic. Finance Research Letters 45: 102145. [Google Scholar] [CrossRef]
- Mahase, Elisabeth. 2021. COVID-19: How many variants are there, and what do we know about them? BMJ 374: n1971. [Google Scholar] [CrossRef]
- Puławska, Karolina. 2021. Financial stability of European insurance companies during the COVID-19 pandemic. Journal of Risk and Financial Management 14: 266. [Google Scholar] [CrossRef]
- Pulliam, Juliet R. C., Cari van Schalkwyk, Nevashan Govender, Anne von Gottberg, Cheryl Cohen, Michelle J. Groome, Jonathan Dushoff, Koleka Mlisana, and Harry Moultrie. 2022. Increased risk of SARS-CoV-2 reinfection associated with emergence of Omicron in South Africa. Science 376: eabn4947. [Google Scholar] [CrossRef]
- Sadefo Kamdem, Jules, Rose Bandolo Essomba, and James Njong Berinyuy. 2020. Deep learning models for forecasting and analyzing the implications of COVID-19 spread on some commodities markets volatilities. Chaos, Solitons, and Fractals 140: 110215. [Google Scholar] [CrossRef] [PubMed]
- Sarkodie, Samuel Asumadu, and Phebe Asantewaa Owusu. 2021. Global assessment of environment, health and economic impact of the novel coronavirus (COVID-19). Environment, Development and Sustainability 23: 5005–15. [Google Scholar] [CrossRef] [PubMed]
- So, Mike K. P., Amanda M. Y. Chu, Agnes Tiwari, and Jacky N. L. Chan. 2021. On topological properties of COVID-19: Predicting and assessing pandemic risk with network statistics. Scientific Reports 11: 5112. [Google Scholar] [CrossRef] [PubMed]
- So, Mike K. P., Amanda M. Y. Chu, and Thomas W. C. Chan. 2021. Impacts of the COVID-19 pandemic on financial market connectedness. Finance Research Letters 38: 101864. [Google Scholar] [CrossRef]
- So, Mike K. P., Lupe S. H. Chan, and Amanda M. Y. Chu. 2021. Financial network connectedness and systemic risk during the COVID-19 pandemic. Asia-Pacific Financial Markets 28: 649–65. [Google Scholar] [CrossRef]
- Song, Jianhua, Zhepei Zhang, and Mike K. P. So. 2021. On the predictive power of network statistics for financial risk indicators. Journal of International Financial Markets, Institutions and Money 75: 101420. [Google Scholar] [CrossRef]
- Štifanić, Daniel, Jelena Musulin, Adrijana Miočević, Sandi Baressi Šegota, Roman Šubić, and Zlatan Car. 2020. Impact of COVID-19 on forecasting stock prices: An integration of stationary wavelet transform and bidirectional long short-term memory. Complexity 2020: e1846926. [Google Scholar] [CrossRef]
- Su, Chi-Wei, Shi-Wen Huang, Meng Qin, and Muhammad Umar. 2021. Does crude oil price stimulate economic policy uncertainty in BRICS? Pacific-Basin Finance Journal 66: 101519. [Google Scholar] [CrossRef]
- WHO. 2022. COVID-19 Weekly Epidemiological Update, 86th ed. Geneva: World Health Organization. [Google Scholar]
- Yang, Li, Jingqiu Luo, and Yongmu Jiang. 2021. Policy uncertainty spillovers and financial risk contagion in the Asia-Pacific network. Pacific-Basin Finance Journal 67: 101554. [Google Scholar]
- Zhang, Dayong, Min Hu, and Qiang Ji. 2020. Financial markets under the global pandemic of COVID-19. Finance Research Letters 36: 101528. [Google Scholar] [CrossRef]
- Zhang, Yongmin, and Ruizhi Wang. 2021. COVID-19 impact on commodity futures volatilities. Finance Research Letters 2021: 102624. [Google Scholar] [CrossRef] [PubMed]
Figure 1.
Time series plot of p-values (PRS and SRS; window width = 42; with different time lag ).

Figure 2.
Time series plot of p-values (PRS and SRS; window width = 49; with different time lag ).

Figure 3.
Time series plot of p-values (PRS and SRS; window width= 56; with different time lag ).

Figure 4.
Timeline of some key events related to COVID-19 or the oil market.

Figure 5.
Heatmap of the w-day returns, , of oil futures when w = 42, 49 and 56; with different time lag .
Figure 5.
Heatmap of the w-day returns, , of oil futures when w = 42, 49 and 56; with different time lag .


Table 1.
Summary statistics of the crude oil WTI (NYM $/bbl) front month futures contract price and the pandemic risk scores.
Table 1.
Summary statistics of the crude oil WTI (NYM $/bbl) front month futures contract price and the pandemic risk scores.
| Min | Q1 | Median | Q3 | Max | Mean | SD | Kurtosis | Skewness | |
|---|---|---|---|---|---|---|---|---|---|
| Crude oil WTI (NYM $/bbl) | −37.63 | 40.66 | 54.47 | 69.12 | 84.65 | 54.24 | 17.67 | 3.36 | −0.46 |
| PRS | 0 | 0.10 | 0.14 | 0.17 | 0.36 | 0.13 | 0.05 | 3.73 | −0.25 |
| SRS | 0 | 0.06 | 0.15 | 0.32 | 1.53 | 0.20 | 0.19 | 7.13 | 1.46 |
Table 2.
Summary statistics of the w-day returns in the three window widths.
| Window Width, w | Min | Q1 | Median | Mean | Q3 | Max | prop(−) | prop(+) |
|---|---|---|---|---|---|---|---|---|
| 42 | −74.19 | −4.37 | 6.54 | 11.92 | 21.74 | 297.10 | 35% | 65% |
| 49 | −79.81 | −3.11 | 12.43 | 15.74 | 21.56 | 292.31 | 36% | 64% |
| 56 | −75.78 | −2.33 | 13.90 | 20.07 | 25.06 | 305.09 | 31% | 69% |
Publisher’s Note: MDPI stays neutral with regard to jurisdictional claims in published maps and institutional affiliations. |
© 2022 by the authors. Licensee MDPI, Basel, Switzerland. This article is an open access article distributed under the terms and conditions of the Creative Commons Attribution (CC BY) license (https://creativecommons.org/licenses/by/4.0/).
Share and Cite
MDPI and ACS Style
So, M.K.P.; Chan, J.N.L.; Chu, A.M.Y. Dynamic Causality Analysis of COVID-19 Pandemic Risk and Oil Market Changes. J. Risk Financial Manag. 2022, 15, 240. https://doi.org/10.3390/jrfm15060240
AMA Style
So MKP, Chan JNL, Chu AMY. Dynamic Causality Analysis of COVID-19 Pandemic Risk and Oil Market Changes. Journal of Risk and Financial Management. 2022; 15(6):240. https://doi.org/10.3390/jrfm15060240
Chicago/Turabian StyleSo, Mike K. P., Jacky N. L. Chan, and Amanda M. Y. Chu. 2022. "Dynamic Causality Analysis of COVID-19 Pandemic Risk and Oil Market Changes" Journal of Risk and Financial Management 15, no. 6: 240. https://doi.org/10.3390/jrfm15060240