Acid pH Increases SARS-CoV-2 Infection and the Risk of Death by COVID-19
 Leandro Jimenez1,2
  Ana Campos Codo3
  Vanderson de Souza Sampaio4,5,6,7
  Antonio E. R. Oliveira1
  Lucas Kaoru Kobo Ferreira1
  Gustavo Gastão Davanzo3
  Lauar de Brito Monteiro3
  João Victor Virgilio-da-Silva3
  Mayla Gabriela Silva Borba4 Gabriela Fabiano de Souza3 Nathalia Zini8
  Flora de Andrade Gandolfi8
  Stéfanie Primon Muraro3 José Luiz Proença-Modena3
  Fernando Almeida Val4,5,7
  Gisely Cardoso Melo4,5
  Wuelton Marcelo Monteiro4,5
  Maurício Lacerda Nogueira8
  Marcus Vinícius Guimarães Lacerda4,5,9
  Pedro M. Moraes-Vieira3,10,11
  Helder I. Nakaya1,2,12*
- 1Department of Clinical and Toxicological Analyses, School of Pharmaceutical Sciences, University of São Paulo, São Paulo, Brazil
- 2Scientific Platform Pasteur-University of São Paulo, São Paulo, Brazil
- 3Department of Genetics, Evolution, Microbiology and Immunology, Institute of Biology, University of Campinas, São Paulo, Brazil
- 4Fundação de Medicina Tropical Dr. Heitor Vieira Dourado, Manaus, Brazil
- 5Universidade do Estado do Amazonas, Manaus, Brazil
- 6Fundação de Vigilância em Saúde do Amazonas, Manaus, Brazil
- 7Faculdade de Medicina da Universidade Federal do Amazonas, Manaus, Brazil
- 8Faculdade de Medicina de São José do Rio Preto, São Paulo, Brazil
- 9Faculdade de Medicina da Universidade Federal do Amazonas, Manaus, Brazil
- 10Obesity and Comorbidities Research Center, University of Campinas, São Paulo, Brazil
- 11Experimental Medicine Research Cluster, University of Campinas, São Paulo, Brazil
- 12Hospital Israelita Albert Einstein, São Paulo, Brazil
The severe acute respiratory syndrome coronavirus 2 (SARS-CoV-2) can infect a broad range of human tissues by using the host receptor angiotensin-converting enzyme 2 (ACE2). Individuals with comorbidities associated with severe COVID-19 display higher levels of ACE2 in the lungs compared to those without comorbidities, and conditions such as cell stress, elevated glucose levels and hypoxia may also increase the expression of ACE2. Here, we showed that patients with Barrett's esophagus (BE) have a higher expression of ACE2 in BE tissues compared to normal squamous esophagus, and that the lower pH associated with BE may drive this increase in expression. Human primary monocytes cultured in reduced pH displayed increased ACE2 expression and higher viral load upon SARS-CoV-2 infection. We also showed in two independent cohorts of 1,357 COVID-19 patients that previous use of proton pump inhibitors is associated with 2- to 3-fold higher risk of death compared to those not using the drugs. Our work suggests that pH has a great influence on SARS-CoV-2 Infection and COVID-19 severity.
Introduction
As of August 2020, the severe acute respiratory syndrome coronavirus 2 (SARS-CoV-2) infected over 20 million people worldwide (World Health Organization). The new coronavirus disease 2019 (COVID-19) caused by SARS-CoV-2 is characterized by a broad range of symptoms, from respiratory to neurological and digestive disorders (1, 2). Although a small fraction of patients develops highly lethal pneumonia, at least 20% of COVID-19 patients may display one or more gastrointestinal (GI) symptoms (1), such as diarrhea, vomiting, and abdominal pain (2, 3).
SARS-CoV-2 tissue tropism can be directly linked to the diverse clinical manifestations of COVID-19. The main receptor utilized by the virus to enter the cells is the angiotensin-converting enzyme 2 (ACE2), which is found in several tissues, including the GI epithelial cells and liver cells (4, 5). SARS-CoV-2 was detected in biopsies of several tissues, including esophagus, stomach, duodenum and rectum, and endoscopy of hospitalized patients revealed esophageal bleeding with erosions and ulcers (2, 6).
Higher levels of ACE2 in the tissues may explain in part some of the comorbidities associated with severe COVID-19. Recently, we showed that ACE2 was highly expressed in the lungs of people with pulmonary arterial hypertension and chronic obstructive pulmonary diseases (7). Since the expression of ACE2 changes under conditions of cell stress, elevated glucose levels and hypoxia (8, 9), other comorbidities related to the GI tract can be associated with different forms of COVID-19.
Here, we suggest that gastroesophageal reflux disease (GERD) and Barrett's esophagus (BE) may represent novel comorbidities associated with COVID-19. In the United States, it has been estimated that 5.6% of adults have BE, a disease where GERD damages the esophageal squamous mucosa (10). We demonstrated that ACE2 is highly expressed in the esophagus of patients with BE, and that the acid pH associated with this condition is a key inducer of ACE2 expression. Human primary monocytes cultured in reduced pH display increased expression of ACE2, and higher viral load upon SARS-CoV-2 infection. We also showed that patients taking proton pump inhibitors, which are recommended for GERD treatment, have a higher risk of developing severe COVID-19, observed by an increased risk of ICU admittance and death.
Methods
Acidosis and Barrett's Esophagus Meta-Analysis
We manually curated the Gene Expression Omnibus (GEO) repository (https://www.ncbi.nlm.nih.gov/geo/) to find esophagus transcriptome datasets related to “Barrett's esophagus” and cell line transcriptome datasets related to “acidosis” and “pH reduction.” Author-normalized expression values and metadata from these datasets were downloaded using the GEOquery package (11). We performed differential expression analyses using the limma package (12). The GEO study ID and the groups of samples compared are listed in Supplementary Table 1. The MetaVolcanoR package (13) was used to combine the P values using the Fisher's method. To adjust for multiple comparisons, we calculated the false discovery rate (FDR) using the Benjamini-Hochberg procedure. For enrichment analyses, we utilized the EnrichR tool (14) and fgsea R package (15) with gene sets from the Gene Ontology Biological Process database. We then selected pathways with a P value adjusted for multiple comparisons lower than 0.10.
Single Cell Transcriptomic Analysis of Barrett's Esophagus
The single cell RNA-seq (scRNA-seq) data from esophagus, Barrett's esophagus, gastric and duodenum cells from patients with BE were acquired from Owen et al. (16). Cells with <1,000 genes were excluded from analysis using Seurat v3 (17). Raw UMI counts were log transformed and variable genes called on each dataset independently based on the VST method. The AddModuleScore function was used to remove batch effects between samples and based on C1orf43, CHMP2A, EMC7, GPI, PSMB2, PSMB4, RAB7A, REEP5, SNRPD3, VCP, VPS29 genes. We assigned scores for S and G2/M cell cycle phases based on previously defined gene sets using the CellCycleScoring function. Scaled z-scores for each gene were calculated using the ScaleData function and regressed against the number of UMIs per cell, mitochondrial RNA content, S phase score, G2/M phase score, and housekeeping score. Scaled data was used as an input into PCA based on variable genes. These PCA components were used to generate the UMAP reduction visualization. To identify the number of clusters, UMI log counts were used as input to SC3 (18). Technical variation was tested using BEARscc (19), which models technical noise from ERCC spike-in measurements. The clusters were then annotated based on genes previously characterized (16).
Peripheral Blood Mononuclear Cells Isolation
Buffy coats provided by the Hematology and Hemotherapy Center of the University of Campinas (SP-Campinas, Brazil) were used for PBMC isolation as described (9). The study was approved by the Brazilian Committee for Ethics in Human Studies (CAAE: 31622420.0.0000.5404). Briefly, buffy coats were mixed and then diluted in Phosphate Buffer Saline (PBS) (1:1) and carefully to 50 mL tube containing Ficoll (Sigma-Aldrich) and centrifuged. PBMCs were cultured in RPMI 1640 for 2–3 h to allow cell adhesion. Next, cells were washed twice with PBS and adherent cells, enriched in monocytes, were further incubated until infection in RPMI 1640 containing 10% fetal bovine serum (FBS) and 1% Penicillin-Streptomycin (Pen-Strep) at 37°C with 5% CO2. Monocytes were maintained in different pH levels (6, 6.5, and 7.4) during 24 h and subsequently infected with SARS-CoV-2, as described below.
Viruses and Infection
HIAE-02 SARS-CoV-2/SP02/human/2020/BRA (GenBank MT126808.1) virus was isolated as described (9). Stocks of Sars-CoV-2 were prepared in the Vero cell line. The supernatant was harvested at 2–3 dpi. Viral titers were obtained by plaque assays on Vero cells. Monocytes were infected with SARS-CoV-2 at MOI 0.1 under continuous agitation at 15 rpm for 1 h. Next, monocytes were washed twice and incubated in RPMI with 10% FBS and 1% Pen-Strep for 24 h at 37°C with 5% CO2 for 24 h.
Viral Load and Gene Expression Analyses
Total RNA extraction was performed using TRIzol Reagent (Sigma-Aldrich). RNA concentration was measured with NanoDrop 2000 spectrophotometer (Thermo Scientific). RNA was reverse-transcribed using GoScript™ Reverse Transcriptase cDNA synthesis kit following manufacturer's instructions. SARS-CoV-2 viral load was determined with primers targeting the N1 region and a standard curve was generated as described (20). Viral load and gene expression were made using SYBR Green Supermix in BIO-RAD CFX394 Touch Real-Time PCR Detection System. Fold change was calculated as 2−ΔΔCt. Primer sequences used: 18S (Forward: 5′-CCCAACTTCTTAGAGGGACAAG-3′; Reverse: 5′-CATCTAAGGGCATCACAGACC-3′); ACE2 (Forward: 5′-GGACCCAGGAAATGTTCAGA-3′; Reverse: 5′-GGCTGCAGAAAGTGACATGA-3′); SARS-CoV-2_IBS_N1 (Forward: 5′-CAATGCTGCAATCGTGCTAC-3′; Reverse: 5′-GTTGCGACTACGTGATGAGG-3′).
Clinical Data Analysis
We retrieved clinical data from two independent cohorts of 551 and 806 RT-qPCR confirmed COVID-19 patients aged 18 years or older that went to reference hospitals for COVID-19 in Manaus, Amazonas, Brazil (North region cohort) and in São José do Rio Preto city, São Paulo, Brazil (Southeast region cohort), respectively. They were followed for at least 28 days (North region cohort) or 120 days (Southeast region cohort) after recruitment. Information about the previous history of proton pump inhibitors use (e.g., omeprazole and pantoprazole), a surrogate evidence of low gastric pH-related diseases, time of hospitalization, ICU admittance, and time to death, as well as demographics, previous use of other drugs, clinical, laboratory, and outcome variables were collected. The protocol was approved by the Brazilian Committee of Ethics in Human Research (CAAE: 30152620.1.0000.0005 and 30615920.2.0000.0005 for North region cohort, and 31588920.0.0000.5415 for Southeast region cohort). Data were collected and managed using REDCap (v. 10.2.1) electronic data capture tools hosted at Fundação de Medicina Tropical Dr. Heitor Vieira Dourado.
Adjusted hazard ratios and risk ratios with respective 95% confidence intervals (CI) were estimated for time to death and ICU admittance, respectively by Cox regression and log-binomial generalized linear model models. To adjust for confounders, ages higher than 60 years old and obesity, defined by both BMI and fat percentage, were used as covariables in the multivariable analyses. Wilcoxon Rank-Sum analysis was used to test differences in the days of hospitalization. A 2-tailed P < 0.05 was considered significant. The statistical analyses were carried out using Stata v. 13.0 (StataCorp LP, College Station, TX).
Results
To evaluate whether people with BE may have higher chances of being infected with SARS-CoV-2 when compared to people without the disease, we performed a meta-analysis of eight transcriptomic studies of BE (Figure 1A, Supplementary Table 1). A total of 304 and 256 genes displayed, respectively, higher and lower expression in BE when compared to normal esophagus tissue in at least 7 of these studies (Figure 1B). ACE2 was among the genes consistently up-regulated in the BE compared to normal esophagus (Figure 1C). While pathways related to keratinocyte differentiation and epidermis development were enriched with down-regulated genes, we found that bicarbonate transport and regulation of intracellular pH pathways were enriched with up-regulated genes (Figure 1D), suggesting that pH may influence ACE2 expression. In fact, when human coronary artery endothelial cells were treated with proton pump inhibitors—omeprazole or lansoprazole—the expression of ACE2 decreased in comparison to untreated cells (Figure 1E). Gene set enrichment analysis (GSEA) confirmed that Barrett's esophagus tissues have higher expression of genes related to pH alterations (Figure 1F).
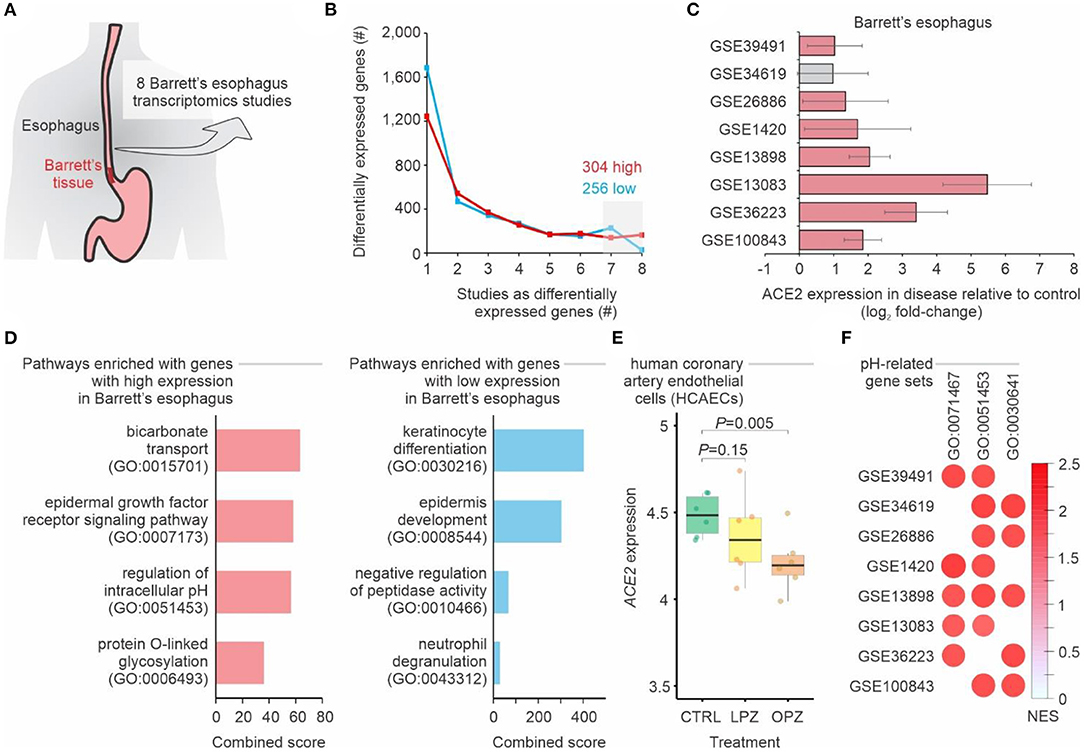
Figure 1. Meta-analysis of gastroesophageal junction transcriptomes of patients with Barrett's esophagus. (A) Meta-analysis of 8 studies of Barrett's esophagus transcriptomes. (B) Number of differentially expressed genes in Barrett's esophagus compared with non-Barrett's esophagus. The lines show the number of genes (y-axis) considered up-regulated (red lines) or down-regulated (blue lines) in Barrett's esophagus (P-value < 0.05; log2 fold-change > 1; combined FDR <0.01) in one or more datasets (x-axis). The numbers of up-regulated and down-regulated genes in at least seven studies are indicated. (C) ACE2 is upregulated in patients with Barrett's esophagus. Each bar represents the log2 expression fold-change between patients and control individuals. The error bars indicate the 95% confidence interval. Bars in red represent a P-value < 0.05 and in gray a non-significant P-value. (D) Pathway enrichment analysis using the up-regulated and down-regulated genes in at least seven studies. The bars represent the combined score (x axis) calculated by Enrichr tool for selected Gene Ontology gene sets (y axis). (E) ACE2 expression in cells treated with proton pump inhibitors. Each boxplot represents the log2 expression of untreated (CTRL) cells and cells treated with either omeprazole (OPZ) or lansoprazole (LPZ). (F) Gene Set Enrichment Analysis (GSEA) of the 8 studies of Barrett's esophagus transcriptomes using pH-related gene sets. The size and color of the circles are proportional to the normalized enrichment score (NES) of the gene sets (columns) on each study (rows). The Gene Ontology IDs are indicated at the top.
We also investigated ACE2 expression in Barrett's esophagus at single-cell level. Our analysis showed that single cells from Barrett's esophagus patients were distinct from normal esophagus cells, as well as cells from duodenum and gastric tissues (Figure 2A). While a large fraction of duodenum cells expresses ACE2 (21), only 11% of the single cells from Barrett's samples have ACE2 expression above 0 (Figure 2B). However, among the cells expressing ACE2, higher levels of this gene were found in gastric, Barrett's, and duodenum cells when compared to esophagus cells (Figure 2C). Using GSEA approach, we found that genes associated with regulation of cellular pH were enriched among the up-regulated genes in gastric, Barrett's and duodenum cells when compared to esophagus cells (Figure 2D).
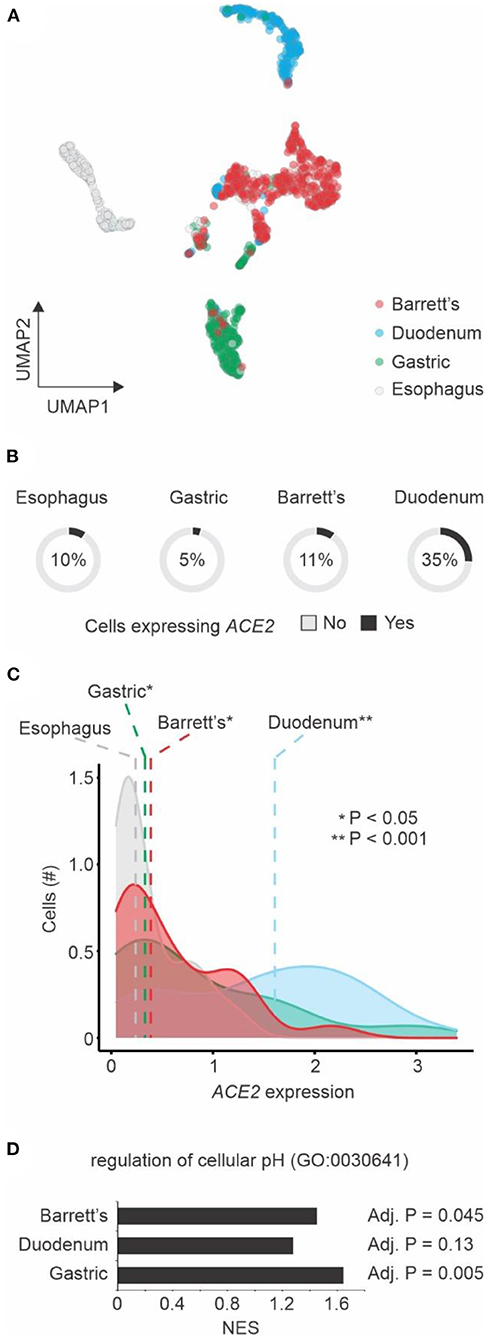
Figure 2. Single cell transcriptomics of Barrett's esophagus. (A) Dimension reduction of single cells using Uniform Manifold Approximation and Projection (UMAP). Cells from four patients with Barrett's esophagus (n = 1,168) are shown. The colors represent the tissue types. (B) ACE2 expression by tissue type. The pie charts show the number of single cells with (black) or without (gray) ACE2 expression (expression values > 0). The fractions of ACE2-expressing cells are indicated. (C) Distribution of ACE2 expression by cells from different tissue types. The colors of histograms represent the tissue types. The dashed vertical line shows the median values of each tissue type. Student's t-test P-value between tissue types vs. esophagus is indicated. (D) Gene Set Enrichment Analysis (GSEA) of the three tissue types compared to esophagus using the regulation of cellular pH gene set. The normalized enrichment score (NES) are shown in the x-axis for each one of the tissue types. The adjusted P-value of the enrichment is displayed right next to the corresponding bar.
To further evaluate whether pH may influence the expression of ACE2, we analyzed publicly available transcriptomic studies of cells under experimentally-induced acidosis. Cells cultured at lower pH displayed higher expression levels of ACE2 when compared to those cultured under higher pH (Figures 3A,B). We validated this finding with human primary monocytes cultured at pH 7.4, 6.5, and 6.0 under normoxia. ACE2 expression was significantly increased at pH 6.5 and 6.0 compared to pH 7.4 (Figure 3C). The reduction of pH alone also significantly increased SARS-CoV-2 infection of human monocytes (Figure 3D), indicating that pH plays a role in ACE2-mediated SARS-CoV-2 infection.
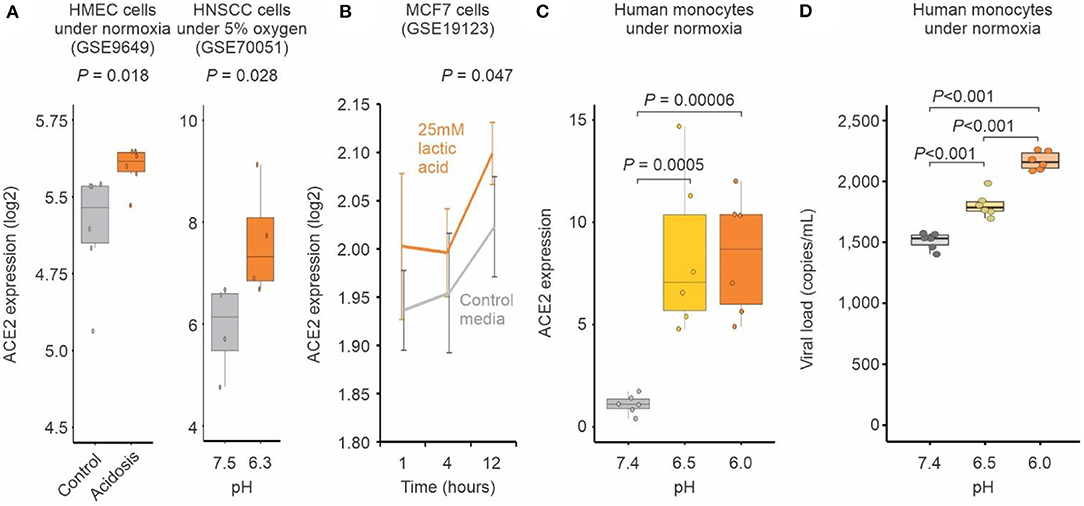
Figure 3. Acidosis increases ACE2 expression and SARS-CoV-2 infection. (A) Human cells exposed to acidosis. Each boxplot represents the log2 expression of samples untreated (gray) or treated with lactic acidosis (brown) for two microarray studies (GSE9649 and GSE70051). Student's t-test P-values are indicated. (B) MCF7 cells exposed to pH reduction increases ACE2 expression. Gray and brown lines represent, respectively cells treated with control media or with 25 mM lactic acid for 1, 4, and 12 h (x-axis). Each point represents the mean log2 expression and the error bars the standard deviation of biological replicates. (C) Acid pH increases ACE2 expression in monocytes. Human peripheral blood monocytes were incubated in medium at three different pH (6, 6.5, 7.4) for 24 h. Each boxplot represents the fold change ACE2 expression. (D) Acid pH increases SARS-CoV-2 viral load. Human peripheral blood monocytes were incubated in medium at three different pH (6, 6.5, 7.4) for 24 h. The cells were infected with CoV-2 (MOI 0.1) for 1 h under continuous agitation. The RNA viral load was measured by qPCR.
Proton pump inhibitors (PPI) decrease the amount of acid produced in the stomach and are often utilized to treat subjects with GERD symptoms (22). The use of PPIs prior to COVID-19 may serve as a proxy for identifying subjects with tissue irritation and inflammation caused by stomach acid. In two independent cohorts of 551 and 806 RT-qPCR confirmed COVID-19 patients from North and Southeast regions of Brazil, respectively, we investigated the effects of gastrointestinal discomfort and COVID-19 severity. Survival curve analysis showed that people that were taking PPIs had a 2- to 3-fold increased risk of death compared to those not using the drug (Figure 4A). When controlling for potential confounders (i.e., age above 60 years old, diabetes, and hypertension), the adjusted hazard ratio was 2.183 (95CI: 1.635–2.914; P < 0.0001) for the North region cohort and 2.332 (95CI: 1.661–3.274; P < 0.0001) for the Southeast cohort (Figure 4B). These clinical findings indicate that the reduction of physiological pH (caused by stomach acid) may play a significant role in SARS-CoV-2 infection and COVID-19 severity.
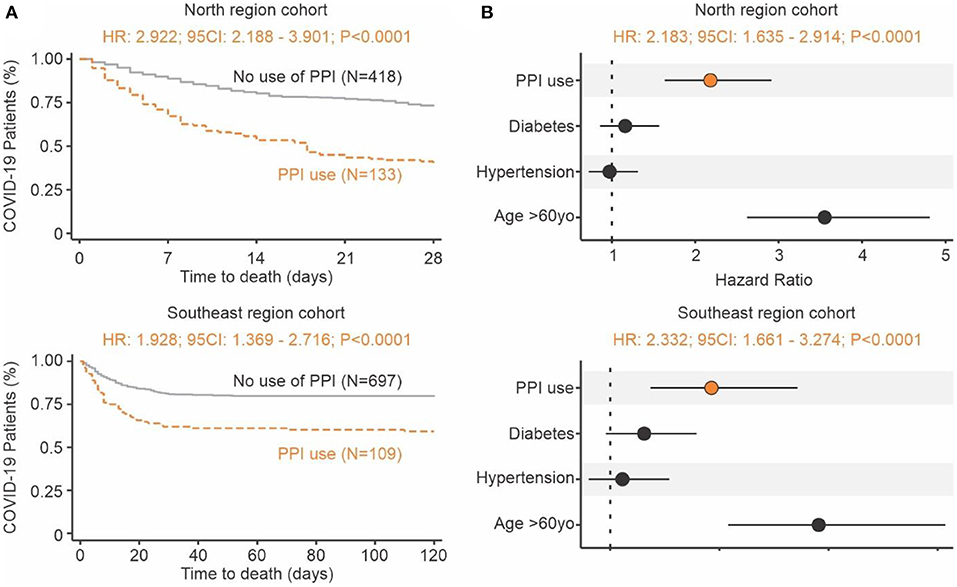
Figure 4. Increase risk of death in individuals with COVID-19 using proton pump inhibitors prior infection. (A) Time to death. Kaplan-Meier survival curves showing a higher risk of death for the group of patients that used PPIs (brown) prior to admittance when compared to those not using them (gray). The North region cohort result is shown at the top and Southeast region cohort result is shown at the bottom. (B) Risk of death. The forest plot presents the hazard ratios and respective 95CI for the main explanatory variable (brown), as well as the potential confounders (black) used in the multivariate model. The North region cohort result is shown at the top and Southeast region cohort result is shown at the bottom.
Discussion
Our findings suggest that acid pH increases SARS-CoV-2 infection by up-regulating the ACE2 receptor, and this may have clinical implications for patients with GERD or Barrett's esophagus. No clear mechanism exists linking pH alterations and ACE2 expression. Although evidence indicates that hypoxic conditions can increase the expression of ACE2 (8, 9), the expression of neither SIRT1 nor HIF1A seem to be associated with Barrett's esophagus (Supplementary Table 2). We found that known regulators of ACE2—HNF1B (23) and FOXA2 (24)—were up-regulated in 6 out of 8 Barrett's esophagus transcriptomic studies (Supplementary Table 2), suggesting that they may be involved with the pH-induced ACE2 expression in Barrett's esophagus.
Pulmonary damage, one of the main features of severe COVID-19, may lead to acute hypoxia and further respiratory acidosis. It is possible that the acidosis in the blood of some patients with severe COVID-19 (25) worsen the disease by increasing the levels of ACE2 and facilitating the entry of SARS-CoV-2 into human cells. Hypoxia itself may contribute to the regulation of ACE2 (9, 26). In addition, elevated levels of the enzyme lactate dehydrogenase (which converts lactate from pyruvate) has been associated with worse outcomes in patients with COVID-19 (27). The excess of lactate may directly alter the extracellular and intracellular pH which in turn can impact ACE2 expression. The extent to which acute systemic acidosis contributes to COVID-19 severity is poorly known and deserves further research.
The drug famotidine suppresses gastric acid production by blocking the histamine 2 receptor in the stomach. Recently, Freedberg et al. (28) have shown that early treatment of patients tested positive for SARS-CoV-2 significantly improved clinical outcomes among the hospitalized patients. However, a meta-analysis of 5 COVID-19 studies performed by Chenyu Sun et al. (29) have shown that famotidine treatment was not associated with reduced risk of progression to severe disease or death. Although famotidine may have antiviral effects, it is possible that pH itself can play an important role in regulating ACE2 expression and limiting SARS-CoV-2 infection in patients.
We showed here that the previous use of PPIs is associated with increased risk of death from COVID-19. Such association is supported by a meta-analysis of eight studies (30) that showed that previous use of PPIs increases the risk of progression to severe COVID-19. Almario et al. (31) recently described that individuals taking PPIs had greater chances for testing positive for COVID-19 when compared to those not using PPIs. Their hypothesis is that PPIs might increase the risk for COVID-19 by undermining the gastric barrier to SARS-CoV-2 and thus reducing the microbial diversity in the gut (31). Rather, we believe that PPIs are important markers of hidden comorbidities that involve the damage caused by the excess stomach acid in GI tissues.
By going from disease (Barrett's esophagus) to molecule (ACE2) to cells (in vitro experiments) and back to clinical findings (COVID-19 patients), we showed that pH may have a great influence on SARS-CoV-2 infection and COVID-19 severity. Additional studies should be performed to not only confirm the clinical findings on a larger scale but also to assess the molecular mechanism related to pH-induced ACE2 expression.
Data Availability Statement
The original contributions generated for this study are included in the article/Supplementary Material, further inquiries can be directed to the corresponding author/s.
Ethics Statement
The studies involving human participants were reviewed and approved by Brazilian Committee of Ethics in Human Research (CAAE: 30152620.1.0000.0005 and 30615920.2.0000.0005 for North region cohort, and 31588920.0.0000.5415 for Southeast region cohort). The patients/participants provided their written informed consent to participate in this study.
Author Contributions
LJ, AO, LF, and HN performed the transcriptome analyses. AC, GD, LB, JV, GF, SM, JL, and PM-V performed the experimental work. VS, MB, NZ, FA, MN, FV, GC, WM, and ML performed the clinical analysis. HN coordinated the study. LJ and HN wrote the manuscript with inputs from all of the co-authors. All authors contributed to the article and approved the submitted version.
Funding
This work was supported by Brazilian National Council for Scientific and Technological Development (grant number 313662/2017-7), the São Paulo Research Foundation (grant numbers 2018/14933-2; 2020/04836-0), and CAPES.
Conflict of Interest
The authors declare that the research was conducted in the absence of any commercial or financial relationships that could be construed as a potential conflict of interest.
Publisher's Note
All claims expressed in this article are solely those of the authors and do not necessarily represent those of their affiliated organizations, or those of the publisher, the editors and the reviewers. Any product that may be evaluated in this article, or claim that may be made by its manufacturer, is not guaranteed or endorsed by the publisher.
Supplementary Material
The Supplementary Material for this article can be found online at: https://www.frontiersin.org/articles/10.3389/fmed.2021.637885/full#supplementary-material
References
1. Tariq R, Saha S, Furqan F, Hassett L, Pardi D, Khanna S. Prevalence and mortality of COVID-19 patients with gastrointestinal symptoms: a systematic review and meta-analysis. Mayo Clin Proc. (2020) 95 1632–48. doi: 10.1016/j.mayocp.2020.06.003
2. Zhang L, Han C, Zhang S, Duan C, Shang H, Bai T, et al. Diarrhea and altered inflammatory cytokine pattern in severe coronavirus disease 2019: impact on disease course and in-hospital mortality. J Gastroenterol Hepatol. (2021) 36:421–9. doi: 10.1111/jgh.15166
3. Cheung KS, Hung IFN, Chan PPY, Lung KC, Tso E, Liu R, et al. Gastrointestinal manifestations of SARS-CoV-2 infection and virus load in fecal samples from a Hong Kong Cohort: systematic review and meta-analysis. Gastroenterology. (2020) 159:81–95. doi: 10.1053/j.gastro.2020.03.065
4. Bourgonje AR, Abdulle AE, Timens W, Hillebrands JL, Navis GJ, Gordijn SJ, et al. Angiotensin-converting enzyme 2 (ACE2), SARS-CoV-2 and the pathophysiology of coronavirus disease 2019 (COVID-19). J Pathol. (2020) 251:228–48. doi: 10.1002/path.5471
5. Zou X, Chen K, Zou J, Han P, Hao J, Han Z. Single-cell RNA-seq data analysis on the receptor ACE2 expression reveals the potential risk of different human organs vulnerable to 2019-nCoV infection. Front Med. (2020) 14:185–92. doi: 10.1007/s11684-020-0754-0
6. Lin L, Jiang X, Zhang Z, Huang S, Fang Z, Gu Z, et al. Gastrointestinal symptoms of 95 cases with SARS-CoV-2 infection. Gut. (2020) 69:997–1001. doi: 10.1136/gutjnl-2020-321013
7. Pinto BGG, Oliveira AER, Singh Y, Jimenez L, Gonçalves ANA, Ogava RLT, et al. ACE2 expression is increased in the lungs of patients with comorbidities associated with severe COVID-19. J Infect Dis. (2020) 222:556–63. doi: 10.1093/infdis/jiaa332
8. Clarke NE, Belyaev ND, Lambert DW, Turner AJ. Epigenetic regulation of angiotensin-converting enzyme 2 (ACE2) by SIRT1 under conditions of cell energy stress. Clin Sci (Lond). (2014) 126:507–16. doi: 10.1042/CS20130291
9. Codo AC, Davanzo GG, Monteiro LB, de Souza GF, Muraro SP, Virgilio-da-Silva JV, et al. Elevated glucose levels favor SARS-CoV-2 infection and monocyte response through a HIF-1α/glycolysis-dependent axis. Cell Metab. (2020) 32:437–46.e5. doi: 10.2139/ssrn.3606770
10. Spechler SJ, Souza RF. Barrett's esophagus. N Engl J Med. (2014) 371:836–45. doi: 10.1056/NEJMra1314704
11. Davis S, Meltzer PS. GEOquery: a bridge between the Gene Expression Omnibus (GEO) and BioConductor. Bioinformatics. (2007) 23:1846–7. doi: 10.1093/bioinformatics/btm254
12. Ritchie ME, Phipson B, Wu D, Hu Y, Law CW, Shi W, et al. limma powers differential expression analyses for RNA-sequencing and microarray studies. Nucleic Acids Res. (2015) 43:e47. doi: 10.1093/nar/gkv007
13. Prada C, Lima D, Nakaya HI. MetaVolcanoR: Gene Expression Meta-analysis Visualization Tool. R package version 1.1.0., São Paulo: Bioconductor. (2019). Available online at: https://www.bioconductor.org/packages/release/bioc/html/MetaVolcanoR.html
14. Chen EY, Tan CM, Kou Y, Duan Q, Wang Z, Meirelles GV, et al. Enrichr: interactive and collaborative HTML5 gene list enrichment analysis tool. BMC Bioinformatics. (2013) 14:128. doi: 10.1186/1471-2105-14-128
15. Alexeyenko A, Lee W, Pernemalm M, Guegan J, Dessen P, Lazar V, et al. Network enrichment analysis: extension of gene-set enrichment analysis to gene networks. BMC Bioinformatics. (2012) 13:226. doi: 10.1186/1471-2105-13-226
16. Owen RP, White MJ, Severson DT, Braden B, Bailey A, Goldin R, et al. Single cell RNA-seq reveals profound transcriptional similarity between Barrett's oesophagus and oesophageal submucosal glands. Nat Commun. (2018) 9:4261. doi: 10.1038/s41467-018-06796-9
17. Stuart T, Butler A, Hoffman P, Hafemeister C, Papalexi E, Mauck WM, et al. Comprehensive integration of single-cell data. Cell. (2019) 177:1888–1902.e21. doi: 10.1016/j.cell.2019.05.031
18. Kiselev VY, Kirschner K, Schaub MT, Andrews T, Yiu A, Chandra T, et al. SC3: consensus clustering of single-cell RNA-seq data. Nat Methods. (2017) 14:483–6. doi: 10.1038/nmeth.4236
19. Severson DT, Owen RP, White MJ, Lu X, Schuster-Böckler B. BEARscc determines robustness of single-cell clusters using simulated technical replicates. Nat Commun. (2018) 9:1187. doi: 10.1038/s41467-018-03608-y
20. Won J, Lee S, Park M, Kim TY, Park MG, Choi BY, et al. Development of a laboratory-safe and low-cost detection protocol for SARS-CoV-2 of the coronavirus disease 2019 (COVID-19). Exp Neurobiol. (2020) 29:107–19. doi: 10.5607/en20009
21. Li MY, Li L, Zhang Y, Wang XS. Expression of the SARS-CoV-2 cell receptor gene ACE2 in a wide variety of human tissues. Infect Dis Poverty. (2020) 9:45. doi: 10.1186/s40249-020-00662-x
22. Freedberg DE, Lebwohl B, Abrams JA. The impact of proton pump inhibitors on the human gastrointestinal microbiome. Clin Lab Med. (2014) 34:771–85. doi: 10.1016/j.cll.2014.08.008
23. Senkel S, Lucas B, Klein-Hitpass L, Ryffel GU. Identification of target genes of the transcription factor HNF1beta and HNF1alpha in a human embryonic kidney cell line. Biochim Biophys Acta. (2005) 1731:179–90. doi: 10.1016/j.bbaexp.2005.10.003
24. Pedersen KB, Chodavarapu H, Lazartigues E. Forkhead box transcription factors of the FOXA class are required for basal transcription of angiotensin-converting enzyme 2. J Endocr Soc. (2017) 1:370–84. doi: 10.1210/js.2016-1071
25. Chen T, Wu D, Chen H, Yan W, Yang D, Chen G, et al. Clinical characteristics of 113 deceased patients with coronavirus disease 2019: retrospective study. BMJ. (2020) 368:m1091. doi: 10.1136/bmj.m1091
26. Zhang R, Wu Y, Zhao M, Liu C, Zhou L, Shen S, et al. Role of HIF-1alpha in the regulation ACE and ACE2 expression in hypoxic human pulmonary artery smooth muscle cells. Am J Physiol Lung Cell Mol Physiol. (2009) 297:L631–40. doi: 10.1152/ajplung.90415.2008
27. Henry BM, Aggarwal G, Wong J, Benoit S, Vikse J, Plebani M, et al. Lactate dehydrogenase levels predict coronavirus disease 2019 (COVID-19) severity and mortality: a pooled analysis. Am J Emerg Med. (2020) 38:1722–6. doi: 10.1016/j.ajem.2020.05.073
28. Freedberg DE, Conigliaro J, Wang TC, Tracey KJ, Callahan MV, Abrams JA, et al. Famotidine use is associated with improved clinical outcomes in hospitalized COVID-19 patients: a propensity score matched retrospective cohort study. Gastroenterology. (2020) 159:1129–31.e3. doi: 10.1053/j.gastro.2020.05.053
29. Sun C, Chen Y, Hu L, Wu Y, Liang M, Ayaz Ahmed M, et al. Does famotidine reduce the risk of progression to severe disease, death, and intubation for COVID-19 patients? A systemic review and meta-analysis. Dig Dis Sci. (2021). doi: 10.1007/s10620-021-06872-z. [Epub ahead of print].
30. Yan C, Chen Y, Sun C, Ahmed MA, Bhan C, Guo Z, et al. Will proton pump inhibitors lead to a higher risk of COVID-19 infection and progression to severe disease? A Meta-analysis. Jpn J Infect Dis. (2021). doi: 10.7883/yoken.JJID.2021.074. [Epub ahead of print].
Keywords: COVID-19, pH, SARS-CoV-2, proton pump inhibitors, Barrett's esophagus
Citation: Jimenez L, Campos Codo A, Sampaio VdS, Oliveira AER, Ferreira LKK, Davanzo GG, Brito Monteiro Ld, Victor Virgilio-da-Silva J, Borba MGS, Fabiano de Souza G, Zini N, Andrade Gandolfi Fd, Muraro SP, Luiz Proença-Modena J, Val FA, Cardoso Melo G, Monteiro WM, Nogueira ML, Lacerda MVG, Moraes-Vieira PM and Nakaya HI (2021) Acid pH Increases SARS-CoV-2 Infection and the Risk of Death by COVID-19. Front. Med. 8:637885. doi: 10.3389/fmed.2021.637885
Received: 04 December 2020; Accepted: 26 July 2021;
Published: 20 August 2021.
Edited by:
Hu Zhang, Sichuan University, ChinaReviewed by:
Y. F. Gu, Zhejiang University, ChinaChenyu Sun, AMITA Health St Joseph Hospital, United States
Copyright © 2021 Jimenez, Campos Codo, Sampaio, Oliveira, Ferreira, Davanzo, Brito Monteiro, Victor Virgilio-da-Silva, Borba, Fabiano de Souza, Zini, Andrade Gandolfi, Muraro, Luiz Proença-Modena, Val, Cardoso Melo, Monteiro, Nogueira, Lacerda, Moraes-Vieira and Nakaya. This is an open-access article distributed under the terms of the Creative Commons Attribution License (CC BY). The use, distribution or reproduction in other forums is permitted, provided the original author(s) and the copyright owner(s) are credited and that the original publication in this journal is cited, in accordance with accepted academic practice. No use, distribution or reproduction is permitted which does not comply with these terms.
*Correspondence: Helder I. Nakaya, hnakaya@usp.br