
Connectedness between Sectors: The Case of the Polish Stock Market before and during COVID-19


Department of Accounting, Business Information Systems and Statistics, Faculty of Economics and Business Administration, “Alexandru Ioan Cuza” University of Iasi, 700505 Iasi, Romania
J. Risk Financial Manag. 2022, 15(8), 322; https://doi.org/10.3390/jrfm15080322
Submission received: 23 May 2022
/
Revised: 9 July 2022
/
Accepted: 11 July 2022
/
Published: 22 July 2022
(This article belongs to the Special Issue Risk and Volatility Spillovers in Financial Markets)
Abstract
:This article studies the connectedness between economic sectors of the Polish stock market. The sectors that are considered are the following: banks, basic materials, chemicals, construction, developers, energy, food, and oil and gas. The analysis of the connectedness among sectors is conducted from a statistical and dynamic perspective. Using the time-varying parameter vector autoregression (TVP-VAR) method, the intensity, direction and variation of volatility spillover between the economic sectors are studied. Two samples are analysed, the first one being from 1 January 2013 to 12 December 2019, which corresponds to the period before the pandemic caused by COVID-19, and the second one being from 1 January 2020 to 2 December 2021, which corresponds to the period during the pandemic. A series of results are obtained. First, the connectedness between the economic sectors varies depends on the time. Second, the connectedness between the sectors was stronger during the crisis caused by the outbreak of COVID-19 rather than before the crisis. The volatility of each sector was also primarily due to their own volatility. Thirdly, the banking sector was the main sector with respect to volatility spillover. The results that are obtained are important for making the right decisions regarding financial stability under crisis circumstances, when considering development strategies for some economic sectors but also in portfolio management for performing diversification and risk-mitigation strategies.
1. Introduction
The global financial crisis of 2008 led to increased volatility in financial markets. Economic and financial integration, as well as financial liberalization, are some of the factors that have led to an increase in return and volatility spillover in financial markets (Mensi et al. 2021). In addition, financial difficulties caused by political instability, sovereign debt insolvency and recessions are spreading very quickly to other countries (Andrieș and Galasan 2020; Boțoc and Anton 2020). Return and volatility spillover in stock markets is a complex topic that has attracted the attention of researchers and allows for studies of the connectedness between economic sectors (Chakrabarty et al. 2015; Chirilă et al. 2015; Lupu and Lupu 2009; Lupu et al. 2021). Volatility spillovers between different categories of financial markets (Antonakakis et al. 2018; Yao et al. 2022; Gabauer 2021), from the same financial markets in different geographical areas (Škrinjarić 2019; Škrinjarić and Šego 2020) or from different categories of economies (Spulbar et al. 2020) are being studied. In the above-mentioned research, special attention is given to the study of volatility spillover or to the connectedness between different sectors of a stock market (Fasanya et al. 2021; Hassan and Malik 2007; Kouki et al. 2011; Shahzad et al. 2021a; Ngene 2021).
Knowledge of sectoral connectedness within stock markets is of real interest for portfolio management, macroeconomic analysis and policy makers. Identifying volatility spillover patterns between stocks from different economic sectors allows the portfolio manager to make portfolio diversification decisions in a timely manner for efficient management. In addition, identifying the main sectors with volatility spillover strengthens policy makers’ decisions to reduce overall market risk and helps develop specific economic sectors by providing knowledge about which sectors influence the targeted sector.
Thus, this study fits into the broader framework of the sustainable development of an economy to the extent that the development of some economic sectors of a country must consider the influence of other economic sectors of the same country. This study allows for the identification of the connectedness between the economic sectors of Poland; therefore, these results can be used to strengthen economic development policies.
The analysis of spillovers across markets has acquired a new dimension through the methodology of Diebold and Yilmaz (2008, 2012). In addition to identifying variations over time of the return spillover and risk, this methodology allows for the identification of the extent to which this spillover is achieved. The results that were obtained allow for comparisons to be made. In addition, the outbreak of an economic and financial crisis led to an increase in research on returns and volatility spillover between different markets, because an increase in spillover has been identified during these periods. The health crisis, caused by the outbreak of COVID-19, also grounded this research.
The results that were obtained following the study of volatility spillover are not similar. There are several studies that confirm the financial sector to be the main sector with volatility spillover. An analysis of sectoral connectedness was conducted on the US stock market by Costa et al. (2021) before and during the crisis caused by the outbreak of COVID-19. Through their results, they confirmed an increase in volatility spillover across sectors during the crisis. The energy sector was a net receiver both before and during the COVID-19 crisis, but it was the most connected in the system of studied sectors. The main sector with volatility spillover was the financial sector.
The connectedness between six industry sectors in the US stock market was also studied by Liu et al. (2021). The results that were obtained show that the financial sector and the technology sector were the main sectors with volatility spillover. In many situations, the net volatility spillover also changes its direction during financial crises and recession periods.
Shahzad et al. (2021a) studied the impact of quantile return spillovers on equity sectors. This method allows for the study of extreme returns, which indicate critical periods that the stock market undergoes. The results that were obtained confirm that the pandemic caused by COVID-19 determined that the restructuring of the connectedness between sectors was stronger in the bulk of the distribution in comparison with the tails of the distribution, where there were extreme returns. A difference compared to the previous financial and economic crises was also noticed for the financial sector, which became an information receiver.
Tail-dependency networks were tackled by Le et al. (2021) in a study of 51 international assets (spot exchange, commodities, equity indices, UST bonds and Bitcoin). In this study, conducted for the period of 1 January 2019–30 April 2020, a stronger asymmetry effect was observed for left tails for equities and commodities. In one study, Bouri et al. (2021b) discussed the connectedness between the returns for gold, crude oil, MSCI World, the USD index and the bond index for the period before the pandemic (19 August 2011–13 January 2020) and during the pandemic 13 January 2020–12 May 2020. Before the pandemic, if MSCI World and the USD index (stock indexes) had the most important volatility spillovers, then during the COVID-19 pandemic, bonds became the main assets with a volatility spillover effect.
The financial sector was identified as being the main sector with volatility spillover, alongside the energy sector, in the network of eleven sectors of the Australian stock market (Choi et al. 2021). The technology and telecommunication service sectors were the main recipients of volatility. Wu et al. (2019) studied the volatility spillover across stock market sectors in China from 7 January 2000 to 10 May 2018. The results were based on both graph theory and Diebold and Yilmaz’s (2014) methodology, confirming that the industrial sector was the main sector with volatility spillover. This study also confirmed the time-varying volatility spillover. Shahzad et al. (2021b) also studied volatility spillover between the Chinese stock sectors during the COVID-19 pandemic by taking into account the period of 2 January 2019–30 September 2020. The 1-min sampling frequency allowed the study of the downside semivariance and upside semivariance. The results confirm the variance in time and the asymmetry of volatility spillover.
Chatziantoniou et al. (2020) studied volatility spillover across sectors in the Indian stock market. The authors concluded that volatility spillover increases during periods of economic, financial and health crises, but also during the 2014 Indian elections and the 2016 demonetization period. They also found that shocks start mostly from the cyclical sectors and reach non-cyclical sectors. Thus, the sectors with net volatility spillover are basic materials, industry, finance, and consumer spending and the sectors receiving net volatility are telecommunications, information technology, healthcare and consumer goods.
The importance of studying the economic sectors of the stock exchanges is highlighted by the study performed by Bouri et al. (2021a). The authors studied the impact of three governmental decisions for reducing the pandemic’s effects in New Zealand: the stimulus package, lockdown and the travel ban. These governmental policies determined a different response on the stock market depending on each sector.
Considering previous research, we can formulate the following research hypotheses:
H1.
The intensity and direction of connectedness between economic sectors vary over time.
H2.
The connectedness between economic sectors is stronger during the health crisis caused by the outbreak of COVID-19.
H3.
The financial sector is the main sector with volatility spillover to other economic sectors, thus influencing the development of most economic sectors.
Identifying a deficiency in volatility spillover research in Central and Eastern European stock markets prompted this research. Therefore, this study addresses sectoral connectedness in one of the most developed stock markets in Central and Eastern Europe: Poland. The study provides new insights into the independence of an economic activity sector by adding to and extending the existing research literature. The volatility of stock prices in an economic sector expresses the way in which a shock, or new information, is integrated into stock prices, thus providing the possibility of identifying useful patterns in studying the characteristics and evolution of stock market sectors. The results will also provide important information when identifying the vulnerability of economic sectors.
The context of the health crisis caused by the outbreak of COVID-19 allowed for a comparative study of some changes that appeared in the connectedness between listed shares from different economic sectors before and during the crisis. Therefore, this study compares the situation of the volatility connectedness between sectoral indices before the outbreak of the health crisis and during it. The methodology proposed by Diebold and Yilmaz (2008), with subsequent additions made by Diebold and Yilmaz (2012, 2014), enables the quantification of volatility spillover, thus ensuring the possibility to make the comparisons. In this study, we will use the time-varying parameter vector autoregressions (TVP-VAR) methodology of Antonakakis et al. (2020), which is an improved version of the one proposed by Diebold and Yilmaz (2014).
2. Polish Stock Market
In the year 2004, major CE states such as Poland, Hungary, the Czech Republic and Slovakia, became EU members. It is for this reason that the Polish stock market is studied alongside that of Hungary and the Czech Republic whenever the emerging CE markets are analysed (Scheicher 2001; Li and Majerowska 2008; Syriopoulos 2007). The stock markets from these countries registered much more rapid development than the average of the developed countries in the EU, even if their economic situation was not a favorable one (Havlik 2003). We considered the stock market from Poland because it is one of the most representative emerging markets for Central and Eastern Europe. This is also proved by the fact that it is the only country in this area for which sectoral indices are calculated.
Malinowska (2021) studied 238 companies listed on the Warsaw Stock Exchange, the stock market from Poland, during 2007–2015. The conclusion was that the effects of the economic and financial crisis were noticed in the companies’ policies for future investments. The corporations’ profits were not affected but during the period analysed, both the stock return and the future growth of companies decreased. Even if the crisis did not affect the Polish market, the result confirms the lack of adequacy of the local banking sector.
Chirilă et al. (2015) studied the volatility spillover between the stock markets from Central and Eastern Europe. The Polish stock market is more influenced by the shocks of its own market than by the shocks of the Euro zone market. This result is also confirmed by the study performed by Sucháček et al. (2021), who analysed the effect of the 2007–2009 economic and financial crisis on the integration of CE stock markets. The authors reached the conclusion that the volatility of the Polish stock market was more influenced by local factors than by external ones. The crisis did not significantly influence the integration of the Polish stock market into the USA and European stock markets.
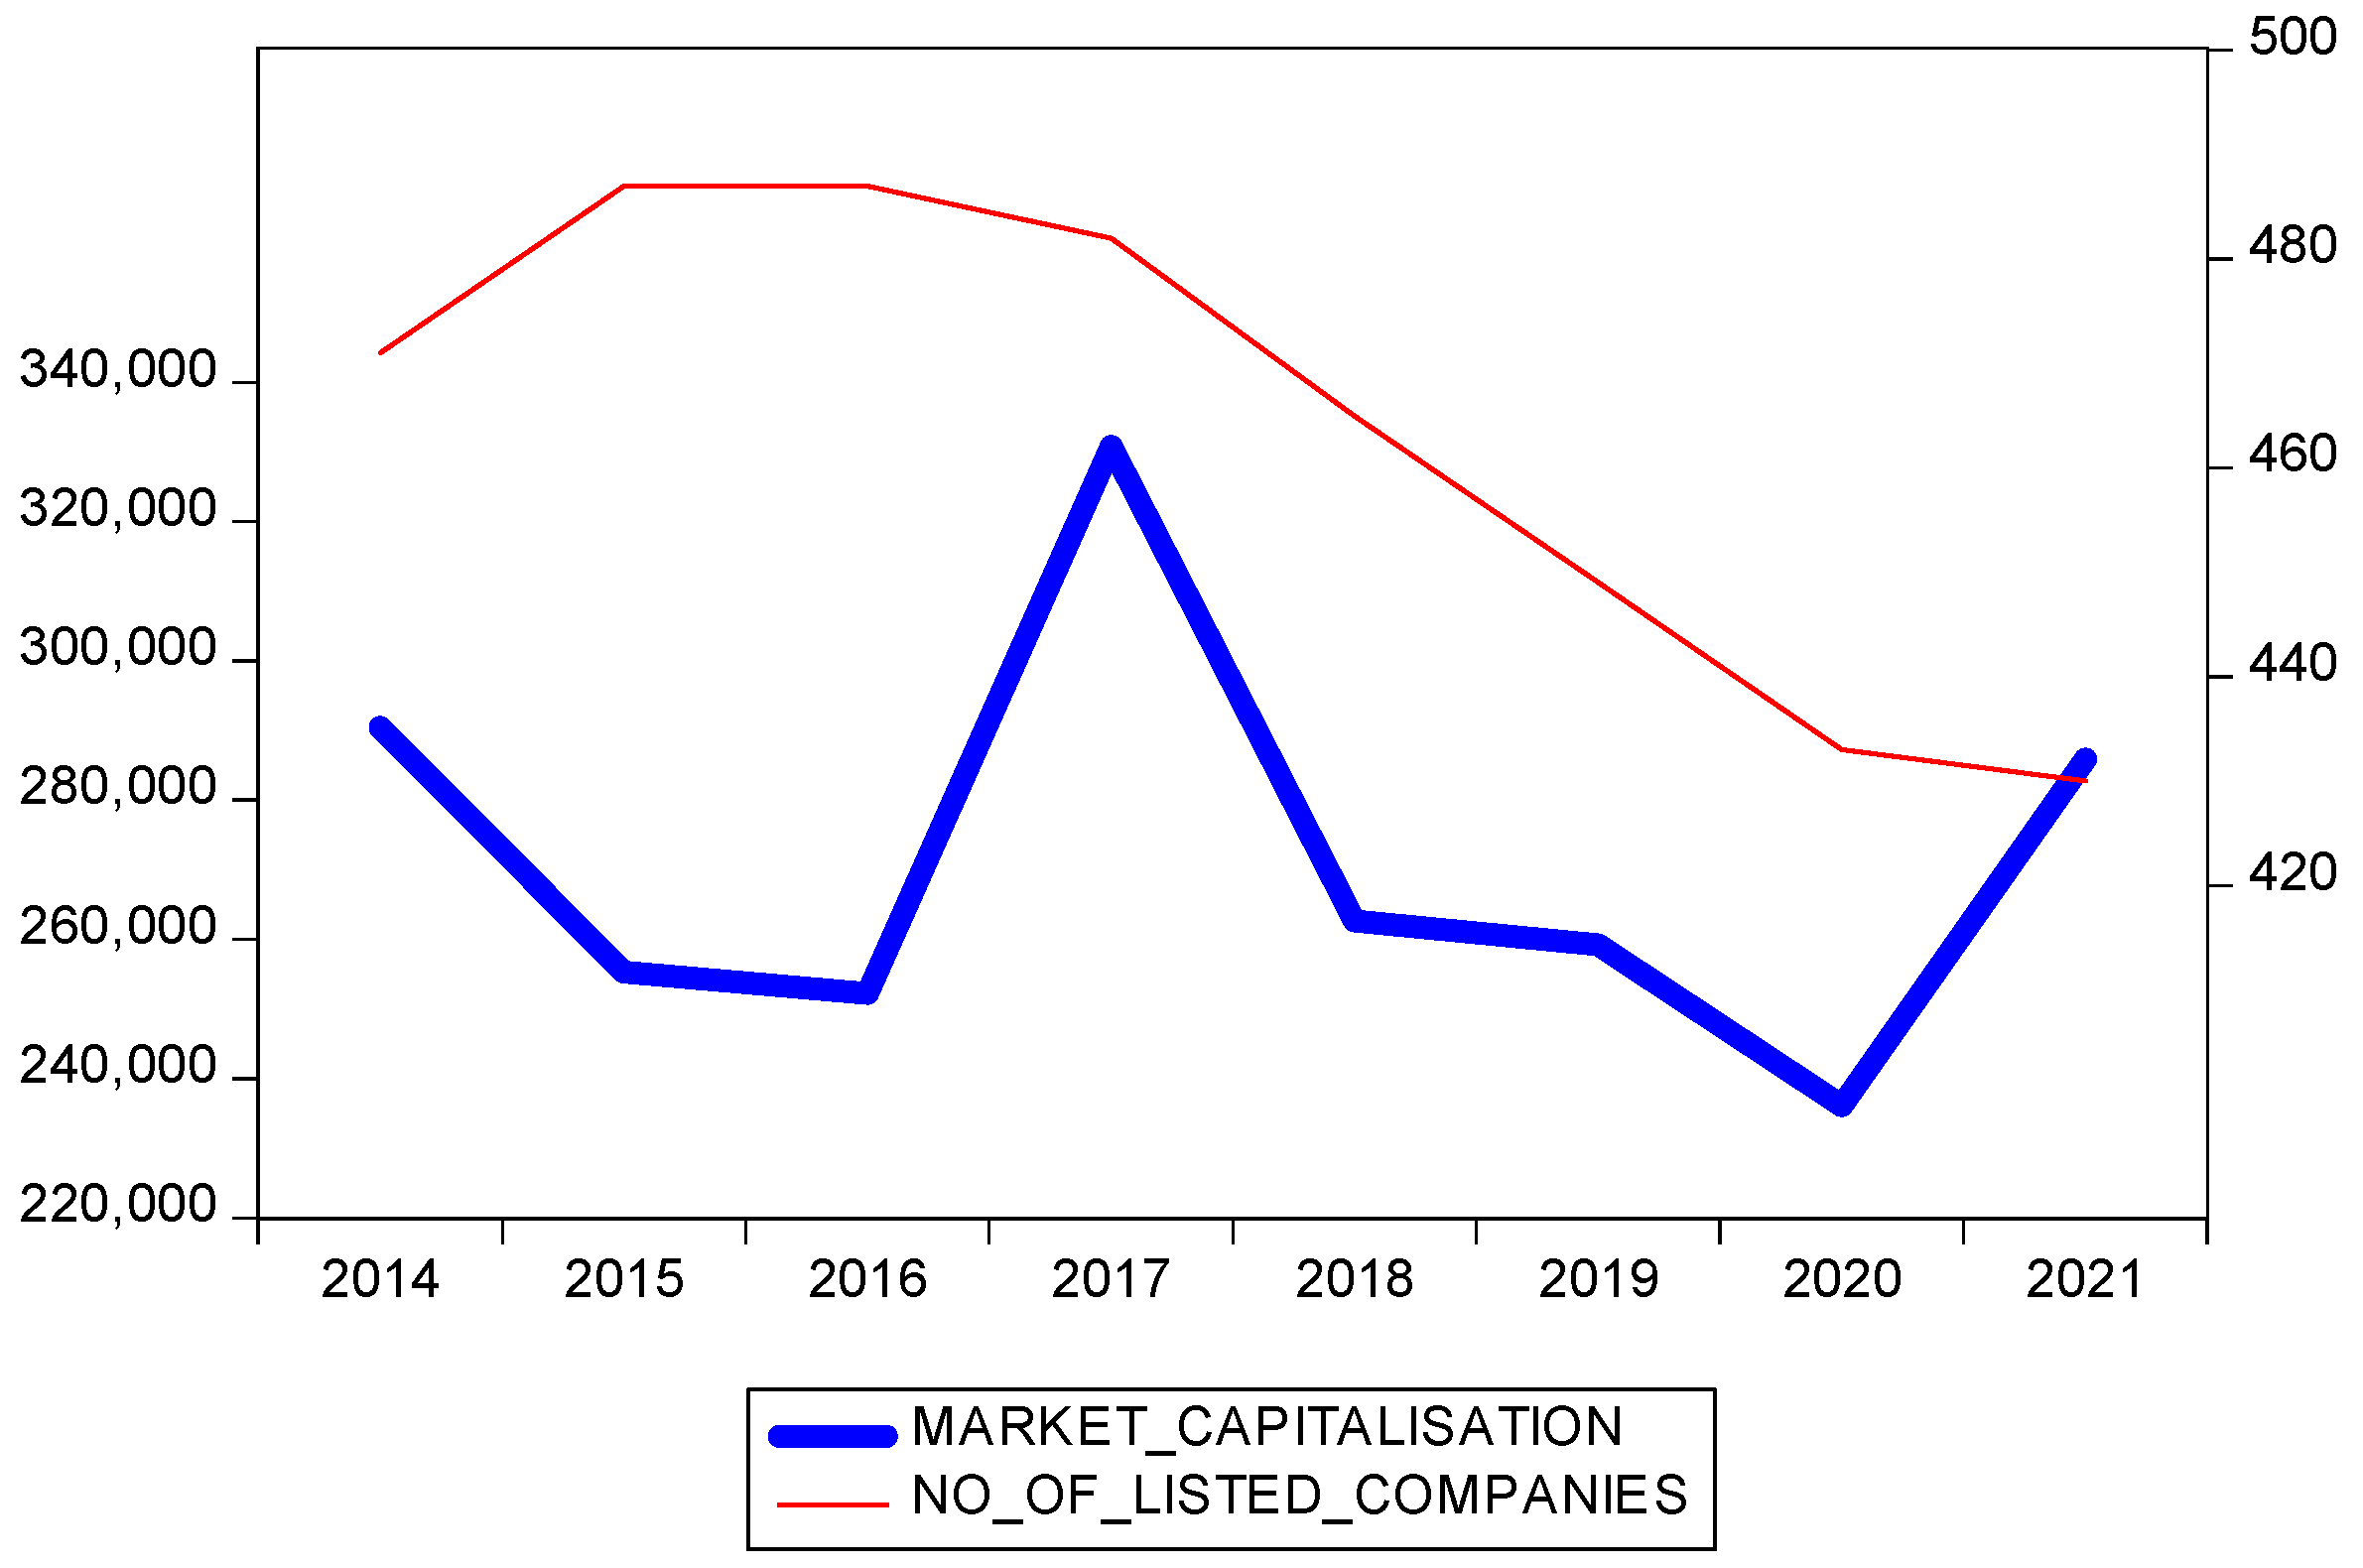
On the Polish stock market, the number of listed companies registered a continuous decrease since 2015. As shown in Figure 1, the highest descending slope was recorded during 2016–2020, when 54 companies disappeared. The decrease in the number of listed companies in the year 2021, in comparison with 2020, is very low, with a decrease of only three companies. The decrease in the capitalization of the Polish stock market can be noticed continuously during 2017–2020, with a decrease of 95,000 million Euros. In the year 2021, the capitalization of the market increased by approximately 50,000 million Euros.
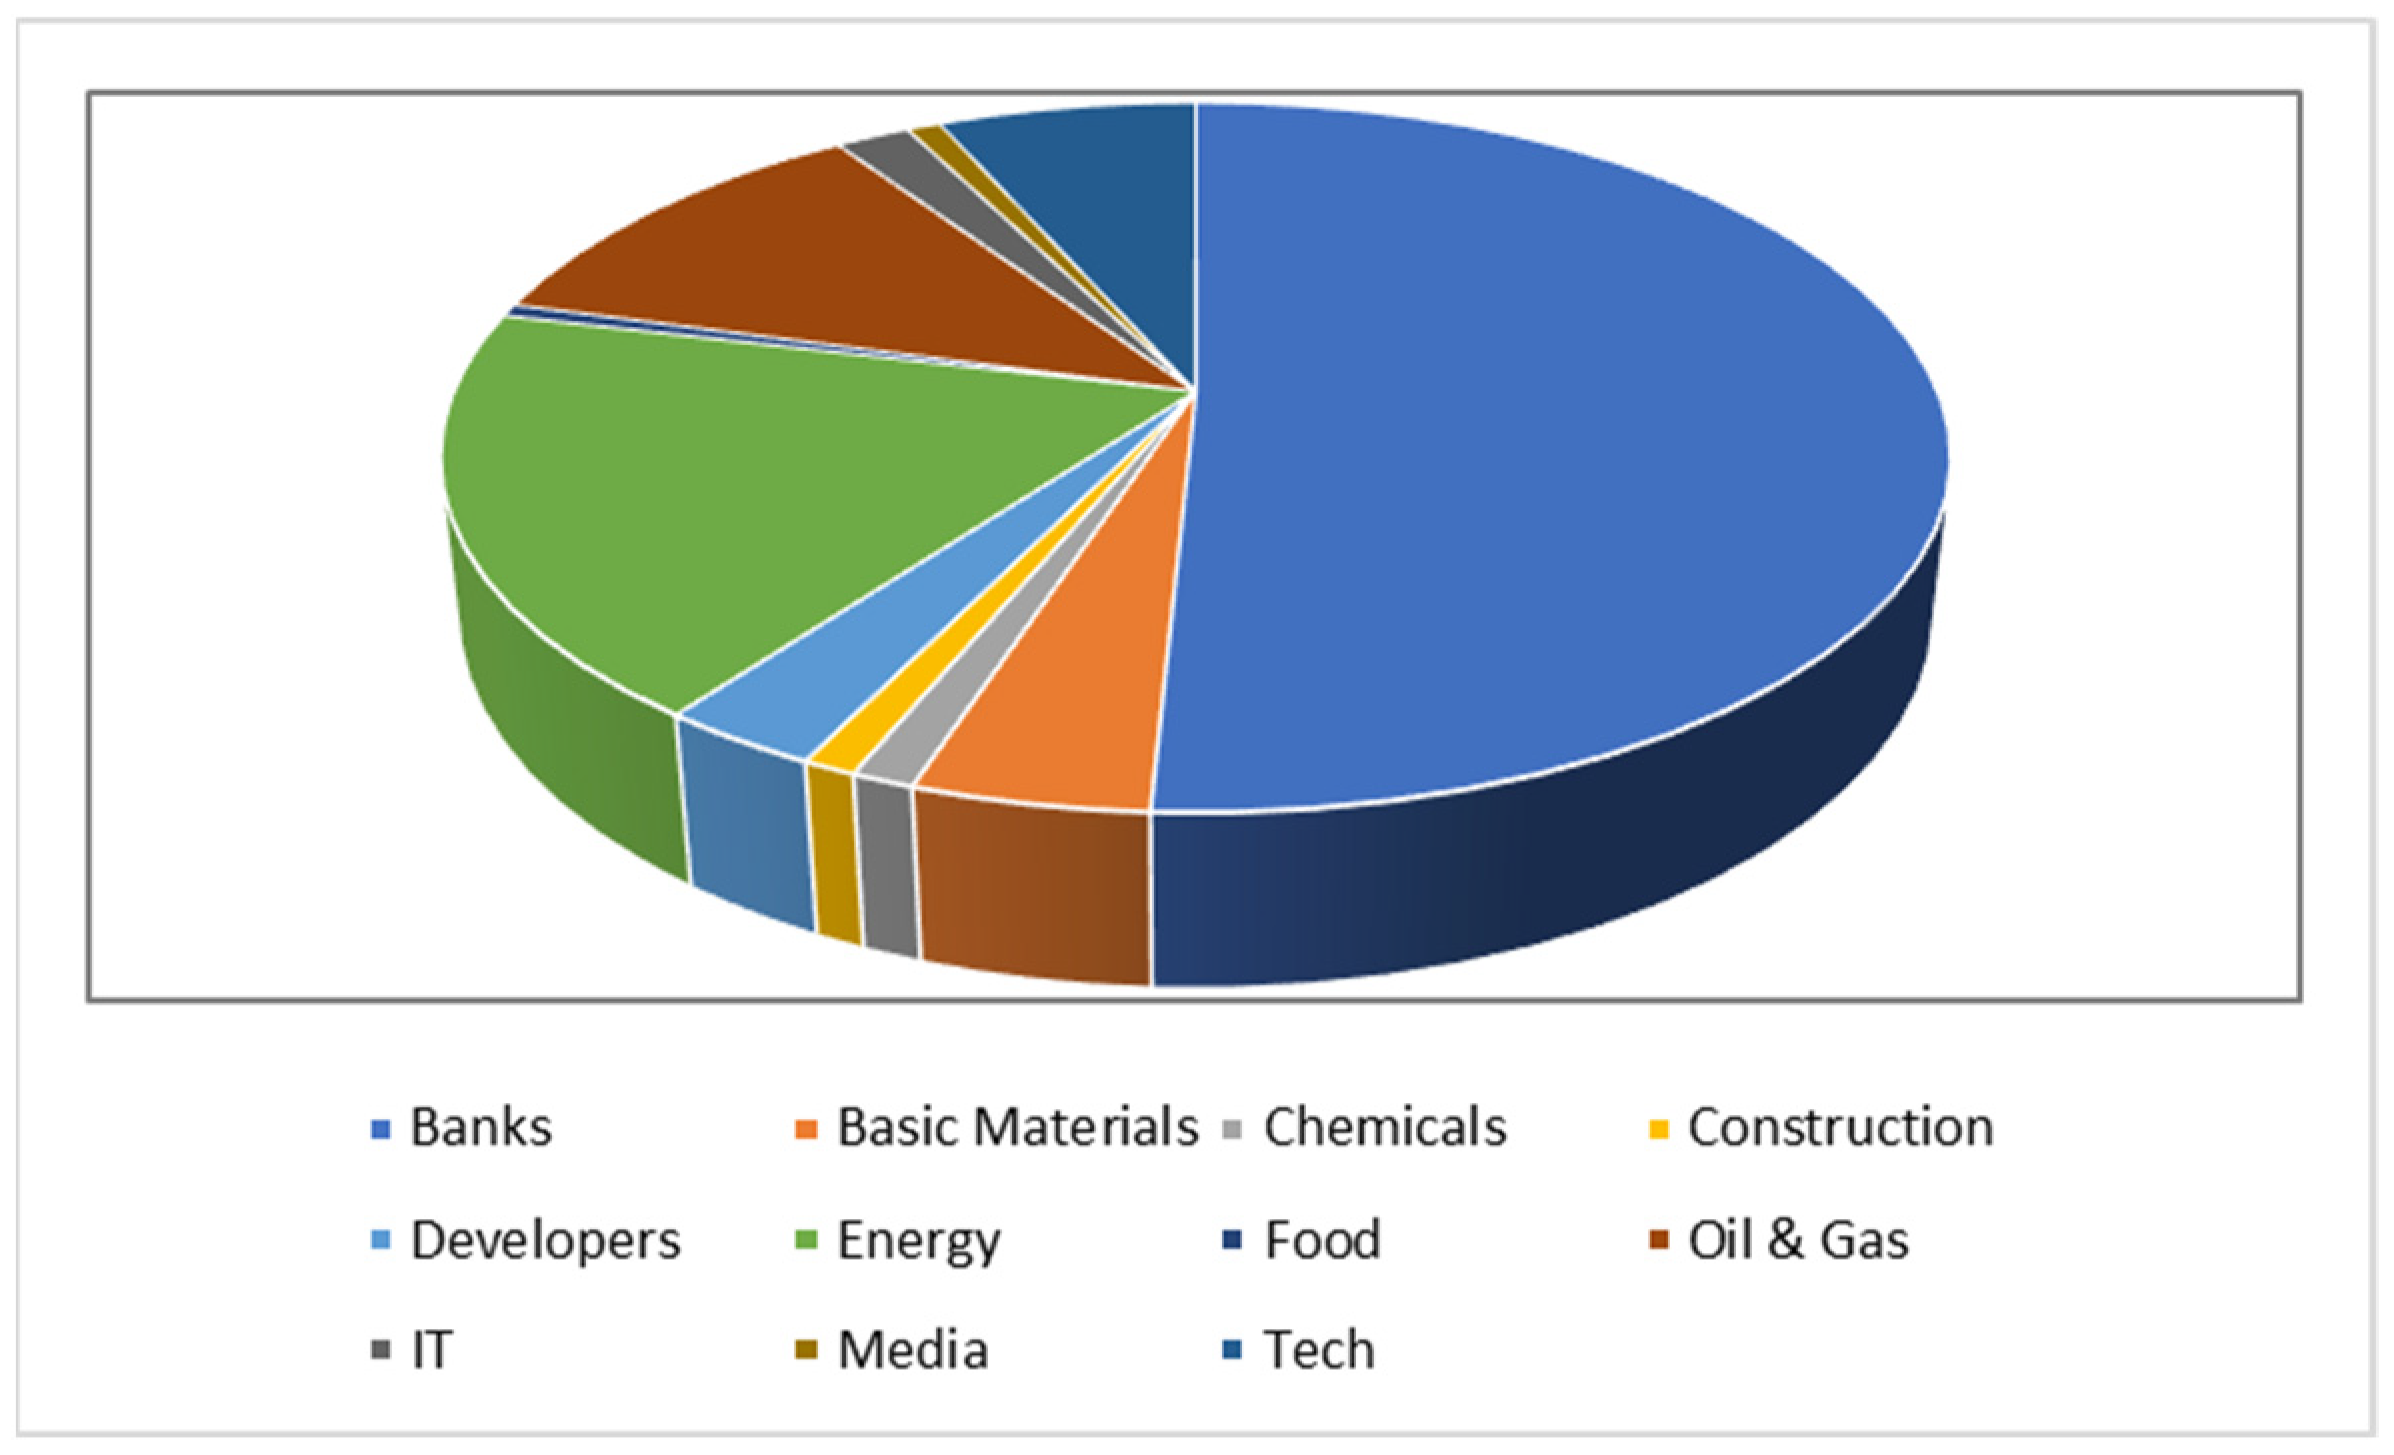
In order to determine the structure of the capitalization of the stock market according to different economic sectors, we took into consideration the capitalization of each stock composing the sectoral indices. The data were taken from the website www.investing.com, accessed on 14 June 2022. The results obtained are presented in Figure 2 below.
Based on these data, it can be noticed that the banking sector has a very high weight of 50.79%, followed by the energy sector (18.55%) and the oil and gas sector (11.33%).
3. Methods
The spillover assessment using the methodology proposed by Diebold and Yilmaz (2008, 2012, 2014) is widely used for estimating volatility spillover. However, the spillover dynamics based on a VAR model are influenced by the chosen size for the rolling-window, extreme values, mismatch for high-frequency data and information loss caused by the rolling-window. The removal of these disadvantages was achieved by using TVP-VAR presented by Antonakakis et al. (2020). This study uses the latter methodology. We will go through several stages: (a) identifying the descriptive characteristics of the volatility indices of the Polish stock market’s sectors, (b) testing the stationarity of the sectors’ volatility series, (c) estimating the vector autoregressive (VAR) model, and (d) forecasting the error variance decomposition for the quantification of volatility spillover (TVP-VAR).
A vector-autoregressive model, VAR, is estimated and the variance decomposition matrix is determined. This allows the quantification of directional and net spillovers (connectedness) between stock market sectors.
The estimated VAR model can be written as follows:
where is the vector of endogenous variables, is the autoregressive coefficient matrix, and is the vector of error terms.
Relation (1) can be written as a moving average as follows:
where is the coefficient matrix, is the identity matrix and = 0 for j < 0.
The moving average coefficients are used for variance decomposition. The variance of the H-step-ahead forecast error is decomposed into the variances determined by the shocks of the system in the VAR(p) model.
The contribution of variable x to the H-step-ahead generalized forecasting error variance for variable i, based on the generalized VAR of Koop et al. (1996) and Pesaran and Shin (1998), can be calculated as follows:
where is the standard deviation of the error variable in equation j, and is the vector taking the value 1 for element i and zero otherwise.
The generalized forecast error variance shares are thus obtained by normalization:
thus, and .
The measurement of pairwise directional connectedness, at horizon H, from j to i is achieved based on the following formula:
The measurement of net pairwise directional connectedness is achieved based on the following formula:
The directional volatility connectedness received by sector i from all other sectors j (FROM):
The directional volatility connectedness transmitted by sector i to all other sectors j (TO):
The net total directional spillover for sector i:
The total spillover index:
4. Data and Empirical Steps
For the study of the volatility spillover between shares of different economic sectors traded on the Polish stock exchange, the period from 1 January 2013 to 2 December 2021 is considered. This time frame allows studying volatility spillover before the outbreak of the health crisis caused by COVID-19 (without taking into consideration the period of the global financial crisis of 2008–2009 and the European sovereign debt crisis, 2010–2012) and also allows us to study the volatility spillover between sectors during the health crisis. The period considered is based on the research conducted by Costa et al. (2021), which had the same start date for the sample, and the sample stops earlier, on 31 December 2020. Daily returns determined based on sectoral indices will allow the performance quantification of each of the economic sectors we analysed.
The data used are the daily values of the sectoral stock indices calculated on this stock market including banks, basic materials, chemicals, construction, developers, energy, food, and oil and gas. They are considered high-frequency, daily data for several reasons. First, financial markets are known to immediately incorporate the information that emerges in the market into asset prices. Thus, the closing prices of the sectoral indices will reflect all the news or changes that occur during the day in the economic sector. Secondly, the daily closing prices of the sectoral indices also reflect the expectations regarding the evolution of the business sector.
The return rate for each business sector is calculated based on the following formula:
where is the log-return for the economic sector i at time t. and are the values of the sectoral index i, at time t and t − 1, respectively.
Consistent with the studies of Antonakakis et al. (2018), Corbet et al. (2020) and Costa et al. (2021) for determining the volatility of the i-index price, we will use the following formula:
For each index, 2327 daily returns and volatilities were determined. This study carries out a comparison between the volatility spillover situation before and after the outbreak of COVID-19. Therefore, two sampling units are considered: the first sample unit covers the period from 1 January 2013 to 31 December 2019 (here, we also determined 1825 values for returns and volatility) and the second sample unit covers the period from 1 January 2020 to 2 December 2021 (502 values for returns and volatility). The samples are in compliance with the choice of samples performed by Costa et al. (2021) and Akhtaruzzaman et al. (2020).
The stages that we will go through in achieving the proposed general objective are the following: (a) performing a descriptive analysis of the variables studied, (b) testing the stationarity of the variables to allow moving onto the next stage, (c) estimating the TVP-VAR model, and (d) conducting error variance decomposition. The results will allow for the prediction of the components according to the shocks of the studied component and the other components.
5. Empirical Results
5.1. Preliminary Analysis
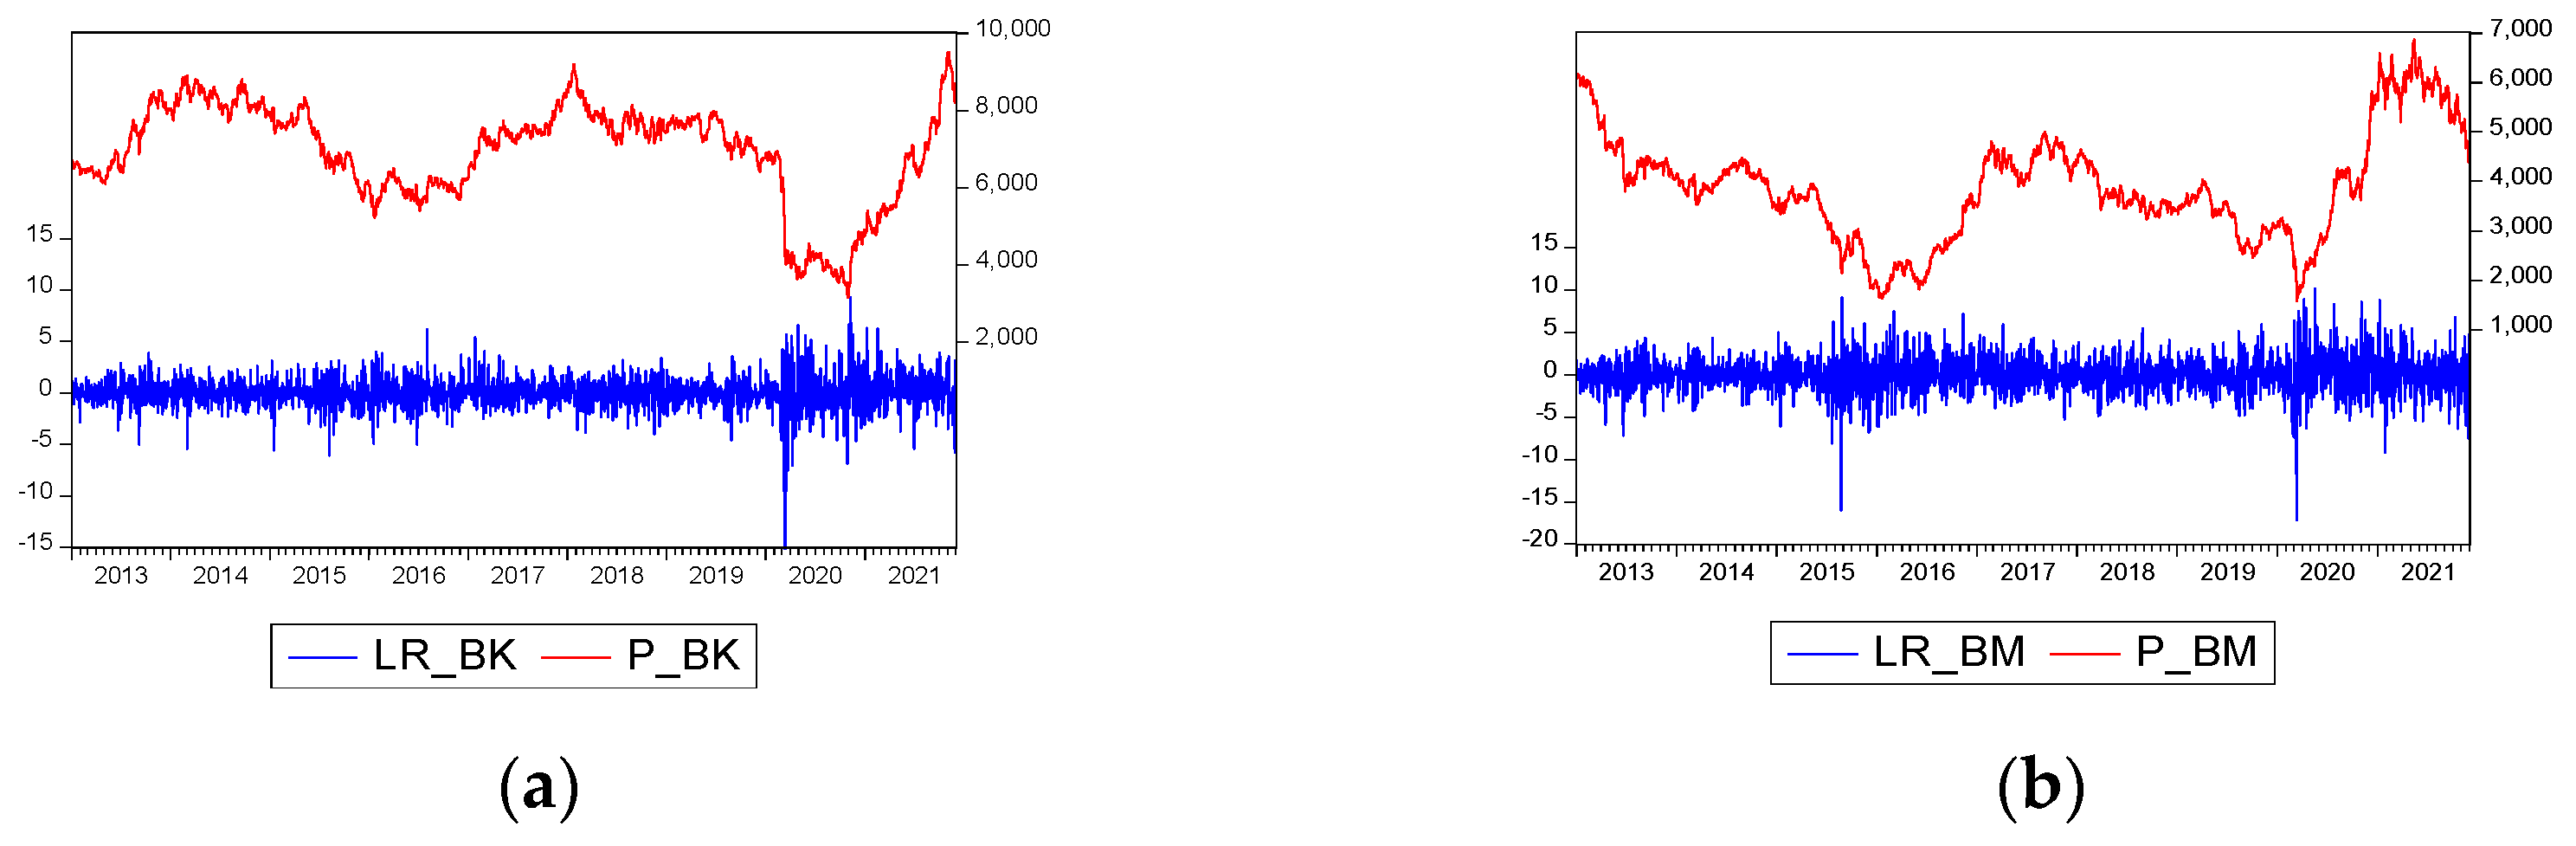
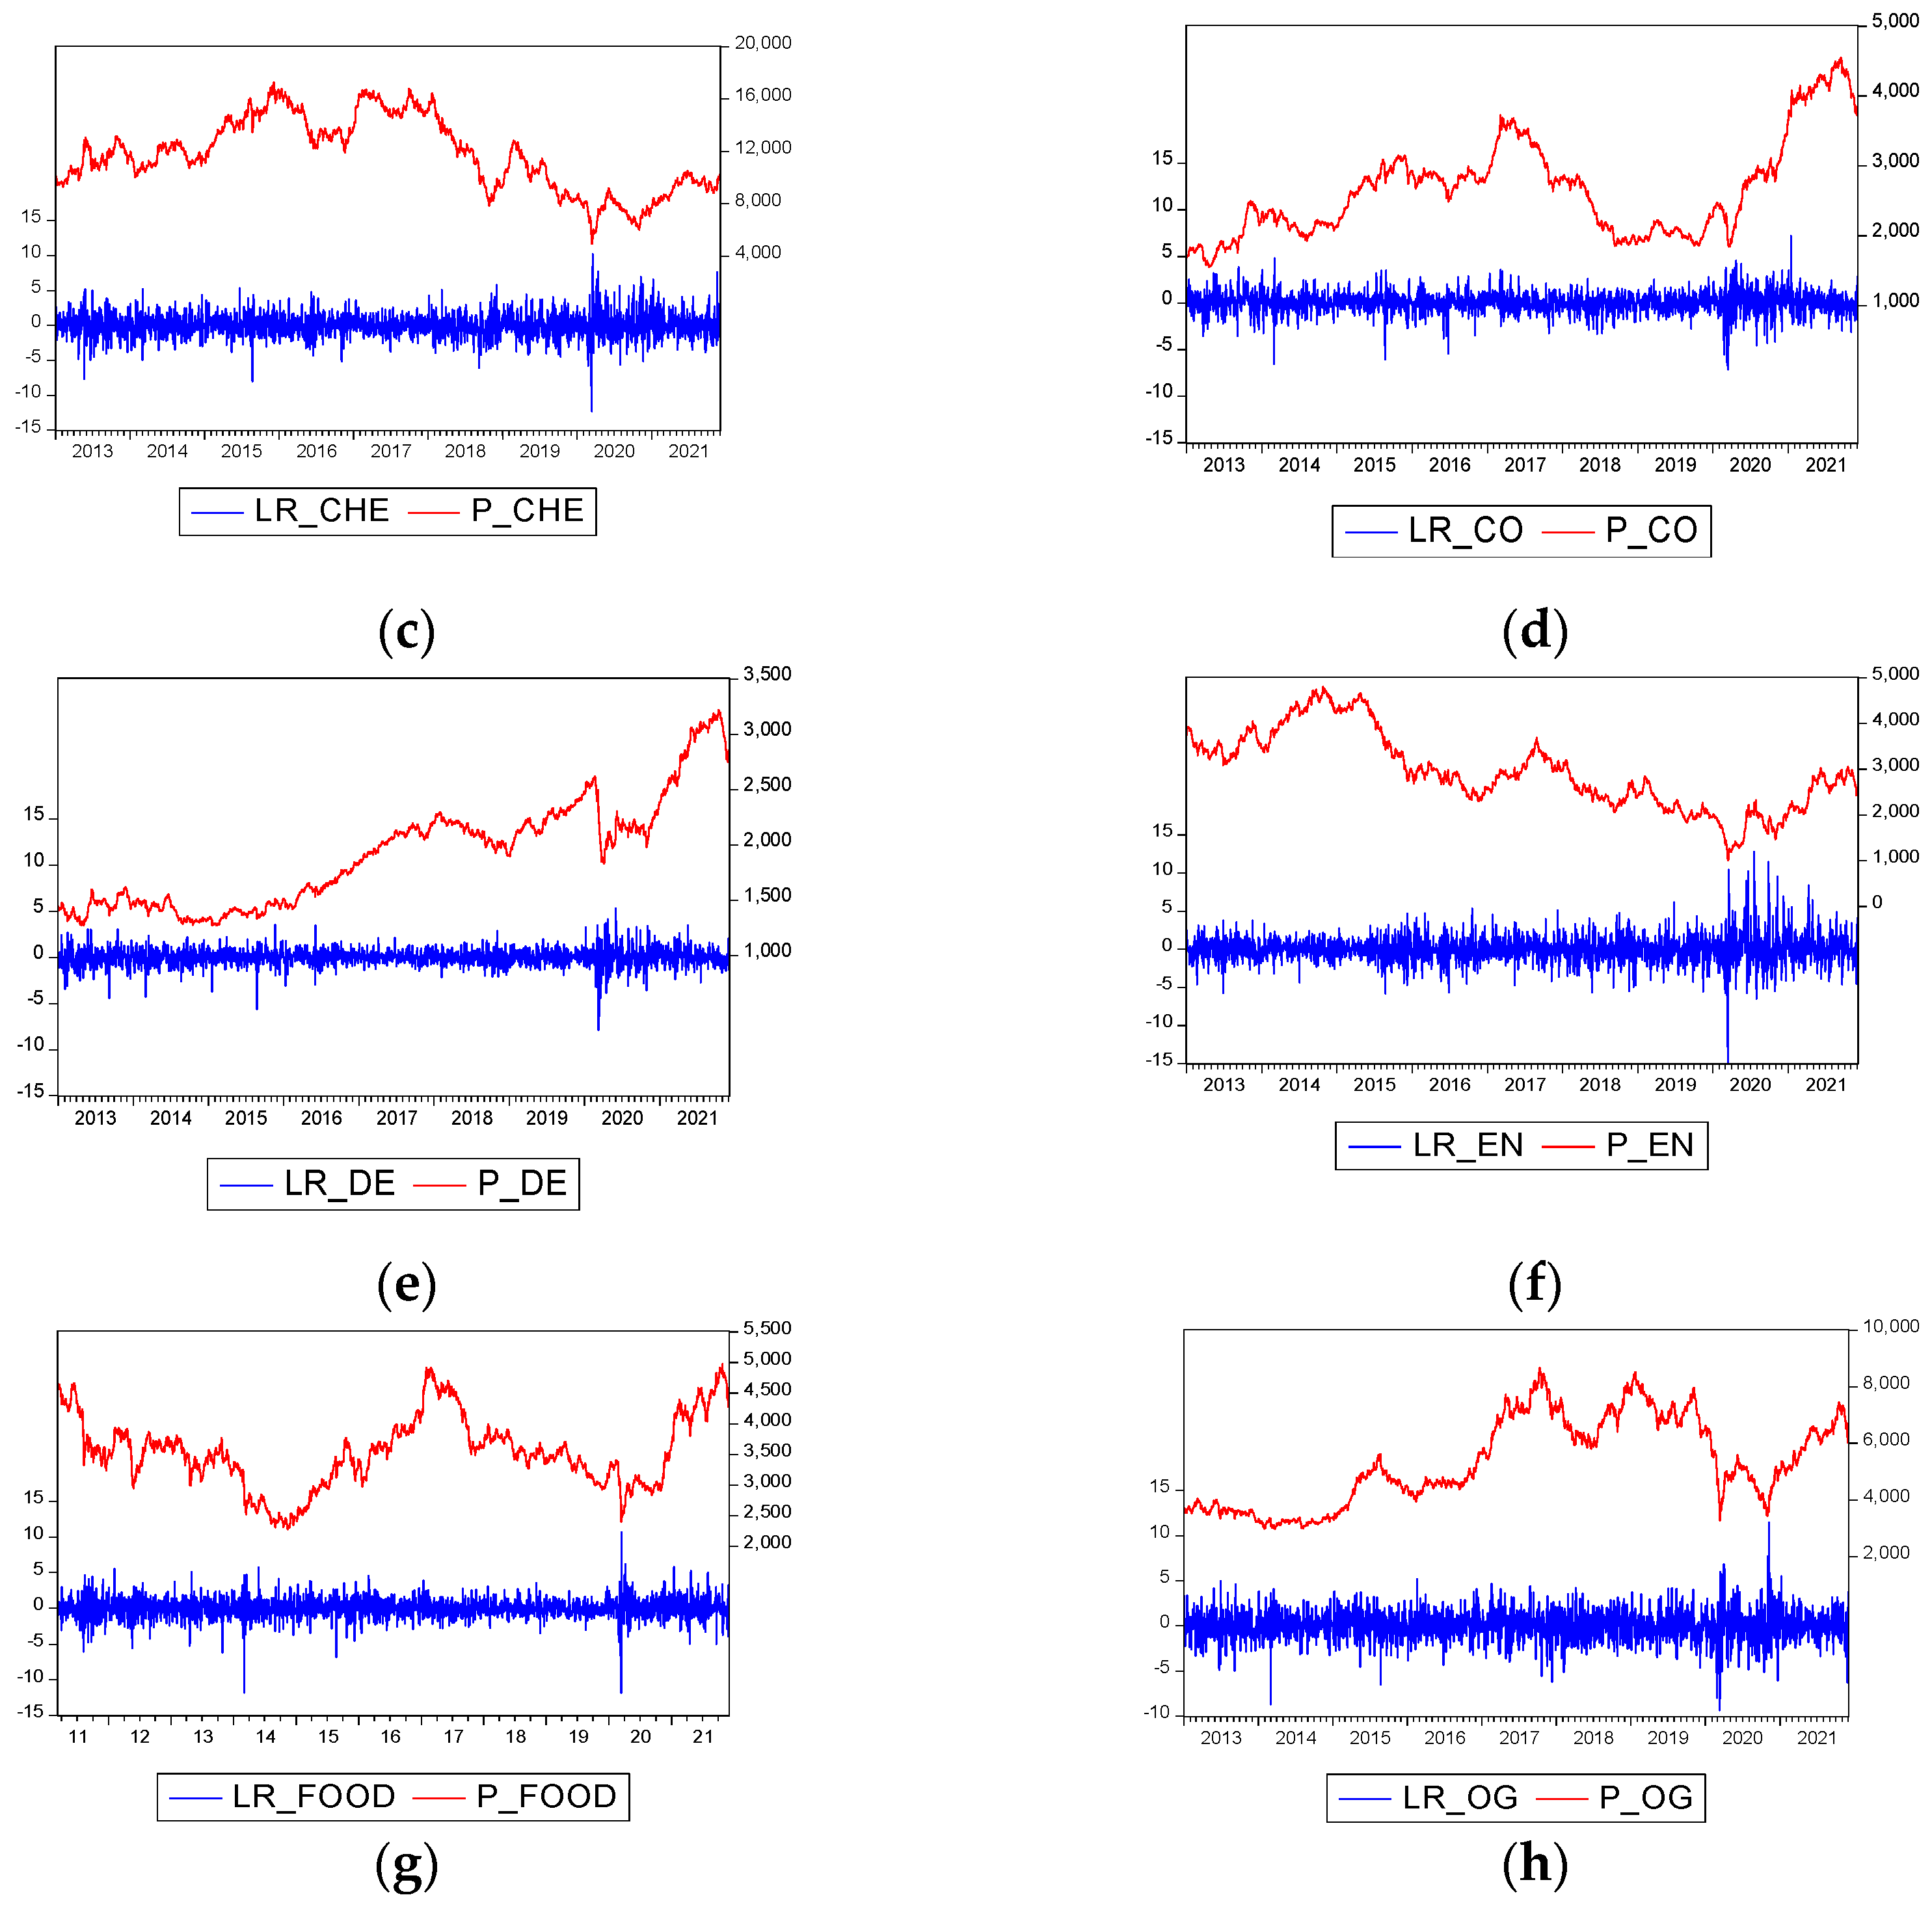
Figure 3 shows the evolution of the return and of the value of the sectoral indices during the analysed period. A different evolution of these economic sectors can be observed, which suggests the possibility of diversifying a portfolio by buying stocks with different fields of activity. We also note an increase in stock market volatility from all sectors at the end of 2019 at the same time as the outbreak of COVID-19.
The estimation of descriptive statistical indicators for the volatility of sectoral indices, presented in Table 1, shows that the basic materials and chemicals sectors had the highest average risk before the health crisis. However, after the outbreak of COVID-19, the highest level of average risk appears to be in the basic materials and energy sectors as shown in Table 2. The distributions of the volatilities of all sectors also show asymmetry and skews that deviate from a normal distribution, a result confirmed by the Jarque-Berra test.
For the estimation of the TVP-VAR model, the variables considered must comply with the stationarity condition. To test the unit root, several tests were used in order to guarantee the validity of the results: the augmented Dickey–Fuller test (ADF) (Dickey and Fuller 1979), the Phillips–Perron test (Phillips and Perron 1988), the augmented Dickey–Fuller breakpoint unit root test (Perron 1989) and the ERS test (Elliott et al. 1996). The results obtained and presented in Table 1 and Table 2 confirm the lack of unit root for the volatility series in the two periods studied.
The estimation of Spearman correlation coefficients between the volatilities of stock market sectors traded on the Polish stock market, presented in Table 3 and Table 4, shows a weak or small correlation.
It is certain that, during the health crisis, the connections between all sector volatilities, and therefore the connectedness between sectors, increased as a result of the emergence of a common risk factor. Both before and after the pandemic, the highest connection was between the volatilities of the banks and basic materials sectors (0.320) and the lowest before the pandemic was between energy and food (0.157) and the lowest after the pandemic was between the energy and developer sectors (0.212). For both periods considered, the highest correlations are between the banking sector and the other sectors.
5.2. Static Results for Spillover Volatility
The results of the TVP-VAR model are based on a VAR (1) model with a 20-step-ahead generalized forecast error variance decomposition, as in the analysis conducted by Chatziantoniou et al. (2020). The order for the VAR was selected based on the Schwarz information criterion.
Each row of Table 5 presents the contributions of the volatility, from (FROM) each sector, to the forecast of the volatility error variance of the considered sector. Each column presents the contributions of the volatility of the sector considered to (TO) the forecast of the volatility error variance of each sector in the network. Thus, the diagonal presents the effects of the volatility of a sector on the volatility of its own sector. The column “FROM others” shows the total volatility spillover from other sectors using values obtained by summing up the row values. For example, a value of 36.28, for the banking sector, shows that 36.28% of volatility is received from all other sectors in the network, but its own volatility is excluded. On the row “TO others”, total volatility spillovers to other sectors are summed up per column. For example, for the banking sector, the value of 38.28 shows that 38.28% of the volatility is spilt over to the other sectors in the network, excluding its own spillovers. The difference between the results obtained on the column “FROM others” and the row “TO others” for each sector is indicated on the NET row. Positive values on this line/row indicate that the sector has net volatility spillover and negative values indicate a sector receiving volatility.
Total spillovers before the COVID-19 pandemic have a very low value of only 29.56%, as shown in Table 5. For example, in the case of the US, the total connectedness is 84.5% (Costa et al. 2021). However, the outbreak of the pandemic caused by COVID-19 caused a rather high increase in total spillover, reaching 49.7%, according to Table 6, which confirms research hypothesis H2 (according to which the connectedness between economic sectors is stronger during the health crisis caused by the outbreak of COVID-19). This situation is caused by the emergence of common risk factors for all economic sectors. This result is in line with the one obtained by Shahzad et al. (2021a), according to which the connectedness between sectors is stronger in the bulk of the distribution.
If before the pandemic, the contribution of volatility to one’s own sector was very high (the highest value was 77.06% in the case of the food sector and the lowest value was 63.72% for the banking sector), then during the pandemic, the contribution of volatility to one’s own sector decreased (the highest value was 56.06% for the food sector and the lowest value was 42.8% for the banking sector). These results are consistent with the previous studies performed on the emerging markets from Central Europe, among which Poland is also present (Chirilă et al. 2015; Sucháček et al. 2021): the volatility of the stock markets in emerging countries is more influenced by their owns shocks than external ones. The biggest shock-transmitting sectors are banks, basic materials, chemicals and oil and gas in the pre-pandemic period and banks, chemicals, oil and gas and basic materials in the post-pandemic period. The results confirm research hypothesis H3, according to which the financial sector has the largest volatility spillover to other economic sectors. We also observe that in the spillover ranking, the chemicals and oil and gas sectors moved up in the ranking, whereas the basic materials sector was downgraded.
Before the COVID-19 pandemic, the sectors with net volatility spillover were banks, basic materials, construction and oil and gas and during the pandemic period, only the first three sectors mentioned above still have net volatility spillovers, with the oil and gas sector becoming a volatility receiver.
5.3. Dynamic Results for Spillover Volatility
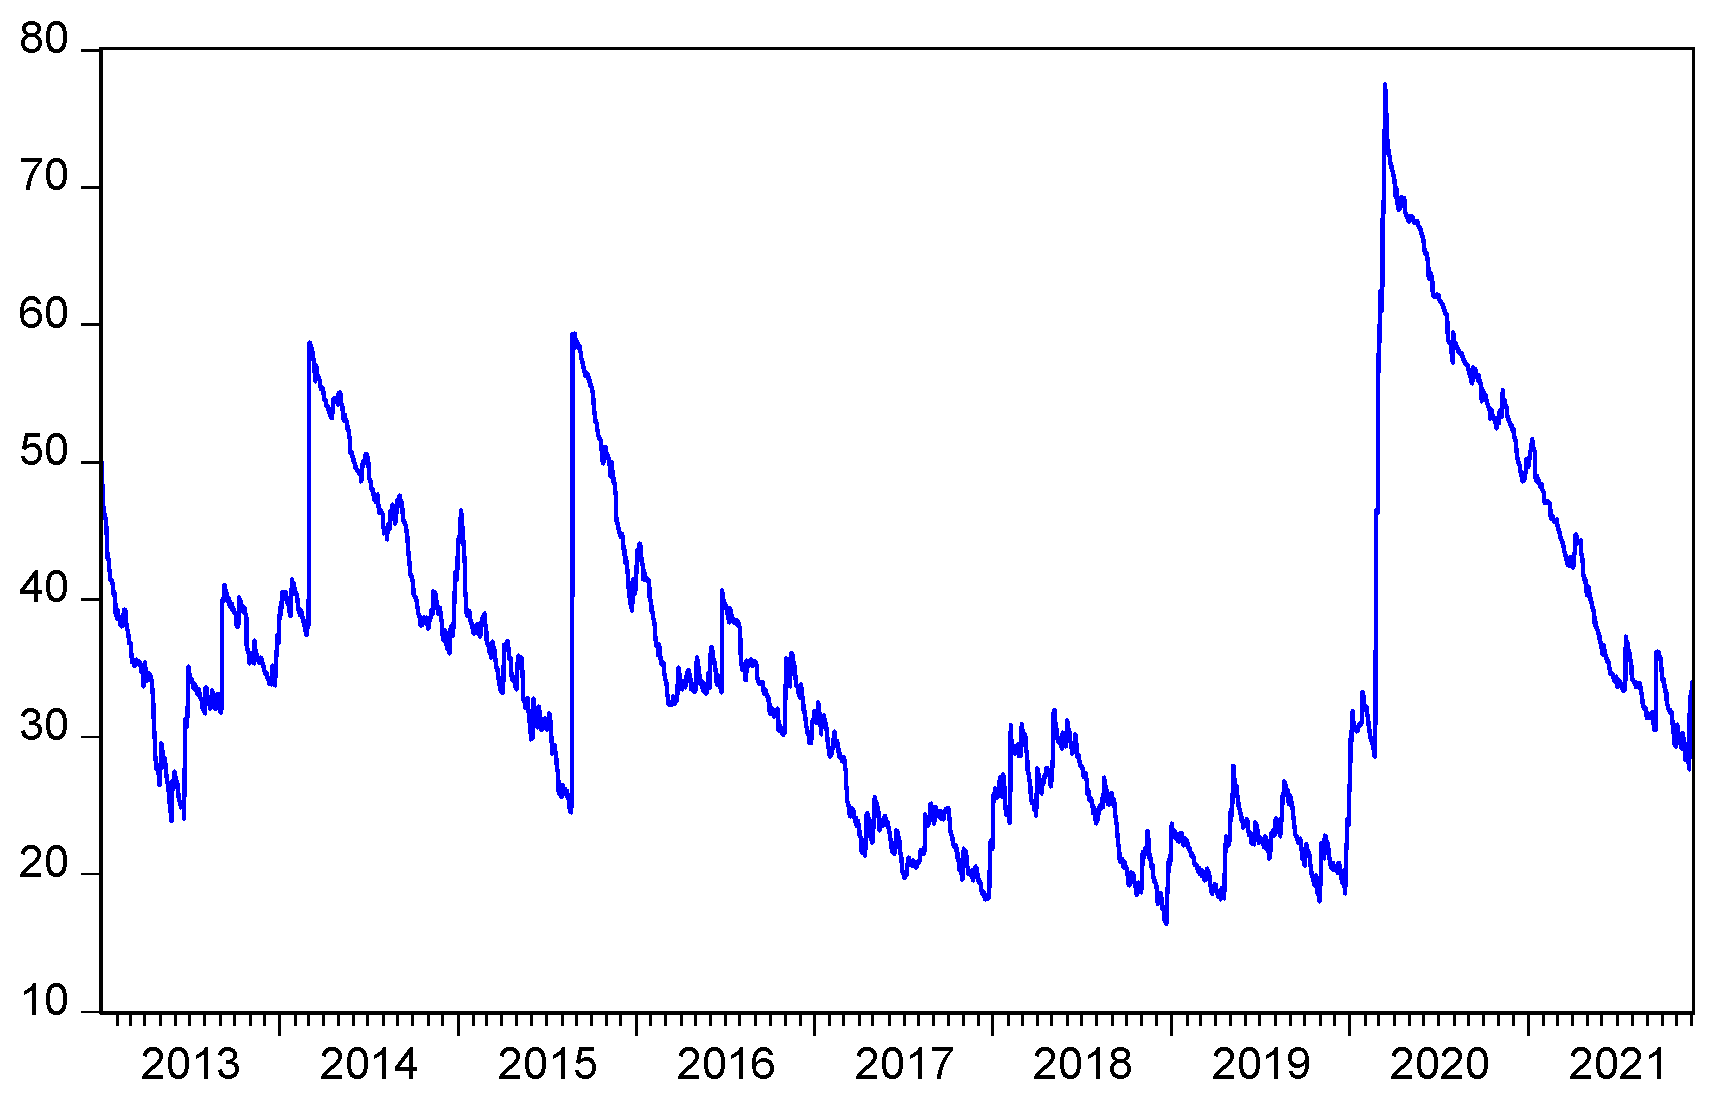
The total volatility spillover of the listed equity sectors on the Polish stock market, over the entire period studied, is presented in Figure 4. Therefore, it stands out that the volatility spillover and, implicitly, the connectedness between economic sectors, varies over time, a fact that confirms hypothesis H1 (according to which the intensity of the connectedness between economic sectors varies over time). In Figure 4, we can also observe a higher connectedness during the pandemic, confirming once again research hypothesis H2, this time through graphical representation. We could also mention that the volatility spillover shows cyclicality over a period of about 2 years. This result suggests that investors or portfolio managers should periodically review the structure of their portfolios.
It is undoubtedly evident that the outbreak of COVID-19 caused a significant increase in the volatility spillover on the Polish stock market, the highest increase being in the time interval studied. Moreover, it is also observed that this sudden spillover increase occurred before March 11, the time when the World Health Organization declared the existence of the pandemic. This demonstrates, once again, that the stock market anticipates economic developments and also that the increase in volatility spillover occurs during turbulent times and during crises. At the same time, increased volatility spillover can be caused by political events (Mensi et al. 2021). A steep increase in volatility spillover, but smaller than that caused by COVID-19, occurred in 2015, the year of the presidential elections but also the legislative (parliamentary) elections.
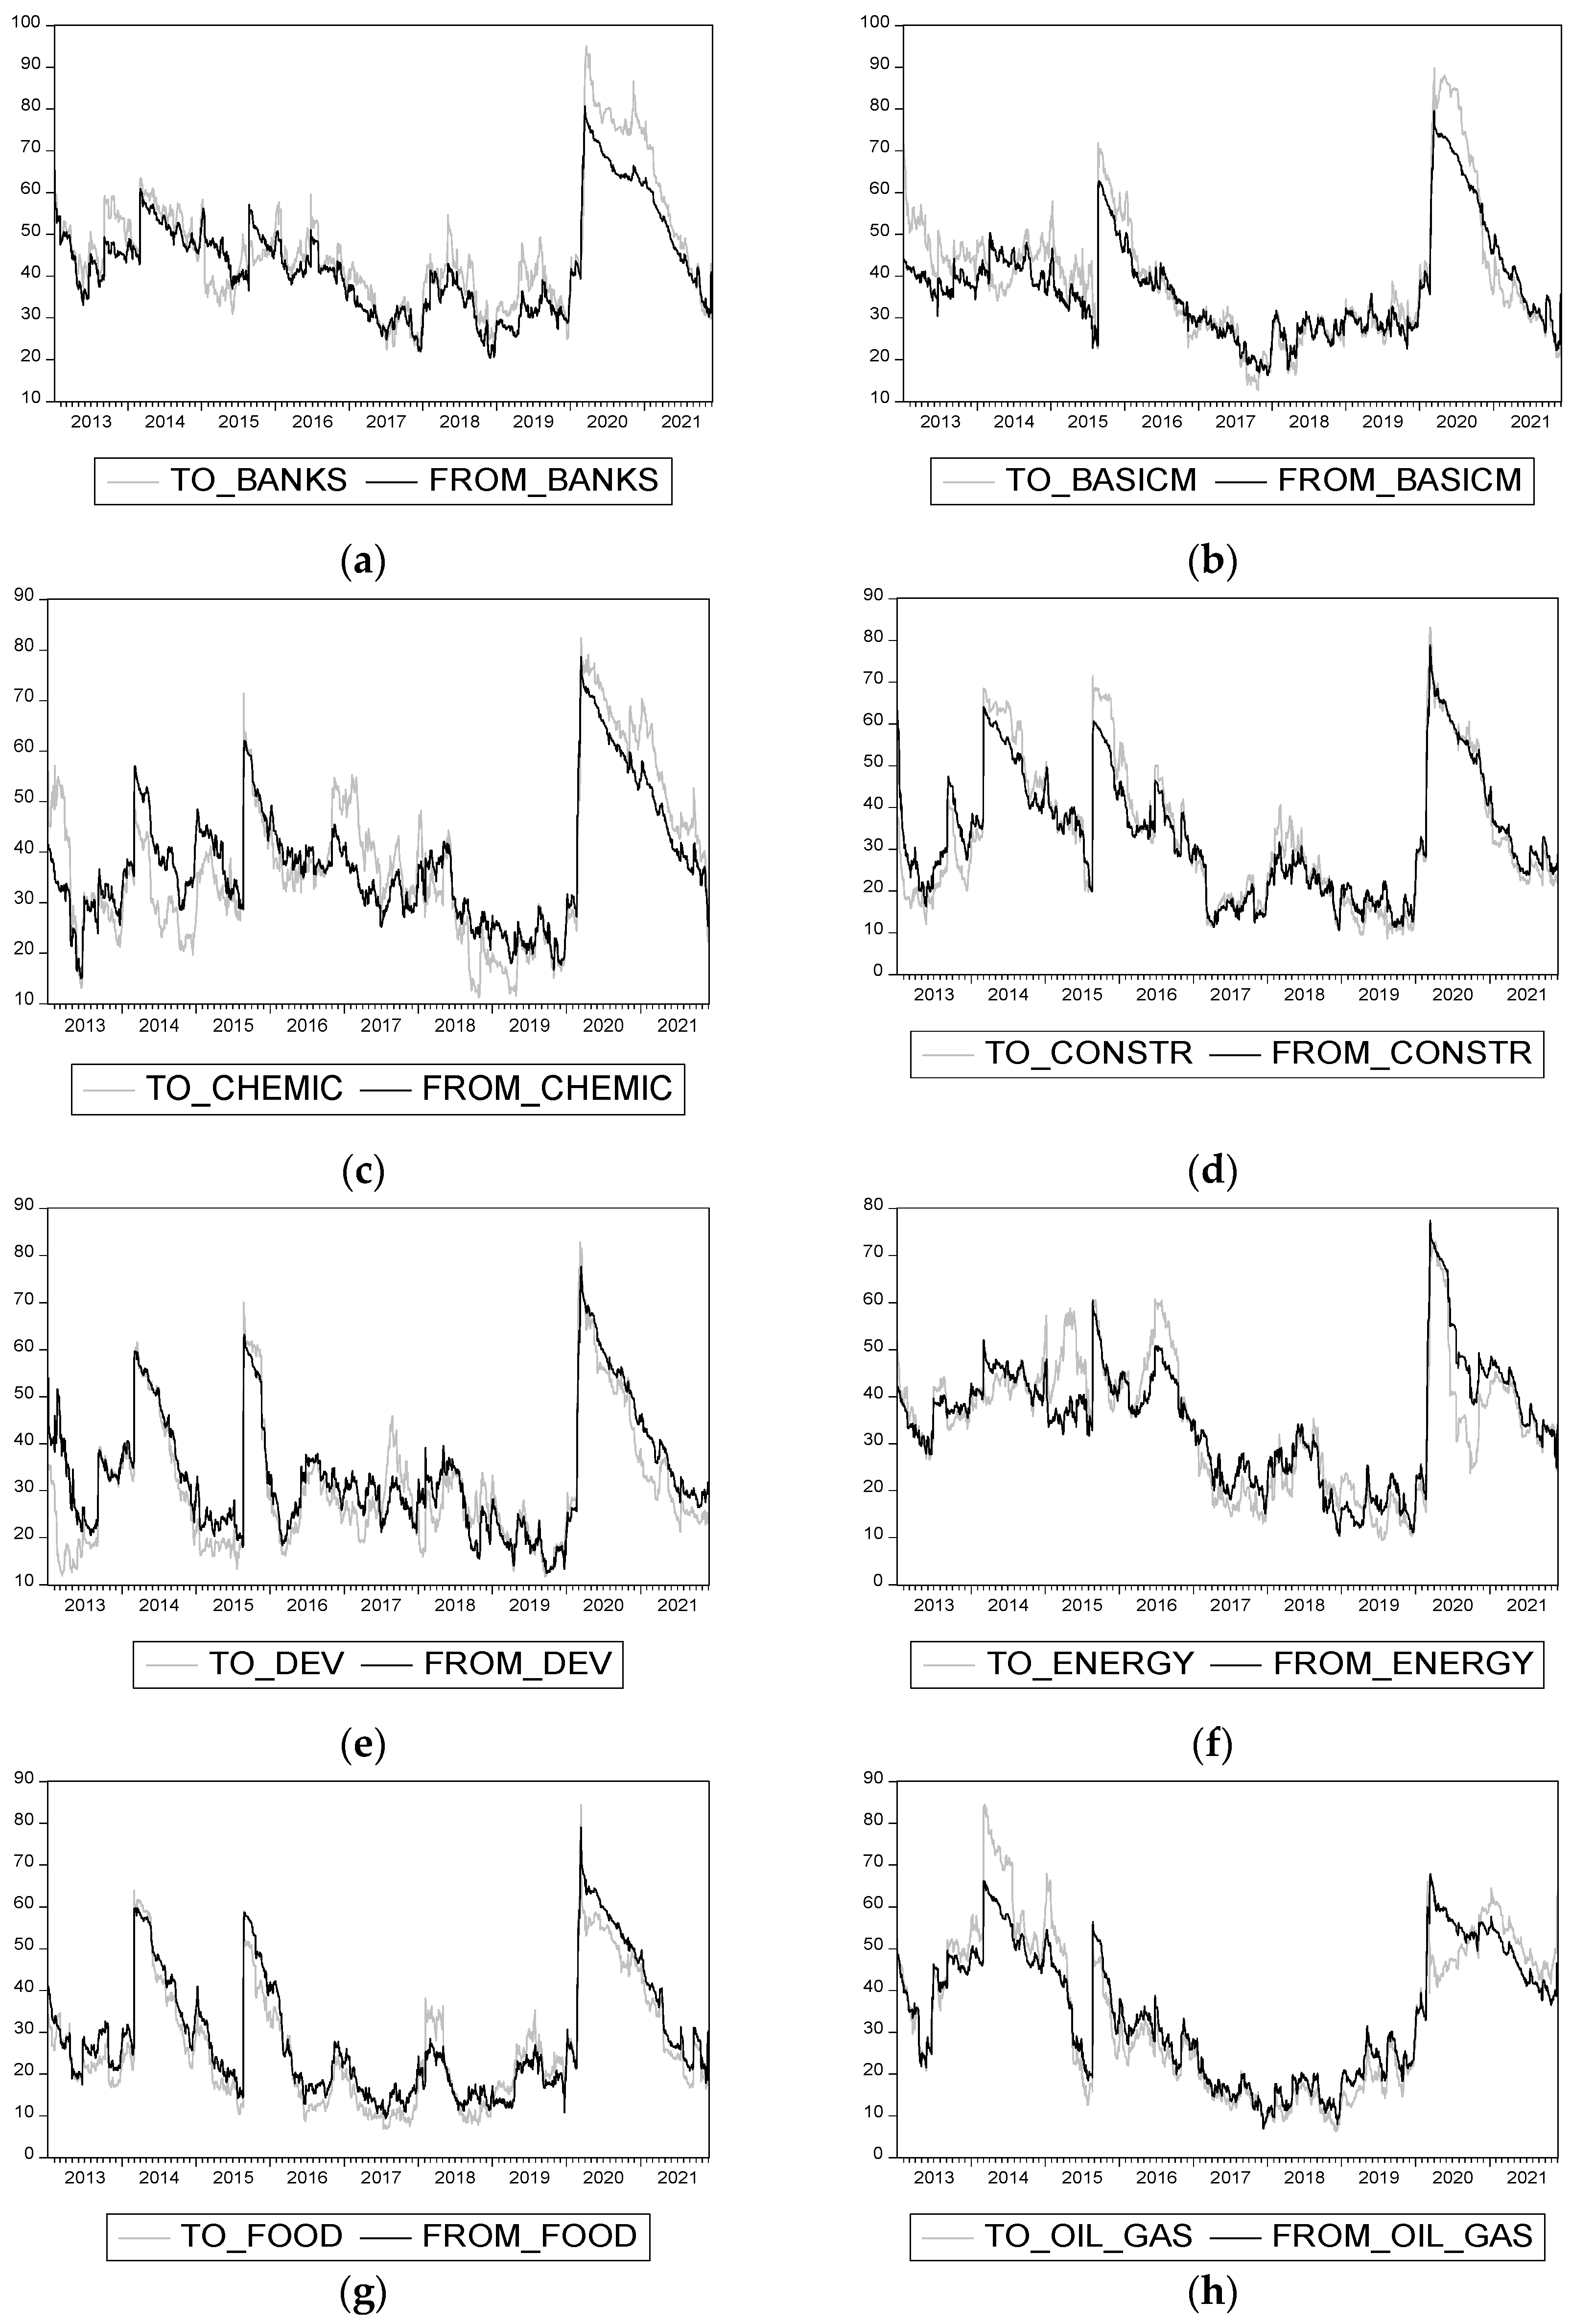
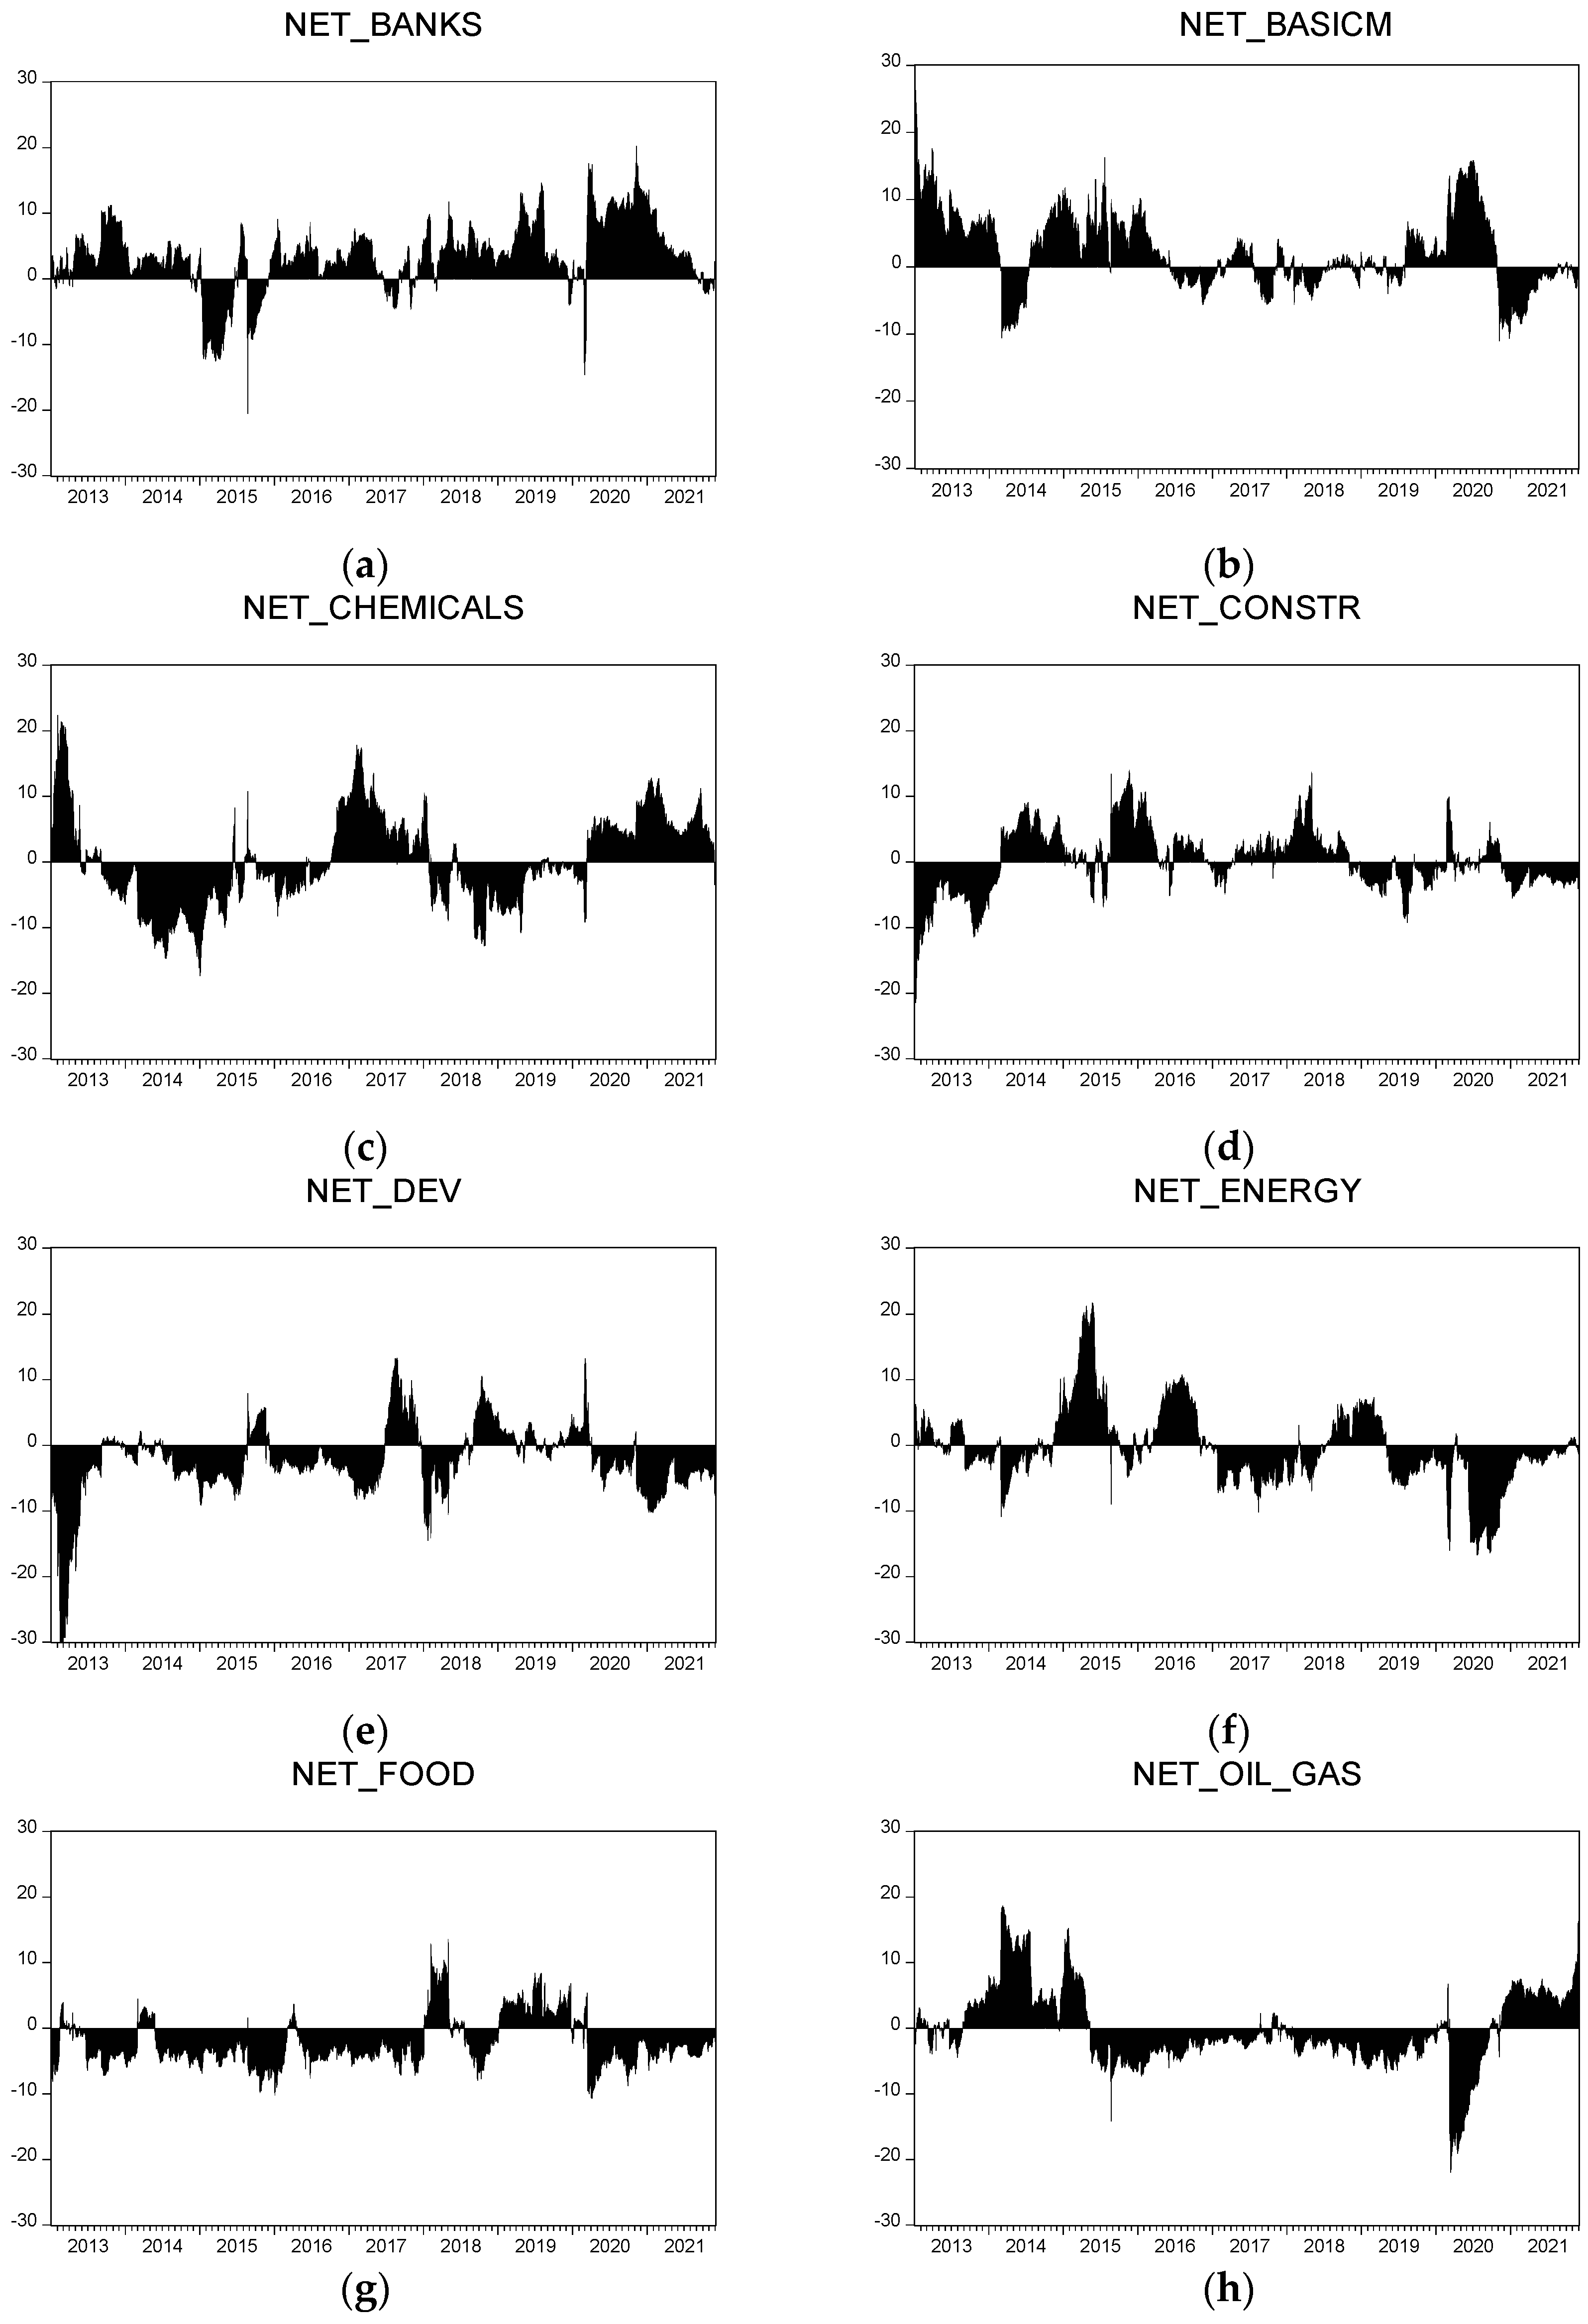
Figure 5 shows the evolution of volatility spillover both from one sector to all sectors in the network (TO) as well as from all sectors to a single sector (FROM). Based on this graphical representation we observe the variation in volatility spillover over time. In the case of the banking sector, during almost all the time intervals studied, it is observed that the spillover to all other sectors (TO) is higher than the spillover received from all other sectors (FROM). The basic materials sector can also fit into the same pattern. This result is more clearly presented in Figure 6, which shows a net volatility spillover for all sectors in the Polish stock market. Although the chemicals sector has, overall, a net spillover, similar to the banks and basic materials sectors, we observe distinct periods in which this sector either has a net spillover or is a net receiver. During the COVID-19 pandemic period, although the banks, chemicals and basic materials sectors have net volatility spillovers, the basic materials sector initially had (in 2020) a net volatility spillover and then (in 2021) became a net receiver of volatility. The same situation of spillover effects changing during the pandemic is found in the case of the oil and gas sector: in 2020, it was a net receiver and in 2021, it had a net volatility spillover.
In the other sectors, the periods when they were net receivers alternated with periods when they had net volatility spillovers. During the pandemic period, these sectors were also net receivers of volatility, except for the construction sector for which there was a small period of time in mid-2020 when it had a net spillover.
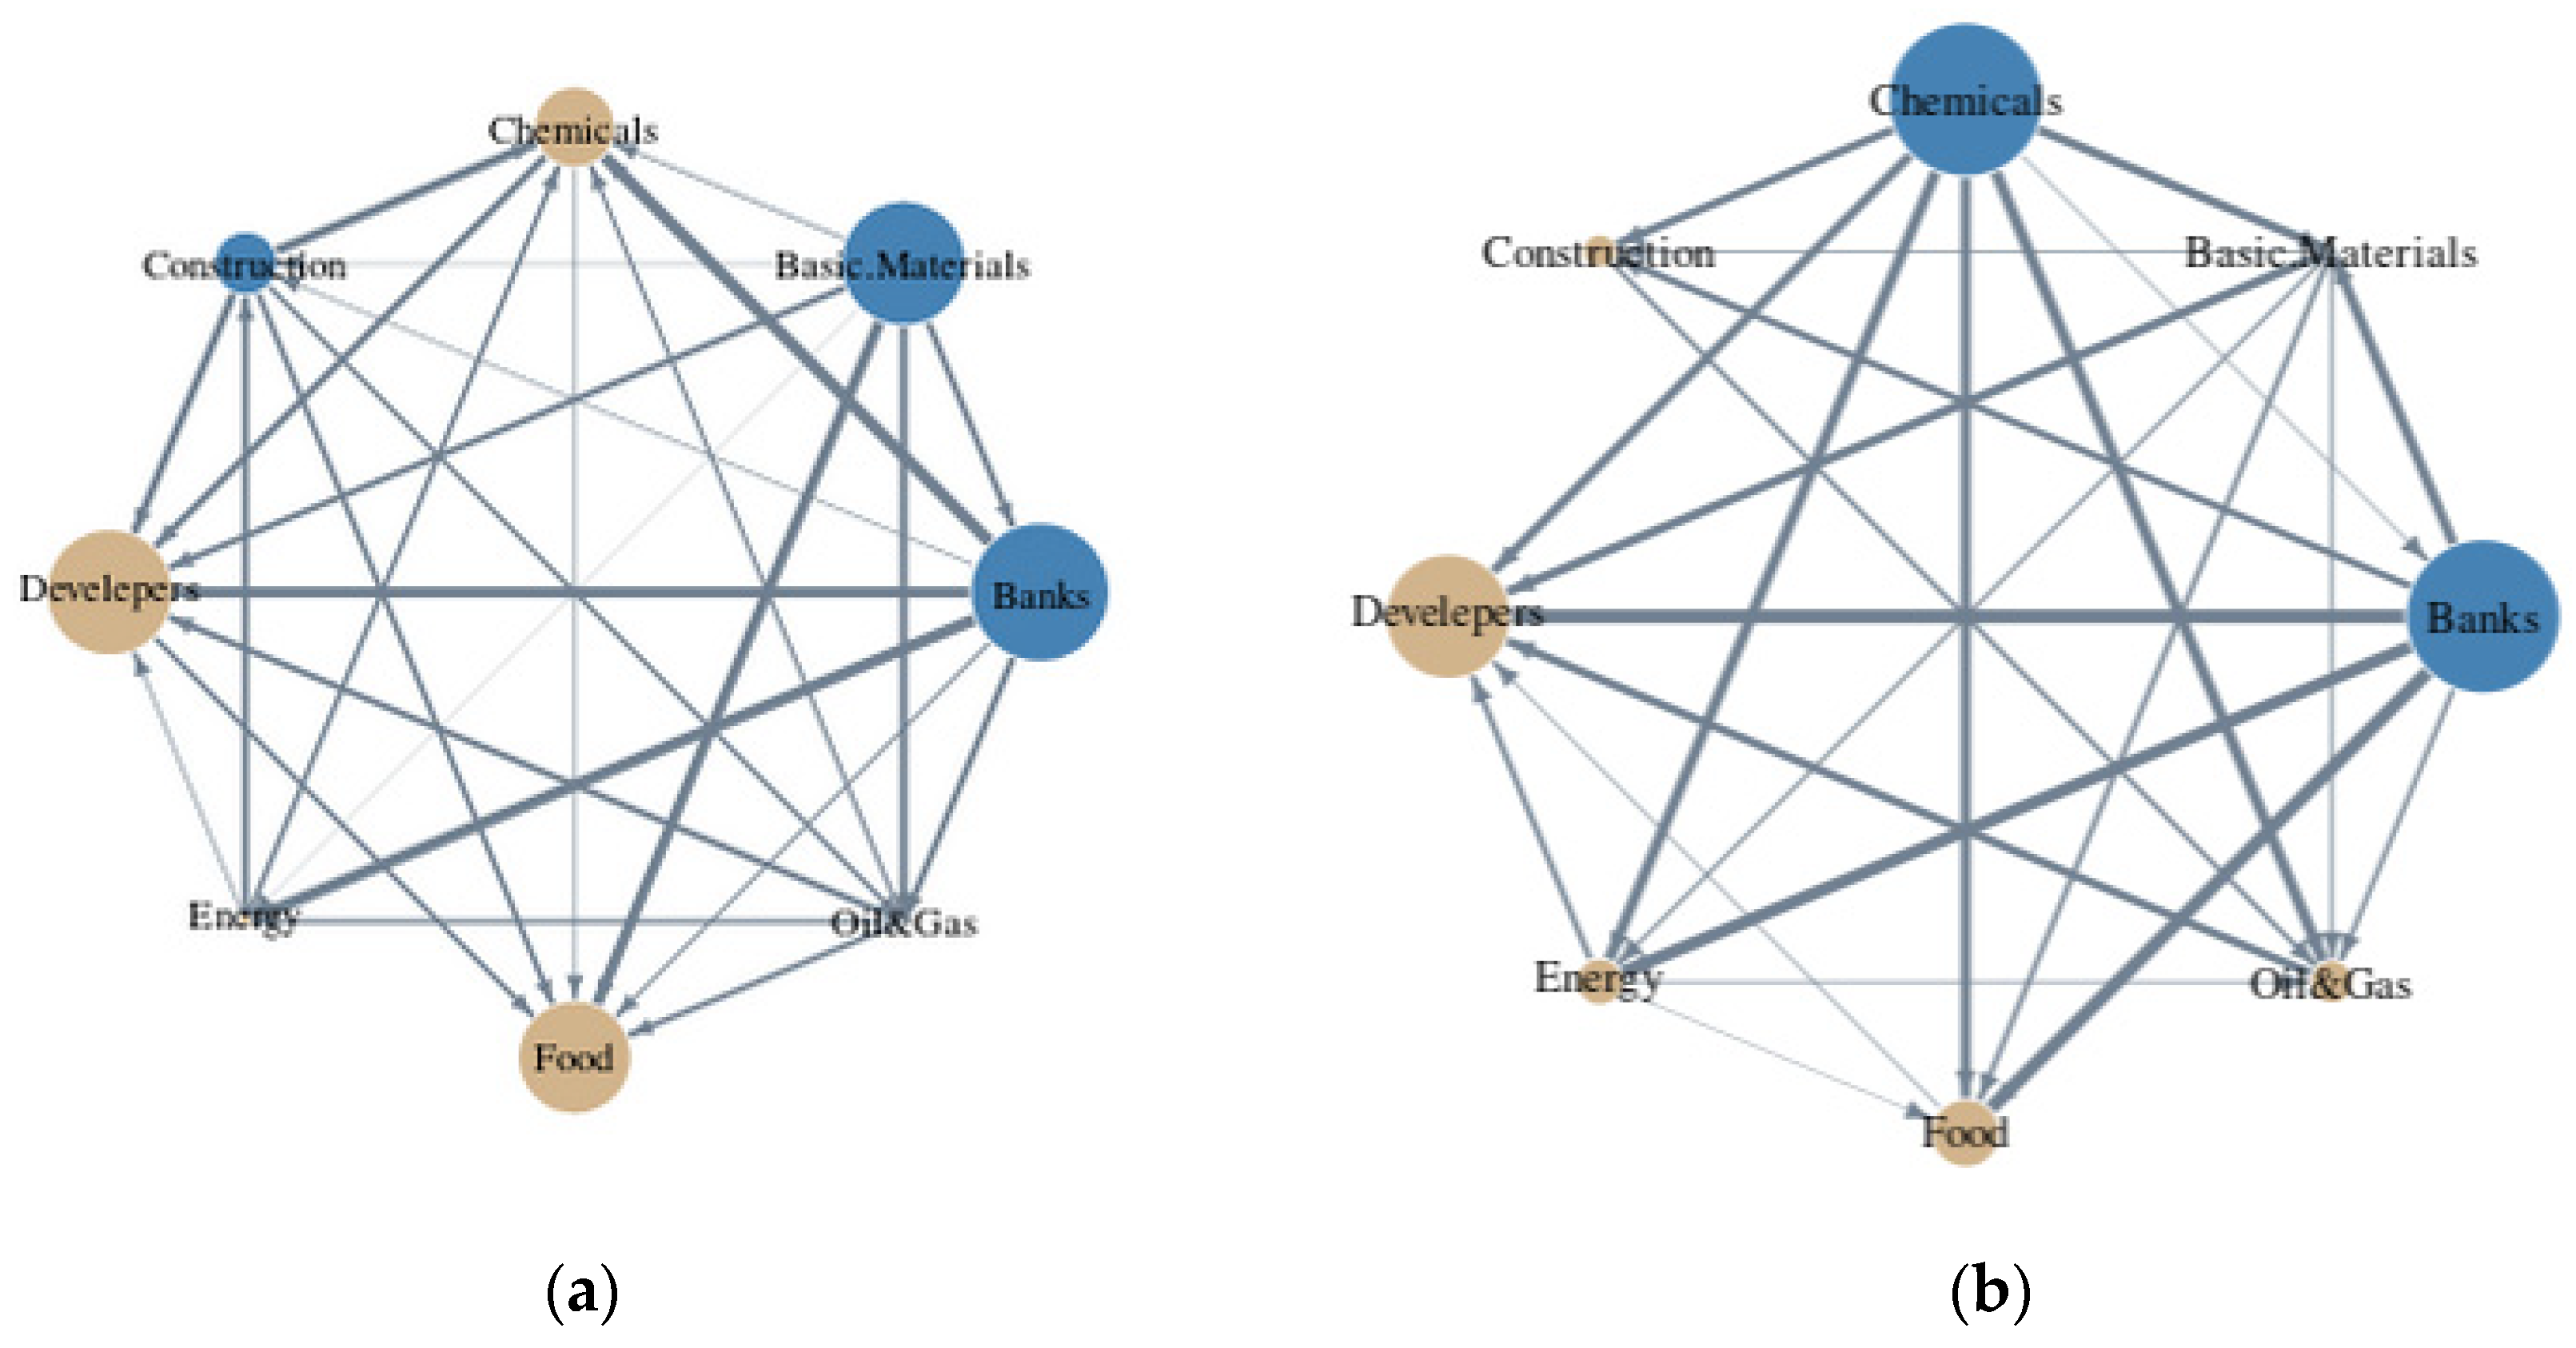
Figure 7 shows all net pairwise directional connectedness between the eight equity sectors on the Polish stock market. For each sector, the colours of the circles represent the nature of the sector, and the size of the circles represents the size of the spillover. The blue or dark grey colour shows us the sectors with volatility spillovers and the yellow or light grey colour shows us sectors that are net volatility receivers. The direction of the arrows indicates the direction of the volatility spillover and the thickness of the arrows indicates the size of the net spillover. Figure 7a shows the results obtained on the volatility spillovers between sectors before the pandemic and Figure 7b shows the results obtained during the pandemic.
The banking sector had the largest net volatility spillover followed closely by the basic materials sector. This result is in line with the one obtained by Costa et al. (2021), according to which the financial sector was the main sector with volatility spillover in the US during the COVID-19 period. At the same time, Akhtaruzzaman et al. (2020) confirmed a stronger spillover of financial companies in comparison with the non-financial ones.
In the same category, for the pre-pandemic period, we can also include the construction and oil and gas sectors but with a much lower net spillover. The net spillover was higher from the banking sector to the energy, developer and chemical sectors. From the basic materials sector, the net spillover was higher than in the food sector. In addition, it can be seen that there were net spillovers from almost all sectors to the food and developer sectors. The largest sector receiving volatility was the developer sector, followed by the food, chemicals and energy sectors.
The situation changed during the pandemic during which we observed only two sectors with net volatility spillovers of the same intensity: banks and basic materials. Although there were more sectors receiving volatility compared to the pre-pandemic situation, the developer sector remained a receiver of volatility from most sectors, whereas the food sector received less volatility. There was also an increase in net spillover from the banking sector to the construction and food sectors. The results presented confirm hypothesis H1, according to which the direction of the connectedness between economic sectors varies over time.
6. Conclusions, Limits of the Research and Future Directions
The plans for the development of a country’s economic sectors must also take into account the connectedness between them. The study of the connectedness between the economic sectors of Poland allows us, on one hand, to strengthen policy makers’ decisions and, on the other hand, to strengthen the management of financial investment portfolios.
This research presents new results on the connectedness and volatility spillover between stock market sectors in Poland. To the best of our knowledge, this is the only study with this objective conducted for a Central and Eastern European country. The methodology used is the one proposed by Antonakakis et al. (2020), which has multiple advantages compared to the method originally proposed by Diebold and Yilmaz (2008).
For this research, the daily data of the sectoral indices from 1 January 2013 to 2 December 2021 were used. The time interval chosen for the analysis allowed the comparative study of volatility spillover between sectors before the outbreak of the COVID-19 pandemic and during the pandemic. The methodology used allowed a static as well as a dynamic comparative analysis. This methodology also allowed for comparisons to be made in regard to the level of spillover between stock market sectors from other countries.
Static analysis of volatility spillover between the sectors of the Polish stock market and thus the connectedness between sectors shows a lower level before the COVID-19 pandemic than during the pandemic. The result suggests both the variation in time of the connectedness, which confirms research hypothesis H1 and also a higher level during the COVID-19 crisis, thus confirming research hypothesis H2. The dynamic analysis also underlines the fact that the sector with the highest volatility spillover is the banking sector, which confirms research hypothesis H3, i.e., that the financial sector has the strongest connectedness with the other economic sectors. The analysis of time-varying volatility spillover confirms the variation in the connectedness between sectors, confirming research hypothesis H1. In addition, the connectedness between sectors changes direction during the pandemic; for example, the chemical sector became a sector with volatility spillover although it was previously a volatility receiver, confirming research hypothesis H1.
The results indicate an increase in volatility spillover in the system consisting of the Polish stock market sectors. The implications of these results would be that the advantages of sectoral diversification in times of crisis become smaller. When making practical decisions, risk managers need to take into account the strongest connectedness between sectors and adjust portfolio diversification by considering sectors with weak or very weak connectedness. Thus, investors, based on the knowledge of the dynamics performed following this research, can adjust their transactional decisions in order to mitigate the risks, optimize the returns and ensure diversification during stock exchange turbulences.
In this way, policymakers can also identify which sectors are those with the largest volatility spillovers and which are the largest volatility receivers. Identifying these sectors enables the design of macroprudential policies that will have the effect of reducing volatility spillover. Identifying the increase in volatility spillover also makes it possible to anticipate the outbreak of a crisis or a turbulent period; thus, it is a tool that can be used to forecast and monitor the outbreak of financial crises. Therefore, the results of this research highlight the limitations of the advantages of sectoral diversification and the need for risk management and portfolio allocation. In order to ensure the stability of the Polish stock market, it is also necessary to carefully monitor the volatility spillover among the economic sectors. Specifically, follow-up measures are needed in the banking, chemicals as well as in the basic materials sectors for the stability of the Polish stock market. Governmental decisions adapted to each sector, beyond a fiscal approach, are required. This approach is suggested by the research conducted by Bouri et al. (2021a) who indicate different effects on the sectors of the stock markets following the governmental decisions taken in New Zealand.
A limitation of this research is the lack of possible comparisons with Central and Eastern European countries. This is partly due to the fact that there is no research on this group of countries and partly because no sectoral indices are available in other Central and Eastern European countries.
This research also offers a new research direction, i.e., studying the connectedness of Polish economic sectors with those of EU member countries. The result obtained would allow for identifying the connectedness between the same economic sectors from different countries.
Funding
This research received no external funding.
Institutional Review Board Statement
Not applicable.
Data Availability Statement
Not applicable.
Acknowledgments
The author is thankful to the Romanian Ministry of Research, Innovation and Digitization for financial support within Program 1, Development of the national RD system, and Subprogram 1.2, Institutional Performance: RDI excellence funding projects, contract no.11PFE/30.12.2021. The authors would like to thank the two anonymous reviewers whose comments helped to improve and clarify this manuscript.
Conflicts of Interest
The author declares no conflict of interest. The funders had no role in the design of the study; in the collection, analyses, or interpretation of data; in the writing of the manuscript; or in the decision to publish the results.
References
- Akhtaruzzaman, Md, Sabri Boubaker, and Ahmet Sensoy. 2020. Financial contagion during COVID-19 crisis. Finance Research Letters 38: 101604. [Google Scholar] [CrossRef] [PubMed]
- Andrieș, Alin-Marius, and Elena Galasan. 2020. Measuring Financial Contagion and Spillover Effects with a State Dependent Sensitivity Value-at-Risk Model. Risks 8: 5. [Google Scholar] [CrossRef] [Green Version]
- Antonakakis, Nikolaos, Ioannis Chatziantoniou, and David Gabauer. 2020. Refined Measures of Dynamic Connectedness based on Time-Varying Parameter Vector Autoregressions. Journal of Risk and Financial Management 13: 84. [Google Scholar] [CrossRef]
- Antonakakis, Nikolaos, Juncal Cunado, George Filis, David Gabauer, and Fernando Perez de Gracia. 2018. Oil volatility, oil and gas firms and portfolio diversification. Energy Economics 70: 499–515. [Google Scholar] [CrossRef] [Green Version]
- Boțoc, Claudiu, and Sorin Gabriel Anton. 2020. New empirical evidence on CEE’s stock markets integration. The World Economy 43: 2785–802. [Google Scholar] [CrossRef]
- Bouri, Elie, Muhammad Abubakr Naeem, Safwan Mohd Nor, Imen Mbarki, and Tareq Saeed. 2021a. Government responses to COVID-19 and industry stock returns. Economic Research-Ekonomska Istraživanja, 1–24. [Google Scholar] [CrossRef]
- Bouri, Elie, Oguzhan Cepni, David Gabauer, and Rangan Gupta. 2021b. Return connectedness across asset classes around the COVID-19 outbreak. International Review of Financial Analysis 73: 101646. [Google Scholar] [CrossRef]
- Chakrabarty, Anindya, Anupam De, and Gautam Bandyopadhyay. 2015. A Wavelet-Based MRA-EDCC-GARCH Methodology for The Detection of News and Volatility Spillover Across Sectoral Indices: Evidence from The Indian Financial Market. Global Business Review 16: 35–49. [Google Scholar] [CrossRef]
- Chatziantoniou, Ioannis, David Gabauer, and Hardik A. Marfatia. 2020. Dynamic connectedness and spillovers across sectors: Evidence from the Indian stock market. Scottish Journal of Political Economy 69: 283–300. [Google Scholar] [CrossRef]
- Chirilă, Viorica, Ciprian-Ionel Turturean, and Ciprian Chirilă. 2015. Volatility spillovers between Eastern European and Euro Zone stock market. Transformations in Business & Economics 14: 464–77. Available online: http://www.transformations.knf.vu.lt/35a/article/vola (accessed on 24 January 2016).
- Choi, Ki-Hong, Ron P. McIver, Salvatore Ferraro, Lei Xu, and Sang Hoon Kang. 2021. Dynamic volatility spillover and network connectedness across ASX sector markets. Journal of Economics and Finance 45: 677–91. [Google Scholar] [CrossRef]
- Corbet, Shaen, John W. Goodell, and Samet Günay. 2020. Co-movements and spillovers of oil and renewable firms under extreme conditions: New evidence from negative WTI prices during COVID-19. Energy Economics 92: 104978. [Google Scholar] [CrossRef] [PubMed]
- Costa, Antonio, Paulo Matos, and Cristiano da Silva. 2021. Sectoral connectedness: New evidence from US stock market during COVID-19 pandemics. Finance Research Letters 45: 102124. [Google Scholar] [CrossRef] [PubMed]
- Dickey, David A., and Wayne A. Fuller. 1979. Distribution of the Estimators for Autoregressive Time Series with a Unit Root. Journal of the American Statistical Association 74: 427–31. [Google Scholar] [CrossRef]
- Diebold, Francis X., and Kamil Yilmaz. 2008. Measuring financial asset return and volatility spillovers, with application to global equity markets. The Economic Journal 119: 158–71. [Google Scholar] [CrossRef] [Green Version]
- Diebold, Francis X., and Kamil Yilmaz. 2012. Better to give than to receive: Predictive directional measurement of volatility spillovers. International Journal of Forecasting 28: 57–66. [Google Scholar] [CrossRef] [Green Version]
- Diebold, Francis X., and Kamil Yilmaz. 2014. On the network topology of variance decompositions: Measuring the connectedness of financial firms. Journal of Econometrics 182: 119–34. [Google Scholar] [CrossRef] [Green Version]
- Elliott, Graham, Thomas J. Rothenberg, and James H. Stock. 1996. Efficient tests for an autoregressive unit root. Econometrica 64: 813–36. [Google Scholar] [CrossRef] [Green Version]
- Fasanya, Ismail O., Oluwatomisin Oyewole, Oluwasegun B. Adekoya, and Jones Odei-Mensah. 2021. Dynamic spillovers and connectedness between COVID-19 pandemic and global foreign exchange markets. Economic Research-Ekonomska Istraživanja 34: 2059–84. [Google Scholar] [CrossRef]
- Gabauer, David. 2021. Dynamic measures of asymmetric & pairwise spillovers within an optimal currency area: Evidence from the ERM I system. Journal of Multinational Financial Management 60: 100680. [Google Scholar] [CrossRef]
- Hassan, Syed Aun, and Farooq Malik. 2007. Multivariate GARCH Modeling of Sector Volatility Transmission. The Quarterly Review of Economics and Finance 47: 470–80. [Google Scholar] [CrossRef]
- Havlik, Peter. 2003. Transition Countries in 2003; Reforms and Restructuring Keep the Global Economic Slowdown at Bay. Working Paper. Vienna: Vienna Institute for International Economic Studies, p. 297. Available online: https://www.econstor.eu/handle/10419/204069 (accessed on 2 January 2022).
- Koop, Gary, Hashem M. Pesaran, and Simon M. Potter. 1996. Impulse response analysis in nonlinear multivariate models. Journal of Econometrics 74: 119–47. [Google Scholar] [CrossRef]
- Kouki, Imen, Nizar Harrathi, and Mahfuzul Haque. 2011. A Volatility Spillover Among Sector Index of International Stock Markets. Journal of Money, Investment and Banking 22: 32–45. Available online: https://fac.ksu.edu.sa/sites/default/files/a_volatility_spillover_among_index_sector_of_international_stock_markets.pdf (accessed on 2 January 2022).
- Le, Trung Hai, Hung Xuan Do, Duc Khuong Nguyen, and Ahmet Sensoy. 2021. COVID-19 pandemic and tail-dependency networks of financial assets. Finance Research Letters 38: 101800. [Google Scholar] [CrossRef] [PubMed]
- Li, Hong, and Ewa Majerowska. 2008. Testing stock market linkages for Poland and Hungary: A multivariate GARCH approach. Research in International Business and Finance 22: 247–66. [Google Scholar] [CrossRef]
- Liu, Pan, Gabriel J. Power, and Dmitry Vedenov. 2021. Fair-weather Friends? Sector-specific volatility connectedness and transmission. International Review of Economics & Finance 76: 712–36. [Google Scholar] [CrossRef]
- Lupu, Radu, Adrian Cantemir Călin, Cristina Georgiana Zeldea, and Iulia Lupu. 2021. Systemic Risk Spillovers in the European Energy Sector. Energies 14: 6410. [Google Scholar] [CrossRef]
- Lupu, Radu, and Iulia Lupu. 2009. Contagion across Central and Eastern European Stock Markets: A Dynamic Conditional Correlation Test. Economic Computation and Economic Cybernetics Studies and Research 43: 173–86. [Google Scholar]
- Malinowska, Anna P. 2021. Corporate Profits and Investment in Light of Institutional and Stock Market Turmoil: New Evidence from the Warsaw Stock Exchange. Journal of Economic Issues 55: 14–37. [Google Scholar] [CrossRef]
- Mensi, Walid, Ramzi Nekhili, Ramzi Nekhili, Tahir Suleman, and Sang Hoon Kang. 2021. Asymmetric volatility connectedness among U.S. stock sectors. North American Journal of Economics and Finance 56: 101327. [Google Scholar] [CrossRef]
- Ngene, Geoffrey M. 2021. What drives dynamic connectedness of the U.S equity sectors during different business cycles? The North American Journal of Economics and Finance 58: 101493. [Google Scholar] [CrossRef]
- Perron, Pierre. 1989. The great crash, the oil price shock and the unit root hypothesis. Econometrica 57: 1361–401. [Google Scholar] [CrossRef]
- Pesaran, Hashem H., and Yongcheol Shin. 1998. Generalized impulse response analysis in linear multivariate models. Economics Letters 58: 17–29. [Google Scholar] [CrossRef]
- Phillips, Peter C. B., and Pierre Perron. 1988. Testing for a Unit Root in Time Series Regression. Biometrika 75: 335–46. [Google Scholar] [CrossRef]
- Scheicher, Martin. 2001. The comovements of stock markets in Hungary Poland and the Czech Republic. International Journal of Finance and Economics 6: 27–39. Available online: https://onlinelibrary.wiley.com/doi/pdf/10.1002/ijfe.141?casa_token=tZHcKngUQL8AAAAA:LRPiL9wSCYcYZqRvo1o5H10Y-xZj09Xn_ud_hvuB_7TMOw_DgWEU6FUf_UOA0S3qHAYaWXSxDG_TtHs (accessed on 2 January 2022). [CrossRef]
- Shahzad, Syed Jawad Hussain, Elie Bouri, Ladislav Kristoufek, and Tared Saeed. 2021a. Impact of the COVID-19 outbreak on the US equity sectors: Evidence from quantile return spillovers. Financial Innovation 7: 1–23. [Google Scholar] [CrossRef] [PubMed]
- Shahzad, Syed Jawad Hussain, Muhammad Abubakr Naeem, Zhe Peng, and Elie Bouri. 2021b. Asymmetric volatility spillover among Chinese sectors during COVID-19. International Review of Financial Analysis 75: 101754. [Google Scholar] [CrossRef]
- Škrinjarić, Tihana. 2019. Stock market stability on selected CEE and SEE markets: A quantile regression approach. Post-Communist Economies 32: 352e375. [Google Scholar] [CrossRef]
- Škrinjarić, Tihana, and Boško Šego. 2020. Risk connectedness of selected CESEE stock markets: A spillover index approach. China Finance Review International 10: 447–72. [Google Scholar] [CrossRef]
- Spulbar, Cristi, Jatin Trivedi, and Ramona Birau. 2020. Investigating abnormal volatility transmission patterns between emerging and developed stock markets: A case study. Journal of Business Economics and Management 21: 1561–92. [Google Scholar] [CrossRef]
- Sucháček, Jan, Jaroslav Koutský, Lorena Caridad Lopéz del Río, and Petr Seďa. 2021. Econometric Analysis of Integration of Selected New EU Member CEE Stock Markets with Global Stock Market and Eurozone: Impact of Global Financial Crisis. Amfiteatru Economic 23: 824–42. [Google Scholar]
- Syriopoulos, Theodore. 2007. Dynamic linkages between emerging European and developed stock markets: Has the EMU any impact? International Review of Financial Analysis 16: 41–60. [Google Scholar] [CrossRef]
- Wu, Fei, Dayong Zhang, and Zhiwei Zhang. 2019. Connectedness and risk spillovers in China’s stock market. A sectoral analysis. Economic Systems 43: 100718. [Google Scholar] [CrossRef]
- Yao, Yi, Lixin Tian, and Guangxi Cao. 2022. The Information Spillover among the Carbon Market, Energy Market, and Stock Market: A Case Study of China’s Pilot Carbon Markets. Sustainability 14: 4479. [Google Scholar] [CrossRef]
Figure 1.
The evolution of the number of listed stocks and the capitalization of the stock market in Poland. Note: Performed by the authors based on the data from the Polish stock market (www.gpw.pl, accessed on 14 June 2022).
Figure 1.
The evolution of the number of listed stocks and the capitalization of the stock market in Poland. Note: Performed by the authors based on the data from the Polish stock market (www.gpw.pl, accessed on 14 June 2022).

Figure 2.
The structure of the market capitalization of the Polish stock market according to different sectors. Source: Data processed by the authors are from www.investing.com (accessed on 14 June 2022).
Figure 2.
The structure of the market capitalization of the Polish stock market according to different sectors. Source: Data processed by the authors are from www.investing.com (accessed on 14 June 2022).

Figure 3.
Return and volatility evolution of equity sectors on the Polish stock market from 1 January 2013 to 2 December 2021. Note: (a) LR_BK, P_BK (b) LR_BM, P_BM (c) LR_CHE, P_CHE (d) LR_CO, P_CO (e) LR_DE, P_DE (f) LR_EN, P_EN (g) LR_FOOD, P_FOOD (h) LR_OG, P_OG represent the returns as well as the values of the sectoral indices of banks, basic materials, chemicals, construction, developers, energy, food, and oil and gas, respectively.


Figure 4.
Total volatility spillovers of equity sectors listed on the Polish stock market in the period 1 January 2013–2 December 2021.
Figure 4.
Total volatility spillovers of equity sectors listed on the Polish stock market in the period 1 January 2013–2 December 2021.

Figure 5.
Directional total spillovers from one sector to all sectors (FROM) and from all sectors to a single sector (TO) on the Polish stock market in the period of 1 January 2013–2 December 2021. Note: (a) Banks (b) Basicm, (c) Chemic, (d) Constr, (e) Dev, (f) Energy, (g) Food and (h) Oil_Gas represent the sectors banks, basic materials, chemicals, construction, developers, energy, food, and oil and gas, respectively. The results were obtained by the authors.

Figure 6.
Net volatility spillovers for sectors in the Polish stock market in the period 1 January 2013–2 December 2021. Note: (a) Banks (b) Basicm, (c) Chemic, (d) Constr, (e) Dev, (f) Energy, (g) Food and (h) Oil_Gas represent the sectors banks, basic materials, chemicals, construction, developers, energy, food, and oil and gas, respectively. The results were obtained by the authors.

Figure 7.
Net volatility spillovers between pairs of sectors in the Polish stock market. (a) In the period of 1 January 2013–31 December 2019 (before the crisis caused by the outbreak of COVID-19); (b) in the period of 1 January 2020–2 December 2021 (during the crisis caused by the outbreak of COVID-19).


Table 1.
Indicators of the descriptive statistics of volatility for the period of 1 January 2013–31 December 2019.
Table 1.
Indicators of the descriptive statistics of volatility for the period of 1 January 2013–31 December 2019.
| Banks | Basic Materials | Chemicals | Construction | Developers | Energy | Food | Oil and Gas | |
|---|---|---|---|---|---|---|---|---|
| Mean | 0.009031 | 0.013779 | 0.011371 | 0.007420 | 0.005962 | 0.010875 | 0.008590 | 0.011226 |
| Median | 0.006854 | 0.010157 | 0.008710 | 0.005549 | 0.004714 | 0.008481 | 0.006492 | 0.008866 |
| Maximum | 0.061566 | 0.160636 | 0.079919 | 0.065477 | 0.056232 | 0.061967 | 0.118438 | 0.086895 |
| Minimum | 0.000000 | 0.000000 | 0.000000 | 0.000000 | 0.000000 | 0.000000 | 0.000000 | 0.000000 |
| Std. Dev. | 0.008267 | 0.013096 | 0.010241 | 0.007113 | 0.005524 | 0.009890 | 0.008530 | 0.009978 |
| Skewness | 1.738258 | 2.126018 | 1.567026 | 2.030536 | 2.145123 | 1.520350 | 2.798026 | 1.462297 |
| Kurtosis | 7.801244 | 13.85961 | 6.597816 | 10.25165 | 11.96698 | 5.953097 | 22.44751 | 6.479028 |
| Jarque-Bera | 2671.9 *** | 10342.5 *** | 1731.2 *** | 5252.8 *** | 7513.9 *** | 1366.2 *** | 31140 *** | 1570 *** |
| ADF | −39.38 *** | −16.66 *** | −20.93 *** | −36.41 *** | −39.04 *** | −39.82 *** | −25.53 *** | −39.56 *** |
| PP | −41.82 *** | −44.36 *** | −39.70 *** | −37.18 *** | −40.02 *** | −40.54 *** | −37.98 *** | −39.78 *** |
| ADF-breaks | −40.18 *** | −39.53 *** | −38.09 *** | −37.39 *** | −40.13 *** | −40.43 *** | −37.22 *** | −40.57 *** |
| ERS | −26.25 *** | −15.84 *** | −4.47 *** | −10.10 *** | −17.63 *** | −3.90 *** | −24.55 *** | −2.70 *** |
Note: *** Significant at 1%. Results obtained by the authors. ADF—Augmented Dickey–Fuller unit root test (Dickey and Fuller 1979); PP—Phillips–Perron unit root test (Phillips and Perron 1988); ADF breaks—Augmented Dickey–Fuller unit root test with breaks (Perron 1989); ERS—Elliott et al.’s (1996) unit root test.
Table 2.
Indicators of the descriptive statistics of volatility for the period of 1 January 2020–2 December 2021.
Table 2.
Indicators of the descriptive statistics of volatility for the period of 1 January 2020–2 December 2021.
| Banks | Basic Materials | Chemicals | Construction | Developers | Energy | Food | Oil and Gas | |
|---|---|---|---|---|---|---|---|---|
| Mean | 0.015299 | 0.020891 | 0.014846 | 0.009974 | 0.008627 | 0.017521 | 0.011141 | 0.014940 |
| Median | 0.010095 | 0.015193 | 0.010579 | 0.006617 | 0.005914 | 0.012036 | 0.007287 | 0.010461 |
| Maximum | 0.164290 | 0.171688 | 0.122926 | 0.072110 | 0.078906 | 0.147943 | 0.118241 | 0.114225 |
| Minimum | 0.000000 | 0.000000 | 0.000000 | 0.000000 | 0.000000 | 0.000000 | 0.000000 | 0.000000 |
| Std. Dev. | 0.016730 | 0.019978 | 0.015509 | 0.010427 | 0.009391 | 0.018946 | 0.012789 | 0.014735 |
| Skewness | 2.873488 | 2.116500 | 2.354047 | 2.196099 | 2.518805 | 2.569548 | 3.282151 | 2.157256 |
| Kurtosis | 18.18831 | 11.06158 | 11.58403 | 10.05637 | 13.09189 | 12.84583 | 21.02143 | 10.33848 |
| Jarque-Bera | 5515.9 *** | 1734.1 *** | 2004.8 *** | 1445 *** | 2661 *** | 2580 *** | 7694.4 *** | 1515.7 *** |
| ADF | −6.49 *** | −8.07 *** | −10.09 *** | −19.97 *** | −19.81 *** | −8.26 *** | −8.99 *** | −17.98 *** |
| PP | −20.71 *** | −22.68 *** | −22.16 *** | −20.44 *** | −21.26 *** | −21.79 *** | −18.51 *** | −20.02 *** |
| ADF-breaks | −19.41 *** | −23.48 *** | −22.95 *** | −21.15 *** | −21.18 *** | −22.34 *** | −17.48 *** | −19.12 *** |
| ERS | −4.45 *** | −3.92 *** | −3.66 *** | −7.19 *** | −4.69 *** | −3.57 *** | −7.23 *** | −3.83 *** |
Note: *** Significant at 1%. Results obtained by the authors. ADF—Augmented Dickey–Fuller unit root test (Dickey and Fuller 1979); PP—Phillips–Perron unit root test (Phillips and Perron 1988); ADF breaks—Augmented Dickey–Fuller unit root test with breaks (Perron 1989); ERS—Elliott et al.’s (1996) unit root test.
Table 3.
Estimation of the Spearman correlation coefficient between the volatilities of stock market sectors in Poland in the period of 1 January 2013–31 December 2019.
Table 3.
Estimation of the Spearman correlation coefficient between the volatilities of stock market sectors in Poland in the period of 1 January 2013–31 December 2019.
| Banks | Basic Materials | Chemicals | Construction | Developers | Energy | Food | Oil and Gas | |
|---|---|---|---|---|---|---|---|---|
| Banks | 1.000 | |||||||
| Basic Materials | 0.320 | 1.000 | ||||||
| Chemicals | 0.274 | 0.210 | 1.000 | |||||
| Construction | 0.246 | 0.194 | 0.223 | 1.000 | ||||
| Developers | 0.203 | 0.179 | 0.240 | 0.238 | 1.000 | |||
| Energy | 0.308 | 0.259 | 0.272 | 0.224 | 0.201 | 1.000 | ||
| Food | 0.173 | 0.167 | 0.203 | 0.220 | 0.191 | 0.157 | 1.000 | |
| Oil and Gas | 0.303 | 0.234 | 0.223 | 0.213 | 0.164 | 0.213 | 0.185 | 1.000 |
Note: Results obtained by the authors.
Table 4.
Estimation of the Spearman correlation coefficient between the volatilities of the stock market sectors in Poland in the period of 1 January 2020–2 December 2021.
Table 4.
Estimation of the Spearman correlation coefficient between the volatilities of the stock market sectors in Poland in the period of 1 January 2020–2 December 2021.
| Banks | Basic Materials | Chemicals | Construction | Developers | Energy | Food | Oil and Gas | |
|---|---|---|---|---|---|---|---|---|
| Banks | 1.000 | |||||||
| Basic Materials | 0.307 | 1.000 | ||||||
| Chemicals | 0.327 | 0.292 | 1.000 | |||||
| Construction | 0.276 | 0.270 | 0.277 | 1.000 | ||||
| Developers | 0.325 | 0.212 | 0.320 | 0.234 | 1.000 | |||
| Energy | 0.364 | 0.256 | 0.370 | 0.261 | 0.256 | 1.000 | ||
| Food | 0.289 | 0.266 | 0.310 | 0.229 | 0.256 | 0.231 | 1.000 | |
| Oil and Gas | 0.415 | 0.323 | 0.368 | 0.267 | 0.290 | 0.356 | 0.312 | 1.000 |
Note: Results obtained by the authors.
Table 5.
Total volatility spillover for the period of 1 January 2013 to 31 December 2019.
| Banks | Basic Materials | Chemicals | Construction | Developers | Energy | Food | Oil and Gas | FROM Others | |
|---|---|---|---|---|---|---|---|---|---|
| Banks | 63.72 | 8.03 | 5.53 | 4.05 | 3.37 | 6.52 | 2.19 | 6.59 | 36.28 |
| Basic Materials | 7.71 | 68.76 | 4.06 | 3.42 | 2.73 | 5.82 | 3.15 | 4.35 | 31.24 |
| Chemicals | 6.15 | 4.18 | 68.14 | 4.93 | 4.33 | 5.32 | 2.84 | 4.12 | 31.86 |
| Construction | 4.15 | 3.48 | 4.46 | 71.42 | 4.64 | 3.36 | 4.44 | 4.04 | 28.58 |
| Developers | 3.90 | 3.06 | 4.70 | 5.05 | 72.99 | 3.43 | 3.80 | 3.08 | 27.01 |
| Energy | 7.11 | 5.86 | 5.06 | 3.03 | 3.32 | 70.39 | 1.76 | 3.47 | 29.61 |
| Food | 2.35 | 3.70 | 2.96 | 4.73 | 4.06 | 1.75 | 77.06 | 3.41 | 22.94 |
| Oil and Gas | 6.93 | 4.73 | 3.92 | 4.28 | 2.75 | 3.24 | 3.13 | 71.02 | 28.98 |
| TO others | 38.28 | 33.03 | 30.69 | 29.49 | 25.20 | 29.44 | 21.31 | 29.05 | 236.49 |
| Inc. own | 102.00 | 101.79 | 98.83 | 100.91 | 98.19 | 99.83 | 98.37 | 100.07 | TCI |
| NET | 2.00 | 1.79 | −1.17 | 0.91 | −1.81 | −0.17 | −1.63 | 0.07 | 29.56 |
| NPDC | 1.00 | 0.00 | 5.00 | 3.00 | 6.00 | 4.00 | 6.00 | 3.00 |
Note: Results obtained by the authors.
Table 6.
Total volatility spillover for the period of 1 January 2020–2 December 2021.
| Banks | Basic Materials | Chemicals | Construction | Developers | Energy | Food | Oil and Gas | FROM Others | |
|---|---|---|---|---|---|---|---|---|---|
| Banks | 42.80 | 7.56 | 10.12 | 5.75 | 6.87 | 7.89 | 6.38 | 12.63 | 57.20 |
| Basic Materials | 9.02 | 52.95 | 9.61 | 6.03 | 4.56 | 6.12 | 5.69 | 6.02 | 47.05 |
| Chemicals | 9.86 | 8.31 | 45.71 | 5.63 | 7.91 | 8.00 | 4.91 | 9.69 | 54.29 |
| Construction | 6.78 | 6.35 | 6.81 | 55.30 | 6.90 | 4.18 | 8.75 | 4.94 | 44.70 |
| Developers | 8.86 | 5.91 | 9.25 | 6.96 | 52.13 | 5.45 | 5.45 | 5.99 | 47.87 |
| Energy | 9.73 | 6.60 | 9.56 | 4.20 | 4.65 | 55.96 | 3.19 | 6.11 | 44.04 |
| Food | 8.37 | 6.42 | 6.33 | 8.65 | 5.17 | 3.36 | 56.05 | 5.65 | 43.95 |
| Oil and Gas | 13.29 | 6.44 | 11.30 | 5.59 | 4.77 | 6.38 | 5.71 | 46.51 | 53.49 |
| TO others | 65.90 | 47.59 | 62.98 | 42.81 | 40.82 | 41.37 | 40.07 | 51.04 | 392.59 |
| Inc. own | 108.70 | 100.54 | 108.69 | 98.11 | 92.96 | 97.34 | 96.12 | 97.55 | TCI |
| NET | 8.70 | 0.54 | 8.69 | −1.89 | −7.04 | −2.66 | −3.88 | −2.45 | 49.07 |
| NPDC | 1.00 | 2.00 | 0.00 | 4.00 | 7.00 | 4.00 | 4.00 | 6.00 |
Note: Results obtained by the authors.
Publisher’s Note: MDPI stays neutral with regard to jurisdictional claims in published maps and institutional affiliations. |
© 2022 by the author. Licensee MDPI, Basel, Switzerland. This article is an open access article distributed under the terms and conditions of the Creative Commons Attribution (CC BY) license (https://creativecommons.org/licenses/by/4.0/).
Share and Cite
MDPI and ACS Style
Chirilă, V. Connectedness between Sectors: The Case of the Polish Stock Market before and during COVID-19. J. Risk Financial Manag. 2022, 15, 322. https://doi.org/10.3390/jrfm15080322
AMA Style
Chirilă V. Connectedness between Sectors: The Case of the Polish Stock Market before and during COVID-19. Journal of Risk and Financial Management. 2022; 15(8):322. https://doi.org/10.3390/jrfm15080322
Chicago/Turabian StyleChirilă, Viorica. 2022. "Connectedness between Sectors: The Case of the Polish Stock Market before and during COVID-19" Journal of Risk and Financial Management 15, no. 8: 322. https://doi.org/10.3390/jrfm15080322