 Han Wang
 Xin Wang
 Teng Li
 Daoyuan Lai1
 Yan Dora Zhang
- 1Department of Statistics and Actuarial Science, The University of Hong Kong, Hong Kong SAR, China
- 2Department of Medical Oncology, National Cancer Center/National Clinical Research Center for Cancer/Cancer Hospital, Chinese Academy of Medical Sciences and Peking Union Medical College, Beijing, China
- 3Centre for PanorOmic Sciences, The University of Hong Kong, Hong Kong SAR, China
Given the considerable cost of drug discovery, drug repurposing is becoming attractive as it can effectively shorten the development timeline and reduce the development cost. However, most existing drug-repurposing methods omitted the heterogeneous health conditions of different COVID-19 patients. In this study, we evaluated the adverse effect (AE) profiles of 106 COVID-19 drugs. We extracted four AE signatures to characterize the AE distribution of 106 COVID-19 drugs by non-negative matrix factorization (NMF). By integrating the information from four distinct databases (AE, bioassay, chemical structure, and gene expression information), we predicted the AE profiles of 91 drugs with inadequate AE feedback. For each of the drug clusters, discriminant genes accounting for mechanisms of different AE signatures were identified by sparse linear discriminant analysis. Our findings can be divided into three parts. First, drugs abundant with AE-signature 1 (for example, remdesivir) should be taken with caution for patients with poor liver, renal, or cardiac functions, where the functional genes accumulate in the RHO GTPases Activate NADPH Oxidases pathway. Second, drugs featuring AE-signature 2 (for example, hydroxychloroquine) are unsuitable for patients with vascular disorders, with relevant genes enriched in signal transduction pathways. Third, drugs characterized by AE signatures 3 and 4 have relatively mild AEs. Our study showed that NMF and network-based frameworks contribute to more precise drug recommendations.
Introduction
The coronavirus disease 2019 (COVID-19) has swept the world for over 2 years. Although COVID-19 vaccines have made an indelible contribution to triumphing over the epidemic, it is not the silver bullet to end the pandemic. An increasing number of infected cases were reported even though they were fully vaccinated (i.e., the COVID-19 vaccine breakthrough infections) (CDC Covid-19 Vaccine Breakthrough Case Investigations Team, 2021). There is an urgent need to develop therapeutic drugs to fight against this pandemic.
Because traditional drug discovery methods are time consuming and expensive, the drug repurposing method is becoming an attractive option in the current urgent circumstance. Recently, many computational approaches have been developed to narrow down the search space of drugs to accelerate the process of drug repurposing against SARS-COV-2 (Gordon et al., 2020; Jang et al., 2021; Adhami et al., 2021; Guo et al., 2021; Gysi et al., 2021). Among them, the network-based approach accounts for a large proportion. Rintala et al. (2022) reviewed some representative drug repurposing results for COVID-19, which applied network proximity algorithms. Most of the existing computational methods have two main shortcomings. First, only one particular type of data was used in the drug repurposing procedure, which may limit the power to identify therapeutic candidates. Integrating multiple heterogeneous data sources would be more powerful. The other shortcoming is the so-called winner-takes-all pattern. Specifically, the selected repurposed drug may be recommended to all patients without taking the heterogeneous health conditions into account. In the era of precision medicine, it is normal to recommend specific drugs for patients with distinct underlying conditions, even though they are diagnosed with the same disease. To address the limitations of the winner-takes-all pattern in the existing drug repurposing scheme, predicting the drug’s heterogeneous safety levels with respect to the different health conditions of patients is essential.
From the perspective of drug safety, drugs repurposed for treating COVID-19 can be classified into two categories. The first category contains drugs that are still in or about to be in the stage of clinical trials. Because these drugs have not been used by COVID-19 patients on a large scale, their adverse effect (AE) feedback may be inadequate and the evaluation of drug safety remains unclear. In this case, it is more desirable to conduct computational methods to predict side effects for drugs in the clinical trial stage to save research time and cost. The prediction of drug side effects is usually based on drug–drug similarity through integrating multi-source data, including chemical structures, protein targets, and therapeutic indication (Wang et al., 2014; Zhang et al., 2016; Timilsina et al., 2019).
The second category involves drugs that have been approved by the World Health Organization (WHO) or drugs with relatively abundant post-market surveillance-reported AEs offered by COVID-19 patients. Jing et al. (2021) mined the AE information of several COVID-19 drugs using the FDA adverse events reporting system (FAERS) database, presenting the landscape of overreported AEs in each organ/system for each drug. Wu et al. (2020) explored the associations between COVID-19 drugs and 30 human tissues based on network proximity. Although it is more systematic to classify AEs into tissue level or system level, the biological process causing AEs might be cross organs or cross systems. Thus, it is more powerful to integrate different AEs and different drugs together to dig out a higher-level landscape of AEs, which can give us a comprehensive picture of drug safety and offer benefits for drug recommendation in precision medicine.
In this drug safety study, we conducted the AE profile for two different kinds of drugs: drugs with abundant AE information and drugs without abundant AE information. First, based on the relatively abundant AE information provided by FAERS, we proposed a non-negative matrix factorization (NMF) (Lee and Seung, 2000) framework for drugs that have already been used to treat COVID-19. Apart from extracting four AE signatures to depict each drug’s AE distribution, NMF also provided abundance fractions on the four AE signatures for each drug, which we refer to a characteristic combination of AEs as an AE-signature. The higher-level landscape of AEs represented by AE signatures can help us partition the whole COVID-19 patient cohort into four subpopulations, with each subpopulation more vulnerable to its corresponding AE signature. Therefore, we can conduct the precise drug recommendation by incorporating the AE signature’s abundance fraction for each drug.
Second, because COVID-19 drugs in the clinical trial stage lack AE feedback, we predicted their AE profiles to achieve more accurate personalized drug recommendations. Specifically, we
1) Constructed drug–drug similarity networks using data coming from multiple sources
2) Built a network imputation framework to tackle information imbalance among networks
3) Combined the integrated similarity network with drugs possessing a relatively affluent drug safety profile
We presented literature support and molecular-level explanations to illustrate the rationality of the AE prediction results.
Methods
Workflow
The workflow of our study is illustrated in Figure 1.
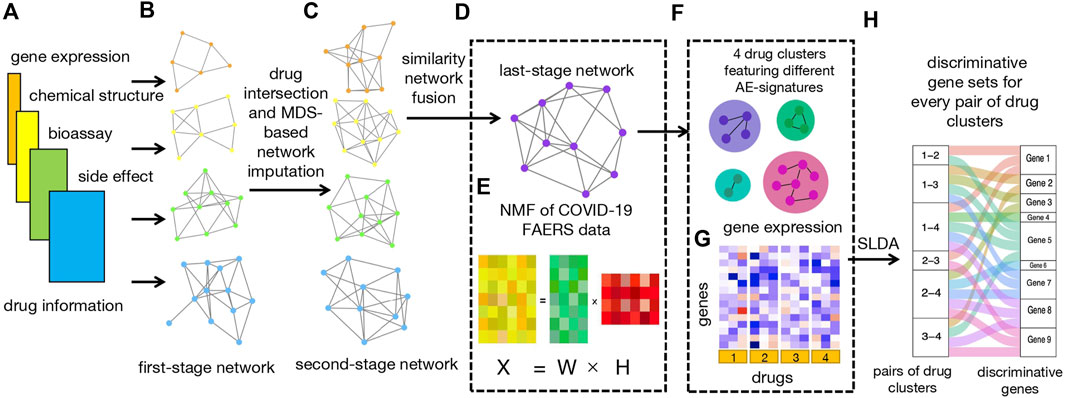
FIGURE 1. Workflow. (A) Four types of input data, including bioassay, chemical structure, LINCS, and FAERS data. (B) Construction of four first-stage networks based on four types of drug data. (C) Construction of four second-stage networks based on drug intersection and MDS-based network imputation. (D) Construction of last-stage network from similarity network fusion (SNF). (E) Non-negative matrix factorization (NMF) of count matrix from the CEUAFD;
First of all, we collected drugs that are in the current COVID-19 clinical trial stage (Pundi et al., 2020; Bugin and Woodcock, 2021) together with drugs from the COVID-19 Emergency Use Authorization FAERS database (CEUAFD), mined their information from four different datasets (encompassing AE, bioassay, chemical structure, and gene expression information), and constructed four first-stage drug–drug similarity networks accordingly (see Supplementary Material). For simplicity, we refer to COVID-19 drugs that emerged in the CEUAFD as CEUAFD drugs hereafter. Second, for drugs in the clinical trial stage, we only reserved drugs whose information was available among all four databases. For some CEUAFD drugs abundant in certain AE signatures, their information across all four databases may be incomplete. To leverage their informative AE feedback and tackle the information imbalance problem, we built an imputation method based on multi-dimensional scaling (MDS) (Cox and Cox, 2008) to patch up the information imbalance among data sources, forming four-dimension-consistent imputed second-stage networks. Third, we applied the similarity network fusion (SNF) method (Wang et al., 2014) to the four second-stage networks to obtain a final-stage integrated drug–drug similarity network (see Supplementary Material). At the same time, we conducted NMF to the CEUAFD drugs to extract four higher-level AE signatures and drugs’ abundance fractions on the deciphered AE signatures. Meanwhile, the dimension reduction of AEs and clustering of CEUAFD drugs can be achieved. Finally, based on the integrated similarity network and CEUAFD drugs’ clustering outcome from the NMF procedure, we obtained four drug clusters for all analyzed COVID-19 drugs, with each cluster featuring one specific AE signature. Precise recommendations for drugs in different clinical stages can be implemented subsequently (see Supplementary Material). To demonstrate the reliability of our predicted results, we performed extensive literature explorations and measured drug–tissue distances by taking a network proximity approach on the Genotype-Tissue Expression (GTEx) database (Lonsdale et al., 2013). For every pair of drug clusters among the four clusters, we conducted sparse linear discriminant analysis (SLDA) (Mai et al., 2012) to pick up genes with discriminant expression patterns. If there is a correspondence between discriminant genes and AE signatures for each pair of drug clusters, the rationality of our drug clustering results can be proved. Pathway enrichment analysis (see Supplementary Material) and gene function analysis revealed that the discriminant genes do have the ability to account for different AE signatures in each pair of drug clusters.
Network imputation
We found that drugs abundant with AE feedback may have insufficient information from other data sources (for example, multi-compound drugs casirivimab and imdevimab). To make full use of the AE information reported by COVID-19 patients and construct a more informative integrated drug–drug similarity network, we imputed similarity scores for the other three databases based on the FAERS data.
We took the bioassay database as an example to demonstrate the imputation process. Suppose the first-stage drug–drug similarity matrices constructed by FAERS and bioassay database are denoted by
To let the “lower-dimensional coordinate” of drugs preserve the similarity given by
where
If the
We introduce set
where
Non-negative matrix factorization of COVID-19 emergency use authorization FAERS database drugs
Suppose there are
where
We adopted the optimization algorithm given by Lee and Seung (2000) to get the factorized matrix
Clustering of CEUAFD drugs
Similar to the work of Brunet et al. (2004),
Tissue-specific genes in the GTEx database
For a specific tissue
For each tissue
Evaluation of the association between the drug and tissue
We evaluated the association between each drug and tissue using network proximity. Suppose for a specific drug
where
The significance of the association was calculated by the permutation test. Specifically, for each drug
One-sided Wilcoxon rank test
We grouped AEs using their System Organ Class (SOC) categories in Medical Dictionary for Regulatory Activities (MedDRA). For a specific SOC category, suppose it contained
Effect size of the association between the SOC category and AE signature
Apart from the one-sided Wilcoxon rank test, we also evaluated the association between SOC categories and AE signatures by calculating effect size (ES). Specifically, for a SOC category containing
Sparse linear discriminant analysis
We conducted SLDA (Mai et al., 2012) for each pair of drug clusters to pick up discriminant genes. Specifically, for a pair of drug clusters (
The discriminant genes were selected by solving the following l1 penalized least squares problem:
In practice, we used the R package TULIP to solve the abovementioned optimization problem. Because of the limited sample size, cross validation is not reliable in selecting a suitable
Results
AE-signature analysis for approved CEUAFD drugs
The CEUAFD collected from the beginning of the COVID-19 pandemic until September 2021 was downloaded for COVID-19 drug-related AE-signature analysis. We obtained 9,754 reports, corresponding with 15 drugs and 134 unique AE reports after the data-preprocessing procedures (see Supplementary Material). We then applied NMF to the drug-AE count matrix
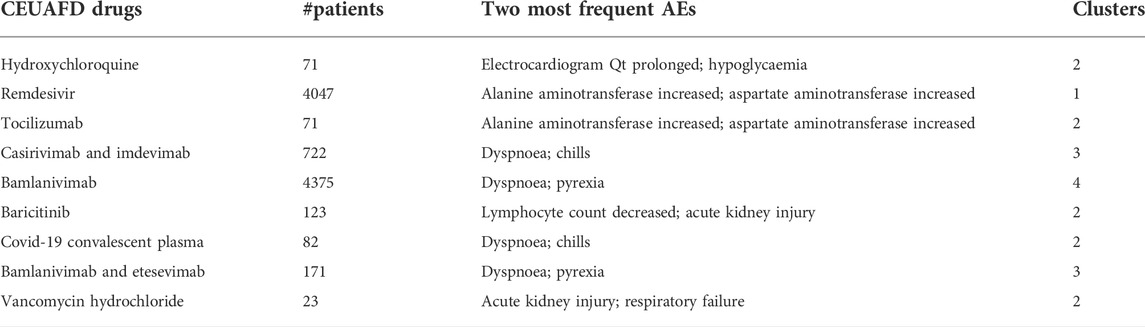
TABLE 1. Summary of nine CEUAFD drugs. Information on nine widely used CEUAFD drugs (more than 20 items of AE feedback in the CEUAFD by September 2021) is shown, including the number of patients taking one specific drug, the two most frequent AEs, and the cluster to which each drug was assigned.
To give a more general picture of each AE signature, we used the top 20 representative AEs to characterize the rough distributions of four AE signatures (see Supplementary Material) and grouped AEs by their SOC categories in MedDRA. In addition, we performed a one-sided Wilcoxon rank test for every SOC category in each AE signature to determine whether AEs belonging to one SOC category have a high-probability accumulation in some AE-signature distributions.
For the first AE signature, AEs with top probabilities include some liver-related symptoms (alanine aminotransferase increased, aspartate aminotransferase increased, and blood creatinine increased), kidney-related symptoms (acute kidney injury and glomerular filtration rate decreased), and cardiovascular-related symptoms (bradycardia, cardiac arrest, and hypotension) (Supplementary Figure S1). Most of them were classified into SOC categories “investigations” and “renal and urinary disorders.” These two categories correspond to a higher level of AE severity (Figure 2), where the “investigations” category includes some laboratory test indexes, radiologic test indexes, or physical examination indexes. Compared with other drugs, AEs of remdesivir are more abundant in the first AE signature, with more than 90% of AEs attributed to AE signature 1 (Supplementary Figure S2). This finding can be supported by several existing studies which reported the damage to the liver and renal functions of remdesivir users among COVID-19 patients (Perveen et al., 2020; Zampino et al., 2020; Singh and Kamath, 2021). Thus, COVID-19 patients with poor liver, renal, or probably cardiac functions should take remdesivir with caution.
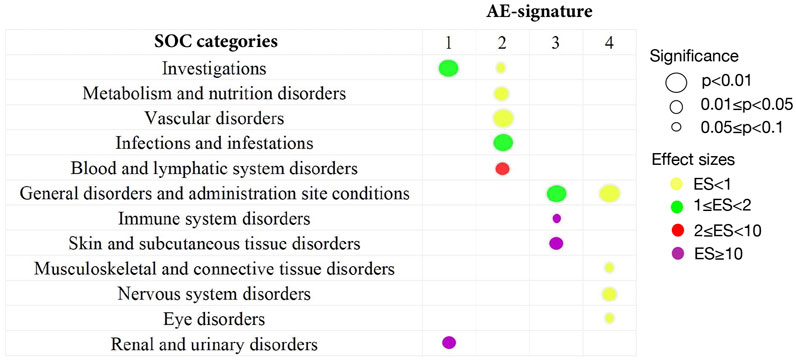
FIGURE 2. Summary of statistically significant SOC categories returned by the one-sided Wilcoxon rank test. All 134 AEs extracted from the CEUAFD are classified into different SOC categories in MedDRA. By the one-sided Wilcoxon rank test, only significant associations between the SOC category and AE signature are shown. The size of the circles corresponds to different levels of p values. The colors represent different effect sizes (ESs) of the association between the SOC category and AE signature.
We detected significant aggregation in some kidney-related AEs (acute kidney injury), cardiovascular-related AEs (electrocardiogram QT prolonged, hypotension, and hypoglycemia), and AEs related to the immune system (lymphocyte count decreased, lymphopenia, and leukocytosis) for AE signature 2. This leads to a significant high-probability accumulation of SOC categories “vascular disorder” (p = 0.0095) and “blood and lymphatic system disorders” (p = 0.03) in AE signature 2 (Figure 2 and Supplementary Figure S3). Hydroxychloroquine, tocilizumab, COVID-19 convalescent plasma, vancomycin hydrochloride, and baricitinib are more enriched with AE signature 2 compared with other drugs (Supplementary Figure S2). Interestingly, tocilizumab and baricitinib are both categorized as “immune modulators” by the FDA when treating COVID-19. Recent research also highlighted that hydroxychloroquine treatment may impair host immunity in response to SARS-CoV-2 (Devarajan and Vaseghi, 2021; Rother et al., 2020), while baricitinib could not be initiated in patients with small lymphocyte count (Praveen et al., 2020). Synthesizing all the abovementioned evidence, we recommend that COVID-19 patients with weak immune systems or vascular disorders should not be prescribed hydroxychloroquine, tocilizumab, or baricitinib.
AE signature 3 and AE signature 4 have many representative AEs in common, such as dyspnoea, pyrexia, hypoxia, oxygen saturation decreased, nausea, vomiting, dizziness, and cough (Supplementary Figures S4, S5). Most of these common representative AEs were classified into the “General disorders and administration site conditions” SOC category (Figure 2). Standing on the SOC category perspective, we can distill more general differences between these two AE signatures—part of the representative AEs in AE signature 3 can be attributed to the “Skin and subcutaneous tissue disorders” SOC category, while AEs belonging to the SOC category “Nervous system disorders” are more abundant in AE signature 4 (Figure 2). Casirivimab and imdevimab and bamlanivimab are the representative drugs of AE signature 3 and 4 separately. Another combinational drug bamlanivimab and etesevimab is also enriched with AE signature 3 (Supplementary Figure S2). Different from the first two AE signatures, the symptoms of the last two AE signatures are relatively mild. This finding is consistent with the FDA’s recommendation that mild-to-moderate COVID-19 in adults and children not admitted to hospital may be treated by bamlanivimab (Mahase, 2020). We also found that reduced oxygen saturation is a common AE brought by both casirivimab and imdevimab and bamlanivimab, which was supported by existing research (Kano et al., 2021). Therefore, casirivimab and imdevimab should be taken carefully by COVID-19 patients with low oxygen saturation.
AE-signature analysis for drugs in the clinical trial stage
An AE-signature analysis for drugs that are still in the clinical trial stage to fight against COVID-19 was performed. Under the rationale assumption that similar drugs may induce similar side effects (Campillos et al., 2008; Zhang et al., 2017), we predicted their AEs by combining the last-stage similarity network and CEUAFD drugs’ clustering output.
Part of the predicted last-stage drug–drug similarity network is presented in Figure 3A, including the five widely used CEUAFD drugs and their five nearest neighbor drugs which were still in the clinical investigation stage. We found that baricitinib and hydroxychloroquine are each other’s five nearest neighbor drugs, which is consistent with the NMF result of the CEUAFD that these two drugs are both representative drugs of AE signature 2. On the other hand, casirivimab and imdevimab and bamlanivimab (both have relatively mild AE feedback from COVID-19 patients) are also among each other’s top five nearest neighbor drugs. Finally, chloroquine, a widely recognized drug with functions similar to hydroxychloroquine, is also among the top five nearest neighbors of hydroxychloroquine. We define drugs from the CEUAFD, i.e., remdesivir, baricitinib, casirivimab and imdevimab, and bamlanivimab, as the representative drugs for the four clusters. With respect to the four drugs, the top 15 nearest neighbor drugs with each are shown in Table 2.
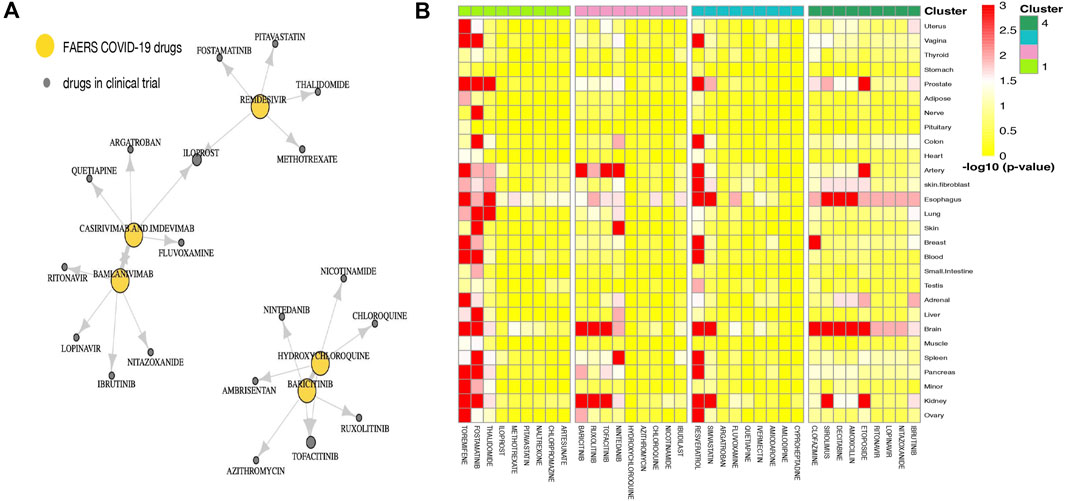
FIGURE 3. (A) Drug–drug similarity network between five widely used CEUAFD drugs and their five nearest neighbor drugs. The arrow pointing from drug A to drug B means drug B is among the five nearest neighbor drugs of drug A. (B) Heatmap of the significance of the association between tissues and drugs in four drug clusters. The association for each drug–tissue pair was calculated by network proximity, while the significance of the association was performed using a permutation test. Colors indicate the −log10 (p value) of each drug–tissue pair.
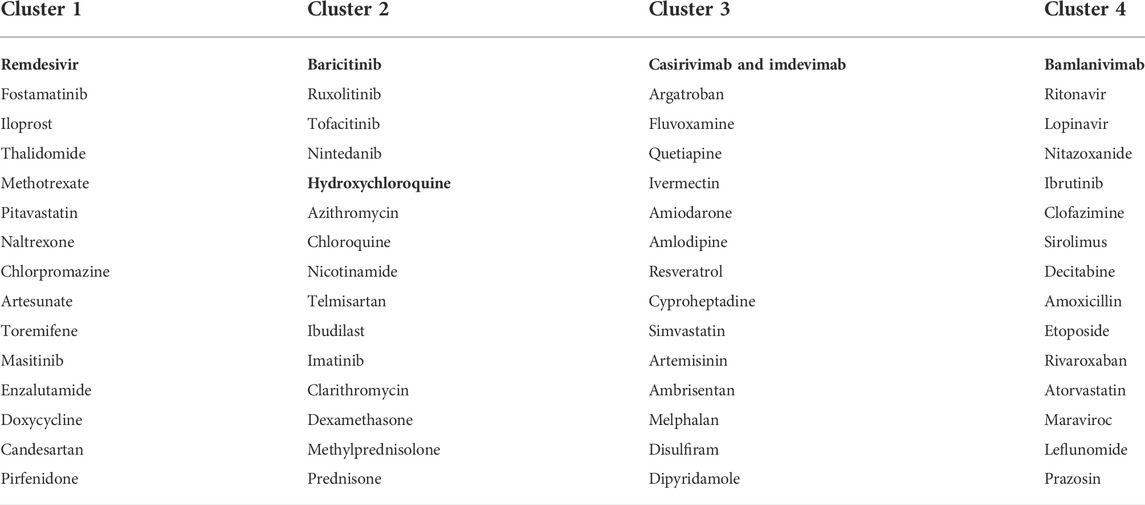
TABLE 2. Four drug clusters based on the integrated drug–drug similarity network and NMF outcomes of the CEUAFD. Drugs in bold are from the CEUAFD, and each drug cluster features one specific AE signature.
To give a further explanation of the predicted drug clustering result, we applied the network proximity approach to evaluate the association between each drug–tissue pair using the GTEx database. The significance level for each drug–tissue pair is shown in Figure 3B. Compared with the other three drug clusters, more drugs from cluster 1 possess a higher association level in tissues such as the liver, lung, prostate, and blood. There is a strong association between brain tissue and drugs from cluster 4, which gives an indirect reflection that drugs in cluster 4 may induce nervous system disorders. Furthermore, we listed several representative drugs with literature-reported AEs observed in pharmacological and genomic spaces (Table 3). The widely reported AEs showed high-level consistency with the typical AEs in each drug cluster.

TABLE 3. Summary of 10 representative COVID-19 drugs in the clinical trial stage. Information on 10representative COVID-19 drugs which are in the clinical trial stage is shown, including DrugBank ID, typical AEs with literature support, and the drug cluster to which each drug belongs.
Molecular mechanisms accounting for different drug clusters
We employed LINCS data with the A549 cell line (Subramanian et al., 2017) and applied SLDA (Mai et al., 2012) to further explore the molecular mechanisms for the four deciphered AE signatures. Our target is to find therapeutic biomarkers presenting distinguishing expression patterns for each pair of drug clusters. Part of the distinguished molecular mechanisms of four AE signatures was reflected by discriminative biomarkers extracted from SLDA.
For every pair of drug clusters, we obtained a discriminative gene set by conducting SLDA. Log fold change of each drug’s expression levels on the selected 67 SLDA genes is shown in Figure 4A. Because representative AEs of drug clusters 3 and 4 are relatively mild and the AEs in clusters 1 and 2 are more severe and characteristic, we merged drug clusters 3 and 4 as the control cluster. SLDA genes showing differential expression patterns in the drug cluster 1–control pair and 2–control pair were collected for further validation. A biological function enrichment analysis was implemented to uncover the possible relationships between enriched pathways and representative differential AEs in the pair of drug clusters (see Supplementary Material).
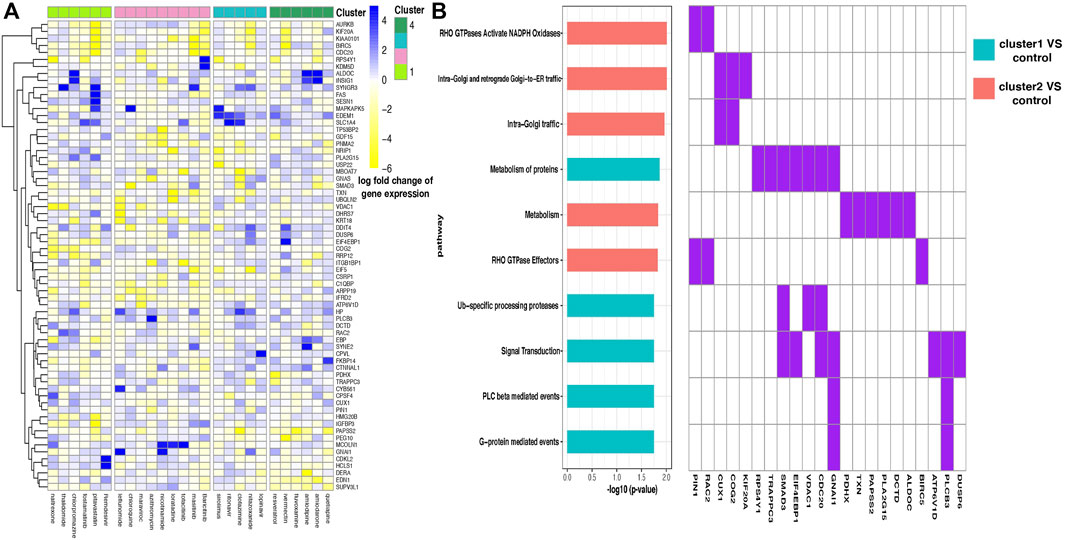
FIGURE 4. (A) Heatmap of the log fold change of gene expression levels for drugs in four clusters. Each row is a gene, and each column is a drug. Drugs are ordered according to their cluster index number. (B) Enriched pathways in two discriminant gene sets corresponding to two pairs of drug clusters—drug cluster 1–control pair and 2–control pair. Enrichment analysis was performed in two discriminant gene sets separately, where the two gene sets contain genes showing distinguishing expression patterns between drug cluster 1 and the control group and drug cluster 2 and the control group separately, and the control group was defined as the combination of drug cluster 3 and 4. Ten pathways with the most significant enrichment p values are shown, and pathways enriched in different gene sets are filled with different colors (left). Discriminant genes that emerged in the enriched pathways are shown (right).
We found that gene FAS presents highly different expression levels between drug clusters 1 and 2 (Figure 4A). Fas and Fas-ligands are classical members of the TNF receptor and TNF ligand families. The interaction of the receptor with its ligand allows the formation of a death-inducing signaling complex that includes the Fas-associated death domain protein (FADD), caspase 8, and caspase 10. With this mechanism, they play an important role in the regulation of apoptotic processes, including activation-induced cell death, T-cell-induced cytotoxicity, and multiple organ function impairment (Wajant et al., 2003).
By conducting enrichment analysis, the differential genes between drug cluster 1–control pair are enriched in the RHO GTPases Activate NADPH Oxidases pathway, with PIN1 and RAC2 being the pathway input genes (Figure 4B). To our knowledge, RAC2 is an important component of NADPH oxidase (Kim and Dinauer, 2001). Excessive NADPH oxidase-derived ROS production can induce multiple tissue injuries and prolonged inflammatory responses, leading to inflammatory diseases (Belambri et al., 2018).
Different from that mentioned above, the KEGG Reactome analysis showed that a large number of differential genes in the drug cluster 2–control pair flowed to signal transduction pathway (Figure 4B), which is related to many diseases such as cancer, atherosclerosis, and inflammatory diseases. Notably, the SMAD3 gene is selected in this pathway. SMAD3 is a major transcription factor in transforming growth factor-
Discussion
With respect to COVID-19 drug safety, we developed a framework to predict the AE profiles for those drugs which are not in large-scale use. This framework has some advantages from methodological, clinical, and molecular viewpoints.
Some innovative points in our method are worth to be mentioned. The advantages of NMF are two-fold. First, NMF possessed the ability of dimension reduction and drug clustering. Second, by further SOC category enrichment analysis, NMF can capture the subpopulation fragile to each AE signature with a higher precision level. On the other hand, most network integration methods assumed node consistency among different networks. With the rapid development of new drugs, it is hard to fulfill that each drug’s information is available in all data sources. We developed an MDS-based network imputation method, which was achieved by node embedding and building a predictive model employing network-shared drugs. This method can effectively use incomplete information. The imputation is particularly useful when drugs’ information is unable to be presented by low-dimensional vectors (for example, chemical structure or high-dimensional bioassay data), as our imputation model was built in the low-dimensional embedded space. Lastly, we utilized SLDA to seek discriminative genes which may provide molecular-level explanation for different AE signatures among drug clusters. If there is a correspondence between the mechanism of SLDA genes and different AE-signature patterns for each pair of drug clusters, we validate the rationality of our drug clustering results and AE prediction results in some sense. On the other hand, combining symptomatic features with molecular-level features for COVID-19 patients may contribute to more precise therapeutic prescriptions.
Clinically, we presented some important discoveries. Our analysis of the COVID-19 EUA FAERS database showed that remdesivir may bring damage to liver, renal, or probably cardiac functions, which is widely acknowledged with the evolvement of in-depth research (Li et al., 2021). Tocilizumab and baricitinib, which are categorized as “immune modulators” by the FDA, may cause vascular, blood, and lymphatic system disorders in COVID-19 patients. Another important message brought by the CEUAFD is that AE feedbacks from combinational drugs are relatively mild. In addition, by clustering all COVID-19 drugs, we found that among the top five nearest neighbors of Baricitinib, three of them belong to the “tinib” family. Our prediction can be verified by Halimi et al. (2008), who reported that prolongation of the QT interval and heart failure are frequent AEs in patients using tinibs.
From the viewpoint of molecular level, drugs from cluster 1 and control cluster showed differential expression patterns in the RHO GTPases Activate NADPH Oxidases pathway. NADPH oxidase (NOX) is a multimeric transmembrane enzyme complex that uses NADPH as an electron donor to generate superoxide (O2-) and hydrogen peroxide (H2O2) from molecular oxygen. It participates in various biological processes including innate immunity, and biosynthetic processes (Bedard and Krause, 2007). In the pathophysiological process of the liver, NADPH oxidase is expressed functionally in phagocytic and non-phagocytic forms. NOX-derived ROS contributes to various liver diseases caused by alcohol, hepatitis C virus, and toxic bile acids (Paik et al., 2014). In addition to causing liver injury, the impairment of this pathway is also related to renal insufficiency. Abnormally activated NOX in renal microvessels can lead to superoxide production. Oxidative stress in the kidney contributes to renal vascular remodeling and increases preglomerular resistance. Some reports showed that they are key factors in acute and chronic kidney injury (Xu et al., 2020), while for the drug cluster 2–control pair, the differential genes are more relevant to the signal transduction pathway. The relationship between the blockage of the signal transduction pathway and cardiovascular events has been widely reported (Wheeler-Jones, 2005). Previous studies have demonstrated that several kinds of TKIs could lead to grade III or higher QT prolongation, and animal models suggested that this might be caused by the inhibition of PI3K signaling (Schiefer et al., 2018). In addition, the impairment of other signaling pathways is also intimately related to cardiovascular disorders. Mechanistic studies suggested that disturbed TGF-
There are also some limitations in our study. Although the CEUAFD provided rich AE feedback for some approved COVID-19 drugs, only 9 drugs were reported by more than 20 patients. This insufficient AE feedback phenomenon may induce inaccuracy in extracting AE signatures. Therefore, the four factorized AE signatures cannot depict AE information for all COVID-19 drugs. Due to the limitations of data accessibility, we only used LINCS data processed on lung tissues to explore molecular-level differences among drug clusters. With the propelling of COVID-19 research, more and more molecular-level data will be released to promote our understanding of the mechanism of AEs returned by different COVID-19 drugs.
Conclusion
Many existing COVID-19 drugs are still in the clinical trial stage, thus lacking abundant AE feedback. This drug safety analysis tried to solve this important problem by borrowing information from the AE profile of other “old” drugs. Our analysis took the heterogeneous health conditions of COVID-19 patients into consideration and proposed a computational framework to predict AEs for potential COVID-19 drugs. Therefore, the proposed framework jumps out of the current winner-takes-all drug repurposing framework and can provide better precise drug recommendations. We believe that our framework can be generalized to other diseases for precision drug recommendation and drug clustering with reduced time and cost.
Data availability statement
The datasets presented in this study can be found in online repositories. The names of the repository/repositories and accession number(s) can be found in the article/Supplementary Material.
Author contributions
YZ conceived and supervised the study. HW and XW collected the data. HW conducted the analysis. HW wrote the first draft of the manuscript with input from XW, TL, and YZ. HW, DL, and YZ revised the manuscript. All authors reviewed and approved the final version of the manuscript.
Conflict of interest
The authors declare that the research was conducted in the absence of any commercial or financial relationships that could be construed as a potential conflict of interest.
Publisher’s note
All claims expressed in this article are solely those of the authors and do not necessarily represent those of their affiliated organizations, or those of the publisher, the editors, and the reviewers. Any product that may be evaluated in this article, or claim that may be made by its manufacturer, is not guaranteed or endorsed by the publisher.
Supplementary material
The Supplementary Material for this article can be found online at: https://www.frontiersin.org/articles/10.3389/fgene.2022.1019940/full#supplementary-material
References
Adhami, M., Sadeghi, B., Rezapour, A., Haghdoost, A. A., and Motieghader, H. (2021). Repurposing novel therapeutic candidate drugs for coronavirus disease-19 based on protein-protein interaction network analysis. BMC Biotechnol. 21, 1–11.
Baik, S. Y., Kim, H., Yang, S. J., Kim, T. M., Lee, S.-H., Cho, J. H., et al. (2019). Long-term effects of various types of 3-hydroxy-3-methylglutaryl coenzyme A reductase inhibitors on changes in glomerular filtration rate in Korea. Front. Med. 13, 713–722. doi:10.1007/s11684-018-0661-9
Bedard, K., and Krause, K.-H. (2007). The NOX family of ROS-generating NADPH oxidases: Physiology and pathophysiology. Physiol. Rev. 87, 245–313. doi:10.1152/physrev.00044.2005
Belambri, S. A., Rolas, L., Raad, H., Hurtado-Nedelec, M., Dang, P. M. C., and El-Benna, J. (2018). NADPH oxidase activation in neutrophils: Role of the phosphorylation of its subunits. Eur. J. Clin. Invest. 48, e12951. doi:10.1111/eci.12951
Binois, Y., Hachad, H., Salem, J.-E., Charpentier, J., Lebrun-Vignes, B., Pène, F., et al. (2020). Acute kidney injury associated with lopinavir/ritonavir combined therapy in patients with COVID-19. Kidney Int. Rep. 5, 1787–1790. doi:10.1016/j.ekir.2020.07.035
Brunet, J.-P., Tamayo, P., Golub, T. R., and Mesirov, J. P. (2004). Metagenes and molecular pattern discovery using matrix factorization. Proc. Natl. Acad. Sci. U. S. A. 101, 4164–4169. doi:10.1073/pnas.0308531101
Bugin, K., and Woodcock, J. (2021). Trends in COVID-19 therapeutic clinical trials. Nat. Rev. Drug. Discov. 20, 254–256.
Bujak, M., Ren, G., Kweon, H. J., Dobaczewski, M., Reddy, A., Taffet, G., et al. (2007). Essential role of Smad3 in infarct healing and in the pathogenesis of cardiac remodeling. Circulation 116, 2127–2138. doi:10.1161/CIRCULATIONAHA.107.704197
Campillos, M., Kuhn, M., Gavin, A.-C., Jensen, L. J., and Bork, P. (2008). Drug target identification using side-effect similarity. Science 321, 263–266. doi:10.1126/science.1158140
CDC Covid-19 Vaccine Breakthrough Case Investigations Team (2021). COVID-19 vaccine breakthrough infections reported to CDC—United States, january 1–april 30, 2021. Morb. Mortal. Wkly. Rep. 70, 792.
Chen, Y., Gong, F.-Y., Li, Z.-J., Gong, Z., Zhou, Z., Ma, S.-Y., et al. (2017). A study on the risk of fungal infection with tofacitinib (CP-690550), a novel oral agent for rheumatoid arthritis. Sci. Rep. 7, 6779–9. doi:10.1038/s41598-017-07261-1
Cohen, S. B., Tanaka, Y., Mariette, X., Curtis, J. R., Lee, E. B., Nash, P., et al. (2020). Long-term safety of tofacitinib up to 9.5 years: A comprehensive integrated analysis of the rheumatoid arthritis clinical development programme. RMD open 6, e001395. doi:10.1136/rmdopen-2020-001395
Cox, M. A., and Cox, T. F. (2008). Multidimensional scaling. Handbook of data visualization. Springer.
Devarajan, A., and Vaseghi, M. (2021). Hydroxychloroquine can potentially interfere with immune function in COVID-19 patients: Mechanisms and insights. Redox Biol. 38, 101810. doi:10.1016/j.redox.2020.101810
Foulquier, S., Daskalopoulos, E. P., Lluri, G., Hermans, K. C., Deb, A., and Blankesteijn, W. M. (2018). WNT signaling in cardiac and vascular disease. Pharmacol. Rev. 70, 68–141. doi:10.1124/pr.117.013896
Gordon, D. E., Jang, G. M., Bouhaddou, M., Xu, J., Obernier, K., White, K. M., et al. (2020). A SARS-CoV-2 protein interaction map reveals targets for drug repurposing. Nature 583, 459–468. doi:10.1038/s41586-020-2286-9
Goumans, M.-J., and Ten Dijke, P. (2018). TGF-β signaling in control of cardiovascular function. Cold Spring Harb. Perspect. Biol. 10, a022210.
Guo, W., Pan, B., Sakkiah, S., Ji, Z., Yavas, G., Lu, Y., et al. (2021). Informing selection of drugs for COVID-19 treatment through adverse events analysis. Sci. Rep. 11, 14022–14027. doi:10.1038/s41598-021-93500-5
Gysi, D. M., Do Valle, Í., Zitnik, M., Ameli, A., Gan, X., Varol, O., et al. (2021). Network medicine framework for identifying drug-repurposing opportunities for COVID-19. Proc. Natl. Acad. Sci. U. S. A. 118, e2025581118. doi:10.1073/pnas.2025581118
Halimi, J.-M., Azizi, M., Bobrie, G., Bouche, O., Deray, G., Des Guetz, G., et al. (2008). Vascular and renal effects of anti-angiogenic therapy. Nephrol. Ther. 4, 602–615.
Hsu, H. H., and Rubin, L. J. (2005). Iloprost inhalation solution for the treatment of pulmonary arterial hypertension. Expert Opin Pharmacother. 6, 1921–1930.
Jang, W. D., Jeon, S., Kim, S., and Lee, S. Y. (2021 ). Drugs repurposed for COVID-19 by virtual screening of 6,218 drugs and cell-based assay. Proc. Natl. Acad. Sci. U. S. A. 118.
Jing, Y., Diao, L., and Han, L. (2021). Adverse events associated with potential drugs for COVID-19: A case study from real-world data. Brief. Bioinform. 22, 1232–1238.
Kano, G., Taniguchi, K., and Oue, Y. (2021). Transient adverse events after REGN-CoV2 administration for mild COVID-19 patients and their potential predictive factors: A single center analysis. medRxiv. doi:10.1101/2021.11.29.21266623
Kim, C., and Dinauer, M. C. (2001). Rac2 is an essential regulator of neutrophil nicotinamide adenine dinucleotide phosphate oxidase activation in response to specific signaling pathways. J. Immunol. 166, 1223–1232. doi:10.4049/jimmunol.166.2.1223
Lee, D., and Seung, H. S. (2000). Algorithms for non-negative matrix factorization. Adv. neural Inf. Process. Syst. 13.
Lenze, E. J., Mattar, C., Zorumski, C. F., Stevens, A., Schweiger, J., Nicol, G. E., et al. (2020). Fluvoxamine vs placebo and clinical deterioration in outpatients with symptomatic COVID-19: A randomized clinical trial. Jama 324, 2292–2300. doi:10.1001/jama.2020.22760
Li, D., Ding, X., Xie, M., Tian, D., and Xia, L. (2021). COVID-19-associated liver injury: From bedside to bench. J. Gastroenterol. 56, 218–230. doi:10.1007/s00535-021-01760-9
Lonsdale, J., Thomas, J., Salvatore, M., Phillips, R., Lo, E., Shad, S., et al. (2013). The genotype-tissue expression (GTEx) project. Nat. Genet. 45, 580–585. doi:10.1038/ng.2653
Mahase, E. (2020). Covid-19: FDA authorises neutralising antibody bamlanivimab for non-admitted patients. BMJ, 371, m4362. doi:10.1136/bmj.m4362
Mai, Q., Zou, H., and Yuan, M. (2012). A direct approach to sparse discriminant analysis in ultra-high dimensions. Biometrika 99, 29–42. doi:10.1093/biomet/asr066
Marquardt, K., and Albertson, T. E. (2001). Treatment of hydroxychloroquine overdose. Am. J. Emerg. Med. 19, 420–424. doi:10.1053/ajem.2001.25774
Newland, A., and Mcdonald, V. (2020). Fostamatinib: A review of its clinical efficacy and safety in the management of chronic adult immune thrombocytopenia. Immunotherapy 12, 1325–1340. doi:10.2217/imt-2020-0215
Paik, Y.-H., Kim, J., Aoyama, T., De Minicis, S., Bataller, R., and Brenner, D. A. (2014). Role of NADPH oxidases in liver fibrosis. Antioxid. Redox Signal. 20, 2854–2872. doi:10.1089/ars.2013.5619
Peng, Y., Wang, W., Fang, Y., Hu, H., Chang, N., Pang, M., et al. (2021). Corrigendum: Inhibition of TGF-β/smad3 signaling disrupts cardiomyocyte cell cycle progression and epithelial-mesenchymal transition-like response during ventricle regeneration. Front. Cell. Dev. Biol. 9, 699796. doi:10.3389/fcell.2021.699796
Perveen, R., Nasir, M., Talha, K., Selina, F., and Islam, M. (2020). Systematic review on current antiviral therapy in COVID-19 pandemic. Med. J. Malays. 75, 710–716.
Praveen, D., Puvvada, R. C., and Aanandhi, V. (2020). Janus kinase inhibitor baricitinib is not an ideal option for management of COVID-19. Int. J. Antimicrob. Agents 55, 105967. doi:10.1016/j.ijantimicag.2020.105967
Pundi, K., Perino, A. C., Harrington, R. A., Krumholz, H. M., and Turakhia, M. P. (2020). Characteristics and strength of evidence of COVID-19 studies registered on ClinicalTrials. gov. JAMA Intern. Med. 180, 1398–1400. doi:10.1001/jamainternmed.2020.2904
Rintala, T., Ghosh, A., and Fortino, V. (2022). Network approaches for modeling the effect of drugs and diseases. Brief. Bioinform. 23, bbac229. doi:10.1093/bib/bbac229
Rother, N., Yanginlar, C., Lindeboom, R. G., Bekkering, S., van Leent, M. M., Buijsers, B., et al. (2020). Hydroxychloroquine inhibits the trained innate immune response to interferons. Cell Rep. Med. 1, 100146.
Sachdev, K., and Gupta, M. K. (2020). A comprehensive review of computational techniques for the prediction of drug side effects. Drug Dev. Res. 81, 650–670. doi:10.1002/ddr.21669
Schiefer, M., Hendriks, L. E., Dinh, T., Lalji, U., and Dingemans, A.-M. C. (2018). Current perspective: Osimertinib-induced QT prolongation: New drugs with new side-effects need careful patient monitoring. Eur. J. Cancer 91, 92–98. doi:10.1016/j.ejca.2017.12.011
Shalabi, M. M., Garcia, B., Kendall, C., Siller, A., Austinn, M., and Tyring, S. K. (2022). Janus kinase and tyrosine kinase inhibitors in dermatology: A review of their utilization, safety profile and future applications. Skin. Ther. Lett. 27, 4–9.
Singh, A., and Kamath, A. (2021). Assessment of adverse events associated with remdesivir use for coronavirus disease 2019 using real-world data. Expert Opin. Drug Saf. 20, 1559–1564. doi:10.1080/14740338.2021.1962846
Subramanian, A., Narayan, R., Corsello, S. M., Peck, D. D., Natoli, T. E., Lu, X., et al. (2017). A next generation connectivity map: L1000 platform and the first 1, 000, 000 profiles. Cell. 171, 1437–1452. e17. doi:10.1016/j.cell.2017.10.049
Thangaraju, P., Venkatesan, S., Elavarasan Sivashanmugam, M., and Showkath Ali, M. K. (2019). Dose-dependent thalidomide induced bradycardia in young erythema nodosum leprosum patient. Indian J. Pharmacol. 51, 72–74. doi:10.4103/ijp.IJP_48_18
Timilsina, M., Tandan, M., D’Aquin, M., and Yang, H. (2019). Discovering links between side effects and drugs using a diffusion based method. Sci. Rep. 9, 1–10. doi:10.1038/s41598-019-46939-6
Uyar, M. E., Yucel, P., Ilin, S., Bal, Z., Yildirim, S., Akay, T., et al. (2016). Iloprost as an acute kidney injury-triggering agent in severely atherosclerotic patients: Cardiovascular topics. Cardiovasc. J. Afr. 27, 128–133. doi:10.5830/CVJA-2015-051
Wajant, H., Pfizenmaier, K., and Scheurich, P. (2003). Non-apoptotic Fas signaling. Cytokine Growth Factor Rev. 14, 53–66. doi:10.1016/s1359-6101(02)00072-2
Walsh, K., Mcaulay, K., Lee, M., Vilbrun, S., Mathurin, L., Jean Francois, D., et al. (2020). Early bactericidal activity trial of nitazoxanide for pulmonary tuberculosis. Antimicrob. Agents Chemother. 64, e01956-19. doi:10.1128/AAC.01956-19
Wang, B., Mezlini, A. M., Demir, F., Fiume, M., Tu, Z., Brudno, M., et al. (2014a). Similarity network fusion for aggregating data types on a genomic scale. Nat. Methods 11, 333–337. doi:10.1038/nmeth.2810
Wang, F., Zhang, P., Cao, N., Hu, J., and Sorrentino, R. (2014b). Exploring the associations between drug side-effects and therapeutic indications. J. Biomed. Inf. 51, 15–23. doi:10.1016/j.jbi.2014.03.014
Wheeler-Jones, C. P. (2005). Cell signalling in the cardiovascular system: An overview. Heart 91, 1366–1374. doi:10.1136/hrt.2005.072280
Wishart, D. S., Feunang, Y. D., Guo, A. C., Lo, E. J., Marcu, A., Grant, J. R., et al. (2018). DrugBank 5.0: A major update to the DrugBank database for 2018. Nucleic Acids Res. 46, D1074-D1082–D1082. doi:10.1093/nar/gkx1037
Wu, Q., Fan, X., Hong, H., Gu, Y., Liu, Z., Fang, S., et al. (2020). Comprehensive assessment of side effects in COVID-19 drug pipeline from a network perspective. Food Chem. Toxicol. 145, 111767. doi:10.1016/j.fct.2020.111767
Xu, N., Jiang, S., Persson, P. B., Persson, E. A., Lai, E. Y., and Patzak, A. (2020). Reactive oxygen species in renal vascular function. Acta Physiol. 229, e13477. doi:10.1111/apha.13477
Zampino, R., Mele, F., Florio, L. L., Bertolino, L., Andini, R., Galdo, M., et al. (2020). Liver injury in remdesivir-treated COVID-19 patients. Hepatol. Int. 14, 881–883. doi:10.1007/s12072-020-10077-3
Zhang, W., Chen, Y., Tu, S., Liu, F., and Qu, Q. (2016). Drug side effect prediction through linear neighborhoods and multiple data source integration. In 2016 IEEE international conference on bioinformatics and biomedicine (BIBM). IEEE, 427–434.
Keywords: COVID-19 drugs, adverse effect signature, non-negative matrix factorization, network integration, precise drug recommendation
Citation: Wang H, Wang X, Li T, Lai D and Zhang YD (2022) Adverse effect signature extraction and prediction for drugs treating COVID-19. Front. Genet. 13:1019940. doi: 10.3389/fgene.2022.1019940
Received: 16 August 2022; Accepted: 13 October 2022;
Published: 04 November 2022.
Edited by:
Nguyen Quoc Khanh Le, Taipei Medical University, TaiwanReviewed by:
Sugandh Kumar, University of California, San Francisco, United StatesArchana Prabahar, Cleveland State University, United States
Copyright © 2022 Wang, Wang, Li, Lai and Zhang. This is an open-access article distributed under the terms of the Creative Commons Attribution License (CC BY). The use, distribution or reproduction in other forums is permitted, provided the original author(s) and the copyright owner(s) are credited and that the original publication in this journal is cited, in accordance with accepted academic practice. No use, distribution or reproduction is permitted which does not comply with these terms.
*Correspondence: Yan Dora Zhang, doraz@hku.hk