
The Usefulness of the C2HEST Risk Score in Predicting Clinical Outcomes among Hospitalized Subjects with COVID-19 and Coronary Artery Disease

 , , , , , ,
  , , , , add
Show full author list
, , , , add
Show full author list
Abstract
:1. Introduction
2. Materials and Methods
2.1. Study Design and Population
2.2. Study Outcomes
2.3. Statistical Analysis
3. Results
3.1. Study Population Characteristics and Clinical Features
3.2. Applied Treatment
3.3. Association of C2HEST Score Results with Mortality
3.3.1. Mortality
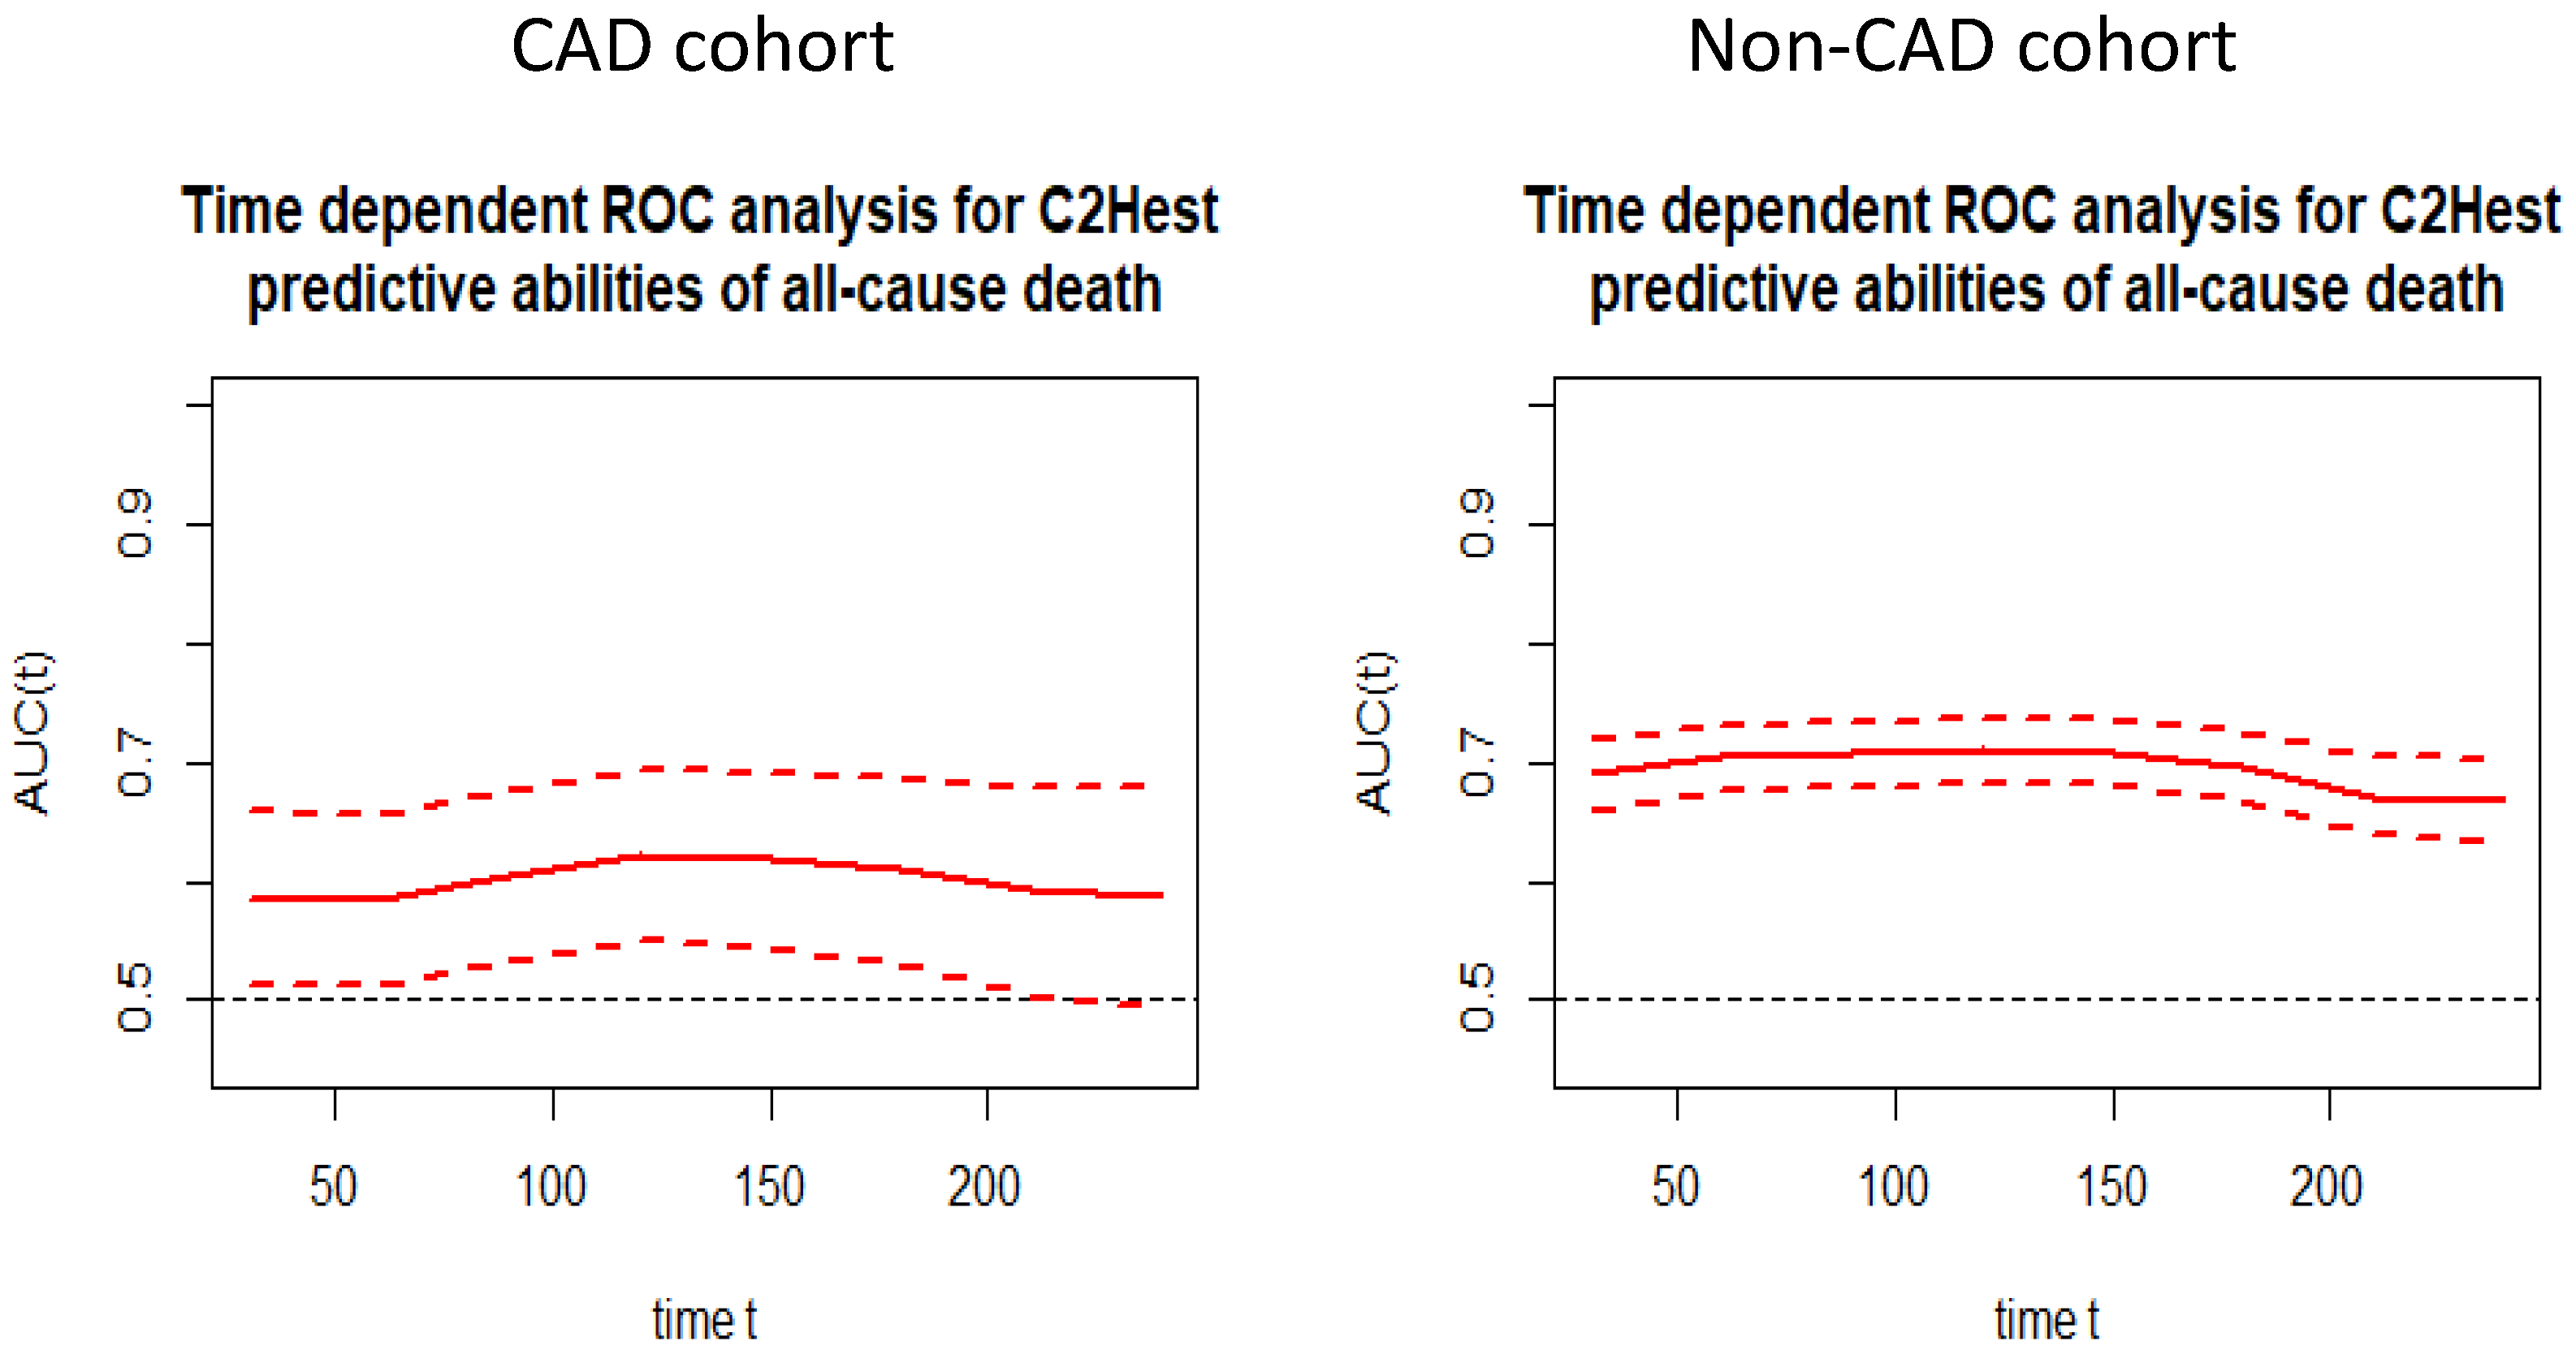
3.3.2. Discriminatory Performance of the C2HEST Score for Total All-Cause Mortality
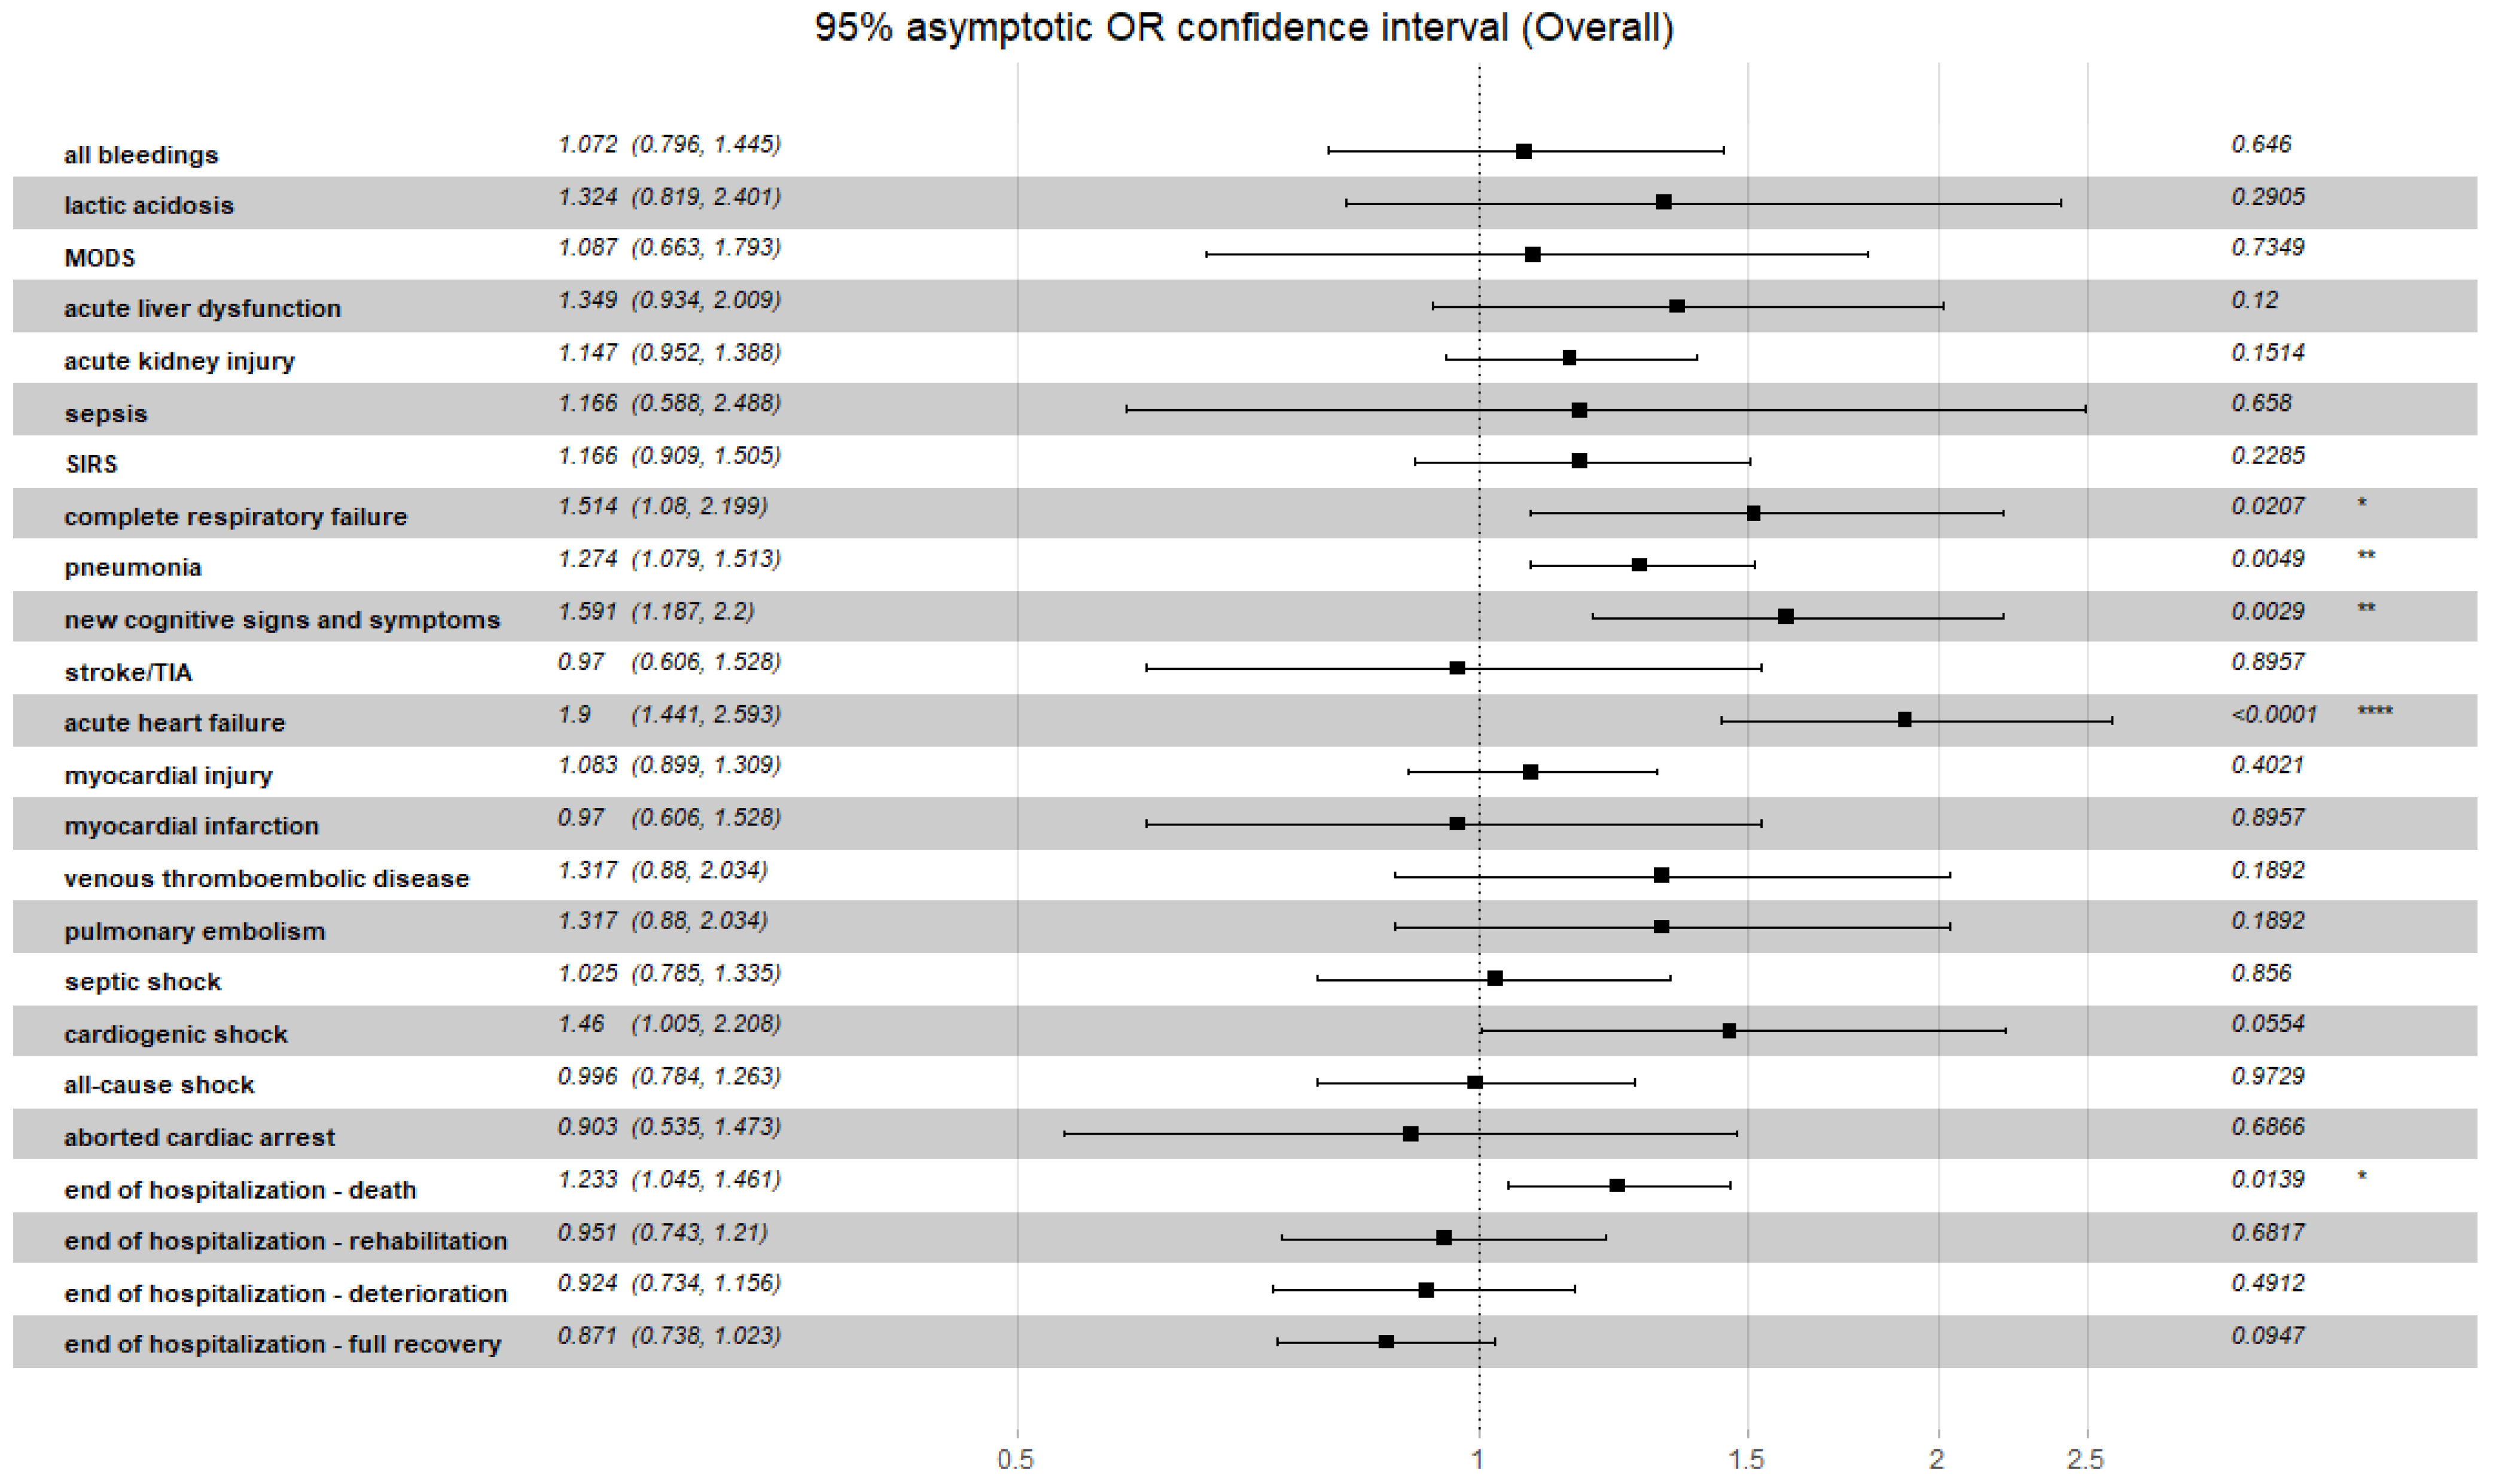
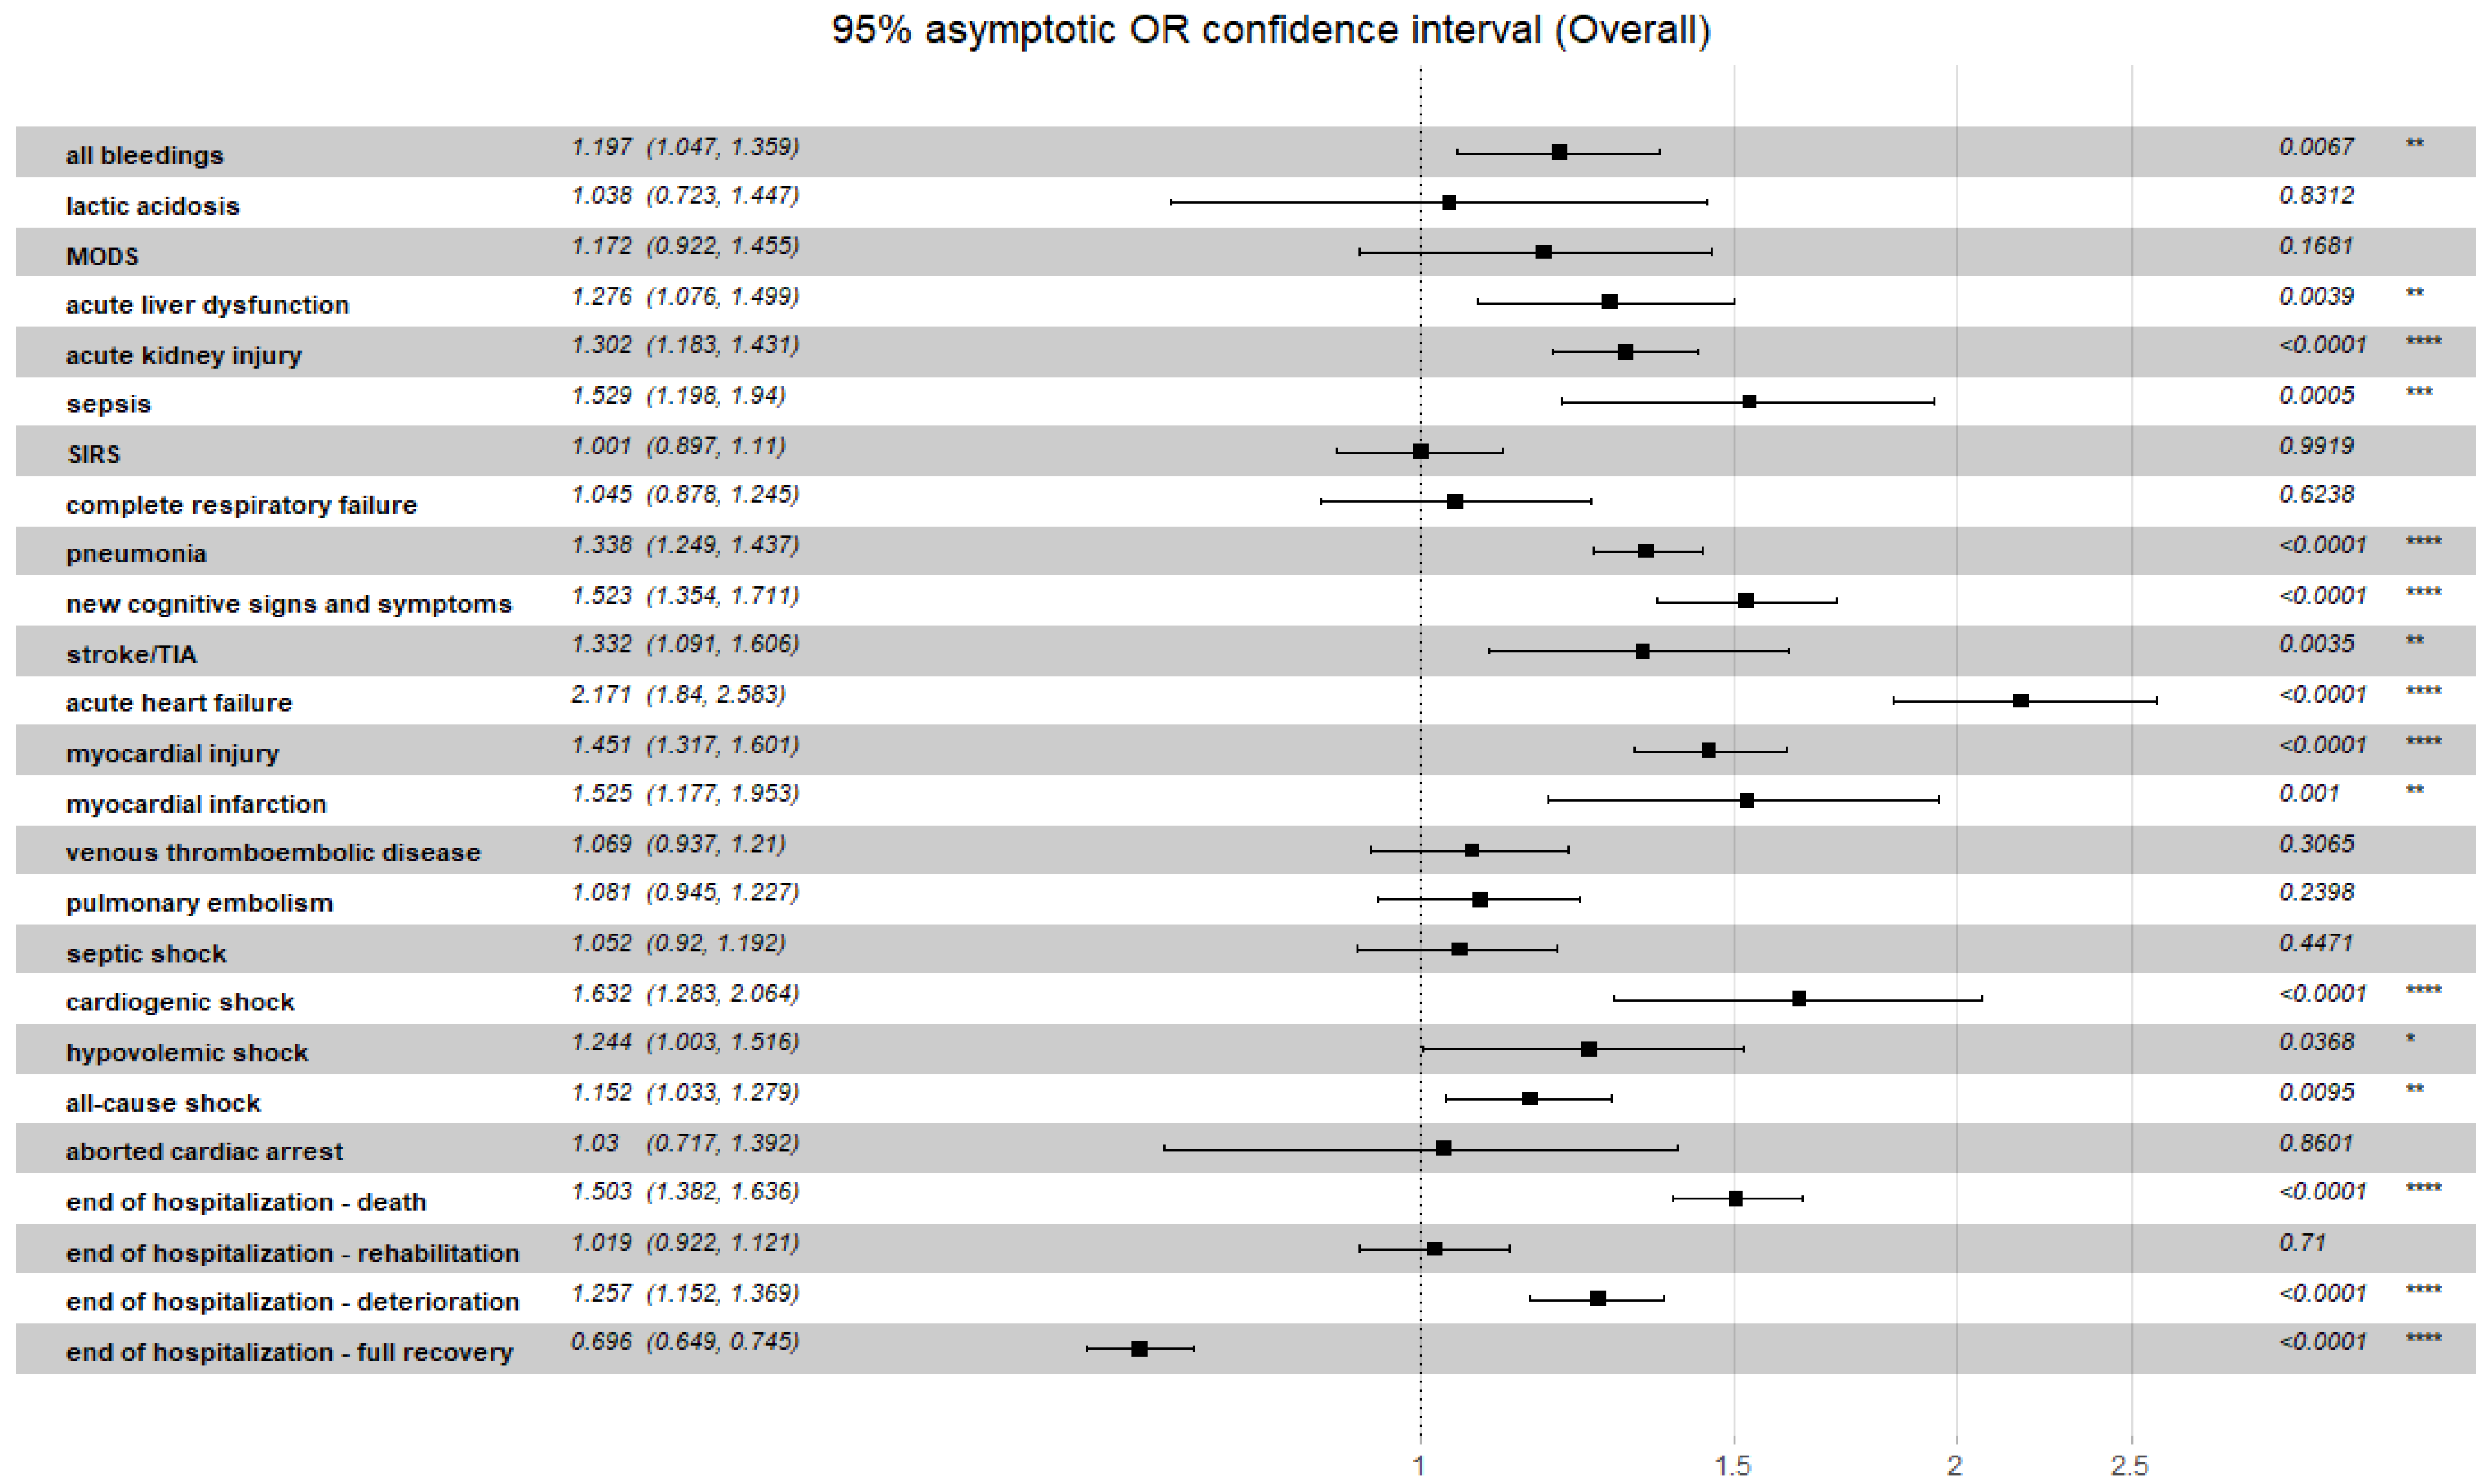
3.4. Association of C2HEST Score Results with Non-Fatal Clinical Outcomes
4. Discussion
5. Conclusions
6. Limitations
Supplementary Materials
Author Contributions
Funding
Institutional Review Board Statement
Informed Consent Statement
Data Availability Statement
Acknowledgments
Conflicts of Interest
References
- Wiersinga, W.J.; Rhodes, A.; Cheng, A.C.; Peacock, S.J.; Prescott, H.C. Pathophysiology, Transmission, Diagnosis, and Treatment of Coronavirus Disease 2019 (COVID-19): A Review. JAMA 2020, 324, 782–793. [Google Scholar] [CrossRef] [PubMed]
- Jakubiak, G.K.; Ochab-Jakubiak, J.; Cieślar, G.; Stanek, A. Gastrointestinal symptoms in the course of COVID-19. Postepy Hig. Med. Dosw. 2020, 74, 498–503. [Google Scholar] [CrossRef]
- Gupta, S.; Hayek, S.S.; Wang, W.; Chan, L.; Mathews, K.S.; Melamed, M.L.; Brenner, S.K.; Leonberg-Yoo, A.; Schenck, E.J.; Radbel, J.; et al. Factors Associated With Death in Critically Ill Patients With Coronavirus Disease 2019 in the US. JAMA Intern. Med. 2020, 180, 1436–1447. [Google Scholar] [CrossRef] [PubMed]
- Li, Y.-G.; Pastori, D.; Farcomeni, A.; Yang, P.-S.; Jang, E.; Joung, B.; Wang, Y.-T.; Guo, Y.-T.; Lip, G.Y. A Simple Clinical Risk Score (C2HEST) for Predicting Incident Atrial Fibrillation in Asian Subjects. Chest 2018, 155, 510–518. [Google Scholar] [CrossRef]
- Liang, W.; Wu, Y.; Xue, R.; Wu, Z.; Wu, D.; He, J.; Dong, Y.; Lip, G.Y.H.; Zhu, W.; Liu, C. C2HEST score predicts clinical outcomes in heart failure with preserved ejection fraction: A secondary analysis of the TOPCAT trial. BMC Med. 2021, 19, 1–10. [Google Scholar] [CrossRef] [PubMed]
- Gerotziafas, G.T.; Catalano, M.; Colgan, M.-P.; Pecsvarady, Z.; Wautrecht, J.C.; Fazeli, B.; Olinic, D.-M.; Farkas, K.; Elalamy, I.; Falanga, A.; et al. Guidance for the Management of Patients with Vascular Disease or Cardiovascular Risk Factors and COVID-19: Position Paper from VAS-European Independent Foundation in Angiology/Vascular Medicine. Thromb. Haemost. 2020, 120, 1597–1628. [Google Scholar] [CrossRef] [PubMed]
- Rola, P.; Doroszko, A.; Trocha, M.; Giniewicz, K.; Kujawa, K.; Skarupski, M.; Gajecki, D.; Gawryś, J.; Matys, T.; Szahidewicz-Krupska, E.; et al. Sex-Dependent Differences in Predictive Value of the C2HEST Score in Subjects with COVID-19—A Secondary Analysis of the COLOS Study. Viruses 2022, 14, 628. [Google Scholar] [CrossRef] [PubMed]
- Gajecki, D.; Doroszko, A.; Trocha, M.; Giniewicz, K.; Kujawa, K.; Skarupski, M.; Gawryś, J.; Matys, T.; Szahidewicz-Krupska, E.; Rola, P.; et al. Usefulness of the C2HEST Score in Predicting the Clinical Outcomes of COVID-19 in Diabetic and Non-Diabetic Cohorts. J. Clin. Med. 2022, 11, 873. [Google Scholar] [CrossRef] [PubMed]
- Rola, P.; Doroszko, A.; Trocha, M.; Giniewicz, K.; Kujawa, K.; Gawryś, J.; Matys, T.; Gajecki, D.; Madziarski, M.; Zieliński, S.; et al. Usefulness of C2HEST Score in Predicting Clinical Outcomes of COVID-19 in Heart Failure and Non-Heart-Failure Cohorts. J. Clin. Med. 2022, 11, 3495. [Google Scholar] [CrossRef]
- Rola, P.; Doroszko, A.; Trocha, M.; Giniewicz, K.; Kujawa, K.; Skarupski, M.; Gawryś, J.; Matys, T.; Szahidewicz-Krupska, E.; Gajecki, D.; et al. Mortality Predictive Value of the C2HEST Score in Elderly Subjects with COVID-19—A Subanalysis of the COLOS Study. J. Clin. Med. 2022, 11, 992. [Google Scholar] [CrossRef]
- Robin, X.; Turck, N.; Hainard, A.; Tiberti, N.; Lisacek, F.; Sanchez, J.-C.; Müller, M. pROC: An open-source package for R and S+ to analyze and compare ROC curves. BMC Bioinform. 2011, 12, 77. [Google Scholar] [CrossRef] [PubMed]
- Therneau, T.M. A Package for Survival Analysis in R. 2022. Available online: https://CRAN.R-project.org/package=survival (accessed on 20 July 2022).
- Hothorn, T.; Hornik, K.; A van de Wiel, M.; Zeileis, A. A Lego System for Conditional Inference. Am. Stat. 2006, 60, 257–263. [Google Scholar] [CrossRef]
- Schratz, P. R Package “Oddsratio”: Odds Ratio Calculation for GAM(M)s & GLM(M)S. 2017. Available online: https://www.google.com/url?sa=t&rct=j&q=&esrc=s&source=web&cd=&ved=2ahUKEwjh2bXQ5MX5AhVH-WEKHdi1DuMQFnoECAQQAQ&url=http%3A%2F%2Fcran.nexr.com%2Fweb%2Fpackages%2Foddsratio%2Foddsratio.pdf&usg=AOvVaw0qxr7JWySI00YuVy-1WAwU (accessed on 20 July 2022).
- Stefanini, G.G.; Chiarito, M.; Ferrante, G.; Cannata, F.; Azzolini, E.; Viggiani, G.; De Marco, A.; Briani, M.; Bocciolone, M.; Bragato, R.; et al. Early detection of elevated cardiac biomarkers to optimise risk stratification in patients with COVID-19. Heart 2020, 106, 1512–1518. [Google Scholar] [CrossRef] [PubMed]
- Clerkin, K.J.; Fried, J.A.; Raikhelkar, J.; Sayer, G.; Griffin, J.M.; Masoumi, A.; Jain, S.S.; Burkhoff, D.; Kumaraiah, D.; Rabbani, L.R.; et al. COVID-19 and Cardiovascular Disease. Circulation 2020, 141, 1648–1655. [Google Scholar] [CrossRef]
- Nishiga, M.; Wang, D.W.; Han, Y.; Lewis, D.B.; Wu, J.C. COVID-19 and cardiovascular disease: From basic mechanisms to clinical perspectives. Nat. Rev. Cardiol. 2020, 17, 543–558. [Google Scholar] [CrossRef] [PubMed]
- Rahban, M.; Stanek, A.; Hooshmand, A.; Khamineh, Y.; Ahi, S.; Kazim, S.N.; Ahmad, F.; Muronetz, V.; Abousenna, M.S.; Zolghadri, S.; et al. Infection of Human Cells by SARS-CoV-2 and Molecular Overview of Gastrointestinal, Neurological, and Hepatic Problems in COVID-19 Patients. J. Clin. Med. 2021, 10, 4802. [Google Scholar] [CrossRef] [PubMed]
- Tjendra, Y.; Al Mana, A.F.; Espejo, A.P.; Akgun, Y.; Millan, N.C.; Gomez-Fernandez, C.; Cray, C. Predicting Disease Severity and Outcome in COVID-19 Patients: A Review of Multiple Biomarkers. Arch. Pathol. Lab. Med. 2020, 144, 1465–1474. [Google Scholar] [CrossRef] [PubMed]
- San, I.; Gemcioglu, E.; Baser, S.; Cakmak, N.Y.; Erden, A.; Izdes, S.; Catalbas, R.; Davutoglu, M.; Karabuga, B.; Ates, I. Brescia-COVID Respiratory Severity Scale (BRCSS) and Quick SOFA (qSOFA) score are most useful in showing severity in COVID-19 patients. Sci. Rep. 2021, 11, 21807. [Google Scholar] [CrossRef]
- Kantroo, V.; Kanwar, M.S.; Goyal, P.; Rosha, D.; Modi, N.; Bansal, A.; Ansari, A.P.; Wangnoo, S.K.; Sobti, S.; Kansal, S.; et al. Mortality and Clinical Outcomes among Patients with COVID-19 and Diabetes. Med. Sci. 2021, 9, 65. [Google Scholar] [CrossRef]
- Henein, M.; Bytyçi, I.; Nicoll, R.; Shenouda, R.; Ayad, S.; Cameli, M.; Vancheri, F. Combined Cardiac Risk Factors Predict COVID-19 Related Mortality and the Need for Mechanical Ventilation in Coptic Clergy. J. Clin. Med. 2021, 10, 2066. [Google Scholar] [CrossRef]
- Mehra, M.R.; Desai, S.S.; Kuy, S.; Henry, T.D.; Patel, A.N. Cardiovascular Disease, Drug Therapy, and Mortality in Covid-19. N. Engl. J. Med. 2020, 382, e102. [Google Scholar] [CrossRef] [PubMed]
- Goodacre, S.; Thomas, B.; Sutton, L.; Burnsall, M.; Lee, E.; Bradburn, M.; Loban, A.; Waterhouse, S.; Simmonds, R.; Biggs, K.; et al. Derivation and validation of a clinical severity score for acutely ill adults with suspected COVID-19: The PRIEST observational cohort study. PLoS ONE 2021, 16, e0245840. [Google Scholar] [CrossRef] [PubMed]
- Duca, A.; Piva, S.; Foca, E.; Latronico, N.; Rizzi, M. Calculated Decisions: Brescia-COVID Respiratory Severity Scale (BCRSS)/Algorithm. Emerg. Med. Pract. 2020, 22, CD1–CD2. [Google Scholar] [PubMed]
- King, J.T.K., Jr.; Yoon, J.S.; Rentsch, C.T.; Tate, J.P.; Park, L.S.; Kidwai-Khan, F.; Skanderson, M.; Hauser, R.G.; Jacobson, D.A.; Erdos, J.; et al. Development and validation of a 30-day mortality index based on pre-existing medical administrative data from 13,323 COVID-19 patients: The Veterans Health Administration COVID-19 (VACO) Index. PLoS ONE 2020, 15, e0241825. [Google Scholar] [CrossRef]


| Variables, Units (N) (CAD/non-CAD) | Low Risk (0–1) | Medium Risk (2–3) | High Risk (≥4) | OMNIBUS p Value | p Value (For Post Hoc Analysis) | |||||
|---|---|---|---|---|---|---|---|---|---|---|
| Min–Max (N) or n/N (% of Risk Category) | Min–Max (N) or n/N (% of Risk Category) | Min–Max (N) or n/N (% of Risk Category) | ||||||||
| CAD | Non- CAD | CAD | Non- CAD | CAD | Non- CAD | CAD | Non- CAD | CAD | Non- CAD | |
| Demographics | ||||||||||
| Age, years (228/1955) | 67.92 ± 5.45 59–73 (12) | 50.96 ± 15.88 17–74 (1405) | 66.94 ± 6.95 49–84 (72) | 77.03 ± 11.77 29–100 (420) | 75.9 ± 9.65 38–93 (144) | 81.56 ± 8.11 43–100 (130) | <0.0001 | <0.0001 | 0.849 a 0.0008 b <0.0001 c | <0.0001 a,b,c |
| Male gender (228/1955) | 11/12 (91.67%) | 724/1405 (51.53%) | 52/72 (72.22) | 156/420 (37.14%) | 98/144 (68.06%) | 41/130 (31.54%) | 0.2188 | <0.0001 | N/A | <0.0001 a,b 0.8675 c |
| BMI kg/m2 (66/488) | 29.43 ± 6.99 24.49–34.37 (2) | 28.27 ± 5.07 15.36–49.38 (395) | 28.85 ± 4.14 22.6–35.16 (19) | 29.4 ± 5.98 18.59–47.75 (71) | 27.78 ± 4.88 16.41–38.97 (45) | 27.81 ± 7.59 17.28–48.21 (22) | 0.738 | 0.3172 | N/A | N/A |
| Obesity (BMI ≥30 kg/m2) (66/488) | 1/2 (50.0%) | 131/395 (33.17%) | 9/19 (47.37%) | 29/71 (40.85%) | 15/45 (33.33) | 6/22 (27.27%) | 0.805 | 0.4104 | N/A | N/A |
| Cigarette smoking never previous current (228/1955) | 12/12 (100%) 0/12 (0%) 0/12(0%) | 1325/1405 (94.31%)46/1405 (3.27%) 34/1405 (2.42%) | 58/72 (81.69%) 6/72 (8.45%) 7/72 (9.86%) | 373/420 (89.23%) 29/420 (6.94%) 16/420 (3.83%) | 105/144 (72.92%) 24/144 (16.67%) 15/144 (10.42%) | 113/130 (87.6%) 12/130 (9.3%) 4/130 (3.1%) | 0.2136 | 0.0005 | N/A | 0.0049 a 0.0138 b 1.0 c |
| Comorbidities | ||||||||||
| Hypertension (228/1955) | 0/12 (0%) | 415/1405 (29.54%) | 58/72 (80.56%) | 299/420 (71.19%) | 131/144 (90.97) | 118/130 (90.77%) | <0.0001 | <0.0001 | <0.0001 a,b 0.1424 c | <0.0001 a,b,c |
| DM (228/1955) | 3/12 (25.0%) | 205/1405 (14.6%) | 31/72 (43.06%) | 115/420 (27.39%) | 68/144 (47.22%) | 50/130 (38.46%) | 0.4607 | <0.0001 | N/A | <0.0001 a,b 0.2594 c |
| Atrial fibrillation/flutter (228/1955) | 1/12 (8.33%) | 48/1405 (3.42%) | 15/72 (20.83%) | 91/420 (21.67%) | 73/144 (50.69%) | 62/130 (47.69%) | <0.0001 | <0.0001 | 1.0 a 0.0158 b <0.0001 c | <0.0001 a,b,c |
| Previous coronary revascularization (228/1955) | 6/12 (50%) | 0/1405 (0%) | 37/72 (51.39%) | 0/420 (0%) | 111/144 (77.08%) | 0/130 (0%) | 0.0002 | <0.0001 | 1.0 a 0.2238 b 0.0005 c | <0.0001 a,b,c |
| Previous myocardial infarction (228/1955) | 11/12 (91.67%) | 0/1405 (0%) | 63/72 (87.5%) | 0/420 (0%) | 117/144 (81.25%) | 0/130 (0%) | 0.4723 | <0.0001 | N/A | <0.0001 a,b,c |
| Heart failure (228/1955) | 0/12 (0%) | 0/1405 (0%) | 6/72 (8.33%) | 47/420 (11.19%) | 112/144 (77.78%) | 90/130 (69.23%) | <0.0001 | <0.0001 | 1.0 a <0.0001 b,c | <0.0001 a,b,c |
| Moderate/severe valvular heart disease or previous valve heart surgery (228/1955) | 0/12 (0%) | 13/1405 (0.93%) | 6/72 (8.33%) | 26/420 (6.19%) | 29/144 (20.14) | 22.130 (16.92%) | 0.0227 | <0.0001 | 1.0 a 0.3738 b 0.0924 c | <0.0001 a,b 0.0016 c |
| Peripheral artery disease (228/1955) | 2/12 (16.67%) | 24/1405 (1.71%) | 6/72 (8.33%) | 25/420 (5.95%) | 35/144 (24.31%) | 8/130 (6.15%) | 0.0113 | <0.0001 | 0.9599 a 1.0 b 0.0159 c | <0.0001 a 0.0118 b 1.0 c |
| Previous stroke/TIA (228/1955) | 1/12 (8.33%) | 46/1405 (3.27%) | 11/72 (15.28%) | 48/420 (11.43%) | 37/144 (25.69%) | 21/130 (16.15%) | 0.1331 | <0.0001 | N/A | <0.0001 a,b 0.6124 c |
| Chronic kidney disease (228/1955) | 0/12 (0%) | 70/1405 (4.98%) | 16/72 (22.22%) | 54/420 (12.86%) | 54/144 (37.5%) | 37/130 (28.46%) | 0.0022 | <0.0001 | 0.3325 a 0.0256 b 0.0915 c | <0.0001 a,b 0.0002 c |
| Haemodialysis (228/1955) | 0/12 (0%) | 19/1405 (1.35%) | 8/72 (11.11%) | 12/420 (2.86%) | 15/144 (10.42%) | 4/130 (3.08%) | 0.7478 | 0.0488 | N/A | 0.1505 a 0.3709 b 1.0 c |
| Asthma (228/1955) | 0/12 (0%) | 54/1405 (3.84%) | 2/72 (2.78%) | 18/420 (4.29%) | 6/144 (4.17%) | 3/130 (3.85%) | 0.8207 | 0.9184 | N/A | N/A |
| COPD (228/1955) | 0/12 (0%) | 6/1405 (0.43%) | 3/72 (4.17%) | 22/420 (5.24%) | 21/144 (14.58%) | 23/130 (17.69%) | 0.0317 | <0.0001 | 1.0 a 1.0 b 0.0657 c | <0.0001 a,b,c |
| Hypothyroidism (228/1955) | 0/12 (0%) | 76/1405 (5.41%) | 6/72 (8.33%) | 62/420 (14.76%) | 22/144 (15.28%) | 42/130 (32.31%) | 0.4089 | <0.0001 | N/A | <0.0001 a,b 0.0003 c |
| Hyperthyroidism (228/1955) | 0/12 (0%) | 4/1405 (0.28%) | 2/72 (2.78%) | 8/420 (1.9%) | 5/144 (3.47%) | 2/130 (1.54%) | ||||
| Variables, Units (N) (CAD/non-CAD) | Low Risk (0–1) | Medium Risk (2–3) | High Risk (≥4) | OMNIBUS p Value | p Value (For Post Hoc Analysis) | |||||
|---|---|---|---|---|---|---|---|---|---|---|
| n/N (% of Risk Category) | n/N (% of Risk Category) | n/N (% of Risk Category) | ||||||||
| CAD | Non-CAD | CAD | Non-CAD | CAD | Non-CAD | CAD | Non-CAD | CAD | Non-CAD | |
| Treatment Applied before Hospitalization | ||||||||||
| ACEI (228/1955) | 1/12 (8.33%) | 115/1405 (8.19%) | 29/72 (40.28%) | 91/420 (21.67%) | 73/144 (50.69%) | 43/130 (33.08%) | 0.0109 | <0.0001 | 0.2096 a 0.0349 b 0.5797 c | <0.0001 a,b 0.0341 c |
| ARB (228/1955) | 0/12 (0%) | 76/1405 (5.41%) | 6/72 (8.33%) | 232/420 (7.62%) | 13/144 (9.03%) | 17/130 (13.08%) | 0.7769 | 0.0015 | N/A | 0.3519 a 0.0028 b 0.2494 c |
| MRA (228/1955) | 0/12 (0%) | 18/1405 (1.28%) | 9/72 (12.5%) | 24/420 (5.71%) | 29/144 (20.14%) | 20/130 (15.38%) | 0.113 | <0.0001 | N/A | <0.0001 a,b 0.0038 c |
| β-blocker (228/1955) | 3/12 (25.0%) | 194/1405 (13.81%) | 42/72 (58.33%) | 137/420 (32.62%) | 94/144 (65.28%) | 63/130 (48.46%) | 0.0203 | <0.0001 | 0.1727 a 0.0308 b 1.0 c | <0.0001 a,b 0.0045 c |
| Digitalis glycoside (228/1955) | 0/12 (0%) | 3/1405 (0.21%) | 1/72 (1.39%) | 5/420 (1.19%) | 4/144 (2.78%) | 6/130 (4.62%) | 0.7464 | <0.0001 | N/A | 0.0568 a <0.0001 b 0.0752 |
| Calcium channel blocker (non- dihydropyridines) (228/1955) | 0/12 (0%) | 11/1405 (0.78%) | 2/72 (2.78%) | 11/420 (2.62%) | 5/144 (3.47%) | 9/130 (6.92%) | 1.0 | <0.0001 | N/A | 0.0238 a <0.0001 b 0.924 c |
| Calcium channel blocker (dihydropyridines) (228/1955) | 0/12 (0%) | 103/1405 (7.33%) | 17/72 (23.61%) | 67/420 (15.95%) | 41/144 (28.47%) | 33/130 (25.38%) | 0.0707 | <0.0001 | N/A | <0.0001 a,b 0.0632 c |
| α-adrenergic blocker (228/1955) | 0/12 (0%) | 45/1405 (3.20%) | 9/72 (12.5%) | 25/420 (5.95%) | 23/144 (15.97%) | 16/130 (12.31%) | 0.3087 | <0.0001 | N/A | 0.453 a <0.0001 b 0.0793 c |
| Thiazide or thiazide-like diuretic (228/1955) | 0/12 (0%) | 68/1405 (4.84%) | 4/72 (5.56%) | 43/420 (10.24%) | 20/144 (13.89%) | 15/130 (11.54%) | 0.0915 | <0.0001 | N/A | 0.0003 a 0.0074 b 1.0 c |
| Loop diuretic (228/1955) | 0/12 (0%) | 39/1405 (2.78%) | 13/72 (18.06%) | 52/420 (12.38%) | 48/144 (33.33%) | 33/130 (25.38%) | 0.0038 | <0.0001 | 0.5945 a 0.0554 b 0.0729 c | <0.0001 a,b 0.0017 c |
| Statin (228/1955) | 3/12 (25.0%) | 100/1405 (7.12%) | 39/72 (54.17%) | 82/420 (19.52%) | 88/144 (61.11%) | 38/130 (29.23%) | 0.0441 | <0.0001 | 0.357 a 0.0988 b 1.0 c | <0.0001 a,b 0.0792 c |
| Acetylsalicylic acid (228/1955) | 2/12 (16.67) | 79/1405 (5.62%) | 37/72 (51.39%) | 58/420 (13.81%) | 56/144 (38.89%) | 26/130 (20.0%) | 0.0419 | <0.0001 a | 0.1645 a 0.668 b 0.3266 c | <0.0001 a,b 0.3457 c |
| LMWH (228/1955) | 3/12 (25%) | 71/1405 (5.05%) | 5/72 (6.94%) | 36/420 (8.57%) | 19/144 (13.19%) | 7/130 (5.38%) | 0.1309 | 0.0255 | N/A | 0.0301 a 1.0 b 0.958 c |
| VKA (228/1955) | 0/12 (0%) | 10/1405 (0.71% | 3/72 (4.17%) | 11/420 (2.62%) | 11/144 (7.64%) | 12/130 (9.23%) | 0.5573 | <0.0001 | N/A | 0.0092 a <0.0001 b 0.0121 c |
| NOAC (228/1955) | 0/12 (0%) | 18/1405 (1.28%) | 7/72 (9.72%) | 30/420 (7.14%) | 33/144 (22.92%) | 19/130 (14.62%) | 0.013 | <0.0001 | 1.0 a 0.2151 b 0.0743 c | <0.0001 a,b 0.0391 c |
| Insulin (228/1955) | 1/12 (8.33%) | 61/1405 (4.34%) | 6/72 (8.33%) | 23/420 (5.48%) | 26/144 (18.06%) | 14/130 (10.77%) | 0.1454 | 0.0051 | N/A | 1.0 a 0.0071 b 0.1703 c |
| Metformin (228/1955) | 2/12 (16.67%) | 102/1405 (7.26%) | 15/72 (20.83%) | 52/420 (12.38%) | 26/144 (18.06%) | 25/130 (19.23%) | 0.9147 | <0.0001 | N/A | 0.0039 a <0.0001 b 0.2052 c |
| SGLT2 inhibitor (228/1955) | 0/12 (0%) | 11/1405 (0.78%) | 2/72 (2.78%) | 5/420 (1.19%) | 5/144 (3.48%) | 4/130 (3.08%) | 1.0 | 0.0446 | N/A | 1.0 a 0.0964 b 0.678 c |
| Oral antidiabetics other than SGLT2 inh. and metformin (228/1955) | 0/12 (0%) | 27/1405 (1.92%) | 9/72 (12.5%) | 25/420 (5.95%) | 17/144 (11.81%) | 11/130 (8.46%) | 0.5948 | <0.0001 | 0.1727 a 0.0308 b 1.0 c | 0.0002 a 0.0005 b 0.9411 c |
| Proton pump inhibitor (228/1955) | 3/12 (25.0%) | 86/1405 (6.12%) | 22/72 (30.56%) | 53/420 (12.62%) | 51/144 (35.42%) | 35/130 (26.92%) | 0.676 | <0.0001 | N/A | <0.0001 a,b 0.0005 c |
| Oral corticosteroid (228/1955) | 0/12 (0%) | 62/1405 (4.41%) | 5/72 (6.94%) | 16/420 (4.52%) | 5/144 (3.47%) | 1/130 (0.77%) | 0.429 | 0.1303 | N/A | N/A |
| Immunosuppression other than corticosteroid (228/1955) | 0/12 (0%) | 49/1405 (3.49%) | 10/72 (13.89%) | 12/420 (2.86%) | 2/144 (1.39%) | 0/130 (0%) | 0.0007 | 0.0502 | 1.0 a 1.0 b 0.0011 c | 0.291 a 0.0836 b 0.00753 c |
| Variables, Units (N) (CAD/non-CAD) | Low Risk (0–1) | Medium Risk (2–3) | High Risk (≥4) | OMNIBUS p Value | p Value (For Post Hoc Analysis) | |||||
|---|---|---|---|---|---|---|---|---|---|---|
| Min–Max (N) or n/N (% of Risk Category) | Min–Max (N) or n/N (% of Risk Category) | Min–Max (N) or n/N (% of Risk Category) | ||||||||
| CAD | Non- CAD | CAD | Non- CAD | CAD | Non- CAD | CAD | Non- CAD | CAD | Non- CAD | |
| Patient-Reported Symptoms | ||||||||||
| Cough (228/1955) | 0/12 (0%) | 455/1405 (32.38%) | 20/72 (27.78%) | 104/420 (24.76%) | 35/144 (24.31%) | 34/130 (26.15%) | 0.1035 | 0.0066 | N/A | 0.0107 a 0.5212 b 1.0 c |
| Dyspnoea (228/1955) | 2/12 (16.67%) | 567/1405 0.36%) | 29/72 (40.28%) | 177/420 (42.14%) | 76/144 (52.78%) | 70/130 (53.85%) | 0.0216 | 0.0113 | 0.6381 a 0.1063 b 0.3366 c | 1.0 a 0.0114 b 0.0746 c |
| Chest pain (228/1955) | 0/12 (0%) | 102/1405 (7.26%) | 8/72 (11.11%) | 26/420 (6.19%) | 17/144 (11.81%) | 10/130 (7.69%) | 0.6279 | 0.723 | N/A | N/A |
| Hemoptysis (228/1955) | 0/12 (0%) | 9/1405 (0.65%) | 0/72 (0%) | 2/420 (0.48%) | 4/144 (2.78%) | 0/130 (0%) | 0.44 | 1.0 | N/A | N/A |
| Smell dysfunction (228/1955) | 0/12 (0%) | 61/1405 (4.34%) | 3/72 (4.17%) | 7/420 (1.67%) | 4/144 (2.78%) | 1/130 (0.77%) | 0.7877 | 0.0056 | N/A | 0.035 a 0.1726 b 1.0 c |
| Taste dysfunction (228/1955) | 0/12 (0%) | 49/1405 (3.49%) | 3/72 (4.17%) | 7/420 (1.67%) | 4/144 (2.78%) | 3/130 (2.31%) | 0.7877 | 0.1482 | N/A | N/A |
| Abdominal pain (228/1955) | 0/12 (0%) | 103/1405 (7.33%) | 3/72 (4.17%) | 23/420 (5.48%) | 8/144 (5.56%) | 9/130 (6.92%) | 0.8668 | 0.421 | N/A | N/A |
| Diarrhea (228/1955) | 0/12 (0%) | 75/1405 (5.34%) | 7/72 (9.72%) | 26/420 (6.19%) | 7/144 (4.86%) | 112/130 (9.23%) | 0.3583 | 0.1758 | N/A | N/A |
| Nausea/vomiting (228/1955) | 0/12 (0%) | 57/1405 (4.06%) | 6/72 (8.33%) | 21/420 (5.0%) | 6/144 (4.17%) | 8/130 (6.15%) | 0.3055 | 0.4267 | N/A | N/A |
| Measured vital signs | ||||||||||
| Body temperature °C (115/1070) | 37.8 ± 1.98 36.4–39.2 (2) | 37.06 ± 0.88 34.4–40.5 (807) | 36.98 ± 0.98 35.2–40.0 (41) | 36.92 ± 0.9 35.0–40.0 (194) | 37.03 ± 0.83 35.9–37.2 (72) | 36.83 ± 0.89 35.2–40.0 (69) | 0.8629 | 0.025 | N/A | 0.102 a 0.102 b 0.782 c |
| Heart rate beats/minute (196/1476) | 94.14 ± 23.58 70–140 (7) | 86.35 ± 15.57 48–160 (1038) | 82.6 ± 14.43 60–140 (60) | 84.4 ± 16.83 50–160 (327) | 83.79 ± 17.96 50–170 (129) | 85.88 ± 19.73 36–150 (111) | 0.4613 | 0.1793 | N/A | N/A |
| Respiratory rate breaths/minute (23/285) | 12 ± 0.0 12–12 (1) | 18.38 ± 5.77 12–50 (203) | 18.54 ± 4.63 12–30 (13) | 18.69 ± 5.66 12–45 (55) | 18.53 ± 4.25 12–30 (19) | 19.85 ± 7.13 12–50 (27) | N/A | 0.5836 | N/A | N/A |
| Systolic BP (196/1473) | 130.43 ± 16.3 108–150 (7) | 130.72 ± 21.3 60–240 (1033) | 134.63 ± 23.9 90–200 (59) | 134.17 ± 25.7 50–270 (326) | 133.97 ± 23.7 85–200 (130) | 135.11 ± 25.9 70–210 (114) | 0.8376 | 0.0301 | N/A | 0.072 a 0.192 b 0.941 c |
| Diastolic BP (196/1465) | 85.0 ± 7.35 75–97 (7) | 78.5 ± 12.7 40–150 (1030) | 78.83 ± 13.61 45–112 (59) | 77.91 ± 13.69 40–157 (321) | 75.04 ± 14.03 45–82.75 (130) | 76.61 ± 16.65 40–143 (114) | 0.0114 | 0.4284 | 0.19 a 0.025 b 0.188 c | N/A |
| SpO2 on room air, % (FiO2 = 21%) (129/1133) | 89.43 ± 6.8 80–99 (7) | 92.87 ± 7.13 48–100 (807) | 92.63 ± 4.68 81–99 (41) | 89.19 ± 10.17 50–100 (240) | 90.78 ± 7.92 60–99 (81) | 89.6 ± 9.1 50–99 (86) | 0.2165 | <0.0001 | N/A | <0.0001 a 0.005 b 0.935 c |
| Abnormalities detected during physical examination | ||||||||||
| Crackles (228/1955) | 1/12 (8.33%) | 153/1405 (10.89%) | 17/72 (23.61%) | 82/420 (19.52%) | 37/144 (25.69%) | 29/130 (22.31%) | 0.4817 | <0.0001 | N/A | <0.000 a 0.0006 b 1.0 c |
| Wheezing (228/1955) | 1/12 (8.33%) | 93/1405 (6.62%) | 8/72 (11.11%) | 48/420 (11.43%) | 42/144 (29.17%) | 27/130 (20.77%) | 0.0046 | <0.0001 | 1.0 a 0.5439 b 0.01 c | 0.0052 a <0.0001 b 0.0309 c |
| Pulmonary congestion (228/1955) | 1/12 (8.33%) | 183/1405 (13.02%) | 15/72 (20.83%) | 90/420 (21.43%) | 37/144 (25.69%) | 41/130 (31.54%) | 0.3884 | <0.0001 | N/A | <0.0001 a,b 0.0739 c |
| Peripheral edema (228/1955) | 1/12 (8.33%) | 75/1405 (5.34%) | 10/72 (13.89%) | 50/420 (11.91%) | 30/144 (20.83%) | 23/130 (17.69%) | 0.4135 | <0.0001 | N/A | <0.0001 a,b 0.3621 c |
Parameter (N) (CAD/ Non-CAD) | Time of Assessment | Units | Low Risk (0–1) | Medium Risk (2–3) | High Risk (≥4) | OMNIBUS p Value | p Value (For Post Hoc Analysis) | |||||
|---|---|---|---|---|---|---|---|---|---|---|---|---|
| Mean ± SD Min–Ma x(N) or n/N (% of Risk Category) | Mean ± SD Min–Ma x(N) or n/N (% of Risk Category) | Mean ± SD Min–Ma x(N) or n/N (% of Risk Category) | ||||||||||
| CAD | Non- CAD | CAD | Non- CAD | CAD | Non- CAD | CAD | Non-CAD | CAD | Non- CAD | |||
| Complete Blood Count (CBC) | ||||||||||||
| Leucocytes (226/1822) | On admission | ×103/µL | 6.93 ± 4.59 0.51–16.7 (12) | 9.0 ± 12.39 0.67–304.02 (1289) | 7.71 ± 3.49 1.24–20.53 (71) | 9.64 ± 12.34 0.51–215.97 (409) | 9.42 ± 8.97 1.83–10.91 (143) | 9.12 ± 6.7 1.19–58.49 (124) | 0.1152 | 0.6638 | N/A | N/A |
| Hemoglobin (226/1822) | On admission | g/dL | 12.25 ± 3.35 4.9–18 (12) | 13.28 ± 2.13 3.9–20.3 (1289) | 12.55 ± 2.43 6.8–17.0 (71) | 12.57 ± 2.3 4.5–18.9 (409) | 11.84 ± 2.41 5.3–18.8 (143) | 12.09 ± 2.56 5.3–17.9 (124) | 0.1566 | <0.0001 | N/A | <0.0001 a,b 0.153 c |
| Platelets (226/1822) | On admission | ×103/µL | 186.92 ± 8.08 58.0–326.0 (12) | 236.09 ± 108.6 0–1356.0 (1289) | 225.61 ± 121.3 16–735 (71) | 230.85 ± 112.7 3.0–740.0 (409) | 204.18 ± 81.0 8.0–243.5 (143) | 232.7 ± 103.45 15.0–578 (124) | 0.314 | 0.6934 | N/A | N/A |
| Acid–base balance in arterial blood gas | ||||||||||||
| pH (56/220) | On admission | 7.39 ± 0.12 7.26–7.49 (3) | 7.43 ± 0.08 7.04–7.58 (118) | 7.43 ± 0.05 7.35–7.51 (14) | 7.43 ± 0.07 7.1–7.54 (74) | 7.42 ± 0.07 7.26–7.54 (39) | 7.4 ± 0.08 7.09–7.52 (28) | 0.7113 | 0.2784 | N/A | N/A | |
| PaO2 (56/220) | On admission | 80.67 ± 2.56 78–83.1 (3) | 72.04 ± 27.6 12.8–100.0 (118) | 76.52 ± 19.84 45.4–100.0 (14) | 76.28 ± 51.32 28.3–100.0 (74) | 66.23 ± 30.97 23.7–100.0 (39) | 76.68 ± 38.78 32.8–100.0 (28) | 0.0316 | 0.7092 | 0.737 a 0.022 b 0.343 c | N/A | |
| PaCO2 (56/220) | On admission | 30.93 ± 2.6 28.4–33.6 (3) | 38.2 ± 10.33 20.2–82.4 (118) | 32.89 ± 6.05 20.9–46.5 (14) | 37.37 ± 9.8 23.0–79.4 (74) | 39.2 ± 11.98 19.7–88.4 (39) | 37.87 ± 9.44 25.0–74.9 (28) | 0.0193 | 0.858 | 0.663 a 0.014 b 0.04 c | N/A | |
| HCO3− standard (56/216) | On admission | mmol/L | 20.23 ± 4.45 15.1–23.6 (3) | 25.03 ± 3.68 12.1–32.9 (117) | 23.05 ± 4.08 15.9–31.8 (14) | 24.63 ± 4.19 14.3–39.5 (71) | 24.64 ± 4.56 17.0–38.6 (39) | 23.47 ± 4.58 13.5–31.7 (28) | 0.2826 | 0.2431 | N/A | N/A |
| Lactates (53/192) | On admission | 2.23 ± 0.85 1.6–3.2 (3) | 2.46 ± 1.62 0.6–12.8 (102) | 2.26 ± 0.74 1.2–3.8 (13) | 21.97 ± 0.88 0.5–5.7 (66) | 2.46 ± 1.37 0.8–5.9 (37) | 2.6 ± 2.39 0.6–12.0 (24) | 0.8139 | 0.0319 | N/A | 0.031 a 0.963 b 0.433 c | |
| Electrolytes, inflammatory and iron biomarkers | ||||||||||||
| Na+ (225/1805) | On admission | mmol/L | 137.17 ± 4.9 128–146 (12) | 138.27 ± 4.35 106.0–159.0 (1276) | 136.41 ± 4.98 121–151 (70) | 137.97 ± 7.27 101.0–175.0 (405) | 137.79 ± 5.59 119–163 (143) | 138.08 ± 8.06 108.0–174.0 (124) | 0.2145 | 0.709 | N/A | N/A |
| K+ (225/1812) | On admission | mmol/L | 4.27 ± 0.62 3.29–5.7 (12) | 4.06 ± 0.58 2.0–7.5 (1281) | 4.14 ± 0.76 2.42 ± 7.03 (70) | 4.14 ± 0.69 2.4–6.8 (407) | 4.38 ± 0.89 2.97–8.7 (143) | 4.19 ± 0.73 2.53–6.9 (124) | 0.1606 | 0.0293 | N/A | 0.115 a 0.119 b 0.707 c |
| CRP (225/1793) | On admission | mg/L | 70.75 ± 75.51 0.32–207.32 (12) | 76.52 ± 84.59 0.13–531.58 (1262) | 77.9 ± 70.03 0.75–293.49 (70) | 84.1 ± 89.21 0.29–538.55 (407) | 80.12 ± 88.44 0.4–390.94 (143) | 72.11 ± 72.35 0.4–365.22 (124) | 0.9163 | 0.2163 | N/A | N/A |
| On discharge | 92.64 ± 124.21 0.32–418.16 (12) | 44.84 ± 78.56 0.13–496.98 (1262) | 71.94 ± 106.15 0.22–447.61 (70) | 72.72 ± 92.46 0.25–538.55 (407) | 82.67 ± 92.23 0.4–431.9 (143) | 63.7 ± 78.51 0.42–365.22 (124) | 0.7315 | <0.0001 | N/A | <0.0001 a 0.084 b 0.532 c | ||
| Procalcitonin (179/1294) | On admission | ng/mL | 0.64 ± 0.9 0.03–2.61 (7) | 0.84 ± 4.49 0.01–61.28 (911) | 0.92 ± 2.59 0.02–14.84 (56) | 2.01 ± 13.09 0.01–196.04 (288) | 1.71 ± 5.9 0.01–49.83 (116) | 1.2 ± 6.37 0.01–60.77 (95) | 0.2649 | 0.2995 | N/A | N/A |
| IL-6 (68/633) | On admission | pg/mL | 37.93 ± 16.7 20.1–53.2 (3) | 61.44 ± 425.64 2.0–9099.0 (477) | 73.5 ± 101.87 3.02–499 (25) | 36.79 ± 50.49 2.0–398.0 (118) | 69.8 ± 95.29 2.0–369 (40) | 54.56 ± 96.68 2.0–421.0 (38) | 0.13.02 | 0.2889 | N/A | N/A |
| D-dimer (176/1402) | On admission | µg/mL | 8.97 ± 23.93 0.41–80.91 (11) | 3.67 ± 12.0 0.15–132.82 (991) | 5.41 ± 17.27 0.29–95.86 (57) | 6.69 ± 16.68 0.2–127.24 (316) | 7.01 ± 21.08 0.22–128.0 (108) | 3.62 ± 11.41 0.24–107.54 (95) | 0.8225 | 0.012 | N/A | 0.009 a 0.999 b 0.104 c |
| INR (213/1710) | On admission | 1.09 ± 0.11 0.97–1.33 (12) | 1.14 ± 0.48 0.82–15.2 (1215) | 1.19 ± 0.21 0.96–1.89 (67) | 1.27 ± 0.64 0.87–7.8 (378) | 1.8 ± 2.59 0.9–21.1 (134) | 1.75 ± 2.27 0.89–18.74 (117) | 0.0017 | <0.0001 | 0.055a 0.005b 0.02c | 0.0006 a 0.011 b 0.065 c | |
| aPTT (207/1659) | On admission | >60 s | 1/12 (8.33%) | 27/1179 (2.29%) | 0/66 (0%) | 7/365 (1.92%) | 6/129 (4.65%) | 5/115 (4.35%) | 0.0879 | 0.2943 | N/A | N/A |
| Biochemistry | ||||||||||||
| Glucose (211/1547) | On admission | mg/dL | 134.33 ± 59.96 83–307 (12) | 134.85 ± 75.07 28.0–933.0 (1051) | 174.7 ± 108.24 63–554 (64) | 147.21 ± 28.53 47.0–1026 (385) | 153.33 ± 107.47 37–1064 (135) | 147.31 ± 87.18 49.0–685.0 (111) | 0.1884 | 0.0278 | N/A | 0.04 a 0.319 b 1.0 c |
| HbA1c (50/213) | On admission | % | 7.4 ± 0 7.4–7.4 (1) | 7.61 ± 2.32 4.2–14.9 (126) | 7.89 ± 2.61 5.6–16.6 (17) | 7.44 ± 2.06 4.8–14.9 (58) | 7.56 ± 1.93 5.1–13.7 (32) | 6.94 ± 1.54 5.3–11.4 (29) | N/A. | 0.1712 | N/A. | N/A |
| Urea (217/1640) | On admission | mg/dL | 60.58 ± 42.36 30–179 (12) | 42.65 ± 35.86 5.0–307.0 (1133) | 62.46 ± 48.71 17–271 (67) | 63.78 ± 49.67 8.0–353.0 (388) | 76.67 ± 57.07 17–369 (138) | 77.92 ± 49.74 12.0–256.0 (119) | 0.1519 | <0.0001 | N/A | <0.0001 a,b 0.033 c |
| Creatinine (225/1736) | On admission | 2.0 ± 2.84 0.51–10.84 (12) | 1.14 ± 1.15 0.26–14.87 (1204) | 1.93 ± 2.02 0.58–12.66 (70) | 1.37 ± 1.12 0.48–9.56 (408) | 1.91 ± 1.63 0.46–11.3 (143) | 1.7 ± 1.53 0.44–9.49 (124) | 0.9915 | <0.0001 | N/A | 0.001 a 0.0004 b 0.074 c | |
| On discharge | 1.05 ± 0.41 0.55–2.06 (12) | 1.08 ± 1.06 0.26–14.87 (1204) | 1.97 ± 2.21 0.43–12.35 (70) | 1.34 ± 1.13 0.45–9.09 (408) | 1.79 ± 1.44 0.43–8.24 (143) | 1.51 ± 1.4 0.43–9.27 (124) | <0.0001 | <0.0001 | 0.006a 0.0002b 0.871 c | <0.0001 a 0.003 b 0.455 c | ||
| eGFR (225/1731) | On admission | ml/min/1.73 m2 | 75.33 ± 46.57 5.0–170.0 (12) | 85.11 ± 34.19 0–433.0 (1199) | 60.4 ± 33.5 4.0–149.0 (70) | 62.29 ± 27.91 4–137.0 (408) | 52.52 ± 30.09 5.0–180.0 (143) | 52.66 ± 28.92 5.0–145.0 (124) | 0.1024 | <0.0001 | N/A | <0.0001 a,b 0.004 c |
| On discharge | 86.5 ± 36.14 26.0–156.0 (12) | 89.37 ± 34.73 0–433.0 (1199) | 65.84 ± 38.38 4.0–208.0 (70) | 65.37 ± 29.56 4.0–172.0 (408) | 56.97 ± 34.53 5.0–209.0 (143) | 60.07 ± 31.49 5.0–183.0 (124) | 0.0209 | <0.0001 | 0.198a 0.043b 0.234c | <0.0001 a,b 0.222 c | ||
| Total protein (96/510) | On admission | g/L | 5.17 ± 1.23 3.8–6.3 (3) | 6.07 ± 0.84 3.5–8.2 (328) | 6.25 ± 0.96 4.3–9.5 (24) | 5.88 ± 0.9 3.6–8.7 (128) | 5.84 ± 0.8 3.6–8.2 (69) | 5.61 ± 0.95 3.3–8.1 (54) | 0.2224 | 0.0017 | N/A | 0.098 a 0.004 b 0.186 c |
| Albumin (110/553) | On admission | g/L | 3.0 ± 0.2 2.8–3.2 (3) | 3.17 ± 0.6 1.5–5.1 (371) | 3.23 ± 0.52 2.1–4.4 (32) | 3.07 ± 0.56 1.1–4.3 (128) | 3.08 ± 0.57 1.7–4.9 (75) | 2.82 ± 0.63 0.7–3.9 (54) | 0.3433 | 0.0006 | N/A | 0.231 a 0.0008 b 0.032 c |
| AST (178/1263) | On admission | IU/L | 46.29 ± 40.36 12–124 (7) | 60.24 ± 114.4 5.0–2405.0 (876) | 61.11 ± 56.3 7–260 (57) | 67.56 ± 281.4 8.0–4776.0 (290) | 84.99 ± 365.37 10–3866 (114) | 88.15 ± 271.86 8.0–2518.0 (97) | 0.5289 | 0.5613 | N/A | N/A |
| ALT (193/1395) | On admission | IU/L | 62.1 ± 64.15 15–236 (10) | 54.85 ± 93.11 4.0–1411.0 (962) | 44.71 ± 38.95 4–193 (63) | 49.87 ± 206.79 5.0–3700.0 (328) | 45.28 ± 133.71 8–1361 (120) | 58.43 ± 154.44 5.0–1315.0 (105) | 0.7162 | 0.8697 | N/A | N/A |
| LDH (141/1090) | On admission | U/L | 345.67 ± 169.25 123.0–575.0 (6) | 430.64 ± 379.34 50.0–7100.0 (770) | 445.65 ± 255.92 119–1172.0 (46) | 380.85 ± 188.63 44.0–1357.0 (240) | 400.87 ± 258.01 71.0–1863.0 (89) | 487.93 ± 1035.15 106.0–9505.0 (80) | 0.4289 | 0.0208 | N/A | 0.018 a 0.876 b 0.629 c |
| Cardiac biomarkers | ||||||||||||
| NT-proBNP (80/299) | On admission | ng/mL | 917.1 ± 0 917.1–917.1 (1) | 1894.45± 7801.53 12.0–70,000.0 (171) | 12,180.61 ± 20,072.57 290–70,000 (15) | 7893.21 ± 13,570.58 18.2–70,000.0 (94) | 15,093.74 ± 20,598.65 391.3–70,000 (64) | 12,292.06 ± 15,896.88 119.6–68,915.1 (34) | N/A | <0.0001 | N/A | 0.0004 a 0.002 b 0.331 c |
| Troponin I (159/1015) | On admission | 180.8 ± 219.75 8.1–542.5 (8) | 136.11 ± 812.42 0–11,758.2 (670) | 4399.36 ± 20,128.72 2.4–125,592.6 (44) | 1252.73 ± 9482.42 1.0–109,359.5 (261) | 898.68 ± 2864.92 3.9–21,022.9 (107) | 587.21 ± 2311.75 3.3–18,309.3 (84) | 0.0215 | 0.0376 | 0.355a 0.037b 0.49c | 0.141 a 0.184 b 0.551 c | |
| ≤3-fold upper range K 46.8 M 102.6 | 5/8 (62.5%) | 560/670 (83.58%) | 33/44 (75.0%) | 176/261 (67.43%) | 65/107 (60.75%) | 46/84 (54.76%) | 0.2519 | <0.0001 | N/A | <0.0001 a,b 0.1438c | ||
| >3-fold upper range K 46.8 M 102.6 | 3/8 (37.5%) | 110/670 (16.42%) | 11/44 (25.0%) | 85/261 (32.57%) | 42/107 (39.25%) | 38/84 (45.24%) | ||||||
| On discharge | 184.61 ± 227.67 8.1–542.5 (8) | 116.05 ± 831.78 0.2–12,391.6 (670) | 1662.07 ± 6227.21 2.6–36,541.1 (44) | 1898.37 ± 14,149.34 0.8–174,652.6 (261) | 825.42 ± 3224.71 3.9–29,828.3 (107) | 455.98 ± 2095.43 1.8–18,309.3 (84) | 0.0493 | 0.0465 | 0.27 a 0.119 b 0.676 c | 0.106 a 0.309 b 0.25 c | ||
| LDL-cholesterol (76/373) | mg/dL | 70.33 ± 30.09 51–105 (3) | 100.46 ± 51.02 6.0–510.0 (229) | 73.12 ± 33.82 17–143 (26) | 90.7 ± 41.52 23.0–230.0 (103) | 69.57 ± 45.91 6.0–210.0 (47) | 80.88 ± 37.36 14.0–187.0 (41) | 0.9378 | 0.0113 | 0.52 a 0.019 b 0.219 c | 0.159 a 0.013 b 0.357 c | |
| HDL-cholesterol (73/378) | mg/dL | 31.33 ± 11.02 24–44 (3) | 40.09 ± 16.12 2.0–120.0 (233) | 35.12 ± 11.02 16–56 (25) | 41.4 ± 16.05 7.0–110.0 (104) | 37.04 ± 15.52 17–79.0 (45) | 37.39 ± 14.56 8.0–72.0 (41) | 0.6916 | 0.3563 | N/A | N/A | |
| Triglycerides (104/535) | mg/dL | 90.5 ± 0.71 90–91 (2) | 179.56 ± 124.26 40.0–1100.0 (357) | 153.53 ± 104.59 61–550 (34) | 142.09 ± 94.45 48.0–595.0 (130) | 129.6 ± 66.52 46–413 (68) | 128.63 ± 54.86 51.0–282.0 (48) | <0.0001 | <0.0001 | 0.004 a <0.0001 b 0.45 c | 0.001 a <0.0001 b 0.47 c | |
| Hormones | ||||||||||||
| TSH (114/706) | mIU/L | 2.23 ± 3.22 0.28–5.94 (3) | 1.34 ± 1.52 0–18.6 (438) | 1.53 ± 1.92 0.01–10.26 (38) | 1.56 ± 2.56 0.01–28.81 (194) | 1.5 ± 1.63 0–11.16 (73) | 2.86 ± 5.27 0–38.24 (74) | 0.9333 | 0.0317 | N/A | 0.511 a 0.042 b 0.109 c | |
| Variables, Units (N) (CAD/non-CAD) | Low Risk (0–1) | Medium Risk (2–3) | High Risk (>4) | OMNIBUS p Value | p Value (For Post Hoc Analysis) | |||||
|---|---|---|---|---|---|---|---|---|---|---|
| n/N (% of Risk Category) | n/N (% of Risk Category) | n/N (% of Risk Category) | ||||||||
| CAD | Non- CAD | CAD | Non- CAD | CAD | Non- CAD | CAD | Non- CAD | CAD | Non- CAD | |
| Applied Treatment and Procedures | ||||||||||
| Systemic corticosteroid (228/1955) | 7/12 (58.33%) | 701/1405 (49.89%) | 42/72 (58.33%) | 204/420 (48.57%) | 75/144 (52.08%) | 67/130 (51.54%) | 0.6586 | 0.8145 | N/A | N/A |
| Convalescent plasma (228/1955) | 2/12 (16.67%) | 165/1405 (11.74%) | 10/72 (13.89%) | 31/420 (7.38%) | 17/144 (11.81%) | 14/130 (10.77%) | 0.6959 | 0.0404 | N/A | 0.0436a 1.0 b 0.8831 c |
| Tocilizumab (228/1955) | 0/12 (0%) | 22/1405 (1.57%) | 0/72 (0%) | 2/420 (0.48%) | 0/144 (0%) | 1/130 (0.77%) | 1.0 | 0.1866 | N/A | N/A |
| Remdesivir (228/1955) | 2/12 (16.67%) | 234/1405 (16.65%) | 10/72 (13.89%) | 62/420 (14.76%) | 22/144 (15.28%) | 13/130 (10.0%) | 0.9042 | 0.1109 | N/A | N/A |
| Antibiotic (228/1955) | 8/12 (66.67%) | 738/1405 (52.53%) | 52/72 (72.22%) | 251/420 (59.76%) | 107/144 (74.31%) | 84/130 (64.62%) | 0.765 | 0.0023 | N/A | 0.0318a 0.0321b 1.0 c |
| Low Risk (0–1) n/N | Medium Risk (2–3) n/N | High Risk (≥4) n/N | OMNIBUS p Value | p Value (For Post Hoc Analysis) | ||||||
|---|---|---|---|---|---|---|---|---|---|---|
| Mean ± SD Min–Max (N) or n/N (% of Risk Category) | Mean ± SD Min–Max (N) or n/N (% of Risk Category) | Mean ± SD Min–Max (N) or n/N (% of Risk Category) | ||||||||
| CAD | Non- CAD | CAD | Non- CAD | CAD | Non- CAD | CAD | Non- CAD | CAD | Non- CAD | |
| Applied Treatment and Procedures | ||||||||||
| The most advanced respiratory support during hospitalization: no oxygen (228/1952) Low-flow oxygen support (228/1952) High-flow nasal cannula non-invasive ventilation (228/1952) Invasive ventilation (228/1952) | 5/12 (41.67%) 2/12 (16.67%) 2/12 (16.67%) 2/12 (16.67%) | 736/1403 (52.46%) 449/1403 (32.0%) 63/1403 (4.49%) 139/1403 (9.91%) | 30/72 (41.67%) 23/72 (31.94%) 4/72 (5.56%) 14/72 (19.44%) | 172/419 (41.05%) 165/419 (39.38%) 35/419 (8.35%) 35/419 (8.35%) | 43/144 (29.86%) 59/144 (40.97%) 18/144 (12.5%) 16/144 (11.11%) | 46/130 (35.38%) 65/130 (50.0%) 9/130 (6.92%) 6/130 (4.62%) | 0.0799 | <0.0001 | N/A | <0.0001a,b 0.7256 c |
| Oxygenation parameters during qualification for advanced respiratory support: SpO2% (68/563) | 92 ± 0 92–92 (1) | 90.63 ± 7.89 50–100 (409) | 86.82 ± 8.05 72–97 (17) | 86.45 ± 9.97 55–99 (116) | 84.97 ± 10.9 59–99 (50) | 86.39 ± 8.65 65–99 (38) | N/A | <0.0001 | N/A | 0.0002a 0.016b 0.999 c |
| Therapy with catecholamines (228/1955) | 1/12 (8.33%) | 130/1405 (9.25%) | 11/72 (15.28%) | 34/420 (8.1%) | 26/144 (18.06%) | 16/130 (12.31%) | 0.7869 | 0.3465 | N/A | |
| Coronary revascularization or/and an indication for coronary revascularization (228/1955) | 0/12 (0%) | 10/1405 (0.71%) | 3/72 (4.17%) | 9/420 (2.14%) | 7/144 (4.86%) | 2/130 (1.54%) | 1.0 | 0.0343 | N/A | 0.0697a 0.8105 b 1.0 c |
| Hemodialysis (228/1955) | 0/12 (0%) | 46/1405 (3.27%) | 5/72 (6.94%) | 8/420 (1.9%) | 10/144 (6.94%) | 2/130 (1.54%) | 1.0 | 0.269 | N/A | N/A |
| Variables, Units (N) (CAD/non-CAD) | Low Risk (0–1) | Medium Risk (2–3) | High Risk (≥4) | OMNIBUS p Value | p Value (For Post Hoc Analysis) | |||||
|---|---|---|---|---|---|---|---|---|---|---|
| n/N (% of Risk Category) | n/N (% of Risk Category) | n/N (% of Risk Category) | ||||||||
| CAD | Non- CAD | CAD | Non- CAD | CAD | Non- CAD | CAD | Non- CAD | CAD | Non- CAD | |
| All-Cause Mortality Rate | ||||||||||
| In-hospital mortality (228/1955) | 4/12 (33.33%) | 115/1405 (8.19%) | 15/72 (20.83%) | 95/420 (22.62%) | 62/144 (43.06%) | 35/130 (26.92%) | 0.0038 | <0.0001 | 1.0 a 1.0 b 0.0044 c | <0.0001a,b 1.0 c |
| 3-month mortality (228/1955) | 5/12 (41.67%) | 197/1405 (14.02%) | 24/72 (33.33%) | 174/420 (41.43%) | 81/144 (56.25%) | 66/130 (50.77%) | 0.0058 | <0.0001 | 1.0 a 1.0 b 0.0073 c | <0.0001a,b 0.2275 c |
| 6-month mortality (228/1955) | 5/12 (55.56%) | 209/1405 (24.36%) | 26/72 (42.62%) | 182/420 (56.35%) | 85/144 (65.89%) | 71/130 (64.55%) | 0.0085 | <0.0001 | 1.0 a 1.0 b 0.0085 c | <0.0001a,b 0.4891 c |
| Total Death | |||
|---|---|---|---|
| HR | 95% CI | p Value | |
| Overall | 1.1494 | 1.0340–1.2776 | 0.0099 |
| Risk Strata | |||
| Low vs. medium risk | 0.7874 | 0.3038–2.0407 | 0.6228 |
| Low vs. high risk | 1.4685 | 0.5961–3.6177 | 0.4035 |
| Total Death | |||
|---|---|---|---|
| HR | 95% CI | p Value | |
| Overall | 1.4764 | 1.4038–1.5527 | <0.0001 |
| Risk Strata | |||
| Low vs. medium risk | 3.5959 | 2.9546–4.3764 | <0.0001 |
| Low vs. high risk | 4.8465 | 3.7188–6.3163 | <0.0001 |
| Component | HR | CI Min. | CI Max. | p Value | |
|---|---|---|---|---|---|
| All-cause mortality | Coronary artery disease | N/A | N/A | N/A | N/A |
| COPD | 1.1924 | 0.6803 | 2.0899 | 0.5388 | |
| Age > 75 | 1.7757 | 1.2366 | 2.5499 | 0.0019 | |
| Thyroid disease | 0.7839 | 0.4726 | 1.3003 | 0.3457 | |
| Hypertension | 0.8471 | 0.5337 | 1.3445 | 0.4814 | |
| HFrEF | 1.2207 | 0.8390 | 1.7760 | 0.2972 |
| Component | HR | CI Min. | CI Max. | p Value | |
|---|---|---|---|---|---|
| All-cause mortality | Coronary artery disease | N/A | N/A | N/A | N/A |
| COPD | 1.7620 | 1.1896 | 2.6098 | 0.0047 | |
| Age > 75 | 2.9460 | 2.4086 | 3.6033 | <0.0001 | |
| Thyroid disease | 0.7333 | 0.5298 | 1.0149 | 0.0614 | |
| Hypertension | 1.4256 | 1.1666 | 1.7422 | 0.0005 | |
| HFrEF | 1.7073 | 1.3160 | 2.2149 | 0.0001 |
| h2 | h3 | h4 | h5 | h6 | h7 | h8 | |
|---|---|---|---|---|---|---|---|
| m1 | 0.4262 | 2.7269 | 2.9888 | 2.2412 | 1.26 | −0.0248 | N/A |
| m2 | 7.9148 | 9.2053 | 5.0264 | 1.6577 | 0.1843 | 0.4262 | |
| m3 | 9.2833 | 8.8761 | 7.576 | 7.6551 | 2.7269 | ||
| m4 | 9.5121 | 8.9332 | 9.3478 | 2.9888 | |||
| m5 | 5.6817 | 5.9157 | 2.2412 | ||||
| m6 | 2.1085 | 1.2600 | |||||
| m7 | −0.0248 |
| h2 | h3 | h4 | h5 | h6 | h7 | h8 | |
|---|---|---|---|---|---|---|---|
| m1 | 237.344 | 193.6023 | 170.6614 | 158.5977 | 132.5961 | 11.5029 | 11.5029 |
| m2 | 226.8814 | 232.9099 | 232.4957 | 225.913 | 15.0212 | 15.0212 | |
| m3 | 151.9224 | 151.6698 | 146.3188 | 12.0786 | 12.0786 | ||
| m4 | 79.4099 | 79.9497 | 8.8469 | 8.8469 | |||
| m5 | 53.0824 | 7.0857 | 7.0857 | ||||
| m6 | 1.3654 | 1.3654 | |||||
| m7 | 2.769 |
| Variables, Units (N) (CAD/non-CAD) | Low Risk (0–1) | Medium Risk (2–3) | High Risk (≥4) | OMNIBUS p Value | p Value (For Post Hoc Analysis) | |||||
|---|---|---|---|---|---|---|---|---|---|---|
| Mean ± SD Min–Ma x(N) or n/N (% of Risk Category) | Mean ± SD Min–Ma x(N) or n/N (% of Risk Category) | Mean ± SD Min–Ma x(N) or n/N (% of Risk Category) | ||||||||
| CAD | Non-CAD | CAD | Non-CAD | CAD | Non-CAD | CAD | Non-CAD | CAD | Non-CAD | |
| Hospitalization | ||||||||||
| Duration of hospitalization, days (228/1955) | 6.67 ± 5.43 1–16 (12) | 11.53 ± 13.7 1–131 (1405) | 13.86 ± 13.32 1–69 (72) | 13.06 ± 13.66 1–124 (420) | 15.39 ± 15.52 1–121 (144) | 16.85 ± 16.29 1–87 (130) | 0.0003 | 0.0005 | 0.007 a 0.0005 b 0.733 c | 0.109 a 0.001 b 0.045 c |
| Admission to ICU (228/1955) | 1/12 (8.33%) | 149/1405 (10.61%) | 11/72 (15.28%) | 27/420 (6.43%) | 19/144 (13.19%) | 8/130 (6.15%) | 0.8945 | 0.0154 | N/A | 0.043 a 0.440 b 1.0 c |
| End of hospitalization death (228/1955) Discharge to home—full recovery Transfer to another hospital—worsening Transfer to another hospital—in recovery | 4/12 (33.33%) 3/12 (25.0%) 3/12 (25.0%) 2/12 (16.67%) | 115/1405 (8.18%) 990/1405 (70.46%) 136/1405 (9.68%) 164/1405 (11.67%) | 15/72 (20.83%) 40/72 (55.56%) 29/72 (12.5%) 8/72 (11.11%) | 95/420 (22.62%) 180/420 (42.86%) 788/420 (20.95%) 57/420 (13.57%) | 62/144 (43.06%) 45/144 (31.25%) 20/144 (13.89%) 17/144 (11.81%) | 35/130 (25.92%) 58/130 (44.62%) 24/130 (18.46%) 13/130 (10.0%) | 0.0076 | <0.0001 | 0.5166 a 1.0 b 0.0082 c | <0.0001 a,b 1.0 c |
| Aborted cardiac arrest (228/1955) | 1/12 (8.33%) | 14/1405 (0.99%) | 1/72 (1.39%) | 2/420 (0.48%) | 4/144 (2.78%) | 2/130 (1.53%) | 0.3288 | 0.4044 | N/A | N/A |
| Shock (228/1955) | 0/12 (0%) | 108/1405 (7.69%) | 9/72 (12.5%) | 37/420 (8.81%) | 19/144 (13.19%) | 14/130 (10.77%) | 0.5706 | 0.3984 | N/A | N/A |
| Hypovolemic shock (228/1955) | 0/12 (0%) | 22/1405 (1.57%) | 0/72 (0%) | 7/420 (1.67%) | 0/144 (0%) | 6/130 (4.62%) | <0.0001 | 0.0574 | <0.0001 a,b,c | N/A |
| Cardiogenic shock (228/1955) | 0/12 (0%) | 7/1405 (0.5%) | 2/72 (2.78%) | 9/420 (2.14%) | 9/144 (6.25%) | 5/130 (3.85%) | 0.5501 | 0.0002 | N/A | 0.012 a 0.0059 b 1.0 c |
| Septic shock (228/1955) | 0/12 (0%) | 88/1405 (6.26%) | 6/72 (8.33%) | 24/420 (5.71%) | 16/144 (11.11%) | 6/130 (4.62%) | 0.6393 | 0.7163 | N/A | N/A |
| Pulmonary embolism (228/1955) | 0/12 (0%) | 78/1405 (5.55%) | 1/72 (1.39%) | 27/420 (6.43%) | 8/144 (5.55%) | 7/130 (5.38%) | 0.6343 | 0.931 | N/A | N/A |
| Myocardial infarction (228/1955) | 0/12 (0%) | 8/1405 (0.57%) | 2/72 (2.78%) | 8/420 (1.9%) | 5/144 (3.47%) | 3/130 (2.31%) | 1.0 | 0.0096 | N/A | 0.0487 a 0.1775 b 1.0 c |
| Myocardial injury (159/1015) | 3/8 (37.5%) | 110/670 (16.42%) | 13/44 (29.55%) | 85/261 (32.57%) | 49/107 (45.79%) | 38/84 (45.24%) | 0.1696 | <0.0001 | N/A | <0.0001 a,b 0.1438 c |
| Acute heart failure (228/1955) | 1/12 (8.33%) | 7/1405 (0.5%) | 0/72 (0%) | 22/420 (5.24%) | 27/144 (18.75%) | 19/130 (14.62%) | <0.0001 | <0.0001 | 0.4286 a 1.0 b <0.0001 c | <0.0001 a,b 0.0027 c |
| Stroke/TIA (228/1955) | 0/12 (0%) | 18/1405 (1.28%) | 3/72 (4.17%) | 16/420 (3.81%) | 4/144 (2.78%) | 3/130 (2.31%) | 0.7877 | 0.004 | N/A | 0.0052 a 1.0 b,c |
| New cognitive disorders (228/1955) | 0/12 (0%) | 38/1405 (2.7%) | 3/72 (4.17%) | 48/420 (11.43%) | 17/144 (11.81%) | 15/130 (11.54%) | 0.1059 | <0.0001 | N/A | <0.0001 a,b 1.0 c |
| Pneumonia (228/1955) | 5/12 (41.67%) | 670/1405 (48.19%) | 39/72 (54.17%) | 266/420 (63.33%) | 99/144 (68.75%) | 87/130 (66.92%) | 0.0358 | <0.0001 | 1.0 a 0.3187 b 0.1 c | <0.0001 a 0.0002 b 1.0 c |
| Complete respiratory failure (56/220) | 1/3 (33.33%) | 56/118 (47.46%) | 7/14 (50.0%) | 39/74 (52.7%) | 30/39 (76.92%) | 13/28 (46.43%) | 0.0824 | 0.7439 | N/A | N/A |
| SIRS (228/1886) | 2/12 (16.67%) | 140/1340 (10.45%) | 4/72 (5.56%) | 38/417 (9.11%) | 19/144 (13.19%) | 17/129 (13.18%) | 0.1331 | 0.4035 | N/A | N/A |
| Sepsis (91/793) | 0/2 (0%) | 9/574 (1.57%) | 1/28 (3.57%) | 6/155 (3.87%) | 2/61 (3.28%) | 5/64 (7.81%) | 1.0 | 0.0077 | N/A | 0.3098 a 0.0256 b 0.9164 c |
| Acute kidney injury (228/1955) | 0/12 (0%) | 110/1405 (7.83%) | 13/72 (18.06%) | 54/420 (12.86%) | 38/144 (26.39%) | 21/130 (16.15%) | 0.053 | 0.0002 | N/A | 0.0065 a 0.0061 b 1.0 c |
| Acute liver dysfunction (216/1758) | 0/12 (0%) | 30/1244 (2.41%) | 2/68 (2.94%) | 20/397 (5.04%) | 9/136 (6.62%) | 5/117 (4.27%) | 0.4767 | 0.0221 | N/A | 0.03423 a 0.6518 b 1.0 c |
| MODS (228/1955) | 0/12 (0%) | 21/1405 (1.49%) | 1/72 (1.39%) | 7/420 (1.67%) | 5/144 (3.47%) | 3/130 (2.31%) | 0.7595 | 0.6267 | N/A | N/A |
| Lactic acidosis (53/192) | 1/3 (33.33%) | 8/102 (7.85%) | 0/13 (0%) | 5/66 (7.58%) | 6/37 (16.22%) | 2/24 (8.33%) | 0.1835 | 1.0 | N/A | N/A |
| Bleedings (228/1955) | 0/12 (0%) | 64/1405 (4.56%) | 5/72 (6.94%) | 20/420 (4.76% | 12/144 (8.33%) | 13/130 (10.0%) | 0.8366 | 0.0232 | N/A | 1.0 a 0.0361 b 0.141 c |
Publisher’s Note: MDPI stays neutral with regard to jurisdictional claims in published maps and institutional affiliations. |
© 2022 by the authors. Licensee MDPI, Basel, Switzerland. This article is an open access article distributed under the terms and conditions of the Creative Commons Attribution (CC BY) license (https://creativecommons.org/licenses/by/4.0/).
Share and Cite
Rola, P.; Doroszko, A.; Trocha, M.; Gajecki, D.; Gawryś, J.; Matys, T.; Giniewicz, K.; Kujawa, K.; Skarupski, M.; Adamik, B.; et al. The Usefulness of the C2HEST Risk Score in Predicting Clinical Outcomes among Hospitalized Subjects with COVID-19 and Coronary Artery Disease. Viruses 2022, 14, 1771. https://doi.org/10.3390/v14081771
Rola P, Doroszko A, Trocha M, Gajecki D, Gawryś J, Matys T, Giniewicz K, Kujawa K, Skarupski M, Adamik B, et al. The Usefulness of the C2HEST Risk Score in Predicting Clinical Outcomes among Hospitalized Subjects with COVID-19 and Coronary Artery Disease. Viruses. 2022; 14(8):1771. https://doi.org/10.3390/v14081771
Chicago/Turabian StyleRola, Piotr, Adrian Doroszko, Małgorzata Trocha, Damian Gajecki, Jakub Gawryś, Tomasz Matys, Katarzyna Giniewicz, Krzysztof Kujawa, Marek Skarupski, Barbara Adamik, and et al. 2022. "The Usefulness of the C2HEST Risk Score in Predicting Clinical Outcomes among Hospitalized Subjects with COVID-19 and Coronary Artery Disease" Viruses 14, no. 8: 1771. https://doi.org/10.3390/v14081771