
The Impact of COVID-19 Control Measures on Air Quality in Guangdong Province
by
Lili Li
1,2,†, 
Zhihui Mao
1,2,†,
Jianjun Du
1,2,
Tao Chen
3,4,*,
Lu Cheng
1,2 and
Xiaocui Wen
3,4 1
College of Resources and Environment, Zhongkai University of Agriculture and Engineering, Guangzhou 510225, China
2
Guangdong Research Center for Environmental Pollution Prevention and Control of Agricultural Producing Areas, Guangzhou 510220, China
3
Guangdong Provincial Key Laboratory of Chemical Pollution and Environmental Safety, SCNU Environmental Research Institute, South China Normal University, Guangzhou 510006, China
4
MOE Key Laboratory of Environmental Theoretical Chemistry, SCNU Environmental Research Institute, South China Normal University, Guangzhou 510006, China
*
Author to whom correspondence should be addressed.
†
These authors contributed equally to this work.
Sustainability 2022, 14(13), 7853; https://doi.org/10.3390/su14137853
Submission received: 3 June 2022
/
Revised: 22 June 2022
/
Accepted: 23 June 2022
/
Published: 28 June 2022
(This article belongs to the Special Issue Aerosols and Air Pollution)
Abstract
:COVID-19 control measures had a significant social and economic impact in Guangdong Province, and provided a unique opportunity to assess the impact of human activities on air quality. Based on the monitoring data of PM2.5, PM10, NO2, and O3 concentrations from 101 air quality monitoring stations in Guangdong Province from October 2019 to April 2020, the PSCF (potential source contribution factor) analysis and LSTM (long short-term memory) neural network were applied to explore the impact of epidemic control measures on air quality in Guangdong Province. Results showed that during the lockdown, the average concentration of PM2.5, PM10, NO2, and O3 decreased by 37.84%, 51.56%, 58.82%, and 24.00%, respectively. The ranges of potential sources of pollutants were reduced, indicating that air quality in Guangdong Province improved significantly. The Pearl River Delta, characterized by a high population density, recorded the highest NO2 concentration values throughout the whole study period. Due to the lockdown, the areas with the highest concentrations of O3, PM2.5, and PM10 changed from the Pearl River Delta to the eastern and western Guangdong. Moreover, LSTM simulation results showed that the average concentration of PM2.5, PM10, NO2, and O3 decreased by 46.34%, 54.56%, 70.63%, and 26.76%, respectively, which was caused by human-made impacts. These findings reveal the remarkable impact of human activities on air quality and provide effective theoretical support for the prevention and control of air pollution in Guangdong Province.
1. Introduction
Air pollution not only causes abnormal weather and climate but also poses a huge threat to public health [1]. Air pollutants come from various sources, including oil refining and gas combustion, vehicle, and traffic emissions, incomplete combustion of heavy and industrial machinery, open-air waste burning, and biomass [2]. Since the reform and opening up, China’s economy has entered a stage of rapid development, increasing air pollution and other problems [3]. As the province with the largest population in China, Guangdong Province has remarkable air quality problems. According to the “Report on the State of the Ecological Environment in Guangdong Province in 2020” from the website of the Department of Ecology and Environment of Guangdong Province (http://gdee.gd.gov.cn/ (accessed on 1 July 2021)), O3 is the major pollutant in this province, accounting for 68.7% of total pollution, followed by PM2.5 and PM10, accounting for 15.8% and 8.3%, respectively. Industrial production and vehicles were major emitters of the pollutants including PM2.5, PM10, NOx, and VOCs. What is worse, NOx and VOCs would react in sunlight and produce O3. Government of Guangdong Province has formulated a series of measures to deal with the problems caused by air pollution, including coal burning reduction, industrial structure adjustments, strict controls on high energy consumption and highly polluting industries, and vigorous promotion of clean production [4]. However, relevant measures need to strike a balance between the need to effectively tackle air pollution and to avoid affecting normal human production activities. Hence, it is essential to investigate the impact of human production activities on air pollution in periods of social lockdown.
After first being detected in early 2020 in Wuhan, China, COVID-19 spread rapidly around the world owing to its high contagiousness. In response to the COVID-19 outbreak, Guangdong Province announced a level-1 public health emergency response on 23 January 2020. The government took unprecedented isolation measures including an economic shutdown, school, and business suspension, and social distance. What is more, public transportation such as shipping and flights were interrupted, all public places were closed, people were required to stay at home, and human activities were restricted to those necessary to meet minimum living needs [5]. On 24 February, the emergency response was relaxed uniformly across the whole region. Most workplaces and public places were reopened, including restaurants, parks, scenic spots, museums, and public libraries. People were allowed to return to work and school, and public transport was resumed.
Several researchers have conducted various studies on significant changes in air quality during the COVID-19 lockdown. It was found that concentrations of standard pollutants such as O3, NO2, PM2.5, and PM10 have decreased to varying degrees in different cities around the world, mainly thanks to epidemic control measures [6,7]. However, in some cities such as Baghdad, Iraq, and Vienna, Austria, even if air quality has improved, O3 concentration has increased [8,9]. As for China, researchers found that air quality had improved, highlighting industrial and residential emissions as the main drivers of air quality deterioration [10,11]. Moreover, studies focusing on the regional scale found that, although pollutant concentration in most cities showed a downward trend [12,13], air quality deteriorated in some cities (such as Jinan and Zhengzhou) due to unfavorable meteorological conditions [14]. Hence, it is evident how, in some cases, although epidemic control proved to improve air quality to a great extent, man-made emission reduction could not completely offset the impact of adverse meteorological factors [15]. To date, very little research exists on the impact of COVID-19 control measures on air quality in Guangdong Province. To fill this gap, in this study we combined air quality monitoring data and meteorological data to analyze the air quality situation in Guangdong Province during the COVID-19 closure period, as well as the impact of epidemic prevention and control measures on air quality, thereby providing a scientific reference for the prevention and control of air pollution in Guangdong Province.
2. Materials and Methods
2.1. The Study Area
Guangdong Province (108°42′~116°19′ E, 20°08′~25°29′ N) is located in the southernmost part of mainland China, with an area of 179,700 km2 (Figure 1). According to the Guangdong Statistical Yearbook, it has 21 cities, including 4 megacities (Guangzhou, Foshan, Shenzhen, and Dongguan), and about a total of 86.50 million permanent residents. Its GDP was about CNY 11,076.09 billion which ranked first in 2020 and ranked first in the country for 32 consecutive years. The statistics were obtained from the website of the Guangdong Provincial Bureau of Statistics (http://www.stats.gd.gov.cn/ (accessed on 1 July 2021)). Moreover, Guangdong Province, with the largest import and export trade in China, is also the engine of economic development of the Guangdong–Hong Kong–Macao Greater Bay Area, which is one of the four largest bay areas in the world [16]. However, rapid economic development, population growth, and the acceleration of urbanization have generated serious air quality problems. Since Guangdong Province’s population, as well as its economic and transportation development, are among the highest in the country, studying the impact of the measures of prevention and control of the COVID-19 epidemic on air quality in this province is of reference for the whole country [17].
2.2. Data
Following the control and prevention measures taken by Guangdong Province in response to the COVID-19 outbreak, the study period was divided into three phases: a pre-lockdown period (from 1 October 2019 to 22 January 2020); a Lockdownlockdown period (from 23 January 2020 to 24 February 2020); and a post-lockdown period (from 25 February 2020 to 31 April 2020). Hourly air quality data on PM2.5, PM10, NO2, and O3 from 101 monitoring stations in Guangdong from October 2019 to April 2020 were obtained from the website of the China National Environmental Monitoring Center (https://cnemc.cn/ (accessed on 1 July 2020)). Meteorological data for the same period were obtained from the Global Data Assimilation Forecast System (GDAS) used by the National Center for Environmental Prediction (NCEP), with a temporal resolution of 6 h per day and a spatial resolution of 1° × 1°, which could be downloaded from the website of National Oceanic and Atmospheric Administration (https://www.noaa.gov/ (accessed on 1 July 2020)).
2.3. Methods
2.3.1. The Potential Source Contribution Factor Analysis
The potential source contribution factor analysis (PSCF) is a method to identify the potential source location based on the conditional probability function based on backward trajectory calculation [16]. Based on the simulation results of the backward trajectory, a rectangular grid is created, and the resolution was determined by the coverage area of the trajectory as 1° × 1°. The average concentration of pollutants during the study period was set as the threshold value. When the pollutant concentration of the track was higher than the threshold, it was marked as the pollution track. By comparing the number of pollution track endpoints passing through the grid with the number of all track endpoints falling in the grid , the result of the PSCF was obtained. The calculation formula employed is as follows:
To reduce the influence of errors caused by the small sample quantity of the conditional probability function, a weight coefficient was introduced. When the value in a grid was less than three times that of the average track breaking points of each grid in the research area, the weight coefficient was used to reduce the uncertainty of the PSCF [18]. The calculation formula of the weighted PSCF (WPSCF) is as follows:
where is the average number of track endpoints of each grid.
2.3.2. Long Short-Erm Memory Neural Network
The LSTM neural network, as a time-recurrent neural network suitable for air quality prediction, was introduced by Hochreiter and Schmidhuber [19]. It could freely choose which input features are needed as the predicted influence conditions and retain the changing trend of temporal characteristics. LSTM consists of three gates including forget, update, and output gates [20]. The forget gate decided the information of the air quality data to be remembered. The update gate would determine the input information of the air quality data whether to be preserved, and the output gate decided what information of the air quality data will be output. The specific calculation formula is as follows:
The forget gate () decides the information to remove from the current cell.
where is the output of the previous cell and is a sigmoid transfer function., xt represents the air quality data at the moment t. and are the weights for the current input state in the forget gate and forget gate bias, respectively.
The update gate () decides the information to update into the current cell.
The candidate for replacing the memory cell () is computed in the input block with model input (). Where and are the weights for the current input state and input block bias, respectively. Additionally and are the weights for the current input state in the update gate and update gate bias, respectively.
The output gate () decides the output of the recurrent cell and input to the current state.
where () and () are the weight for the current input state in the output gate and output gate bias, respectively. The current output state () is obtained by utilizing the information from the self-looped cell state () and output gate ().
In this paper, the performance of the LSTM model was estimated by root-mean-square error (RMSE), which is widely used for measuring the residuals between values observed in regression analysis [21,22]. RMSE corresponds to the square root of the average of squared errors, as defined in Equation (9):
where is the predicted pollutant concentration, correspond to the observed pollutant concentration, and is the number of test samples.
3. Results and Discussion
3.1. Variation Trend of Air Quality in Guangdong
The hourly concentration data of PM2.5, PM10, NO2, and O3 from 101 monitoring points, after filtering out missing and abnormal values, in Guangdong Province during the study period were averaged to obtain the daily changes (see Figure 2). The difference in the average concentration of PM2.5, PM10, NO2, and O3 in the three phases was used to calculate their percentage change (see Table 1). Results show that in the pre-lockdown period, the average concentrations of PM2.5, PM10, NO2, and O3 were 37 μg/m3, 64 μg/m3, 34 μg/m3, and 75 μg/m3, respectively, thus reaching the ambient air quality standard.
During the lockdown period, the average concentrations of PM2.5, PM10, NO2, and O3 were 23 μg/m3, 31 μg/m3, 14 μg/m3, and 57 μg/m3, respectively. Compared to the pre-lockdown phase, these concentrations dropped by 37.84%, 51.56%, 58.82%, and 24.00%, respectively. Motor vehicle travels, industrial production, and other human activities generate a lot of air pollutants, such as PM2.5, PM10, NO2, and VOCs. In response to the COVID-19 outbreak, the epidemic control measures, such as suspended individual travel and closed factories, restaurants, and construction sites, have put the society of Guangdong Province on hold, significantly reducing emissions of pollutants, therefore, the average concentrations of PM2.5, PM10, NO2, and O3 showed a large fluctuation [23,24]. Additionally, PM2.5 sources are wider and more variegated than PM10 sources. Therefore, the reduction of human activities has a greater and more direct impact on PM10 [25].
In the post-lockdown period, the average concentration of NO2 increased clearly, reaching as high as 26 μg/m3, i.e., 85.71% higher than that during the lockdown period. Industrial emissions and motor vehicle emissions were the main emission sources of NO2. Therefore, adjusting the industrial structure and controlling the number of motor vehicles circulating might effectively control NO2 concentration [26]. Moreover, during this period, the average concentrations of PM2.5, PM10, and O3 were 24 μg/m3, 41 μg/m3, and 58 μg/m3, respectively, with an increase of 4.35%, 32.26%, and 1.75%, respectively, over the lockdown period. During the post-lockdown, the resumption of factory work and of transportation, and the reactivation of human activities have led to a rapid increase in the number of emission sources, which caused a rapid increase in PM10 concentrations.
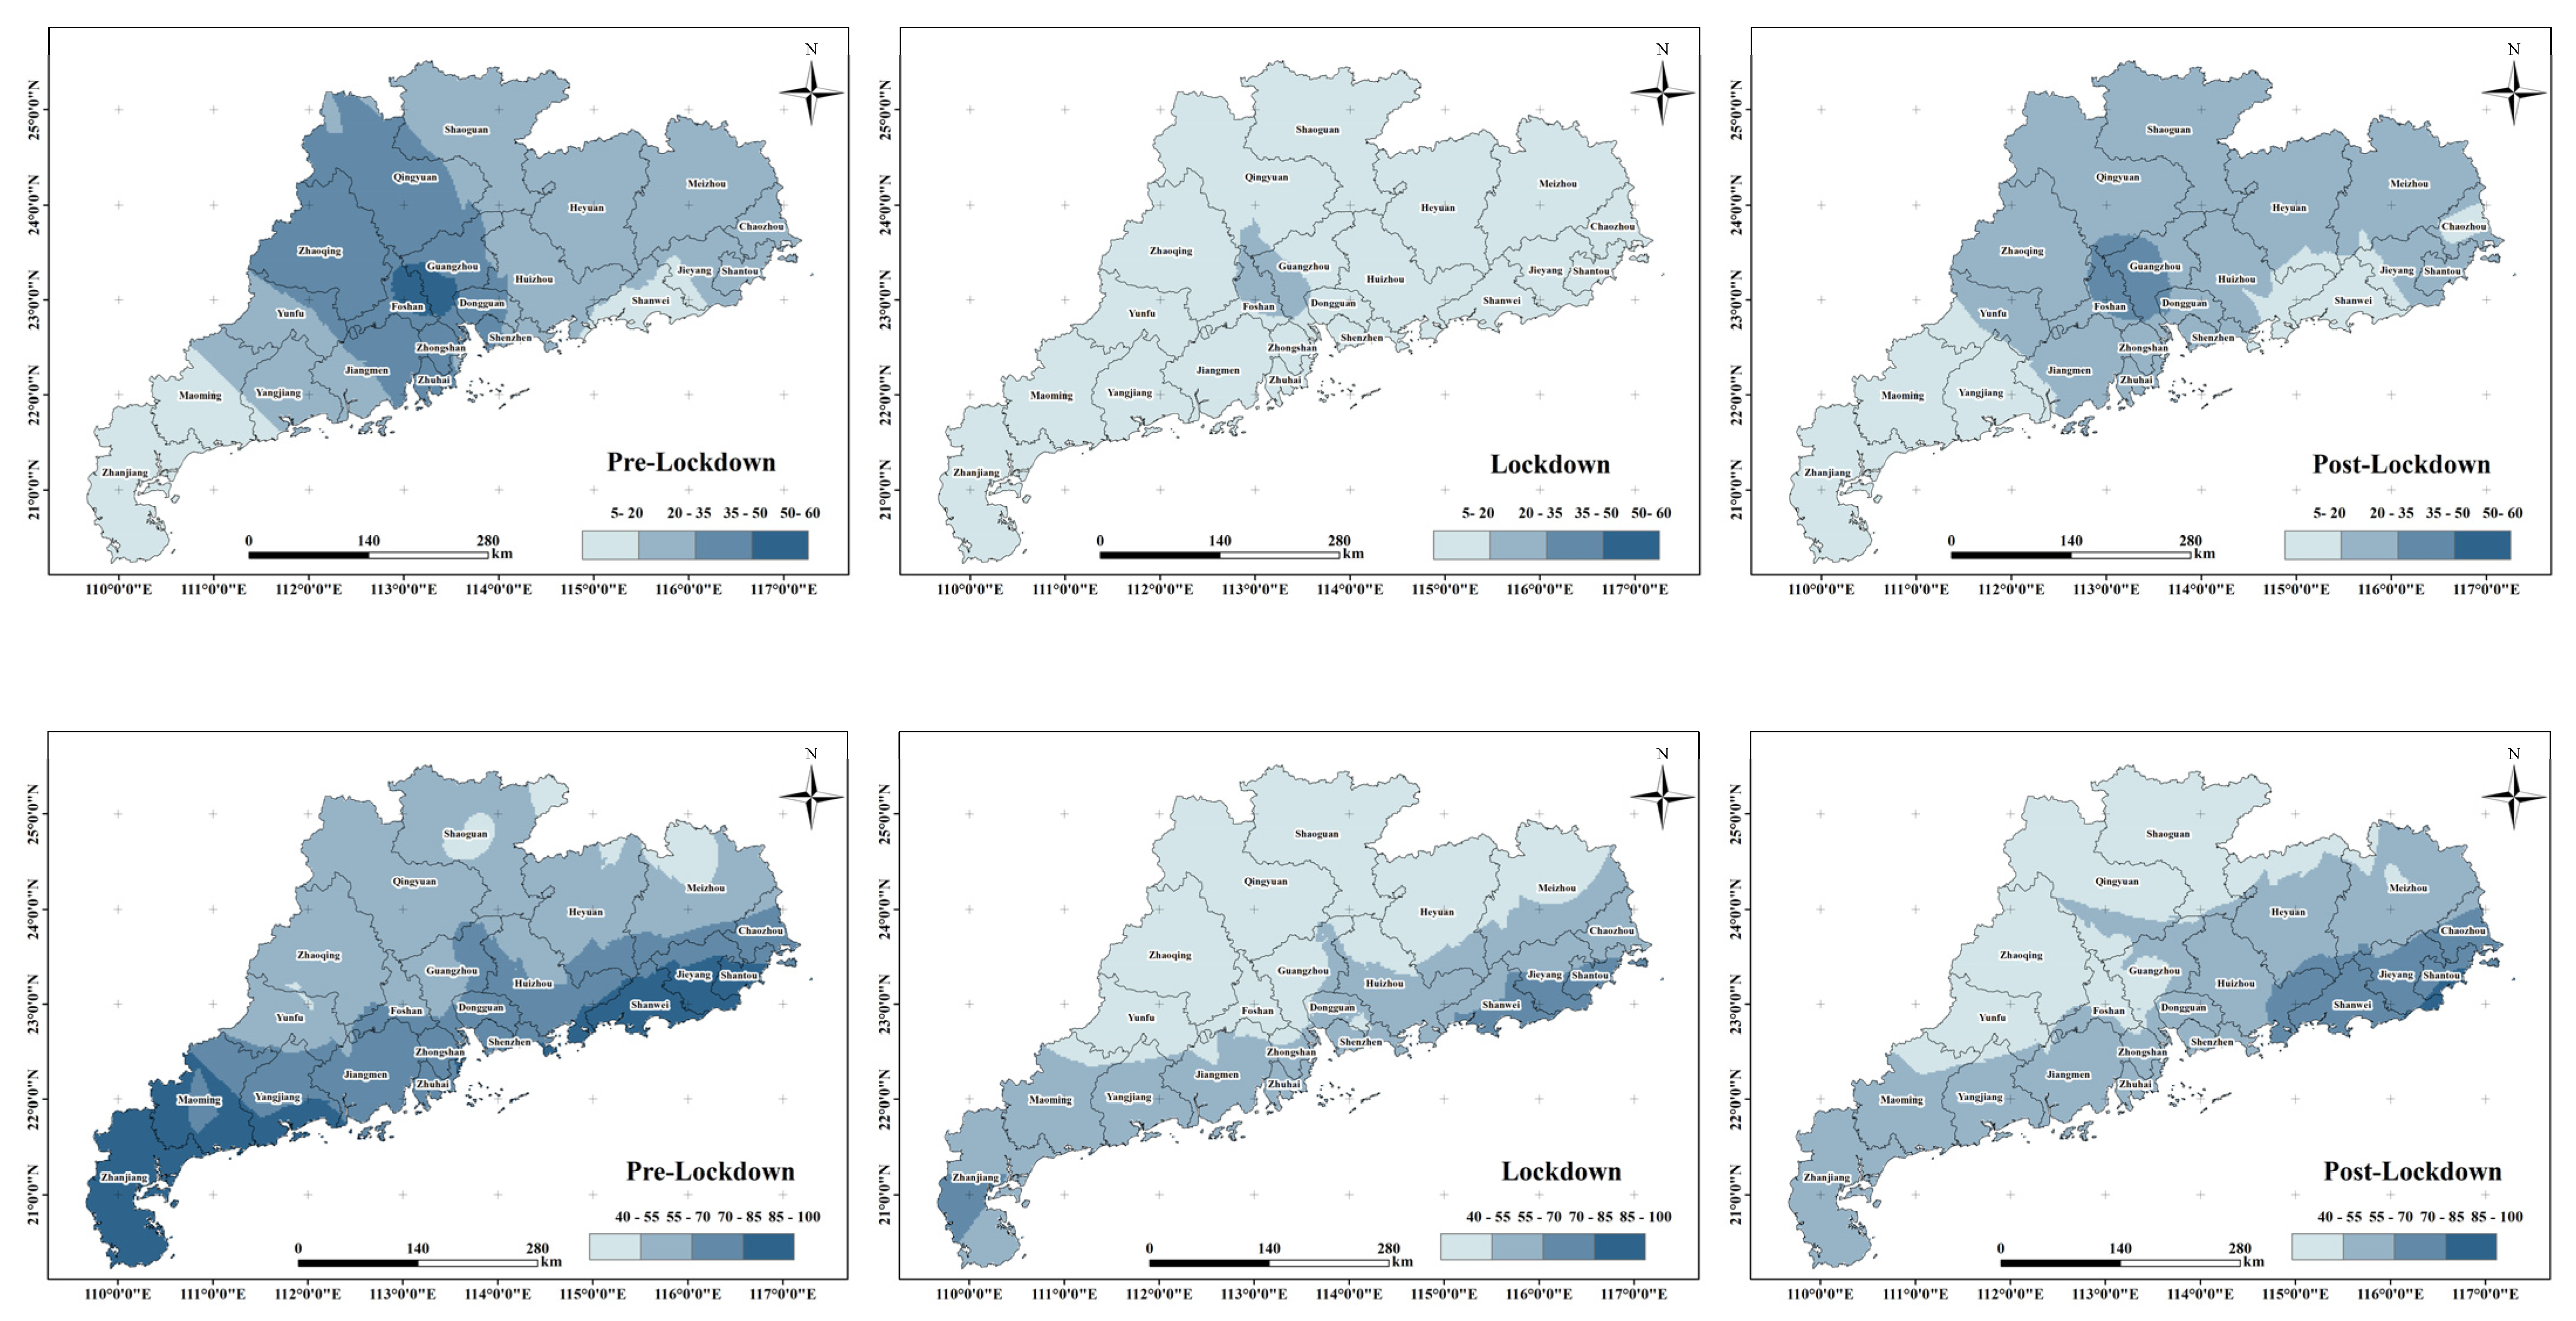
3.2. Spatial Characteristics of Air Quality
The spatial characteristics of the changes in the concentrations of PM2.5, PM10, NO2, and O3 in the three periods investigated were obtained by using the Kriging interpolation from the average concentration of the 101 monitoring stations in Guangdong Province (see Figure 3). During the pre-lockdown period, the spatial characteristics of PM2.5, PM10, and NO2 exhibited clear similarities. Before the lockdown, the concentrations in the Pearl River Delta were higher than in other areas and were mainly driven by the high population density and industrialization. In addition, the topography of Guangdong Province might also be another reason for this result. As the Pearl River Delta is surrounded by mountains on three sides and faces the sea on one side, it is easy to form phenomena such as valley wind, sea-land wind, and heat island circulation, which is not conducive to the diffusion of air pollutants across the entire province [27]. The concentration of O3 was higher in the areas closer to the sea, with a downward gradient from the coastal areas to inland areas.
During the lockdown period, the highest concentrations of PM2.5 were recorded in eastern Guangdong, and those of PM10 in the cities of Maoming, Qingyuan, and Jieyang. The high-concentration areas of NO2 and O3 remained almost the same as before the lockdown, indicating that the spatial distribution characteristics of these two pollutants were less affected by it.
During the post-lockdown phase, the coastal areas of eastern Guangdong recorded the highest concentrations of PM2.5, PM10, and O3. The spatial distribution of NO2 was similar to that in the previous phases, with the highest concentrations in the Pearl River Delta region where human activities were concentrated. The COVID-19 epidemic control measures had a greater impact on the spatial distribution characteristics of particulate pollutants (PM2.5 and PM10). The spatial distribution characteristics of pollutants in the Pearl River Delta region were significantly affected by the blockade measures, and the air quality was improved significantly.
3.3. Meteorological Characteristics
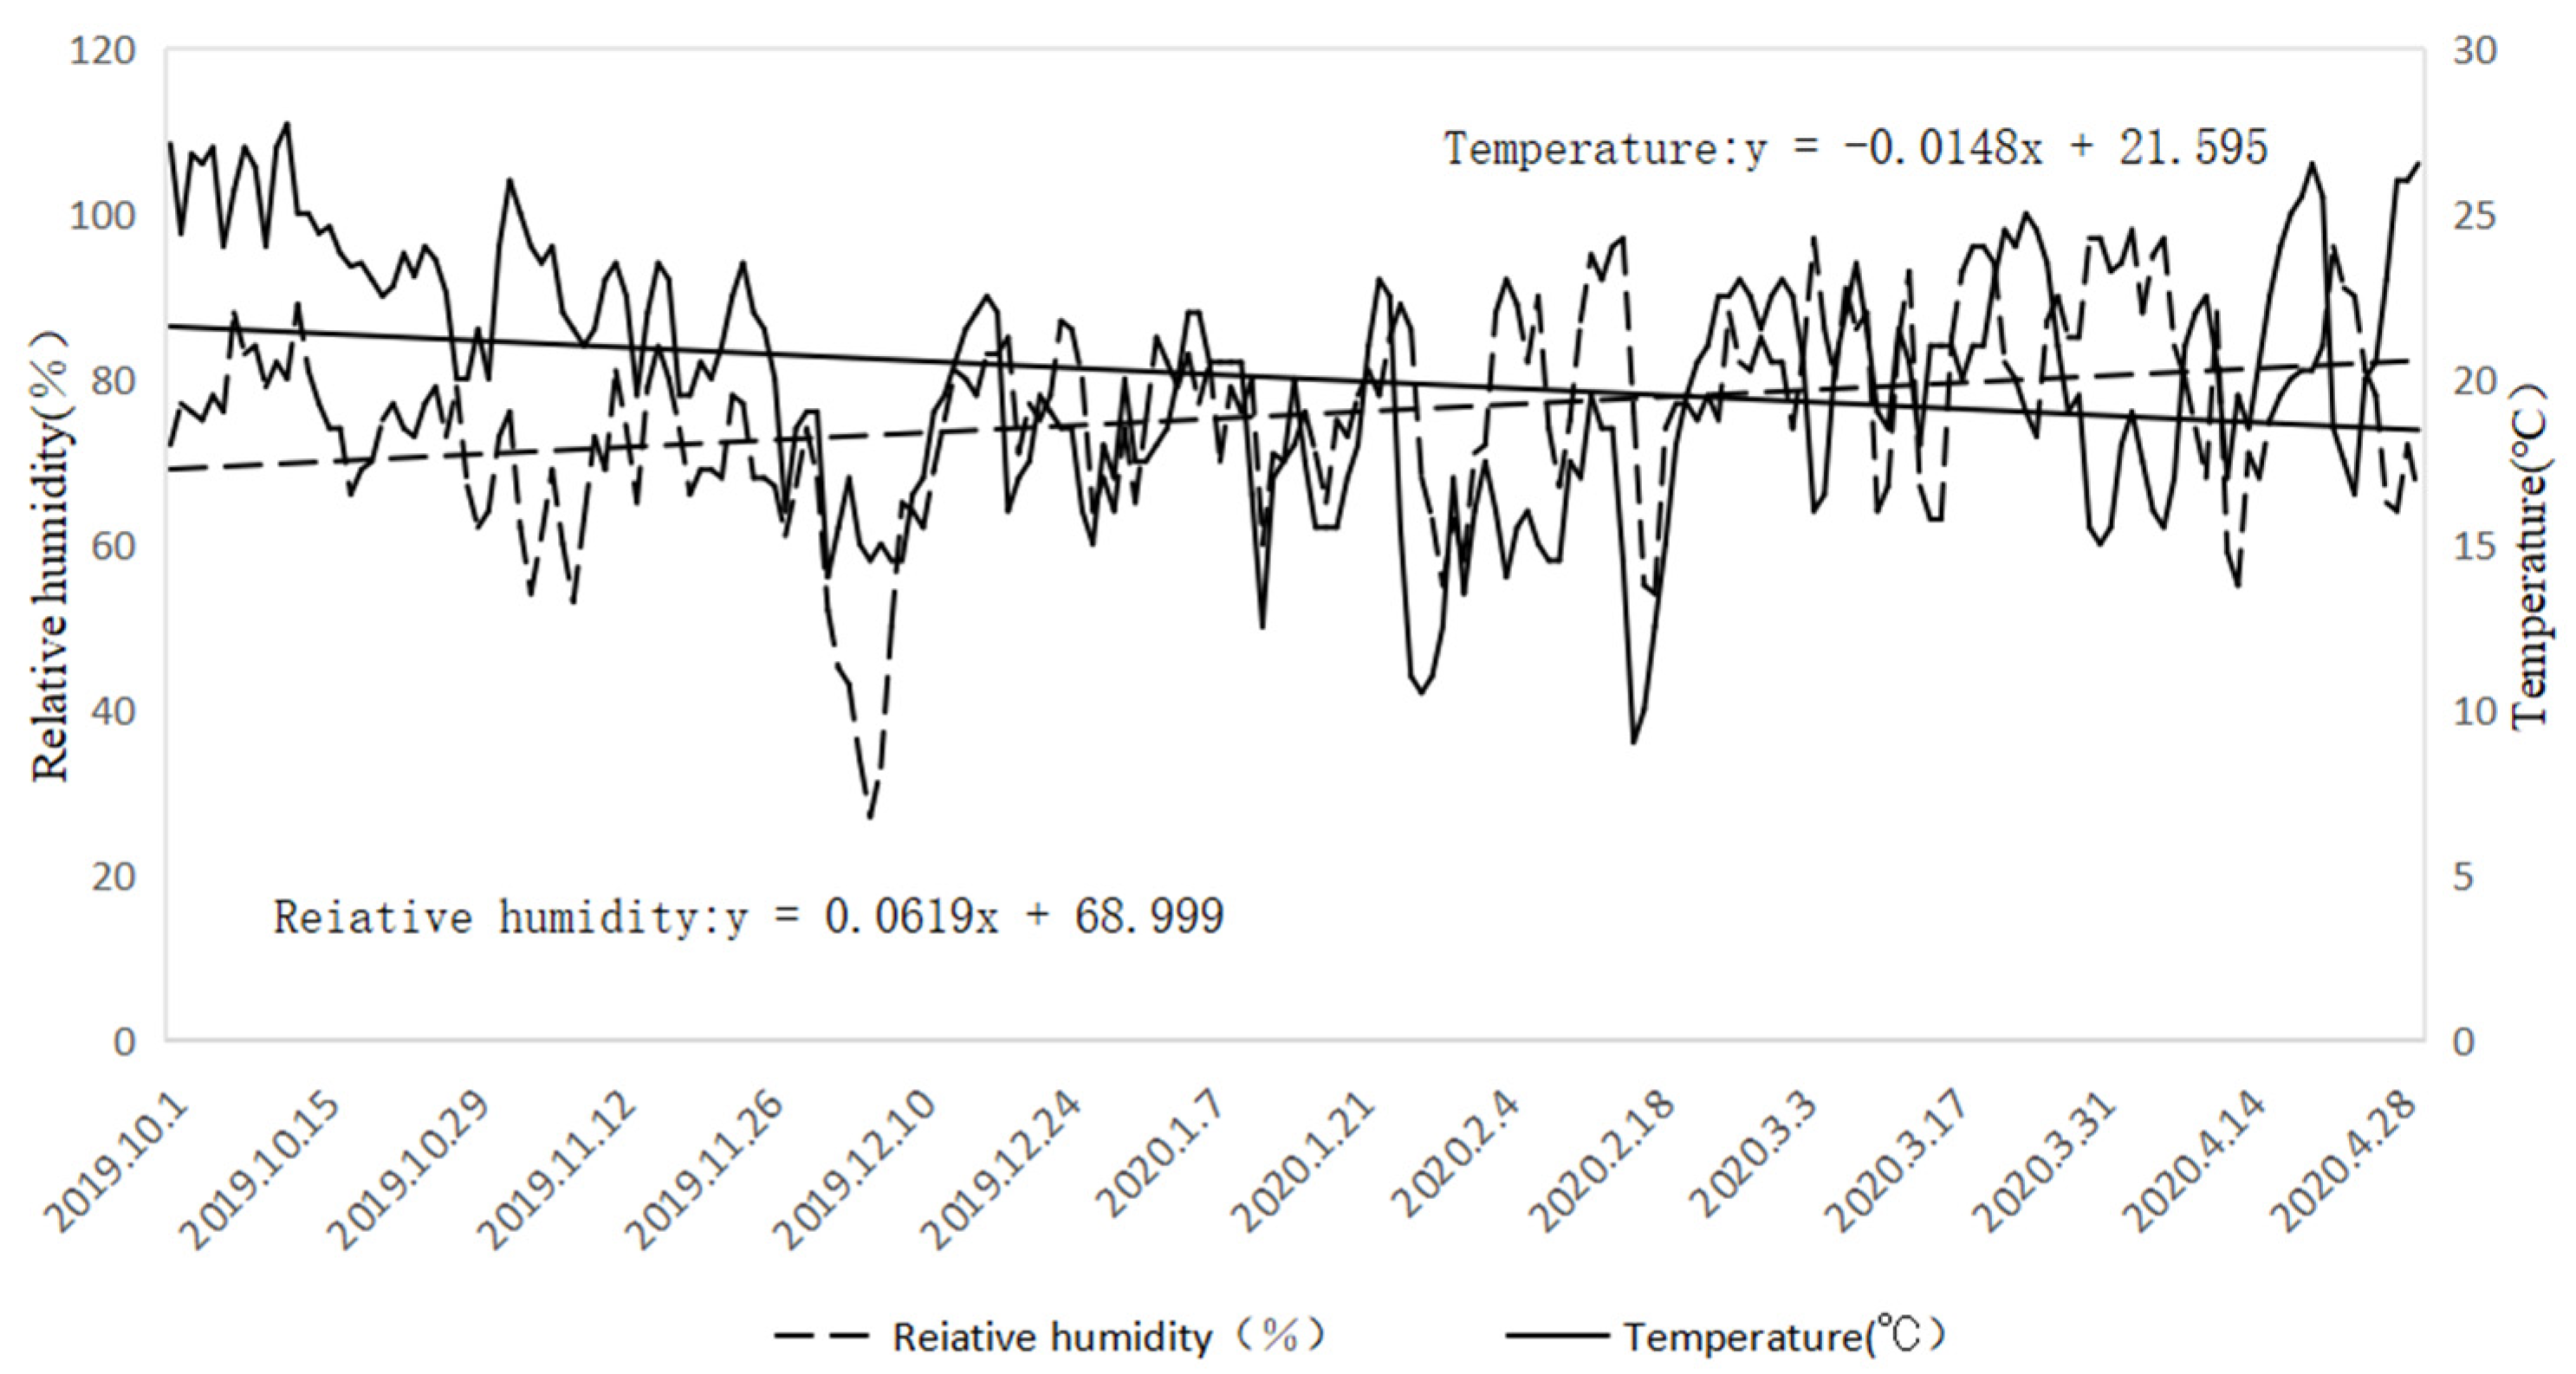
Temperature and relative humidity are two important climate indicators affecting air quality. Moreover, air pollution often occurs under unfavorable meteorological conditions. Temperature considerably influences air stability, playing an important role in particle accumulation or spreading. When the temperature is low, the atmosphere is relatively stable; pollutants cannot diffuse easily, and their mass concentration is higher. On the contrary, when the temperature rises, air convection becomes more frequent, which is conducive to the dilution and diffusion of air pollutants [28]. In parallel, low humidity may raise a large amount of dust from the ground, which leads to an increase in the concentration of particulate matter. Rainfall occurs as air humidity increases, raising the wet deposition of particulate pollutants [29]. Figure 4 shows the variations in daily temperature and relative humidity data during the study period. Temperatures showed a slight decrease trend, while relative humidity showed a slight increase trend, both hindering the diffusion of pollutant concentrations.
Wind direction and speed are also important factors affecting air quality [30]. The speed of the wind is inversely proportional to the concentration of pollutants in the air. In the case of low wind speeds, pollutants in the atmosphere are not easily diffused, and their concentration in the air is higher. Figure 5 shows the wind rose chart based on wind speed and direction data for Guangdong Province in the three periods investigated, reflecting the diffusion effect of wind conditions on pollutants [31]. During the pre-lockdown period, northwesterly, northerly, and northeasterly winds, as the dominant winds, had a high speed. The average wind speed was 2.74 m·s−1, and the days without wind accounted for 8.8% of the whole study period. During the lockdown period, the dominant wind direction and wind speed were similar to the pre-lockdown period, with northerly and northeasterly winds being dominant. The average wind speed was 2.24 m·s−1, and the calm period accounted for 10.8% of the total. During the post-lockdown period, the southeasterly winds prevailed. The average wind speed during this period was 2.55 m·s−1, and the windless period accounted for 7.1% of the total. These results show that the meteorological characteristics in the three periods were similar. Therefore, we can conclude that air quality changes in Guangdong Province during the COVID-19 control measures period were not closely related to meteorological factors.
3.4. Analysis of Potential Sources of Pollutants
In this paper, we used the PSCF method to determine the potential source range of pollutants by using the air mass trajectory and the concentration of four pollutants in Guangdong Province during the study period (see Figure 6). The PSCF output is made up of the grids which are marked by the pollution track, which reflects changes in potential geographic sources of air pollutants, including the location, degree, and range of pollution. When the air pollution is severe, more grids would be marked, and the range of potential pollutant sources is larger. Higher values of WPSCF in a region indicate that area could be the main source of air pollutants [32]. To indicate the pollution degree of potential source areas, WPSCF values were classified as indicating a mild (0–0.3), moderate (0.3–0.7), or severe (0.7–1) pollution [10]. Before the lockdown, although the range of potential pollution sources of PM2.5, PM10, and NO2 were similar, the main source area of air pollutants and the degree of pollution were different. Heyuan and Huizhou were the major potential source of PM2.5, while the Pearl River Delta was the major potential source of PM10 and NO2. The potential sources of O3 were distributed in a wider range, with the farthest being the Shanxi Province, and with Ganzhou and Putian as the greatest contribution sources. The pollution generated by the PM2.5 and NO2 source areas was moderate and heavy, respectively, while that generated by the PM10 and O3 source areas was mild and moderate, respectively.
During the lockdown period, the main potential source area of PM2.5 was still the Pearl River Delta, while the range of the contribution was more concentrated. On the contrary, PM10 was most widely distributed in this period, and its main potential contribution sources were the Pearl River Delta and the South China Sea. The potential source areas of NO2 were scattered, reaching as far as Yuncheng City in Shaanxi, while the potential source areas of O3 were mainly distributed in northern Guangdong and southern Fujian. During this period, the potential source areas of pollutants were mainly mildly or moderately polluted; moreover, the main pollutants affecting air quality in Guangdong Province during the lockdown period were mostly generated locally and offshore.
During the post-lockdown period, the potential source ranges of PM2.5, PM10, and NO2 were similar, and their main source location was the ocean. The main potential source of O3 contribution was located at the junction of three provinces, namely Hunan, Fujian, and Guangdong. Moreover, the potential source range of PM2.5, PM10, NO2, O3, and the range of heavy pollution expanded. During the lockdown, the potential source ranges of pollutants are more concentrated and the degree of pollution is lower. Additionally, the potential geographic sources of air pollutants have shifted from land to the ocean. Considering that meteorological factors had a relatively small impact on air quality, we could conclude that the improvement of air quality in Guangdong Province was mainly due to epidemic control measures.
3.5. The Impact of COVID-19 Control Measures on Air Quality
As changes in air quality were mainly caused by human activities and natural factors, the contribution of meteorological factors to air pollutants was estimated based on the assumption that human activities remain unchanged during the period. The machine learning algorithm (LSTM neural network) was used in much research and proved its efficiency and accuracy [33,34]. In this paper, the LSTM neural network model was proposed to forecast daily pollutants concentration in Guangdong Province by employing historical pollutant (PM2.5, PM10, NO2, O3) concentrations and meteorological parameters (temperature, relative humidity, wind speed, precipitation, and wind direction) as inputs. The training dataset was from 1 January 2017, to 30 August 2019, and the validation dataset was from 1 September 2019, to 30 September 2020. Through continuous optimization of hyperparameters in LSTM, the results were output when the Pearson correlation coefficient (R) between the predicted value and the verification value of most pollutants exceeds 0.8. In this study, with the Rs of PM2.5, PM10, and O3 except for NO2, over 0.8, the predicted pollutants were output. The RMSEs of the predicted PM2.5, PM10, NO2, and O3 concentrations were 7.36 μg/m3, 7.16 μg/m3, 3.69 μg/m3, and 7.78 μg/m3, respectively, and the predicted results were fitted. Finally, the impact of air quality by epidemic control and emission reduction during the lockdown was evaluated. This work is summarized as follows:
where is the concentration of pollutants caused by meteorological, and are simulated pollutant concentrations during the pre-lockdown and lockdown, respectively.
where is the concentration of pollutants caused by epidemic control, is the real difference value between the pre-lockdown period and lockdown periods.
As illustrated in Table 2, the concentrations of PM2.5, PM10, NO2, and O3 increased by 2.83 μg/m3, 2.29 μg/m3, 4.50 μg/m3, and 2.00 μg/m3 owing to meteorological factors, shown as , while indicated the actual decrease of PM2.5, PM10, NO2, and O3 during the epidemic control. After excluding the influence of meteorological factors from , the contribution of human activities to atmospheric pollutants was calculated as c. The decrease rates of NO2, PM2.5, PM10, and O3 were 70.63%, 46.34%, 54.56%, and 26.76%, respectively, by emission reduction, indicating that the epidemic control has dramatically reduced the emission of pollutants from traffic sources and industrial sources, and consequently resulted in a substantial decrease in pollutants.
4. Conclusions
In order to systematically assess the impact of the COVID-19 control measures on air quality in Guangdong Province, the were calculated concentration of pollutants, meteorological characteristics, and air mass trajectories during the pre-lockdown, lockdown, and post-lockdown were applied to PSCF and PSCF. The results showed that the concentrations of PM2.5, PM10, NO2, and O3 in Guangdong Province dropped by 37.84%, 51.56%, 58.82%, and 24.00%, respectively. During the post-lockdown period, the concentration of NO2 increased remarkably, while the concentration of PM2.5 and O3 increased slightly. In addition, the spatial distribution characteristics of particulate matter (PM2.5 and PM10) were more influenced by lockdown measures than for NO2 and O3. During the lockdown period, the distribution range of potential pollution sources was smaller, and the potential source areas of pollutants were mildly or moderately polluted. LSTM simulation results showed that reduction in human activities led to the concentrations of PM2.5, PM10, NO2, and O3 decreasing by 46.34%, 54.56%, 70.63%, and 26.76%, while the concentrations caused by negative meteorological factors raised 7.62%, 3.59%, 13.35%, and 2.66%. This indicates that COVID-19 epidemic control measures have a positive effect on air quality in Guangdong Province and the improvement of air quality was mainly due to the shutdown and production shutdown during the COVID-19 epidemic control instead of meteorological factors and transportation of air mass trajectories.
Economic and human activities lead to an increase in the emission of air pollutants, thus causing air quality deterioration. Although the blockade has caused economic stagnation, the evident improvement in air quality in our study showed that human activities should definitely be considered in the management of urban air quality. The harmonious development of economic development, human activities and air quality should be further explored as a priority in the coming years.
Author Contributions
Conceptualization, L.L. and T.C.; data curation, Z.M.; formal analysis, Z.M., L.C. and X.W.; funding acquisition, L.L.; investigation, Z.M. and L.C.; methodology, L.L. and T.C.; resources, J.D.; validation, X.W.; writing—original draft, Z.M.; writing—review and editing, L.L., J.D. and T.C. All authors have read and agreed to the published version of the manuscript.
Funding
This research was funded by the National Natural Science Foundation of China (Grant No. 42007205) and the Natural Science Foundation of Guangdong Province (Grant No. 2022A1515011077).
Institutional Review Board Statement
Not applicable.
Informed Consent Statement
Not applicable.
Data Availability Statement
Not applicable.
Acknowledgments
The NOAA Air Resources Laboratory (ARL) is acknowledged for the provision of the HYSPLIT transport and dispersion model used in this paper. Additionally, the China National Environmental Monitoring Center (CNEMC) and the National Center for Environmental Prediction (NECP) are acknowledged for the provision of air quality data and meteorologic data.
Conflicts of Interest
The authors declare no conflict of interest.
References
- Adeyemi, A.J.; Kanee, R.B.; Edokpa, D.O.; Ede, P.N. Short-Term Air Quality Gains of COVID-19 Pandemic Lockdown of Port Harcourt, Nigeria. GEP 2021, 9, 110–123. [Google Scholar] [CrossRef]
- Guo, H.; Kota, S.H.; Chen, K.; Sahu, S.K.; Hu, J.; Ying, Q.; Wang, Y.; Zhang, H. Source Contributions and Potential Reductions to Health Effects of Particulate Matter in India. Atmos. Chem. Phys. 2018, 18, 15219–15229. [Google Scholar] [CrossRef] [Green Version]
- Zangari, S.; Hill, D.T.; Charette, A.T.; Mirowsky, J.E. Air Quality Changes in New York City during the COVID-19 Pandemic. Sci. Total Environ. 2020, 742, 140496. [Google Scholar] [CrossRef] [PubMed]
- Fan, L.; Fu, S.; Wang, X.; Fu, Q.; Jia, H.; Xu, H.; Qin, G.; Hu, X.; Cheng, J. Spatiotemporal Variations of Ambient Air Pollutants and Meteorological Influences over Typical Urban Agglomerations in China during the COVID-19 Lockdown. J. Environ. Sci. 2021, 106, 26–38. [Google Scholar] [CrossRef]
- Zhang, H.; Lin, Y.; Wei, S.; Loo, B.P.Y.; Lai, P.C.; Lam, Y.F.; Wan, L.; Li, Y. Global Association between Satellite-Derived Nitrogen Dioxide (NO2) and Lockdown Policies under the COVID-19 Pandemic. Sci. Total Environ. 2021, 761, 144148. [Google Scholar] [CrossRef]
- Hashim, B.M.; Al-Naseri, S.K.; Al-Maliki, A.; Al-Ansari, N. Impact of COVID-19 Lockdown on NO2, O3, PM2.5 and PM10 Concentrations and Assessing Air Quality Changes in Baghdad, Iraq. Sci. Total Environ. 2021, 754, 141978. [Google Scholar] [CrossRef]
- Brancher, M. Increased Ozone Pollution alongside Reduced Nitrogen Dioxide Concentrations during Vienna’s First COVID-19 Lockdown: Significance for Air Quality Management. Environ. Pollut. 2021, 284, 117153. [Google Scholar] [CrossRef]
- Donzelli, G.; Cioni, L.; Cancellieri, M.; Morales, A.L.; Suárez-Varela, M.M. The Effect of the COVID-19 Lockdown on Air Quality in Three Italian Medium-Sized Cities. Atmosphere 2020, 11, 1118. [Google Scholar] [CrossRef]
- Dursun, S.; Sagdic, M.; Toros, H. The Impact of COVID-19 Measures on Air Quality in Turkey. Environ. Forensics 2021, 23, 47–59. [Google Scholar] [CrossRef]
- Liu, S.; Hua, S.; Wang, K.; Qiu, P.; Liu, H.; Wu, B.; Shao, P.; Liu, X.; Wu, Y.; Xue, Y.; et al. Spatial-Temporal Variation Characteristics of Air Pollution in Henan of China: Localized Emission Inventory, WRF/Chem Simulations and Potential Source Contribution Analysis. Sci. Total Environ. 2018, 624, 396–406. [Google Scholar] [CrossRef]
- Wang, M.; Wang, Y.; Feng, X.; Zhao, M.; Du, X.; Wang, Y.; Wang, P.; Wu, L. The Effects of Intensive Supervision Mechanism on Air Quality Improvement in China. J. Air Waste Manag. Assoc. 2021, 71, 1102–1113. [Google Scholar] [CrossRef]
- Xiong, Y.; Wang, Y.; Chen, F.; Zhu, M. Spatial Statistics and Influencing Factors of the COVID-19 Epidemic at Both Prefecture and County Levels in Hubei Province, China. Int. J. Environ. Res. Public Health 2020, 17, 3903. [Google Scholar] [CrossRef] [PubMed]
- Bai, Y.; Zhou, Y.; Alatalo, J.M.; Hughes, A.C. Changes in Air Quality during the First-Level Response to the COVID-19 Pandemic in Shanghai Municipality, China. Sustainability 2020, 12, 8887. [Google Scholar] [CrossRef]
- Zhao, X.; Wang, G.; Wang, S.; Zhao, N.; Zhang, M.; Yue, W. Impacts of COVID-19 on Air Quality in Mid-Eastern China: An Insight into Meteorology and Emissions. Atmos. Environ. 2021, 266, 118750. [Google Scholar] [CrossRef] [PubMed]
- Smith, K.A.; Caffrey, J.M. The Effects of Human Activities and Extreme Meteorological Events on Sediment Nitrogen Dynamics in an Urban Estuary, Escambia Bay, Florida, USA. Hydrobiologia 2009, 627, 67–85. [Google Scholar] [CrossRef]
- Xu, X.; Huang, G.; Liu, L.; Guan, Y.; Zhai, M.; Li, Y. Revealing Dynamic Impacts of Socioeconomic Factors on Air Pollution Changes in Guangdong Province, China. Sci. Total Environ. 2020, 699, 134178. [Google Scholar] [CrossRef] [PubMed]
- Wong, T.Y.T.; Xu, Y.; Chang, Y. Cross-Boundary Air Pollution Control Under “One Country, Two Systems”: Perspectives From Hong Kong–Guangdong Collaboration. Singap. Econ. Rev. 2020, 65, 601–625. [Google Scholar] [CrossRef]
- Luo, H.; Guan, Q.; Pan, N.; Wang, Q.; Li, H.; Lin, J.; Tan, Z.; Shao, W. Using Composite Fingerprints to Quantify the Potential Dust Source Contributions in Northwest China. Sci. Total Environ. 2020, 742, 140560. [Google Scholar] [CrossRef] [PubMed]
- Hochreiter, S.; Schmidhuber, J. Long Short-Term Memory. Neural Comput. 1997, 9, 1735–1780. [Google Scholar] [CrossRef]
- Farhi, N.; Kohen, E.; Mamane, H.; Shavitt, Y. Prediction of Wastewater Treatment Quality Using LSTM Neural Network. Environ. Technol. Innov. 2021, 23, 101632. [Google Scholar] [CrossRef]
- Pan, Y.; Wang, Y.; Lai, M. Research of Air Pollutant Concentration Forecasting Based on Deep Learning Algorithms. IOP Conf. Ser. Earth Environ. Sci. 2019, 300, 032090. [Google Scholar] [CrossRef]
- Bekesiene, S.; Meidute-Kavaliauskiene, I.; Vasiliauskiene, V. Accurate Prediction of Concentration Changes in Ozone as an Air Pollutant by Multiple Linear Regression and Artificial Neural Networks. Mathematics 2021, 9, 356. [Google Scholar] [CrossRef]
- Jephcote, C.; Hansell, A.L.; Adams, K.; Gulliver, J. Changes in Air Quality during COVID-19 ‘Lockdown’ in the United Kingdom. Environ. Pollut. 2021, 272, 116011. [Google Scholar] [CrossRef]
- Potts, D.A.; Marais, E.A.; Boesch, H.; Pope, R.J.; Lee, J.; Drysdale, W.; Chipperfield, M.P.; Kerridge, B.; Siddans, R.; Moore, D.P.; et al. Diagnosing Air Quality Changes in the UK during the COVID-19 Lockdown Using TROPOMI and GEOS-Chem. Environ. Res. Lett. 2021, 16, 054031. [Google Scholar] [CrossRef]
- Speranza, A.; Caggiano, R.; Summa, V. A Systematic Approach for the Comparison of PM10, PM2.5, and PM1 Mass Concentrations of Characteristic Environmental Sites. Environ. Monit. Assess. 2019, 191, 738. [Google Scholar] [CrossRef] [PubMed]
- Liu, J.; Zhang, Y.; Liu, X.; Tang, A.; Qiu, H.; Zhang, F. Concentrations and Isotopic Characteristics of Atmospheric Reactive Nitrogen around Typical Sources in Beijing, China. J. Arid Land 2016, 8, 910–920. [Google Scholar] [CrossRef] [Green Version]
- Fan, S.; Wang, B.; Tesche, M.; Engelmann, R.; Althausen, A.; Liu, J.; Zhu, W.; Fan, Q.; Li, M.; Ta, N. Meteorological Conditions and Structures of Atmospheric Boundary Layer in October 2004 over Pearl River Delta Area. Atmos. Environ. 2008, 42, 6174–6186. [Google Scholar] [CrossRef]
- Bergmann, M.L.; Andersen, Z.J.; Amini, H.; Ellermann, T.; Hertel, O.; Lim, Y.H.; Loft, S.; Mehta, A.; Westendorp, R.G.; Cole-Hunter, T. Exposure to Ultrafine Particles While Walking or Bicycling during COVID-19 Closures: A Repeated Measures Study in Copenhagen, Denmark. Sci. Total Environ. 2021, 791, 148301. [Google Scholar] [CrossRef]
- Lou, C.; Liu, H.; Li, Y.; Peng, Y.; Wang, J.; Dai, L. Relationships of Relative Humidity with PM2.5 and PM10 in the Yangtze River Delta, China. Environ. Monit. Assess. 2017, 189, 582. [Google Scholar] [CrossRef]
- Burgalossi, A.; Herfst, L.; von Heimendahl, M.; Förste, H.; Haskic, K.; Schmidt, M.; Brecht, M. Microcircuits of Functionally Identified Neurons in the Rat Medial Entorhinal Cortex. Neuron 2011, 70, 773–786. [Google Scholar] [CrossRef] [Green Version]
- Reiminger, N.; Jurado, X.; Vazquez, J.; Wemmert, C.; Blond, N.; Wertel, J.; Dufresne, M. Methodologies to Assess Mean Annual Air Pollution Concentration Combining Numerical Results and Wind Roses. Sustain. Cities Soc. 2020, 59, 102221. [Google Scholar] [CrossRef]
- Ren, B.; Xie, P.; Xu, J.; Li, A.; Tian, X.; Hu, Z.; Huang, Y.; Li, X.; Zhang, Q.; Ren, H.; et al. Use of the PSCF Method to Analyze the Variations of Potential Sources and Transports of NO2, SO2, and HCHO Observed by MAX-DOAS in Nanjing, China during 2019. Sci. Total Environ. 2021, 782, 146865. [Google Scholar] [CrossRef]
- Dhakal, S.; Gautam, Y.; Bhattarai, A. Exploring a Deep LSTM Neural Network to Forecast Daily PM2.5 Concentration Using Meteorological Parameters in Kathmandu Valley, Nepal. Air Qual. Atmos. Health 2021, 14, 83–96. [Google Scholar] [CrossRef]
- Liu, D.-R.; Hsu, Y.-K.; Chen, H.-Y.; Jau, H.-J. Air Pollution Prediction Based on Factory-Aware Attentional LSTM Neural Network. Computing 2021, 103, 75–98. [Google Scholar] [CrossRef]
Figure 1.
Location of administrative divisions and air quality monitoring stations in the Guangdong Province.
Figure 1.
Location of administrative divisions and air quality monitoring stations in the Guangdong Province.

Figure 2.
Changes in the concentration of PM2.5, PM10, NO2, and O3 in Guangdong Province during the study period.
Figure 2.
Changes in the concentration of PM2.5, PM10, NO2, and O3 in Guangdong Province during the study period.

Figure 3.
Spatial variation characteristics of the concentrations of PM2.5, PM10, NO2, and O3 in Guangdong Province during the study period.
Figure 3.
Spatial variation characteristics of the concentrations of PM2.5, PM10, NO2, and O3 in Guangdong Province during the study period.


Figure 4.
Daily average temperature and relative humidity trend chart for Guangdong Province during the study period.
Figure 4.
Daily average temperature and relative humidity trend chart for Guangdong Province during the study period.

Figure 5.
Rose chart of wind direction and wind speed in Guangdong Province during the study period.
Figure 5.
Rose chart of wind direction and wind speed in Guangdong Province during the study period.

Figure 6.
Potential source location of PM10, PM2.5, NO2, and O3 during the study period.


Table 1.
Percentage change in the concentrations of PM2.5, PM10, NO2, and O3 in Guangdong Province during the study period.
Table 1.
Percentage change in the concentrations of PM2.5, PM10, NO2, and O3 in Guangdong Province during the study period.
| Indicator (Unit: μg/m3) | PM2.5 | PM10 | NO2 | O3 |
|---|---|---|---|---|
| Pre-Lockdown | 37 | 64 | 34 | 75 |
| Lockdown | 23 | 31 | 14 | 57 |
| Percentage change | −37.84% | −51.56% | −58.82% | −24.00% |
| Post-Lockdown | 24 | 41 | 26 | 58 |
| Percentage change | 4.35% | 32.26% | 85.71% | 1.75% |
Table 2.
Effects of meteorological conditions and COVID-19 control measures on air quality under constant emission sources.
Table 2.
Effects of meteorological conditions and COVID-19 control measures on air quality under constant emission sources.
| Pollutants | The Contribution of Meteorological Factors | The Contribution of Epidemic Control | |||
|---|---|---|---|---|---|
| PM2.5 | −14.37 | 2.83 | −17.20 | 7.62% | −46.34% |
| PM10 | −32.50 | 2.29 | −34.79 | 3.59% | −54.56% |
| NO2 | −19.31 | 4.50 | −23.81 | 13.35% | −70.63% |
| O3 | −18.15 | 2.00 | −20.15 | 2.66% | −26.76% |
Publisher’s Note: MDPI stays neutral with regard to jurisdictional claims in published maps and institutional affiliations. |
© 2022 by the authors. Licensee MDPI, Basel, Switzerland. This article is an open access article distributed under the terms and conditions of the Creative Commons Attribution (CC BY) license (https://creativecommons.org/licenses/by/4.0/).
Share and Cite
MDPI and ACS Style
Li, L.; Mao, Z.; Du, J.; Chen, T.; Cheng, L.; Wen, X. The Impact of COVID-19 Control Measures on Air Quality in Guangdong Province. Sustainability 2022, 14, 7853. https://doi.org/10.3390/su14137853
AMA Style
Li L, Mao Z, Du J, Chen T, Cheng L, Wen X. The Impact of COVID-19 Control Measures on Air Quality in Guangdong Province. Sustainability. 2022; 14(13):7853. https://doi.org/10.3390/su14137853
Chicago/Turabian StyleLi, Lili, Zhihui Mao, Jianjun Du, Tao Chen, Lu Cheng, and Xiaocui Wen. 2022. "The Impact of COVID-19 Control Measures on Air Quality in Guangdong Province" Sustainability 14, no. 13: 7853. https://doi.org/10.3390/su14137853
Note that from the first issue of 2016, this journal uses article numbers instead of page numbers. See further details here.