

ISSN: 0973-7510
E-ISSN: 2581-690X
Coronaviruses are a family of viruses causing mild to severe upper respiratory tract syndrome. Recent pandemic threat caused by SARS-CoV-2 first appeared in Wuhan, China in December 2019. Whether the COVID-19 might be affected by warming global temperatures like some of previous pandemic flues. Therefore, the current study aims to analyze the effect of temperature and relative humidity (RH) on the spreading of the SARS-CoV-2 infection. The confirmed cases of COVID-19 in 31 different provinces in China and 274 provinces and/or countries were obtained from an online database. The real time temperature and humidity of the respective regions were taken from another online weather reporting data source. Spearman [R(s)] rank correlation was performed to identify the relationship between the variables (e.g., temperature, number of confirmed cases etc.). The overall spreading of SARS-CoV-2 in relations to temperature was inversely correlated. Among 29 of 31 provinces of China the overall correlation coeffient of the relationship between temperature and viral spread was negative [-R(s)] where in 15 provinces the correlation was at significant level (p<0.05). Furthermore, there was a significant negative relationship observed between the SARS-CoV-2 spreading and air temperature throughout the 274 provinces and/or countries of the world. However, there was no significant co-relationship between humidity and COVID-19 spreading either in China or among countries and/or various regions of the world. The SARS-CoV-2 infection seems to be spread in a wide range of temperature throughout the world. Thus, several factors including temperature, may influnce the SARS-CoV-2 spreading. As a results, relatively elevated air temperature could not completely prevent viral spread but it might be one of the important detrimental factors for SARS-CoV-2 rapid spread.
SARS-CoV-2, COVID-19, Infectivity, Temperature and Humidity
Coronavirus disease 2019 (COVID-19) caused by SARS-CoV-2 (Severe acute respiratory syndrome coronavirus-2) became a pandemic threat and serious public health emergency of international concern in the winter of 2019-201. Though COVID-19 was reported for the first time on December 31, 2019 in Wuhan, China, the disease has spread very rapidly throughout the world due to its extremely high contagiousness2,3. The clinical symptoms of COVID-19 are mild to high fever, cough, fatigue, dyspnea, headache, and diarrhea, which depend on the age and condition of the infected patients3, 4. However, the number of confirmed cases of COVID-19 is increasing worldwide due to human to human transmission, lack of vaccine, and antiviral drugs against SARS-CoV-22,3.
SARS-CoV-2 is a positive sense single stranded RNA virus under the betacoronavirus genus and coronaviridae family. It is an enveloped virus containing ~30.0 kb genome5. This viral genome is similar to bat coronaviruses6. The variation of nucleotide sequences is not enough to name it as different species from SARS coronavirus7. Envelope viruses are relatively sensitive to heat, detergent, and desiccation compared to non-enveloped viruses8,9. However, the overall temperature susceptibility of influenza virus increases (it can withstand 60-65°C) once it inhabits into a droplet 10. It has been reported that the viruses causing pandemic threat, e.g. SARS, MERS, H1N1 influenza, spread through ‘droplet transmission’ and/or ‘airborne transmission’11-13. In a laboratory experimental model, the transmission of respiratory droplets among guinea pigs affected by temperature and relative humidity revealed the shaping influenza seasonality14.
Moreover, a number of studies reported that environmental conditions including temperature and humidity are considered influencing contributors to the infectivity of viral infections15,16. The survivability of viruses in environments such as the air and the surfaces of the animate/inanimate objects is correlated with the temperature, humidity, and pH17. On the other hand, a recent report demonstrated that SARS-CoV-2 is primarily transmitted through respiratory droplets from the coughs and sneezes of infected patients18. The survivability of enveloped viruses in droplets depends on temperature and humidity19. Therefore, the persistence of respiratory droplets in the air may play a potential role in the high risk of infectivity of SARS-CoV-2.
Variations of regional temperature and humidity may prevent the outbreak of SARS coronavirus infection worldwide20. The temperature and humidity were around 4-10°C and ~50-72%, respectively during the outbreak of SARS-CoV-2 in Wuhan. As of April 12, 2020, almost all of the countries throughout the world with wide range of temperature and humidity have been affected with SARS-CoV-2. Previous studies on several strains of coronavirus showed the direct influence of air temperature, relative humidity, or change in pH on coronavirus survivability, transmission, and infections21,20,22,23. Though hundreds of scientific articles have been published on COVID-19 and/or SARS-CoV-2, there is no report on the effect of regional daily temperature and humidity on SARS-CoV-2 infection, recovery, and mortality rate. Thus, whether the local air temperature and relative humidity affect the spread of SARS-CoV-2 infection worldwide outbreak remains to be investigated. In the present study, we performed a retrospective analysis on the effect of daily temperatures and relative humidity on the infection of SARS-CoV-2 by collecting information of different infected regions/countries from online databases between January 31 and April 12, 2020. The report will help the scientific community to know or better perceive the in-depth and real impact of temperature and humidity on the global threat affected by SARS-CoV-2.
Study design and Data collection
The current analysis assessed a retrospective population level study by using online data repositories for the 2019 Novel Coronavirus Visual Dashboard operated by Johns Hopkins University’s Center for Systems Science and Engineering (JHU CSSE; https://github.com/CSSEGISandData/COVID-19). This online system has been providing real-time coverage of the COVID-19 outbreak all over the world including different provinces in China. To get appropriate temperature data of China, we have chosen the median temperature of each day (6:00 AM to 0:00 PM), the typical time when most people can be infected due to their movement. We excluded the temperature and humidity between 00:00 AM and 6:00 AM of the day because of sleeping time and/or less movement of people. In addition, we determined the average humidity using the above mentioned time range. We also obtained data of 274 provinces and/or countries from the same data sources. Here, we obtained only the median temperature and humidity of every provinces and/or countries of the respective analyzed time period. The databases have obtained data from a number of sources referenced in their website. These are publicly available online data without identification of infected patients directly obtained from public health authorities or by state media or WHO reports. Therefore, patient consent or ethics approval is not required. To collect the temperature in Fahrenheit (F) and relative humidity (RH), we chose an online weather portal ‘timeanddate.com” (https://www.timeanddate.com). We focused only on the temperature and humidity irrespective of all others factors relative to SARS-CoV-2 infection.
Data compilation
Though the virus outbreak occurred in December 2019 and the first confirmed case was identified in January 2020, we focused on data between January 31, 2020, and February 28, 2020 from 31 Chinese provinces (including Hong Kong) to extract key information of every alternative date. We chose this time frame because of the lack of a real picture of infections due to unawareness of SARS-CoV-2. After February, China developed a stronger management of its healthcare system for SARS-CoV-2 infection. Again, for the world population study, we obtained data from March 1 to April 12, 2020 because of insufficient data before the mentioned time frame.
Statistical analysis
Spearman [R(s)] rank correlation was performed to identify the relationship between the variables (e.g., temperature, number of confirmed cases etc.). We used Spearman rank correlation since our variables (one or both) are skewed or non-normal (normality is tested by qqPlot, supplenetary Fig. 1). Additionally, we fitted a simple linear regression line between the variables (e.g, Infected new cases vs temperature) to show the trend or pattern of the relationship. We also find out the extreme or outlier values by Studentized residuals in linear (using, t-tests) model and removed before using the Spearman rank correlation and linear regression. All statistical analysis were performed using R-language version 3.6.3.
The Spearman rank correlation coefficient of variable x and y is defined by
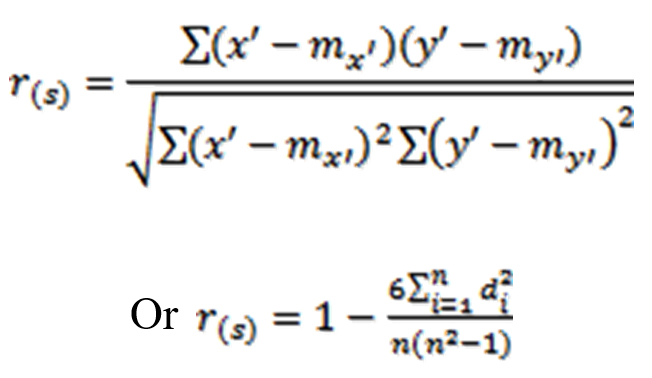 Where x’ = rank(x) and y’ = rank (y) di = x’ – y’
mx’ and my’ are the means of x’ and y’ variables.
The p-value (significance level) of the correlation coefficient is determined by t-test as,
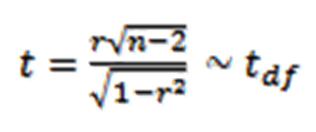
; degrees of freedom (df)=n-2
To test the significance level (a = 0.05 ), the testing hypothesis is
Null hypothesis (Ho) = There is no linear relationship between x and y variable.
Alternative hypothesis (H1) = There is linear relationship between x and y.
Relationship of SARS-CoV-2 infectivity and recovery with the temperature and humidity
First, we wanted to find out whether there is any correlation of SARS-CoV-2 infectivity with the temperature in different Chinese provinces. Therefore, the median temperatures of the 31 different Chinese provinces were analyzed in relation to their infection and recovery. Results showed that the median temperature of the Chinese provinces between January 31 and February 28, 2020 was 45.9°F with a range of -13.2 to 76.1°F. In 29 provinces out of 31, SARS-CoV-2 spreading in relation to temperature the calculated “R(s)” value was negative (Table 1).
Table (1):
Relationship of SARS-CoV-2 infectivity with the temperature among 31 provinces of China. The correlation between the Temperature and Infection was determined by the Spearman Correlation Coefficient [R(s)].
Sl No. |
State/Province |
R(s) value |
P value |
|---|---|---|---|
1. |
Guangxi |
-0.78762 |
0.000824 |
2. |
Tianjin |
-0.7309 |
0.002982 |
3. |
Heilongjiang |
-0.70211 |
0.00512 |
4. |
Yunnan |
-0.67341 |
0.00829 |
5. |
Qinghai |
-0.62712 |
0.016375 |
6. |
Jilin |
-0.61461 |
0.019344 |
7. |
Ningxia |
-0.60383 |
0.022214 |
8. |
Beijing |
-0.58357 |
0.028463 |
9. |
Jiangxi |
-0.55866 |
0.03784 |
10. |
Shanghai |
-0.54233 |
0.045112 |
11. |
Sichuan |
-0.54205 |
0.045248 |
12. |
Shanxi |
-0.54097 |
0.045764 |
13. |
Liaoning |
-0.53381 |
0.04929 |
14. |
Gansu |
-0.53254 |
0.049933 |
15. |
Guangdong |
-0.50332 |
0.066544 |
16. |
Inner Mongolia |
-0.47043 |
0.089585 |
17. |
Hunan |
-0.46889 |
0.090783 |
18. |
Fujian |
-0.4594 |
0.098418 |
19. |
Xinjiang |
-0.44822 |
0.107975 |
20. |
Guizhou |
-0.44234 |
0.113248 |
21. |
Shaanxi |
-0.4364 |
0.118746 |
22. |
Anhui |
-0.4106 |
0.144754 |
23. |
Chongqing |
-0.38953 |
0.168596 |
24. |
Jiangsu |
-0.38463 |
0.174495 |
25. |
Hebei |
-0.3665 |
0.197441 |
26. |
Henan |
-0.3658 |
0.198356 |
27. |
Hong Kong |
0.359606 |
0.206645 |
28. |
Zhejiang |
-0.35477 |
0.213265 |
29. |
Hubei |
-0.33003 |
0.249158 |
30. |
Shandong |
-0.20377 |
0.484712 |
31. |
Hainan |
0.177085 |
0.544757 |
Among the total number of patients (78,917 in 31 provinces), 99.7% were from the 29 provinces where negative correlation coefficient [-R(s) value] were observed in terms of SARS-CoV-2 infection and environmental temperature (Table 1 and 2). The median temperature of these 29 provinces was 43.7 °F whereas in the other 2 provinces, the median temperature was 68°F. However, all but 15 states were statistically non-significant of SARS-CoV-2 spreading in relation to temperature (Fig. 1A-O). The median temperature of these 15 states was 26.7°F.
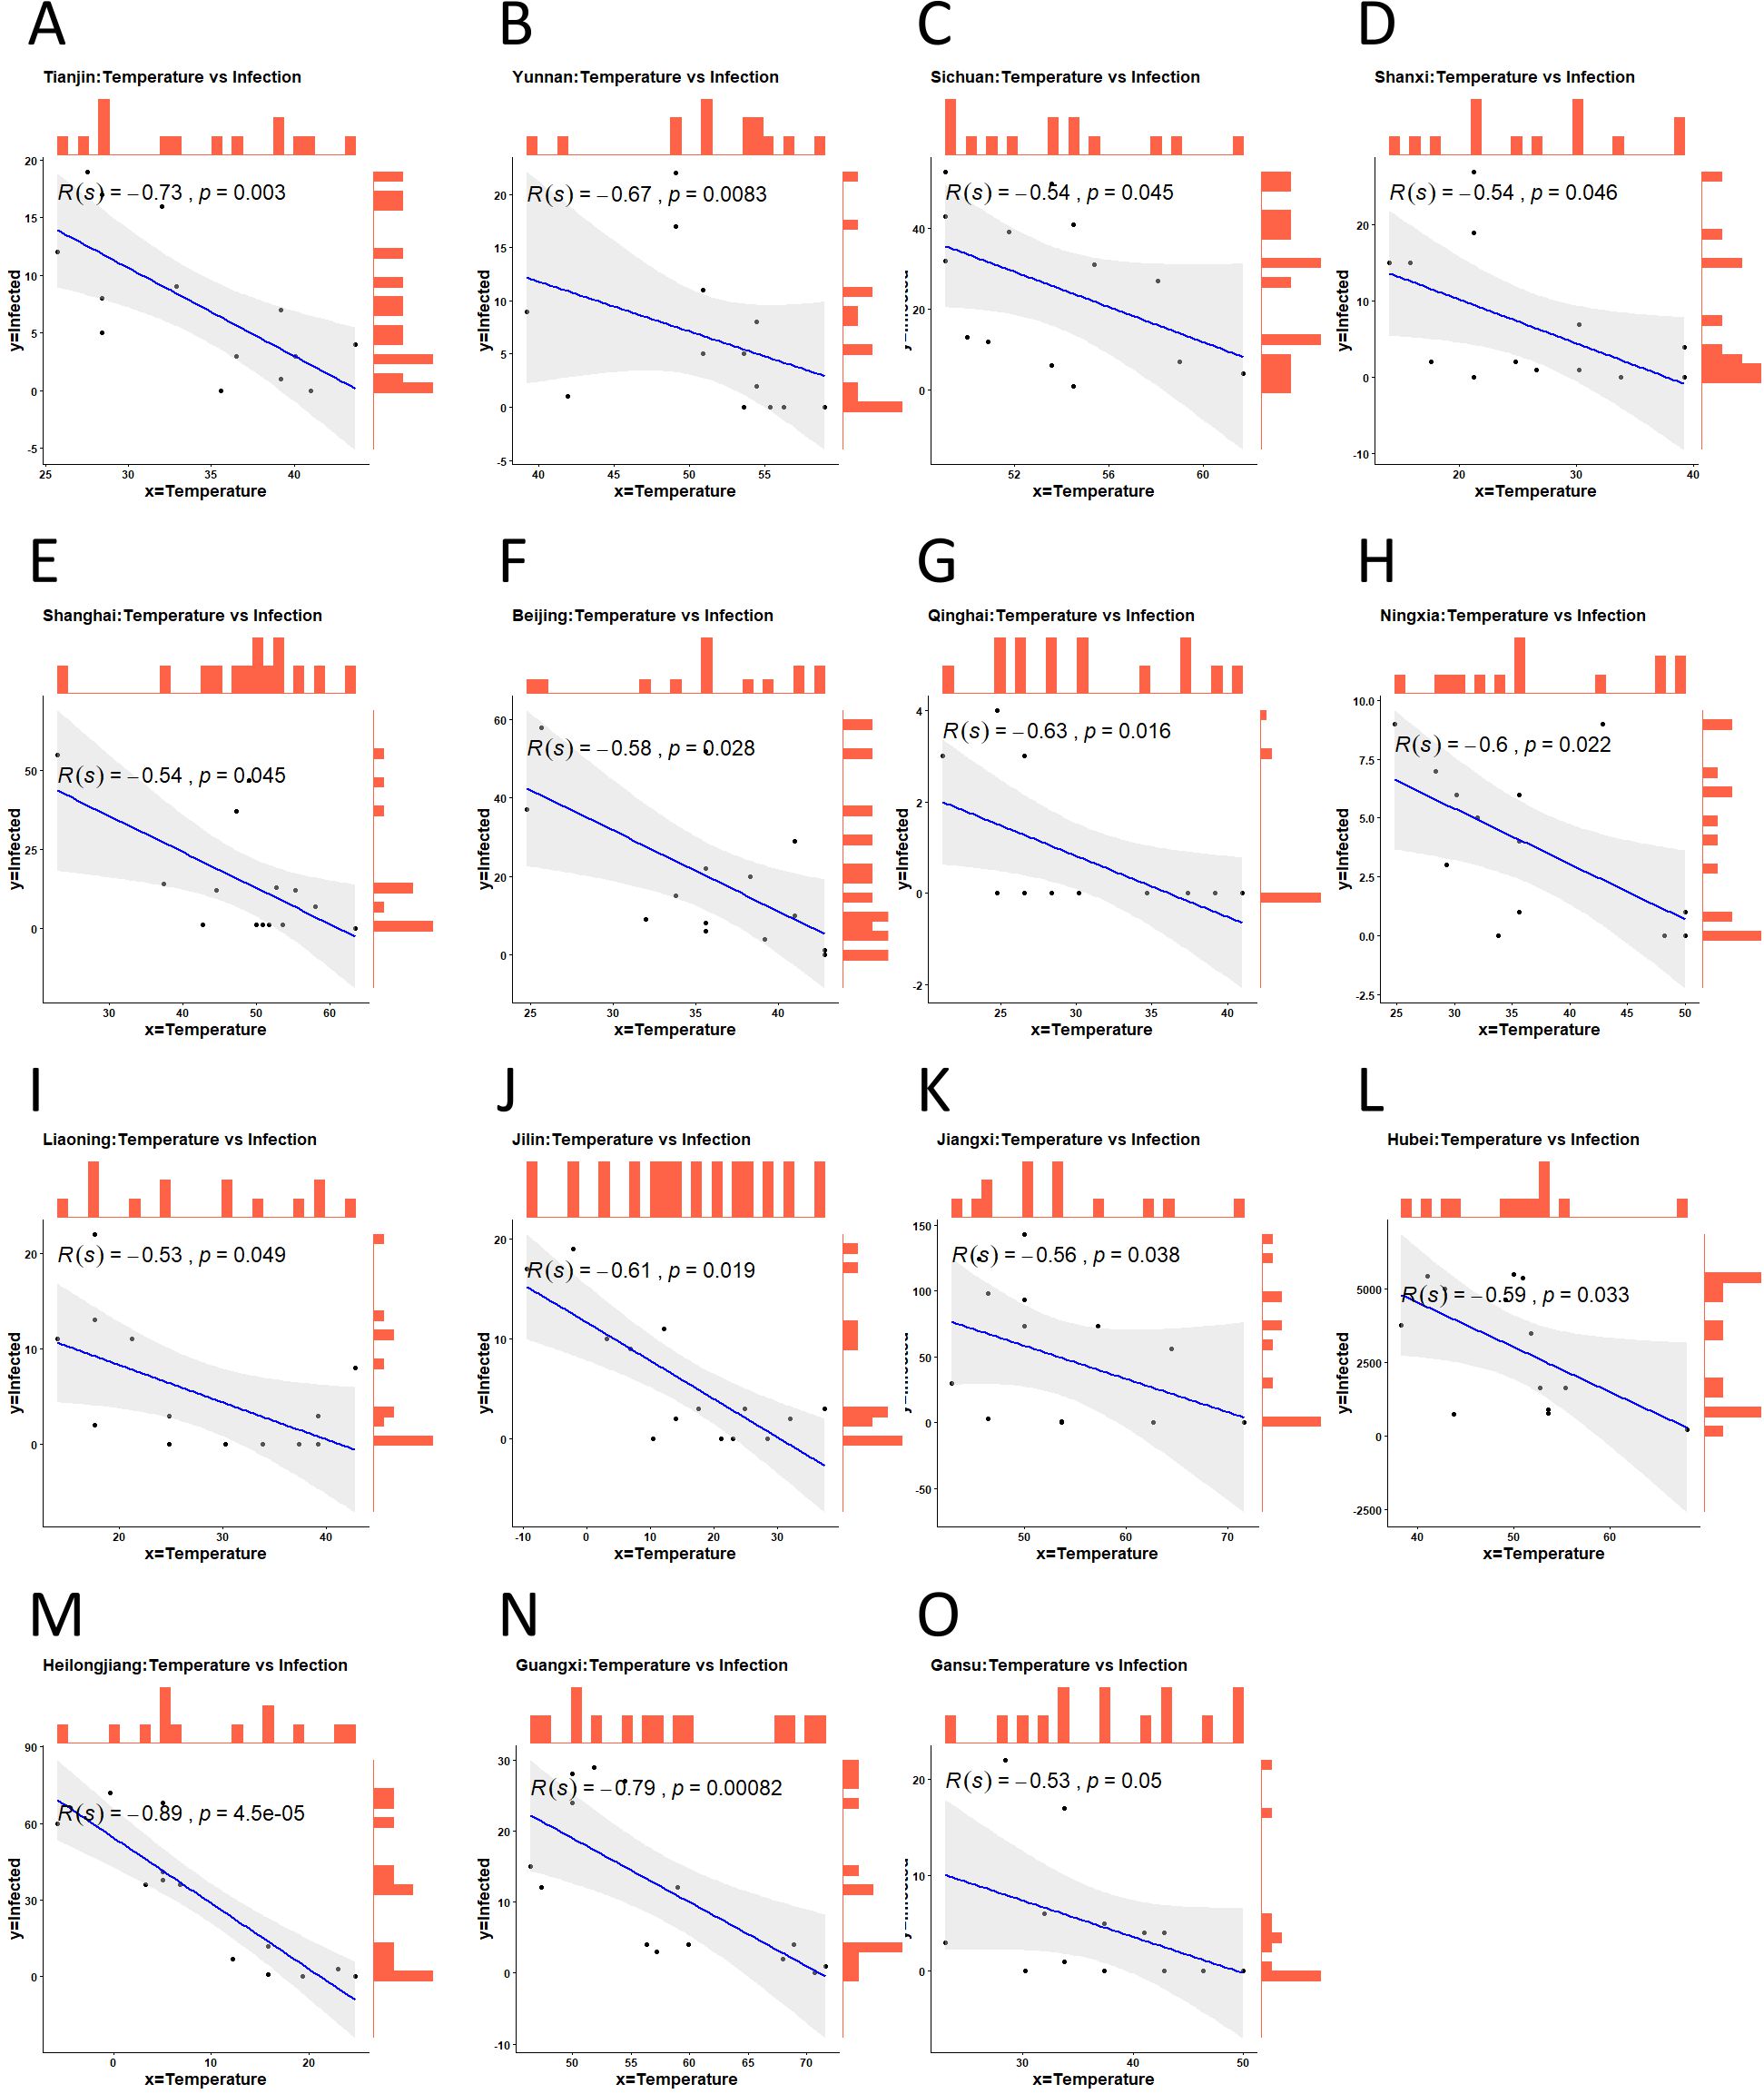
Fig. 1. Relationship between temperature (x) and number of infection (y) (A-O). The Fig. show that there is a significant (5% level) negative correlation between temperature and infection [R(s)= negative & p value ≤0.05)]. The blue line indicates the fitted linear regression line of the relationship. Each black point is paired (x, y) observations and shaded area indicates the deviance from the fitted line. Orange color bars indicate the frequency of each point for both variable.
Table (2):
Table showing the analyzed data of 31 different sates/province of China between the January 31, 2020 and February 28, 2020. The correlation between the Temperature and Infection was determined by the Spearman Correlation Coefficient [R(s)]. The overall comparison were done on the basis of positive correlation [R(s)= negative] and negative correlation [R(s)= negative].
| Comparison | Correlation | Number of states | Significant correlation | Number of confirmed cases | Median Temperature (F) |
Median Humidity |
|---|---|---|---|---|---|---|
|
Temperature versus Infection
|
Negative | 29 | 15 | 78655 | 43.7 | 70.25 |
| Positive | 2 | 0 | 262 | 68 | 76 | |
| Total (Upto February 28, 2020 in China) | 31 | 15 | 78917 | – | – | |
We performed similar analysis of SARS-Cov-2 spreading in relation to relative humidity. The infection was non-significant in relation to humidity in all states/provincess of China (Suppementary Table 1).
Worldwide relationship of COVID-19 spreading with temperature and humidity
Next we observed the status of worldwide SARS-CoV-2 spreading in relation to above environmental factors. We analyzed data of 274 different provinces and/or countries from March and to April 12, 2020, where the number of confirmed COVID-19 cases have been reported. The analysis was performed of the temperature and infection relationship in three different time periods; temperature vs new cases during March, temperature vs new cases from April 1 to 12, and temperature vs total cases from beginning of the infection up to April 12 for getting the real scenario. There was significant negative correlation between the air median temperature and new cases of either March or April. The spreading of COVID-19 from beginning to April 12, 2020, also showed similar relationship with the median temperature (Fig. 2 A-C).
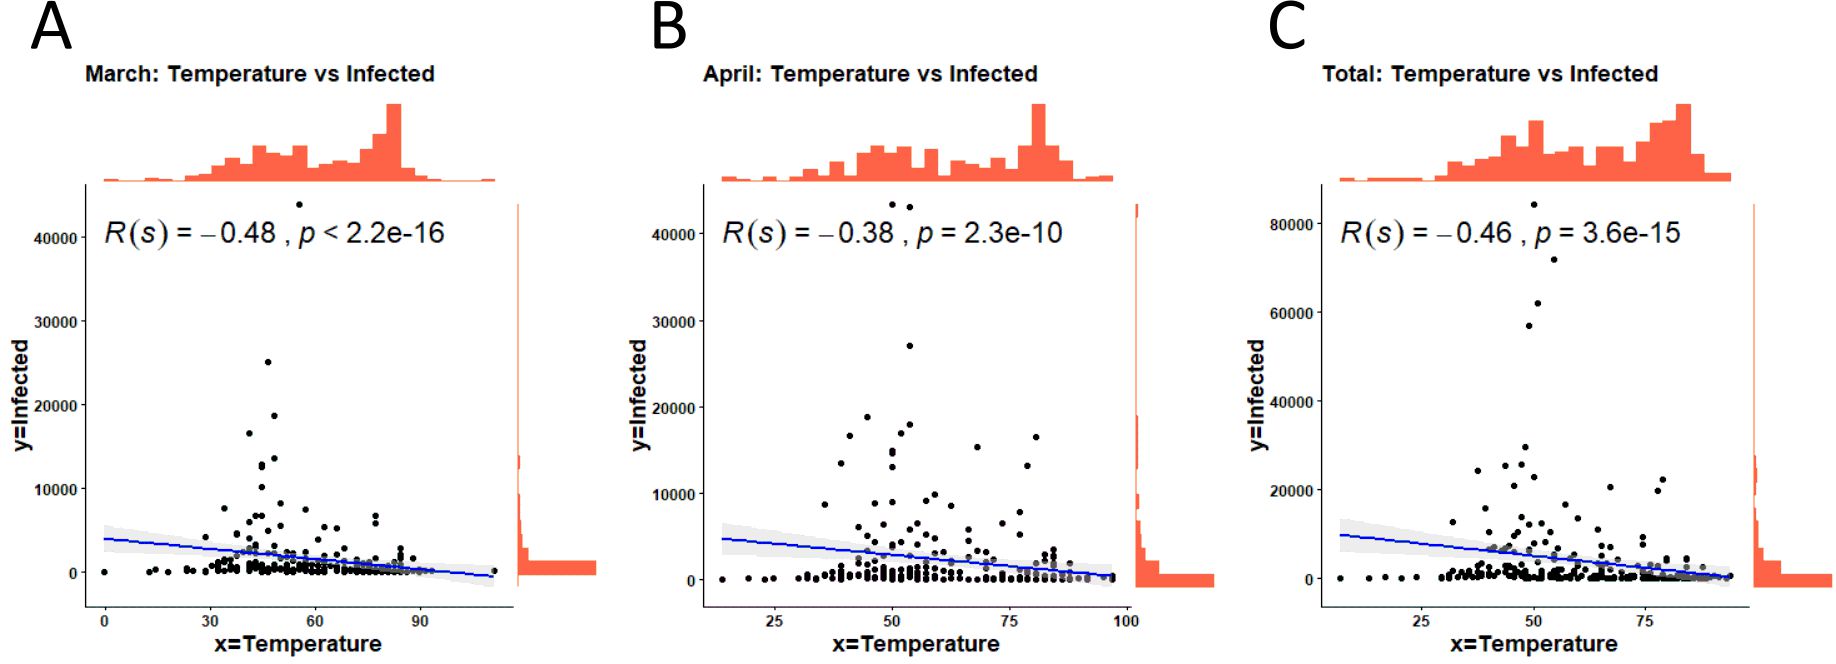
Fig. 2. Relationship analysis between temperature (x) and number of infected patients (y) in the world. The relationship was determined by individual monthly spreading (A) March (B) upto April 12 and (C) total spread from the beginning to still 12th April.
Next, we wanted to find out the temperature differences among the provinces and/or countries with high and limited spread of COVID-19 reported. In March, the median temperature of the provinces and/or countries with less than 500 confirmed cases was 75.2°F whereas the regions with more than 500 confirmed cases showed a median temperature 50°F. Then, we extended the analysis between >1000 and <1000 COVID-19 confirmed cases and found that the median temperature of the provinces and/or countries reported >1000 cases was lower than the provinces/countries that reported <1000 cases (Fig. 3 and Table 3).
Table (3):
The median temperature (F) and relative humidity of different provinces/countries. The data were sorted on the basis of the confirmed case reported <500 and >500, as well as <1000 and >1000.
| Number of countries/states | Number of Infection | Median Temperature (F) | Median Humidity | |
|---|---|---|---|---|
| March (1st -31st) Total Infection: 8,22,785 |
167 | <500 | 75.2 | 71 |
| 102 | >500 | 50 | 71 | |
| 196 | <1000 | 71.6 | 71 | |
| 73 | >1000 | 48.2 | 71 | |
| April (1st-12th) Total Infection: 9,87,344 |
156 | <500 | 75.2 | 72 |
| 116 | >500 | 53.6 | 63 | |
| 188 | <1000 | 71.6 | 72 | |
| 84 | >1000 | 53.6 | 61 | |
| From beginning to still April 12, 2020 Total Infection: 17,62,622 |
133 | <500 | 76.1 | 72 |
| 139 | >500 | 53.15 | 66.5 | |
| 161 | <1000 | 75.2 | 71.5 | |
| 111 | >1000 | 51.8 | 66 |
Similarly, we analyzed the new confirmed infection in April (1st -12th April, 2020) as well as total confirmed cases up to 12th April, 2020. For these cases, the results showed a similar pattern, i.e, the spread of COVID-19 was sigififcatly lower in warmer parts than the cold regions of the world (Fig. 3 and Table 3).
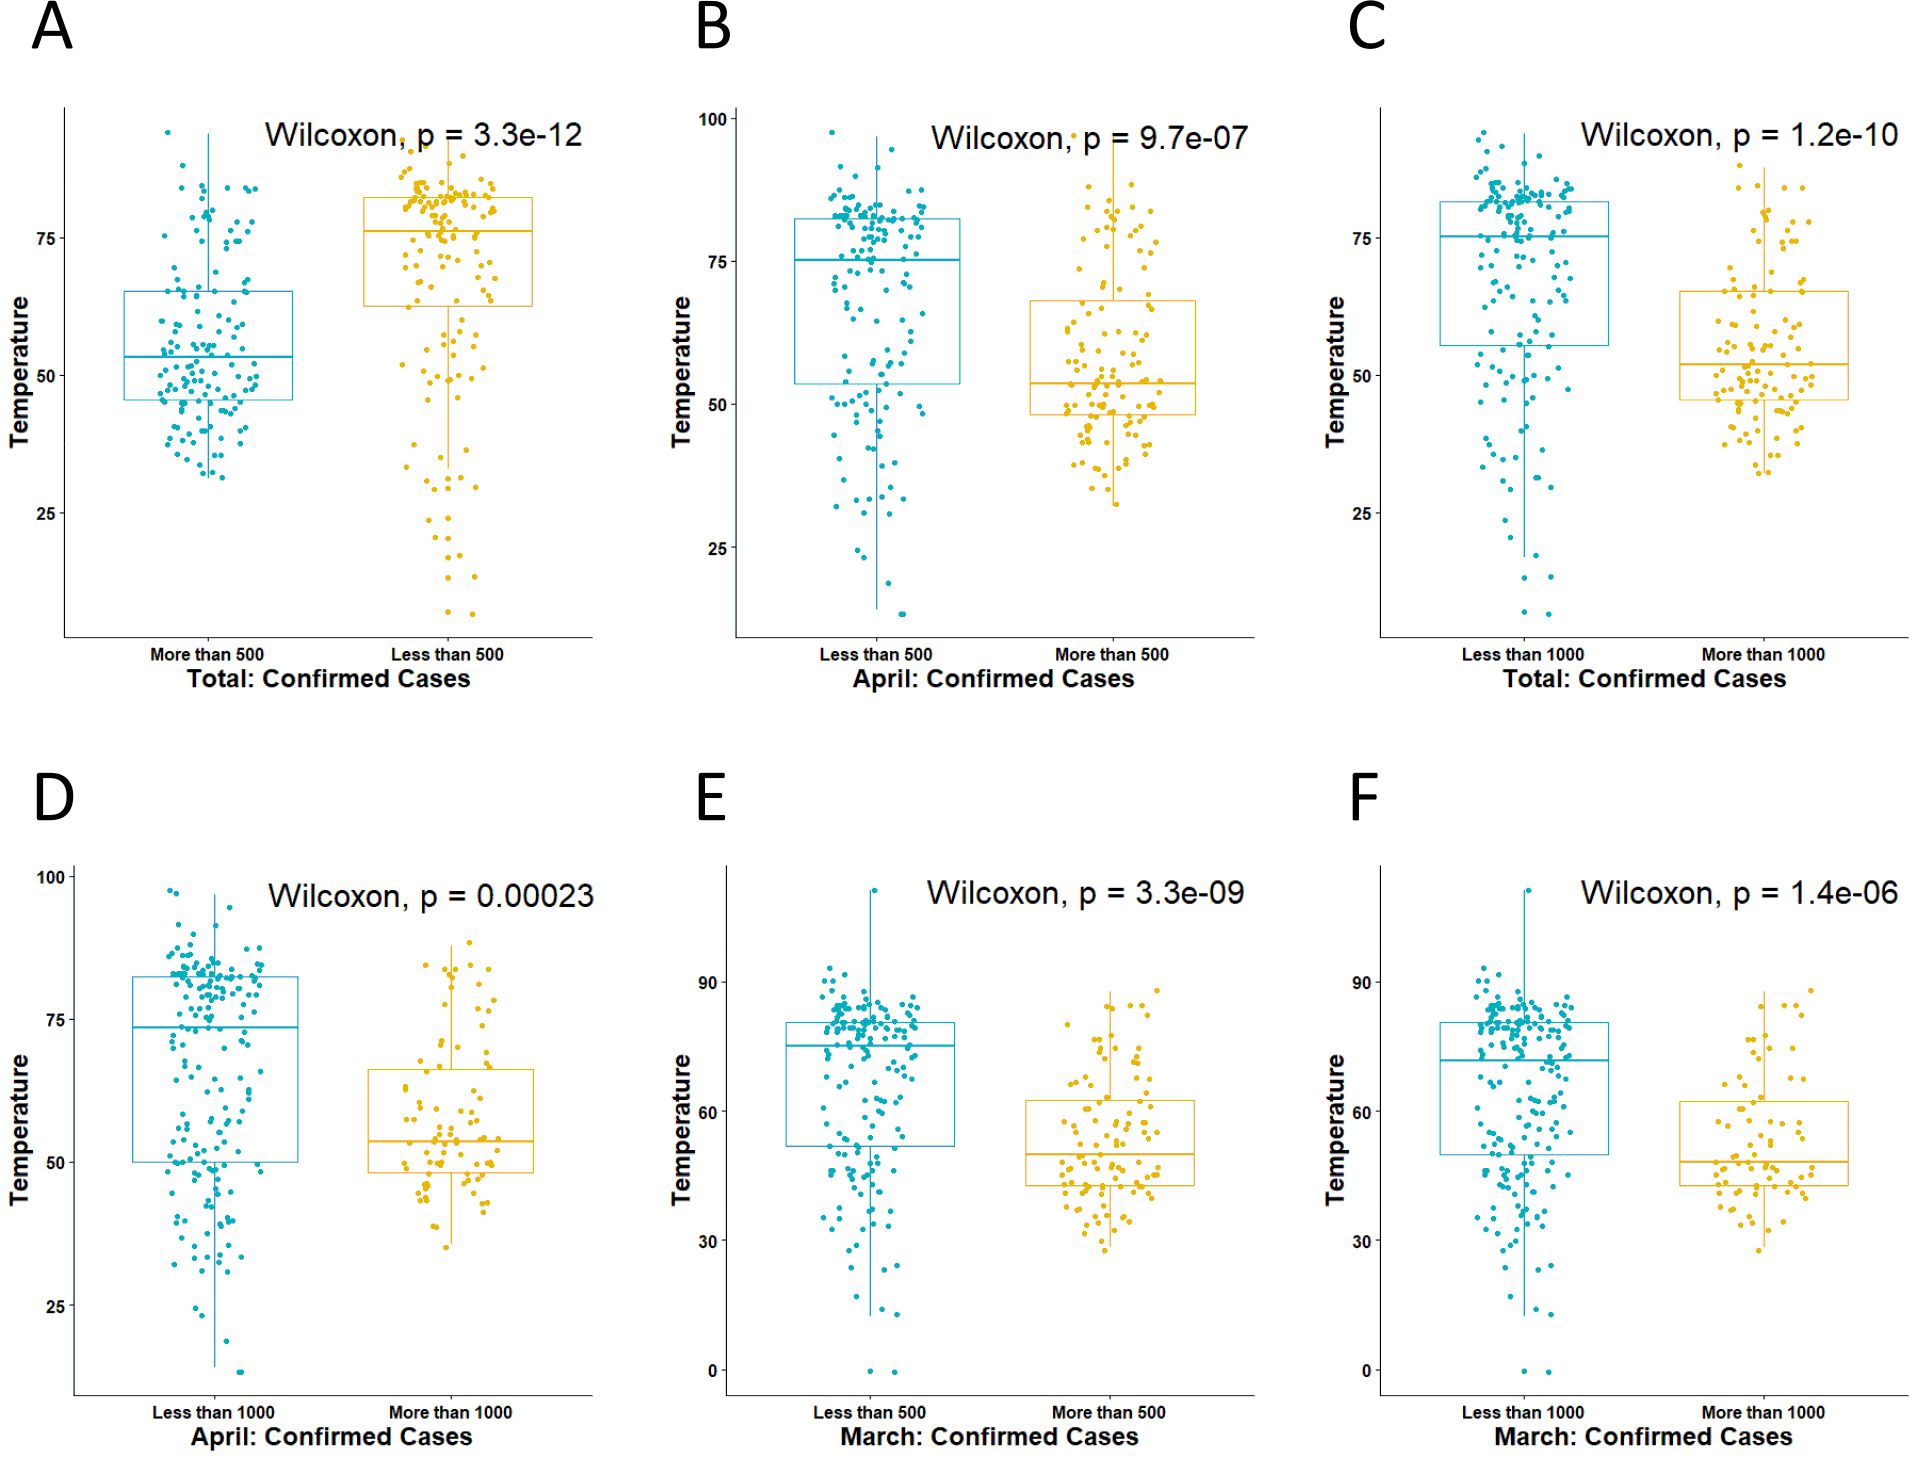
Fig. 3. Comparative analysis of environmental temperature among the highly and limited spreading cities/states/countries of the world. The comparison was done by taking the median temperature among the countries of either <500 and >500 as well as <1000 and <1000 confirmed cases. The comparison was done by using non-parametric Wilcoxon test due to non-normality of the data. It shows the temperature is significantly different between high and low cases regions.
However, the median humidity among the high and low spreading areas of the world were almost similar or slightly different (Table 3). We also analyzed the relationship of patients’ recovery and death to environmental temperature and relative humidity. We did not find any significant correlation among these analyses (data not shown).
The envelope of viruses consists of lipid bilayers which are more sensitive to heat, cold, pH, desiccation, and detergents, etc.24. Therefore, enveloped viruses have limited survivability outside of the host and lose their infectivity. Seasonal flus, such as influenza caused by the enveloped viruses, markedly increase in winter in the temperate countries25. The viral particles may also survive longer at low temperature and relative humidity25. Temperature is one of the important factors for proper infections of pathogens including viruses26. Low environmental temperature may increase physiological stress thereby weakening the immune system, which leads to more susceptibility to respiratory infections25. Though it has spread to almost all countries or the world including temperate regions, there are very limited reports in detail on the relationship of COVID-19 outbreak with temperature and relative humidity. In this retrospective analysis, we reported that the SARS-CoV-2 spread among the people correlates with temperature in the many provinces of China and provinces and/or countries throughout the world.
During the 2002-03 global SARS outbreak, the first case was identified in February 2002 and no new cases were reported after July 2003 27. The outbreak of COVID-19, caused by the SARS-CoV-2, occurred in the winter of 2019 in Wuhan, China where the temperature was around 39.2-50.0°F. The number of people infected in different Chinese provinces reached its maximum in February 2020. Our results showed the overall tendency of SARS-CoV-2 spreading in terms of temperature was negative as negative R(s) value was observed in 29 of 31provinces of China (with a median temperature 43.7°F), and around 50% (15 of 29) cases this negative correlation was at significant level. So far there are no experimental reports on temperature dependent aerosol transmission of SARS-CoV-2 but Casanova et al. showed that surrogate coronavirus can be rapidly inactivated at 68 °F air temperature21. Moreover, influenza virus transmission through aerosol is highly efficient at 41.0°F and could be blocked at a temperature of 86.0°F in experimental pig models14,28. Therefore, our study indicates that COVID-19 infection around 43.7°F might be critical as lower environment temperatures favor the viral spread.
Furthermore, we found limited viral spread in many provinces and/or countries throughout the world among a total of 274 countries where the median temperature was relatively high. Accordingly, temperate countries like Bangladesh, India, Pakistan, Nepal, Afghanistan, Cambodia, and Thailand were reported with limited community outbreak of COVID-19 during our analysis time. Though the spreading is slow compared to many other relatively cold regions, elevated air temperature could not completely prevent viral infectivity. Number of confirmed cases is highly dependent on number of test performed however, we excuded this probility because, test is only done upon the symptoms appears at signififcant level even among the develop countries. We assumed that the spreading of the temperate countries is primarily by person to person contact as the virus seems to be very contagious or by other modes of transmission29,30. Thus, temperate countries with densely populated areas and/or poor management system and lack of public awarness (eg. India, Bangladesh, Pakisthan and so on) are also at high risk. In addition, SARS-CoV-2 spread was higher in the states/cities of USA, Germany, Spain, Italy, and many other countries where relatively low temperatures were recorded. It is obvious that there were more test performed in these countries. However, the of number of confired cases were lower in different cities/provinces in a same country like USA, Germany, Spain, Italy, Japan, South Korea, Iran, Australia and so on where comparatively high air temperature were recorded. This hypothesis would be more appropriate in the case of surface contamination where the virus can survive for a longer period within droplets/aerosol/inanimate objects and indirect transmission may occur. However, the number of confirmed COVID-19 cases depend on the several factors such as number of test, public health policies and emergency measures taken by the countires and so on. We considered none of these factors except enviromental temperture and humidiy as we analyzed the data of almost all of the countries and/or states of the world.
Inactivation of viruses on surfaces also depends on humidity and maintains a correlation with temperature21. Lowest level of inactivation has been reported when the humidity was 20% at 39.2 °F21. A moderate humidity around 50% may be better for surrogate coronavirus than lower or higher levels21. Chan et. al reported that SARS coronavirus may survive on the surface over 5 days at relatively low humidity, 50-60%, with air temperature 71.6 -77.0°F 20. Moreover, virus viability is rapidly lost at relative humidity of >95% (temperature 100.4°F)20. Though, we found negative correlation between temperature and infection, it might have correlated with humidity. However, in our analysis, the effect of humidity on SARS-CoV-2 in 31 provinces of China or 274 provinces and/or countries of the world showed no correlation with the virus infections.
When the people are infected with SARS-CoV-2, they are typically maintained in a controlled environment in the hospital and at home. Thus, it is obvious there should be no correlation between the environmental factors such as temperature or humidity and recovery of death of the COVID-19 patients. Maybe due to these reasons, we did not find any relationship with temperature and recovery and death. Once the infection spreads and the number of infected people increases, recovery and death depends on numerous factors such as the patient’s immunity, predisposed factors, age, and most importantly the management system.
We have several limitations of this analysis. First, we analysized only SARS-2 infefction in relation to environmental factrs without cocnsidering all others factors like viral and host factors, patients age, sex, and measures taken by the contries and the number of test performed. Second, in China, we took the temperature and humidity at same day of SARS-CoV-2 case has been reported without considering the viral incubation time. These limitations are due to the unavailability/unability to confim the exact infecting day as well as variation of incubation period from person to person. To minimize these limitations we compared the confimed cases of diffetent countries/states of the world with the median temperature of a specific time period (whole months/few days).
The SARS-CoV-2 infection and/or spread are reported in both temperate and cold regions/countires. Comparatively higher air temperature could not completely prevent viral infectivity but it might be one of the important factors for SARS-CoV-2 rapid spread as lesser numbers of patients are infected compared to people living in cold weather.
Additional file: Additional Table S1, Figure S1.
ACKNOWLEDGMENTS
None.
CONFLICT OF INTEREST
The authors declare that there is no conflict of interest.
AUTHORS’ CONTRIBUTION
MAR, MGH and MAI collected and compiled the data. ACS and MAR analyzed the data. MGH, MAR, ACS, MAI and MSI wrote the manuscript. All the authors revised and edited the manuscript. All authors read and approved the final version of the manuscript.
FUNDING
None.
ETHICS STATEMENT
Not applicable.
AVAILABILITY OF DATA
All datasets generated or analyzed during this study are included in the manuscript and/or the Supplementary Files.
- Wang C, Horby PW, Hayden FG, Gao GF. A novel coronavirus outbreak of global health concern. Lancet. 2020;395(10223):470-473.
Crossref - Chan JFW, Yuan S, Kok KH, et al. A familial cluster of pneumonia associated with the 2019 novel coronavirus indicating person-to-person transmission: a study of a family cluster. Lancet. 2020;395:514-523.
Crossref - Hossain MG, Javed A, Akter S, Saha S. SARS-CoV-2 host diversity: An update of natural infections and experimental evidences. J Microbiol Immunol Infect. 2020;
Crossref - Huang C, Wang Y, Li X, et al. Clinical features of patients infected with 2019 novel coronavirus in Wuhan, China. Lancet. 2020;395(10223):497-506.
Crossref - Wu C, Liu Y, Yang Y, et al. Analysis of therapeutic targets for SARS-CoV-2 and discovery of potential drugs by computational methods. Acta Pharm Sin B. 2020;10(5):766-788.
Crossref - Zhou P, Yang X-L, Wang X-G, et al. A pneumonia outbreak associated with a new coronavirus of probable bat origin. Nature. 2020;579:270-273.
- Gorbalenya AE, Baker SC, Baric RS, et al. The species Severe acute respiratory syndrome-related coronavirus: classifying 2019-nCoV and naming it SARS-CoV-2. Nat Microbiol. 2020;5:536-544.
Crossref - Firquet S, Beaujard S, Lobert PE, et al. Survival of Enveloped and Non-Enveloped Viruses on Inanimate Surfaces. Microb Environ. 2015;30(2):140-144.
Crossref - Howie R, Alfa MJ, Coombs K. Survival of enveloped and non-enveloped viruses on surfaces compared with other micro-organisms and impact of suboptimal disinfectant exposure. J Hosp Infect. 2008;69(4):368-376.
Crossref - McDevitt J, Rudnick S, First M, Spengler J. Role of Absolute Humidity in the Inactivation of Influenza Viruses on Stainless Steel Surfaces at Elevated Temperatures. Appl Environ Microbiol. 2010;76:3943.
Crossref - Boone SA, Gerba CP. Significance of fomites in the spread of respiratory and enteric viral disease. Appl Environ Microbiol. 2007;73:1687-1696.
Crossref - Brankston G, Gitterman L, Hirji Z, Lemieux C, Gardam M. Transmission of influenza A in human beings. Lancet Infect Dis. 2007;7(4):257-265.
Crossref - Bridges CB, Kuehnert MJ, Hall CB. Transmission of influenza: implications for control in health care settings. Clin Infect Dis. 2003;37(8):1094-1101.
Crossref - Lowen AC, Steel J. Roles of humidity and temperature in shaping influenza seasonality. J Virol. 2014;88:7692-7695.
Crossref - Ansari SA, Springthorpe VS, Sattar SA. Survival and Vehicular Spread of Human Rotaviruses: Possible Relation to Seasonality of Outbreaks. Rev Infect Dis. 1991;13(3):448-461.
Crossref - Sattar SA. Microbicides and the environmental control of nosocomial viral infections. J Hosp Infect. 2004;56(Supp. 2):64-69.
Crossref - Yang W, Marr LC. Mechanisms by which ambient humidity may affect viruses in aerosols. Appl Environ Microbiol. 2012;78(19):6781-6788.
Crossref - Guarner J. Three Emerging Coronaviruses in Two Decades: The Story of SARS, MERS, and Now COVID-19. Am J Clin Pathol. 2020;153(4):420-421.
Crossref - Prussin AJ, Schwake DO, Lin K, Gallagher DL, Buttling L, Marr LC. Survival of the Enveloped Virus Phi6 in Droplets as a Function of Relative Humidity, Absolute Humidity, and Temperature. Appl Environm Microbiol. 2018;84(2):e00551-00518.
Crossref - Chan KH, Peiris JS, Lam SY, Poon LL, Yuen KY, Seto WH. The Effects of Temperature and Relative Humidity on the Viability of the SARS Coronavirus. Adv Virol. 2011:2011:734690.
Crossref - Casanova LM, Jeon S, Rutala WA, Weber DJ, Sobsey MD. Effects of air temperature and relative humidity on coronavirus survival on surfaces. Appl Environ Microbiol. 2010;76(9):2712-2717.
Crossref - Hess RG, Bachmann PA. In vitro differentiation and pH sensitivity of field and cell culture-attentuated strains of transmissible gastroenteritis virus. Infect Immun. 1976;13(6):1642-1646.
Crossref - Lamarre A, Talbot PJ. Effect of pH and temperature on the infectivity of human coronavirus 229E. Can J Microbiol. 1989;35(10):972-974.
Crossref - Sands J, Auperin D, Snipes W. Extreme sensitivity of enveloped viruses, including herpes simplex, to long-chain unsaturated monoglycerides and alcohols. Antimicrob Agents Chemother. 1979;15(1):67-73.
Crossref - Lofgren E, Fefferman NH, Naumov YN, Gorski J, Naumova EN. Influenza Seasonality: Underlying Causes and Modeling Theories. J Virol. 2007;81(11):5429.
Crossref - Tang JW. The effect of environmental parameters on the survival of airborne infectious agents. J Royal Soc Interface. 2009;6:S737-S746.
Crossref - Heymann DL, Rodier G. Global surveillance, national surveillance, and SARS. Emerg Infect Dis. 2004;10(2):173-175.
Crossref - Lowen AC, Steel J, Mubareka S, Palese P. High temperature (30°C) blocks aerosol but not contact transmission of influenza virus. J Virol. 2008;82(11):5650-5652.
Crossref - Tang A, Tong ZD, Wang HL, et al. Detection of Novel Coronavirus by RT-PCR in Stool Specimen from Asymptomatic Child, China. Emerg Infect Dis. 2020;26(6).
Crossref - Xiao F, Tang M, Zheng X, Liu Y, Li X, Shan H. Evidence for gastrointestinal infection of SARS-CoV-2. Gastroenterology. 2020;158(6):1831-1833.
Crossref
© The Author(s) 2020. Open Access. This article is distributed under the terms of the Creative Commons Attribution 4.0 International License which permits unrestricted use, sharing, distribution, and reproduction in any medium, provided you give appropriate credit to the original author(s) and the source, provide a link to the Creative Commons license, and indicate if changes were made.