
Impact of the COVID-19 Pandemic on Export Survival from Latin American Countries

Centro de Investigaciones Biológicas del Noroeste (CIBNOR), Instituto Politecnico Nacional 195, Colonia Playa Palo de Santa Rita, La Paz 23096, Mexico
Sustainability 2022, 14(14), 8709; https://doi.org/10.3390/su14148709
Submission received: 15 June 2022
/
Revised: 11 July 2022
/
Accepted: 13 July 2022
/
Published: 16 July 2022
Abstract
:This study analyzes the impact of mobility, as a proxy for social distancing measures, on exports to the United States of America (USA). A mobility index based on Google mobility indicators was constructed using Principal Component Analysis (PCA), and an Accelerated Failure Time (AFT) model was fitted to the data on export survival from a group of Latin American countries (LATAM). Higher mobility levels are associated with an acceleration of the risk of interruption of exports. On average, LATAM shows higher export survival levels compared to other countries. Higher innovation and market concentration favored export survival, while higher levels of Real Effective Exchange Rate (REER) are associated with a lower probability of survival. Differences in survival were found between export sectors with regard to machinery and transportation equipment.
1. Introduction
The COVID-19 pandemic poses a dilemma for many countries. Those that have prioritized health protection through public policies and implemented strict social distancing have experienced a significant reduction in their economic activities. By contrast, countries with loose sanitary measures to minimize disrupting economic growth from the pre-COVID-19 trajectory are recording highly negative results in terms of public health. Countries seeking a balance between both objectives would attain less severe results but might demand more resources [1,2,3].
It is important to consider that the measures to contain the spread of COVID-19 during the first months of the pandemic in LATAM, such as social distancing, mobility restrictions, temporary closure of activities, and reduction of working hours in non-essential activities, were not applied to the same extent across LATAM countries because each country determined which activities were essential by economic sector, as well as any changes in the working hours and temporary closure of activities. In most LATAM countries, activities such as tourism, construction, real estate, transportation, financial services, and education were affected for being considered non-essential.
In general terms, unemployment in production reduces supply; demand leads to contraction because the confinement decreases the frequency of use or imposes too many restrictions on the local environment. On the other hand, the potential winners under a pandemic include healthcare services, food processing and retail, personal care, products of greater economic complexity such as information and communication technologies [4], online commerce, and agriculture since they are deemed essential for the population [5].
The main objective of this study was to analyze the effects of mobility, as a proxy for social distancing and closure of activities, on exports, by estimating export risk and survival. In this regard, we asked the following research question: Are there differences in the risk of interruption/failure and survival/duration of exports between countries with different mobility levels as a proxy for social distancing measures applied during the first months of the COVID-19 pandemic?
The study period covered exports from January 2015 to April 2020. We mainly focused on the impact of the COVID-19 pandemic on exports to the U.S. market. To this end, we developed a mobility index, using both six Google mobility indicators per country and a Principal Component Analysis (a dimensionality-reduction method). This allowed obtaining a mobility index considering three strata—low, medium, and high—using the univariate Dalenius-Hodges method. With these mobility levels, the aim is to contrast the null hypothesis of no differences in survival rates between products according to the mobility level of the exporting country in April 2020 versus the alternative of differences in export survival according to the mobility levels of the countries of origin. Additional variables of interest are the market concentration level of countries exporting goods to the United States of America, the maritime connectivity levels of the different countries, innovation levels, infrastructure, and technical training as factors that increase export competitiveness and survival. Additionally, we explored potential differences in export survival according to the type of product or productive sector. An accelerated failure time (FFT) model was estimated. The duration analysis first displays estimates of survival rates, cumulative failures, hazard rates, and export survival graphs. Afterward, the drivers of hazard rates estimated using an AFT model are outlined.
LATAM countries ship more than 50% of their exports to the United States of America, except for countries such as St Vincent and the Grenadines, Cuba, Belize, Bolivia, Paraguay, Trinidad and Tobago, Panama, and Argentina. Of the countries in the region, only Mexico and Canada have important participation with 27.13% of total imports from the United States of America, ranking 2nd and 3rd in importance, respectively.
The first section of this work includes a brief introduction to the effects of containment measures such as social distancing and mobility restrictions on non-essential activities during the first months of the pandemic in LATAM countries. We analyzed the criteria regarding essential activities and time of implementation of social distancing measures with mobility restriction in LATAM and the effects of such measures on exports to the United States of America. The period and area of study, the objective, research questions, variables, and the model used are also described. The second section presents a review of the literature on international trade studies that explore the permanence of exports through survival and duration models with Kaplan-Meier and proportional hazard models known as Cox and Accelerated Failure Time (AFT) models. This section also describes the main explanatory variables of survival, risk of failure, and duration of exports used in previous studies, as well as the main contribution of this study to the specialized literature. The third section describes the sources of the variables and the methodology used to construct the dependent variable (duration of exports) and explanatory variables (real effective exchange rate, Herfindahl-Hirschman market concentration index, maritime connectivity index, innovation, exports by economic sector in dichotomous form, and mobility index), based on the Google COVID-19 community mobility indicator. The AFT model is also described and the interpretation of the risk acceleration; the exports survival time ratio is explained by the variables considered. The fourth section outlines the results of the AFT model for February, March, and April. The survival and risk functions are also displayed graphically, as well as the predictive margins at 95% statistical confidence. The fifth section discusses the consistency of the key findings with previous studies, highlighting the contribution to the specialized literature on survival, risk, and duration of exports in the first months of the implementation of social distancing and mobility restrictions to contain the spread of COVID-19 in LATAM. Finally, the sixth section draws conclusions on the use of variables that explain the survival, risk, and duration of exports supported by a literature review; the methods used, such as Principal Component Analysis and Accelerated Failure Time Models with Log-normal distribution; the results from model estimates; and the interpretation of the estimators and the acceleration rate of the risk and survival time of exports according to their statistical significance. This section also describes the scope and limitations of the study.
2. Literature Review
We reviewed and analyzed the literature on export survival available in the main databases, including Scopus, Web of Science, and Clarivate, among others, to identify the variables used (dependent and independent), type of data, the econometric technique used, region or country, sector, and authors (Table 1). The study did not aim to carry out a comprehensive search of empirical studies but focused on the works conducted over the past twenty years. The main results are presented below.
The types of data range from clustered to panel data, which were first processed with the early econometric techniques such as survival analysis, the Kaplan-Meier function belonging to non-parametric estimators, and Cox proportional hazard models classified within the semi-parametric duration models. Our review also included novel econometric strategies like duration models for discrete-time data such as logit, probit, extreme value, Weibull and Gamma distribution functions (parametric regressions), and state-of-the-art methods such as the weighted quantile regression for censored data.
The independent variables considered in regression analyses were macroeconomic variables such as GDP, GDP per capita, real exchange rate, and the Gini Index; microeconomic variables such as characteristics related to industry or companies; science and technology indicators such as patents; trade indicators such as the Balassa Index, tariffs, freight rate, transportation costs; variables of gravitational models such as geographic distance; variables related to economic geography such as Hirschmann-Herfindahl-type market and product concentration indices; country features such as a colonial link to another country, historical regime, and whether the country shares a common language with its trading partner; demographic indicators such as population size; and governance and institutional indicators.
According to the state of the art of export duration and the objectives of this study, we used variables such as the effective real exchange rate index, mobility index generated from Google mobility indicators by country, Herfindahl-Hirschman Market Concentration Index, maritime connectivity index, infrastructure innovation indicators, and technology readiness as pillars of economic competitiveness.
Duration models applied to international trade are a recent research topic. The pioneering works on trade duration are studies [47,48,49] showing that U.S. commercial relations are significantly short-lived, which is not in line with conventional international trade theories.
According to Nitsch [45] and, Baldwin and Krugman [50], exchange rates may affect trade relations as changes in the former can reduce the entry costs of exports. In this sense, products from countries with currency depreciation would be expected to show a lower rate of exit risk or interruption in exports to the United States, at least in the short term or at the beginning. As the authors of [44] point out, the depreciation of the exporting country’s exchange rate implies an increase in the importing country’s purchasing power in the exporter’s currency; this makes the exported products more appealing and increases the probability of export survival over time. The authors of [13] found that changes in bilateral exchange rates between China and destination countries are associated with a longer duration of exports from Chinese companies. The authors of [50] found that the depreciation of a country’s currency reduces its risk of exit of its products from the export market or interruptions in export flow. The authors of [36] observed that the effect of the exchange rate on the duration of imports from the United States of America is 50% higher than transportation costs based on the Cox proportional hazard model, while estimates with a probit model showed that both effects are similar. However, The authors of [10] argue that the exchange rate is irrelevant to determining trade duration. The study by the authors of [51] indicates a marginal effect of the exchange rate on the risk of agri-food exports from the European Union. In other studies conducted by the authors of [15,24,38], the exchange rate is not statistically significant.
The COVID-19 pandemic is an unprecedented event in the recent history of international trade. There is still no empirical literature describing the effects of the pandemic on exports at the global and regional levels or to the United States of America. For the above, the present study aimed to analyze the impact of social distancing and suspension of work activities in companies that produce goods for export. To this end, a mobility index is proposed as a proxy for these pandemic prevention and mitigation measures, aiming to estimate the impact of these measures on exports to the United States of America based on export data for 234 countries or territories from January 2015 to April 2020.
The authors of [23] used the Herfindahl Market Concentration Index to contrast differences in the survival of exports of Indian firms according to the industrial concentration level. However, they did not find statistically significant differences in sectoral specificities and concluded that the export risk of companies is essentially similar across different sectors. The authors of [37] analyzed product survival from a multi-product company approach, using the Hirschman-Herfindahl index to determine whether the domestic market concentration is a major source for paying fixed export costs. These authors found that the level of domestic market concentration was not statistically significant in export survival.
The degree of maritime connectivity of a country determines the transportation costs of its export products and thus its competitiveness in the international market. It measures the degree of connection of countries to global maritime transportation networks. This index is calculated by the United Nations Conference on Trade and Development (UNCTAD) based on five components: number of vessels, container transportation capacity, maximum vessel size, and number of services and companies deploying container vessels in a country’s ports. In a study addressing the costs of international trade in OECD countries, the authors of [52] used the maritime connectivity index in a gravitational model as a variable reflecting the quality of maritime transportation in OECD countries. These authors found that reducing trade transportation costs requires improving the functioning of seaports, infrastructure, and shipping quality in each country.
Chen and Wei-Chih [38] used the number of patents issued by the U.S. Patent Office as a proxy for innovative capacity to explain the duration of exports from 160 countries to the U.S.A.; they leveraged a Cox proportional hazard model. This study reported that export duration increases with higher innovation levels.
Fabling and Sanderson [53] explored the impact of infrastructure on the performance of export companies in New Zealand using a Cox proportional hazard model. The authors generated a control variable to contrast differences in the survival of exports before and after the construction of a port. They found no significant effects on exports from the start of operation of the port. The publications analyzed in the literature review do not intend to cover all the studies on duration models in the context of exports but only to describe their main contributions related to the variables of interest included in the specified model with the respective economic analysis. Another aspect to highlight is that there are no studies addressing export duration models for LATAM under a pandemic scenario. The theoretical-methodological contribution of Besedes and Prusa [48] has been adopted to construct a model for estimating the duration of trade relationships between the countries in the LATAM region and the United States of America and identifying whether these trade flows are permanent or transitory. The central questions identified in the works applying the export duration model approach are: What is the exact time that trade flows are maintained? Are these trade relations long-term or short-term? Under a pandemic scenario, duration models produce empirical evidence of the duration of trade relations between LATAM countries and the United States of America until they stop exporting to this economy due to the COVID-19 pandemic, an event considered a failure. In this sense, the intention is to measure the magnitude of the survival of exports from LATAM to the U.S.A. and the probability of failure occurring, i.e., when trade relations are interrupted.
3. Research Methodology
The index was constructed based on Google COVID-19 Community Mobility indicators. Anonymized location data from mobile devices were compiled to estimate the distance to specific geo-referenced locations such as retail stores, recreation sites, supermarkets and pharmacies, parks, transit stations, and workplaces; for residential areas, the length of stay is measured (Table 2). These data are expressed in terms of the percent variation relative to a baseline day prior to the pandemic outbreak; the baseline day is the median over five weeks from 3 January to 6 February 2020.
The PCA was used to construct the index for the period February–April. The Kaiser-Meyer-Olkin measure of sampling adequacy was 0.86 (p = 0.01), showing that the PCA was adequate. The first principal component accounted for 80.63% of the total variance in the data. Table 3 shows the total explained variance.
The first component showed a characteristic root greater than 1, accounting for 80.63% of the variance. To estimate the index, the regression method was used as a criterion from which the standardized coefficients were obtained. These coefficients were used to generate the mobility index scores shown in Table 4.
These coefficients were substituted in the principal component equation together with the standardized mobility values in each country for each period from February to April:
where is the jth standardized coefficient that makes up the index (Table 4), and is the mobility variable in the ith country during the period . The mobility index was stratified using the univariate Dalenius-Hodges method considering three strata: low, medium, and high.
Monthly export data for 234 countries or territories for January 2015–April 2020 were obtained from [55]. Mobility indicator data were obtained from [54] Google Mobility Indicators for April 2020. Data with annual frequency for the effective real exchange rate, Herfindahl-Hirschman Index, connectivity, and innovation index were obtained from the databases in [56,57,58] and are listed in Table 5.
The inclusion of the mobility index in the Accelerated Failure Time model allowed for controlling the changes in the population mobility in each country during the first months of the COVID-19 pandemic relative to a “normal” period. This is because this index measures changes in the mobility of the population during the first months of the pandemic—February, March, and April 2020—relative to the median mobility under normal conditions (the previous five weeks, from 3 January to 6 February 2020). The inclusion of the mobility index as a proxy for social distancing measures, changes in working hours, and the temporary closure of economic activities made it possible to identify the effects of these measures on the survival, risk, and duration of exports between LATAM and the United States of America.
Accelerated Failure Time Model
The Log-normal Accelerated Failure Time (AFT) model assumes that the natural logarithm of time follows a normal distribution; survival functions and the hazard function can be expressed as:
where is the standard normal cumulative distribution function and is the probability density function at time t. Given the matrix of covariates , the survival function is:
where is the survival time, is a vector of coefficients, and is the acceleration factor of the survival function. According to [59], the log-likelihood function to estimate, for observed times, , is given by:
where is a vector of covariates. In our implementation on the duration of exports, encompasses mobility, connectivity, concentration, REER, and innovation values for the j-th country; δ is a variable that takes the value of 1 if is an export observation and 0 if is a right-censored observation due to the absence of exports; are the parameters to estimate. The interpretation of the acceleration ratio is the survival time. Mobility index values for each period are shown in Appendix A.
4. Results
Table 6 shows the results of global exports and exports from LATAM countries based on AFT regression models or accelerated failure time, assuming that export interruptions follow log-normal distributions. The predictors were interpreted using time ratios (TR), where the ratio denotes the export survival acceleration factor so that the time ratio will be for predictors expressed in ordinal variables and 1 − when there are differences between control groups in relation to the reference group.
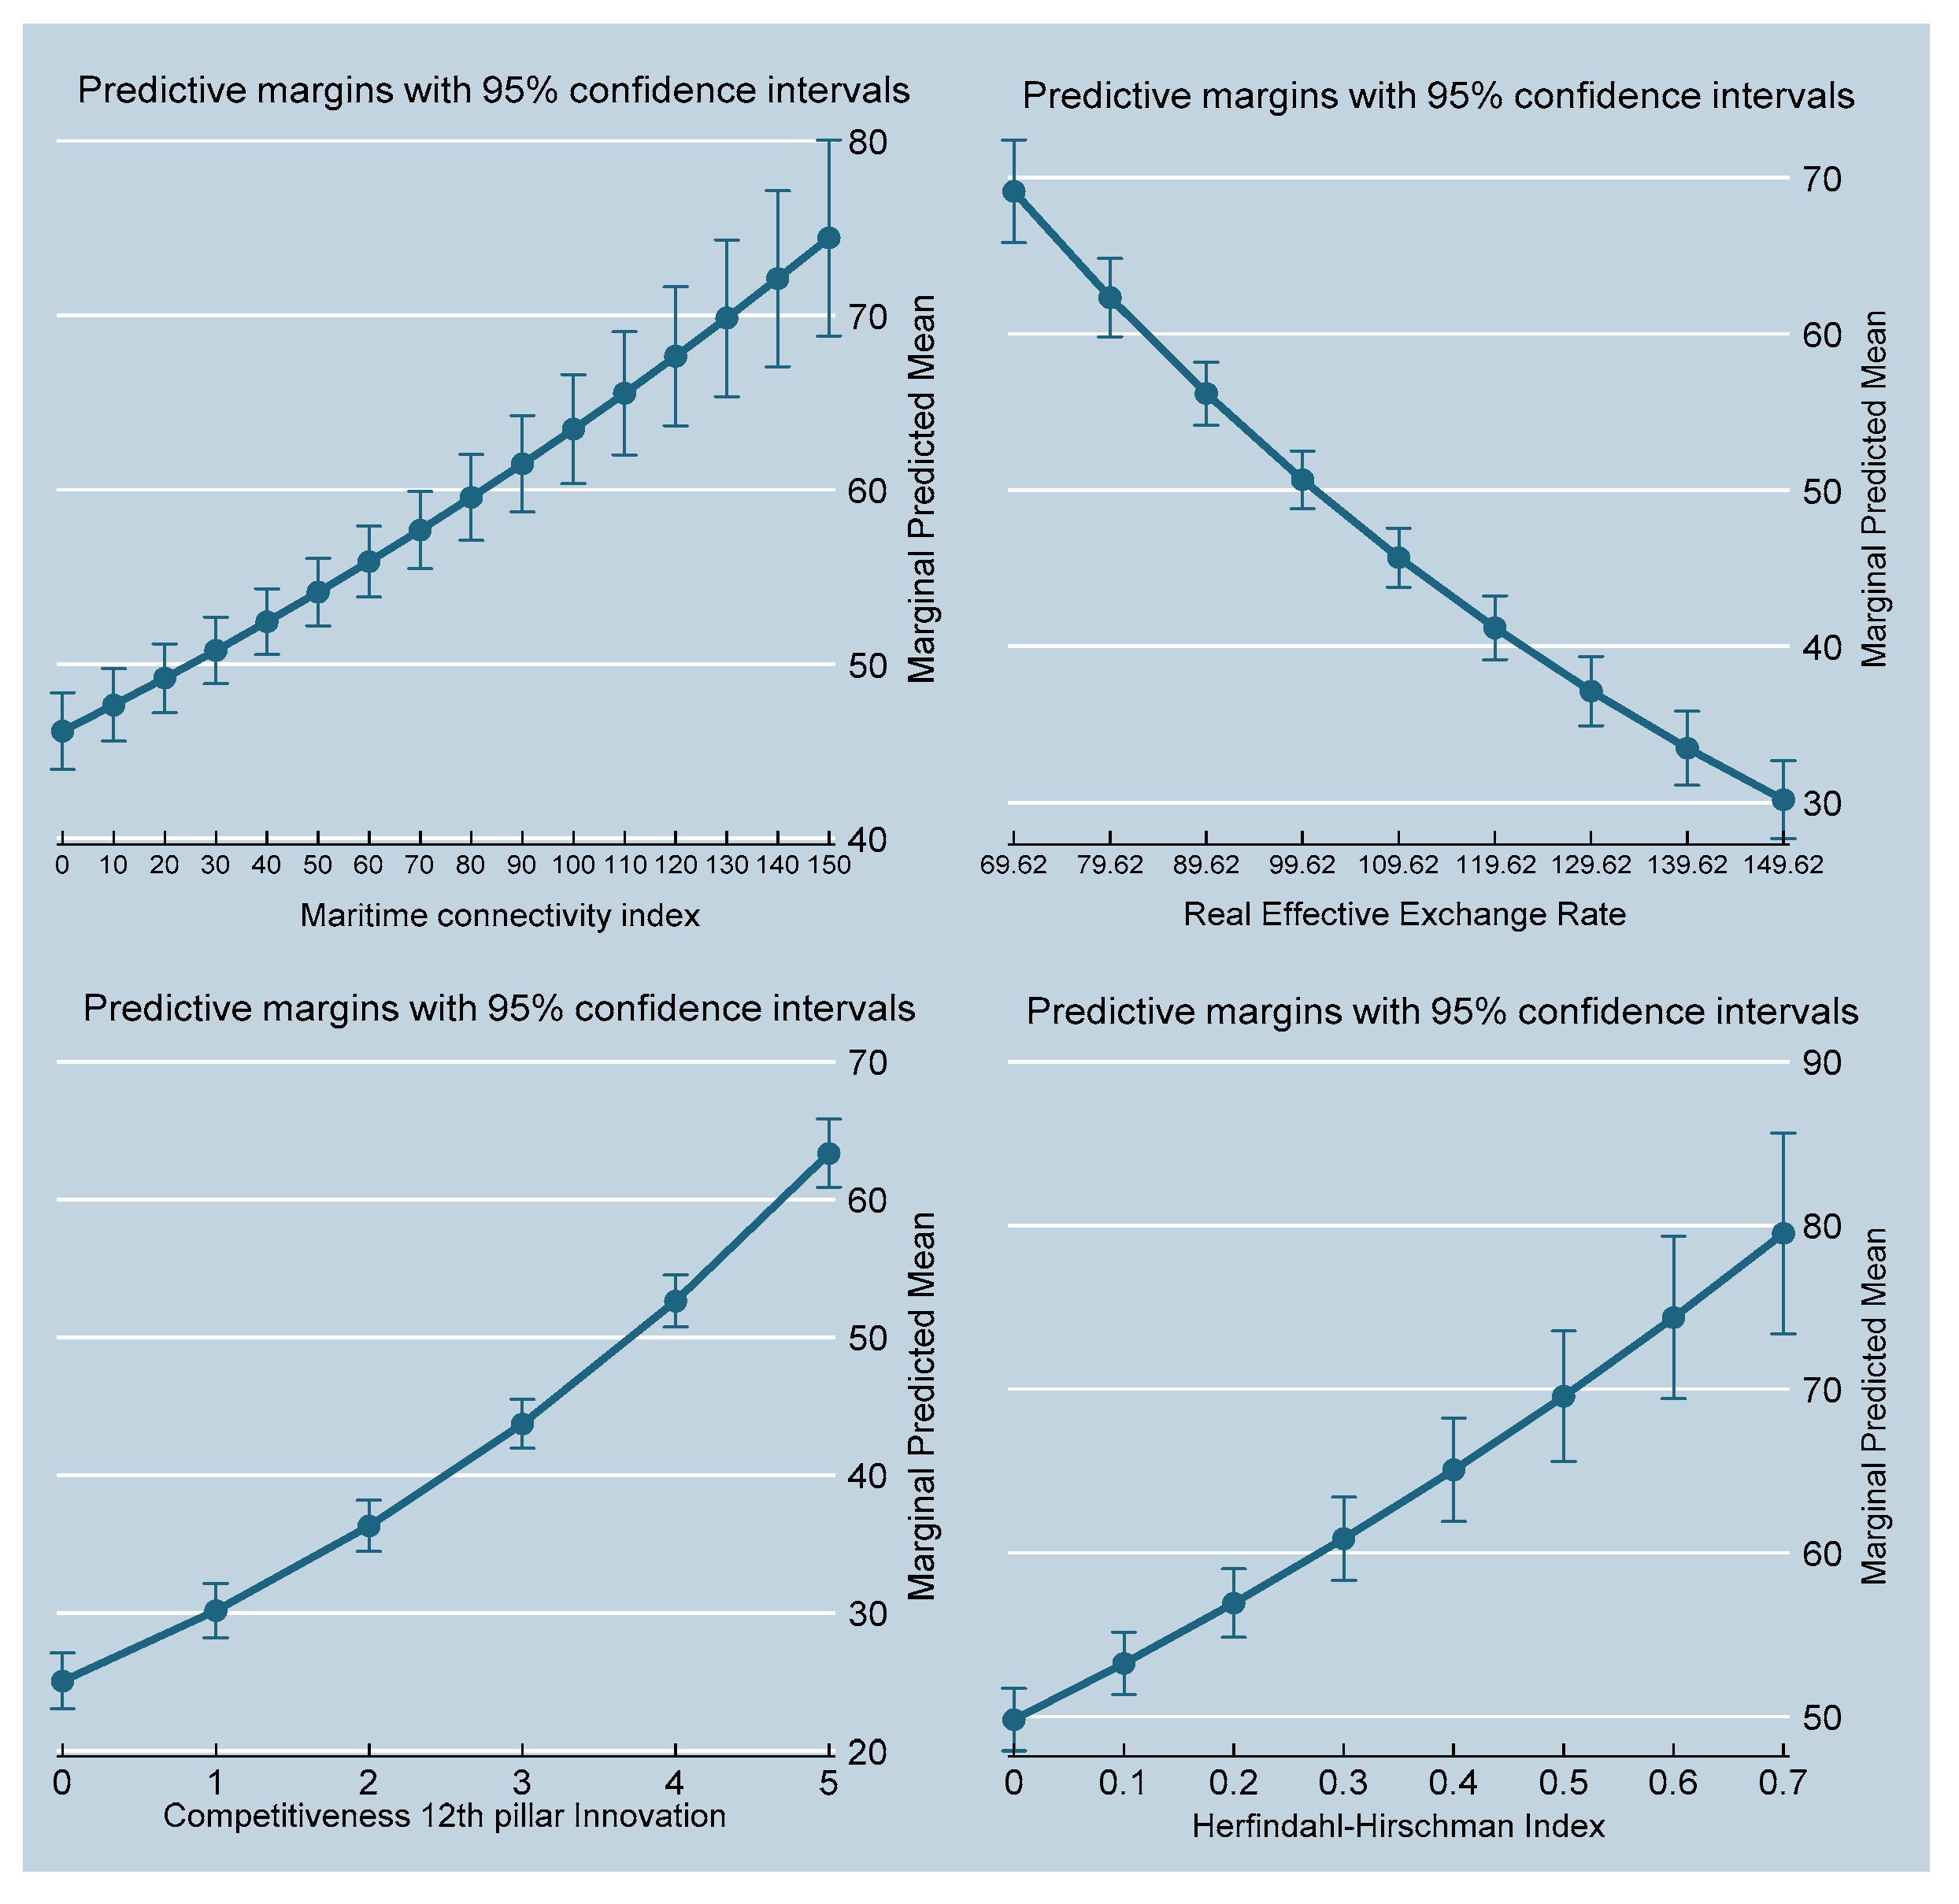
The above results reveal that as of April 2020, products originating from LATAM countries had a 4% higher survival rate compared with products from other countries with 90 percent confidence. Considering the same period, increases in the mobility index were associated with a 7% lower survival of global exports with 99 percent confidence. Products from countries with higher maritime connectivity levels did not show a reduction in the probability of survival, as indicated by the 0.0% time ratio. This suggests that greater maritime connectivity reduces the risk of export failure with 99 percent confidence. Increases in the Hirschmann-Herfindahl index of market concentration stimulate export survival, as evidenced by the 0.81% time-to-failure ratio. A 1% rise in market concentration increases the probability of export survival by 0.81% (p = 0.01).
On the other hand, countries with bilateral real exchange rate appreciations have a slightly lower probability of survival (1%) with 99 percent confidence. The results of the variable technological preparation reveal that a 1% rise in the level of innovation and technical readiness increases the probability of export survival by 0.21%.
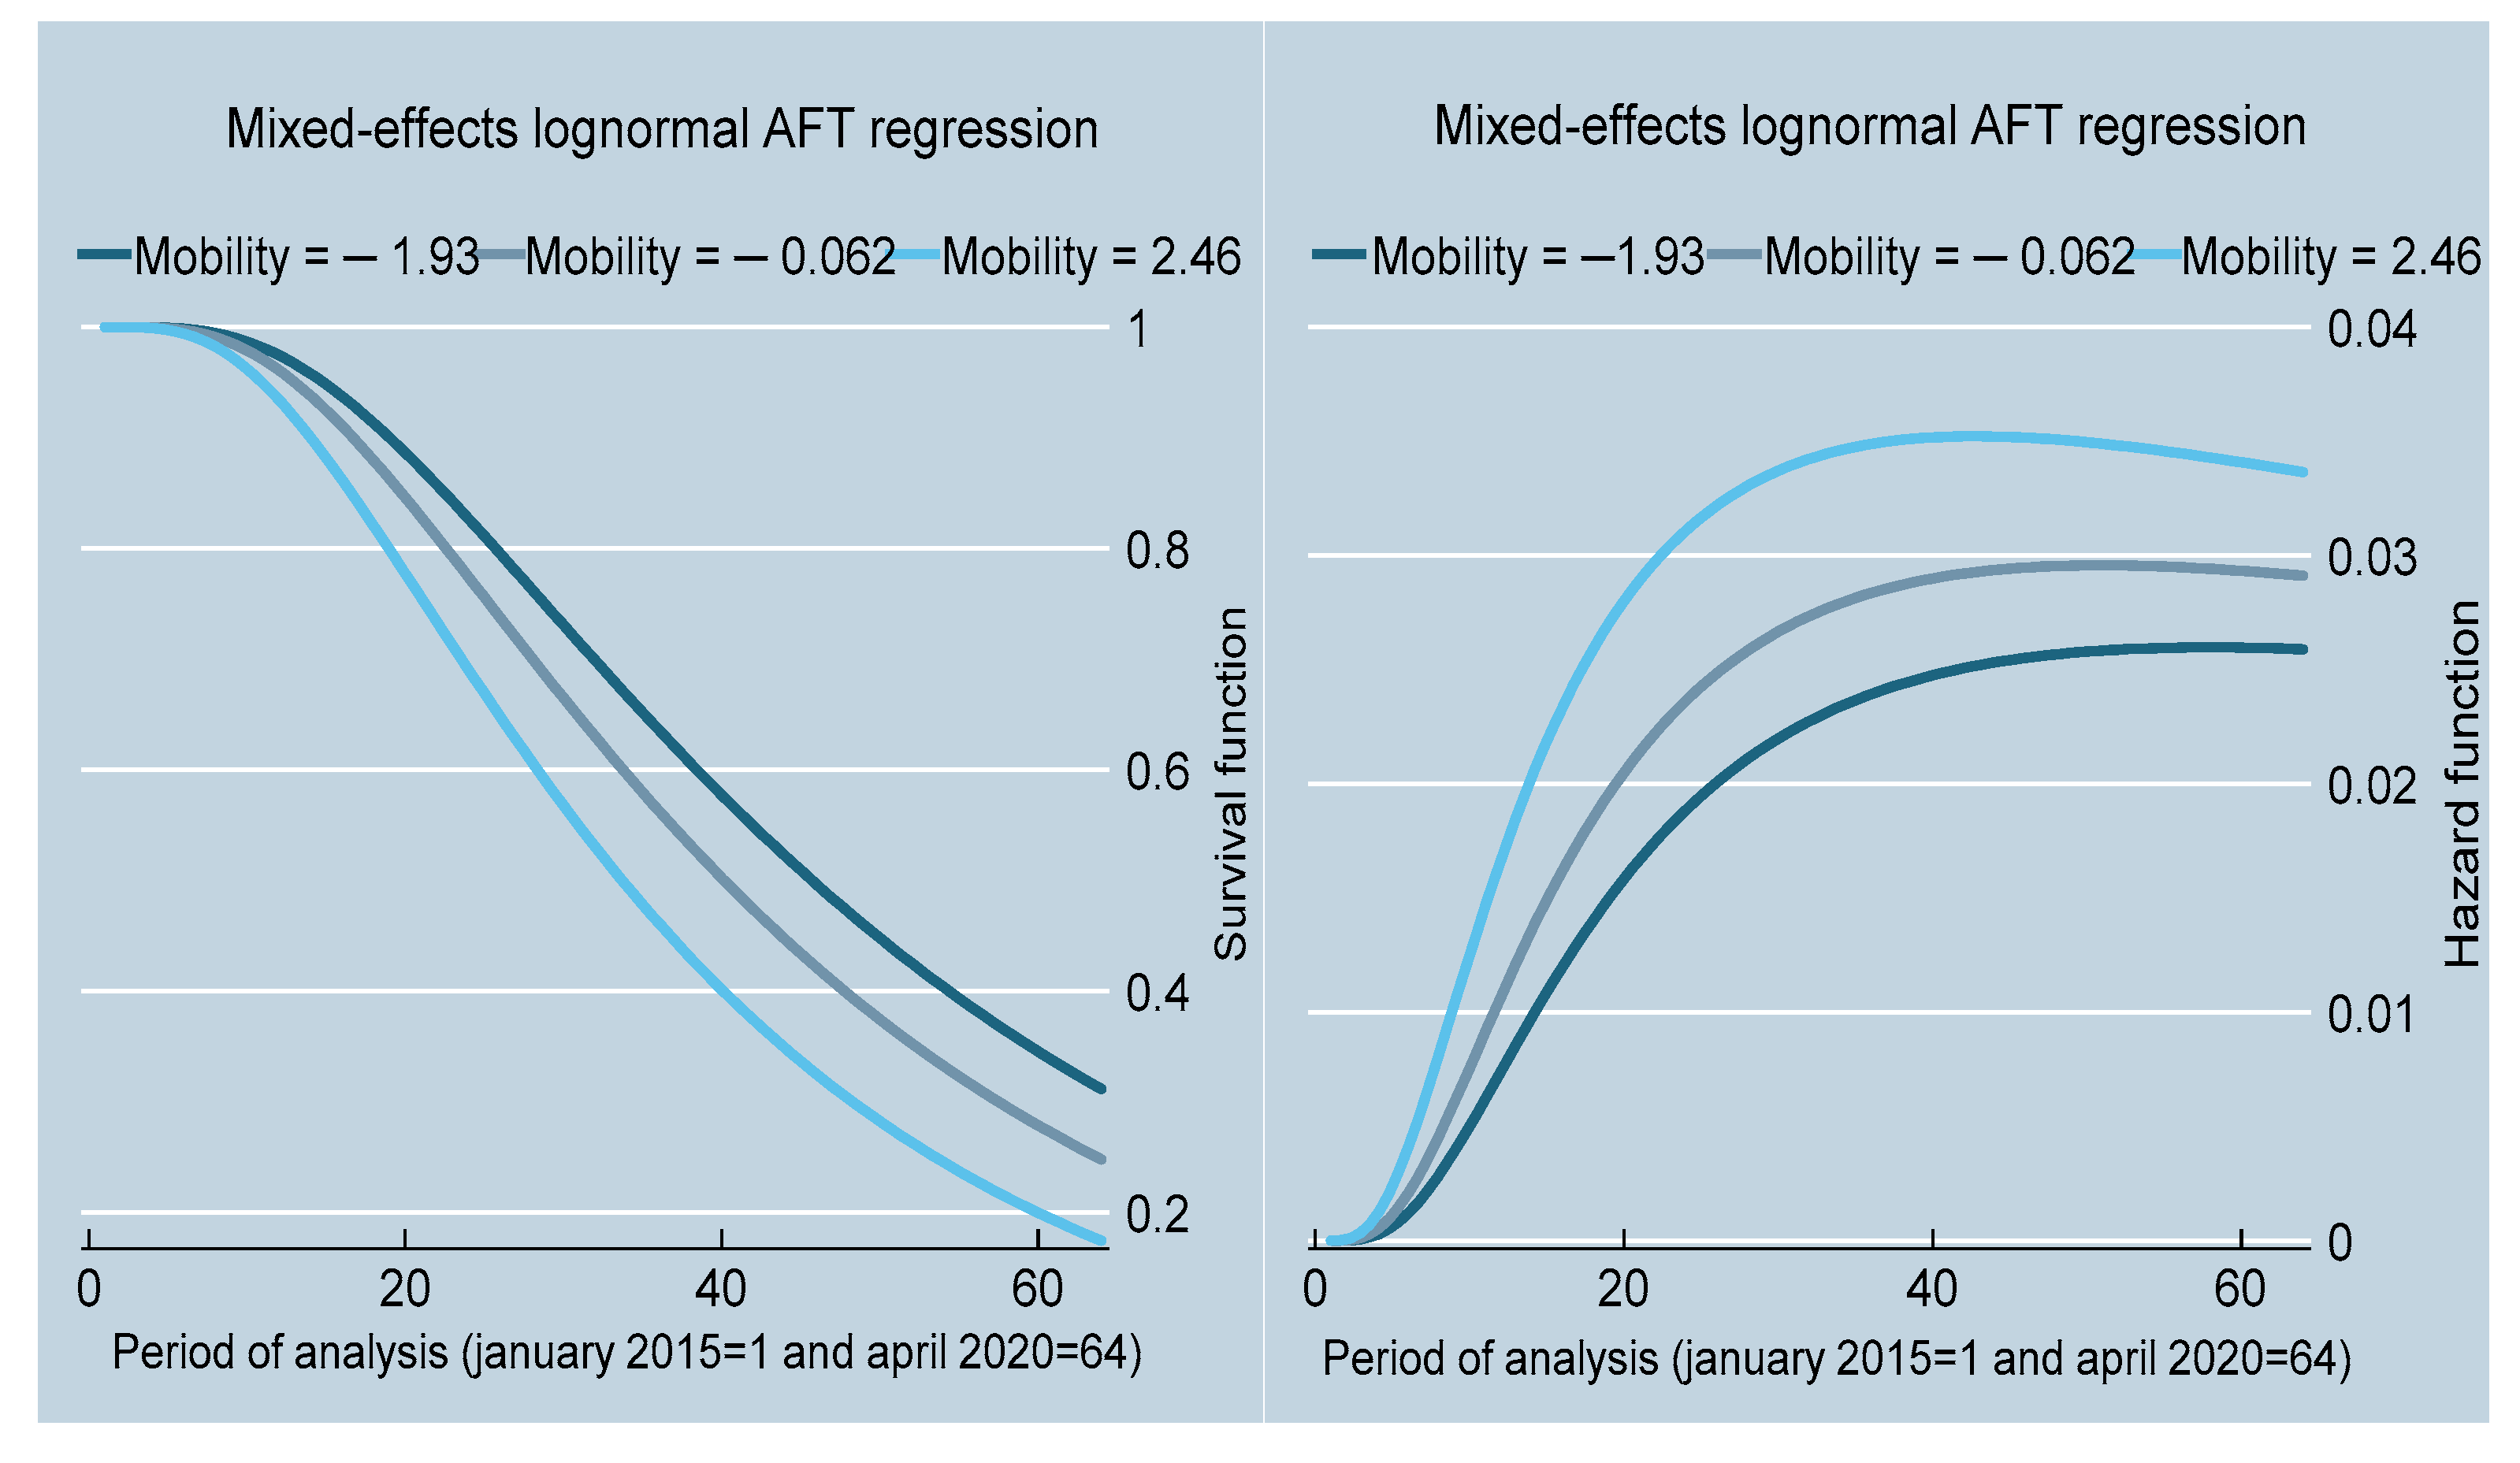
The mobility time ratio indicates that higher mobility levels are associated with a lower export survival; that is, exports from countries with greater mobility have a lower survival rate versus countries with low mobility (Figure 1).
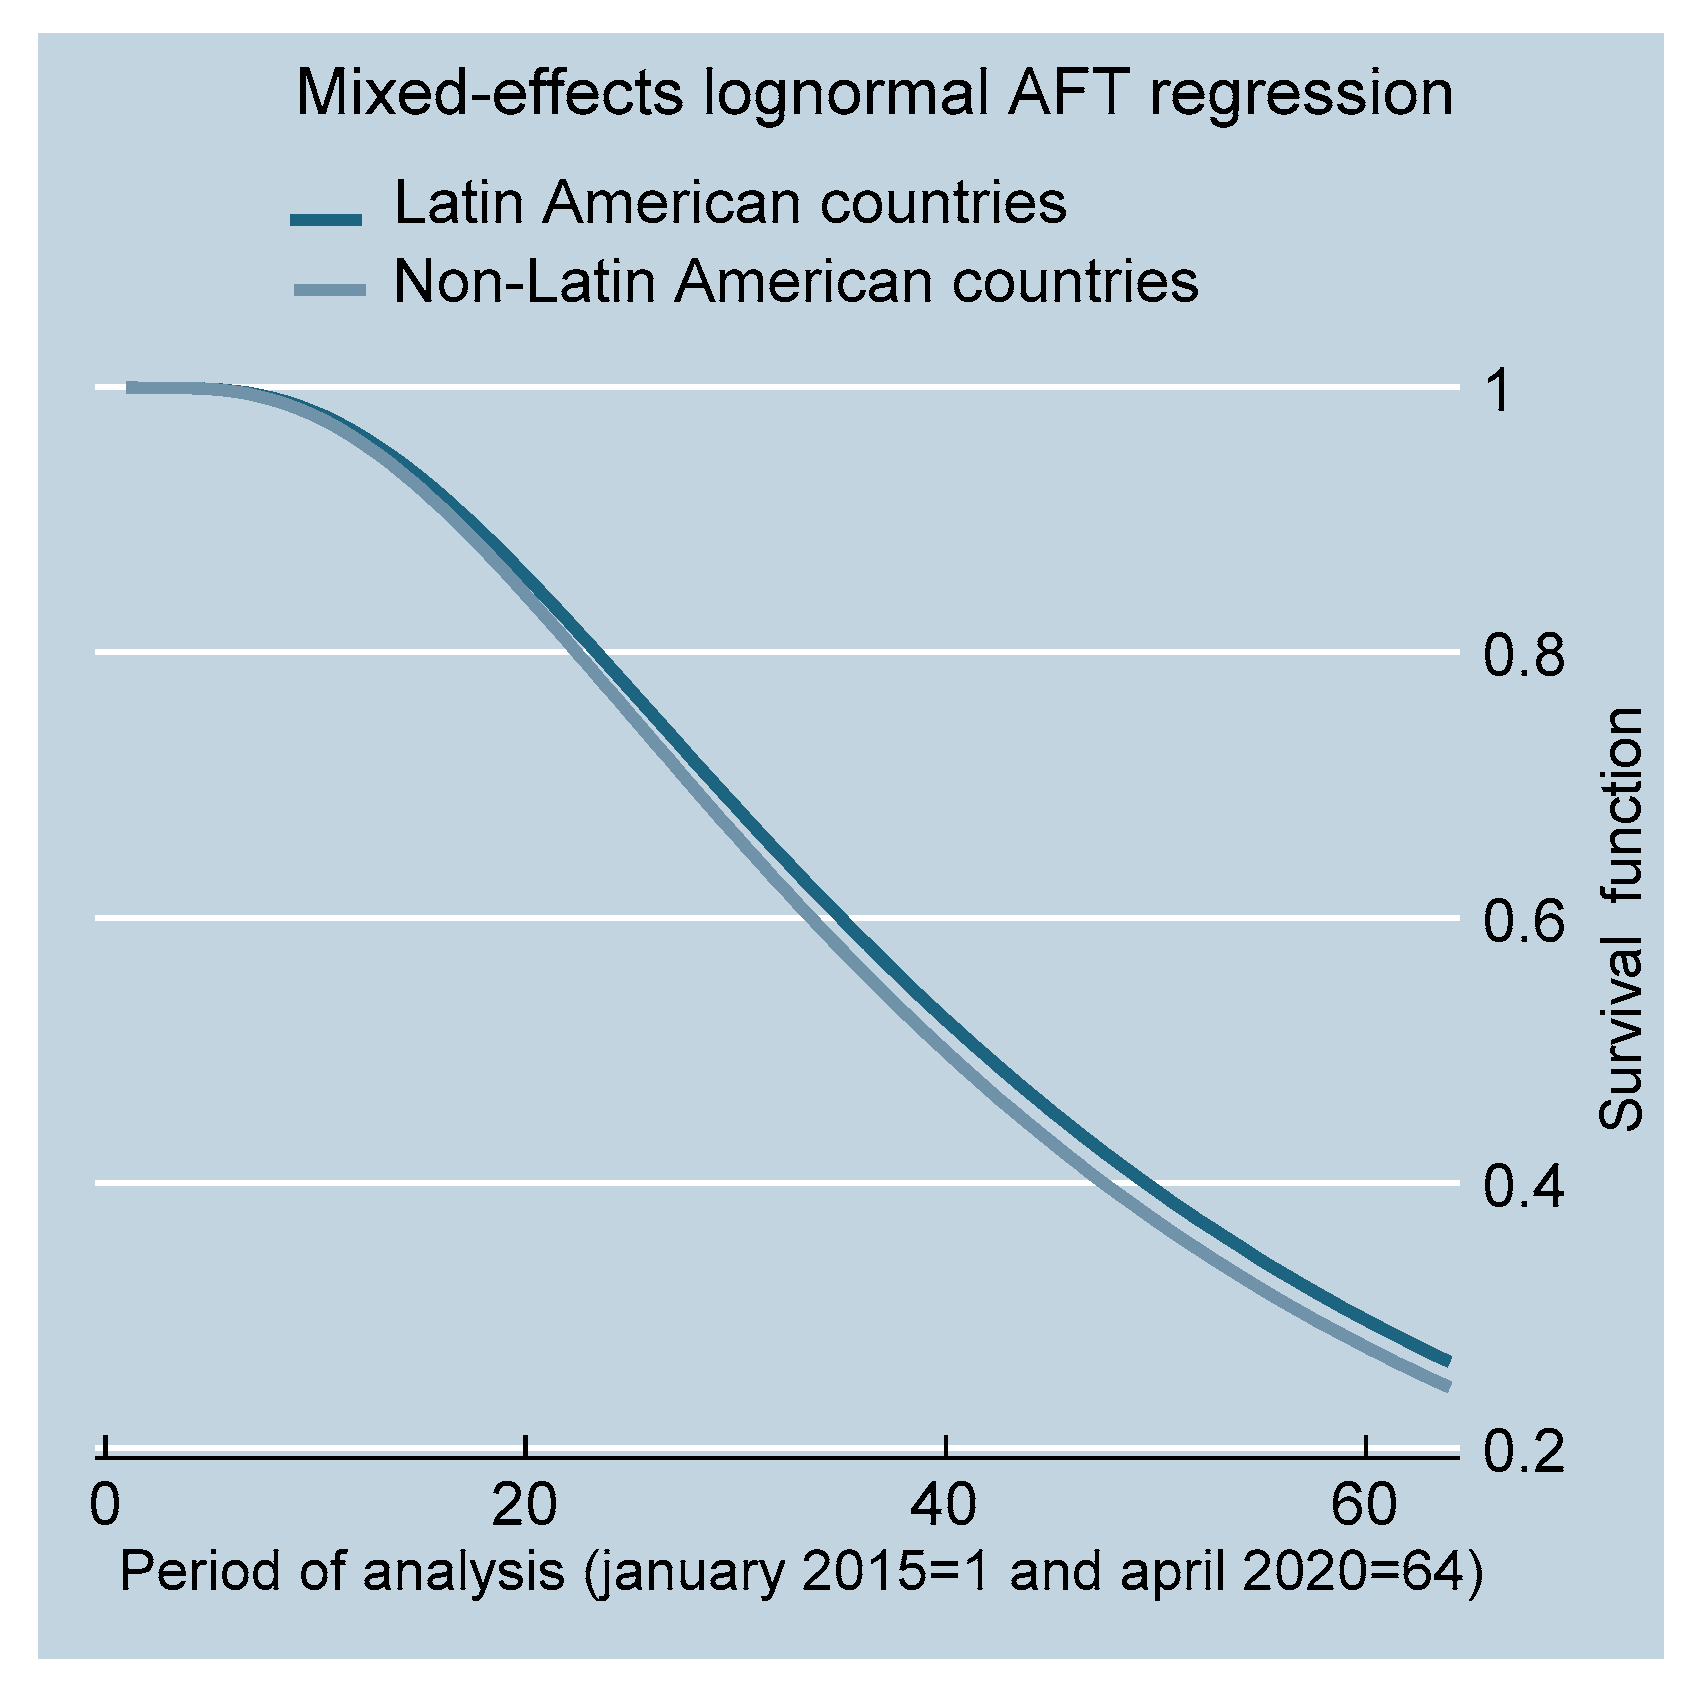
On average, LATAM countries show higher export survival rates than other countries. Higher innovation and market concentration levels improve the duration of exports. Rises in the real exchange rate increase the risk of export interruption, affecting duration and permanence. Differences in survival were found between sectors with regard to machinery and transportation equipment. Figure 2 shows the survival, hazard, and curves with minimum, average, and maximum mobility index values.
5. Discussion
Our results about the effect of innovation on exports are consistent with the findings reported by the authors of [13]. Market concentration significantly accounted for the duration of exports, as opposed to the results obtained by the authors of [10,11], who found no significant effect of market concentration. Exports from countries with higher levels of real exchange rate display an acceleration of the risk of interruptions and, therefore, less permanence or duration. This finding is consistent with those by the authors of [36,45,49,50], who reported that products from countries with currency depreciation have a lower risk of export interruption. Therefore, further studies are necessary to delve deeper into the importance of real exchange rate policies during the pandemic.
The results of the effect of maritime connectivity on the probability of export survival during the first months of the COVID-19 pandemic indicate that greater maritime connectivity reduces the risk of a fall in exports. This finding is consistent with [52], highlighting that the quality of maritime transportation reduces costs by making exports more efficient.
In general, the time ratio for February was not statistically significant. For March and April, it was significant at the 99% confidence level, with similar values for both months; this indicates an increased risk of failure or interruption of exports due to increases in the mobility index.
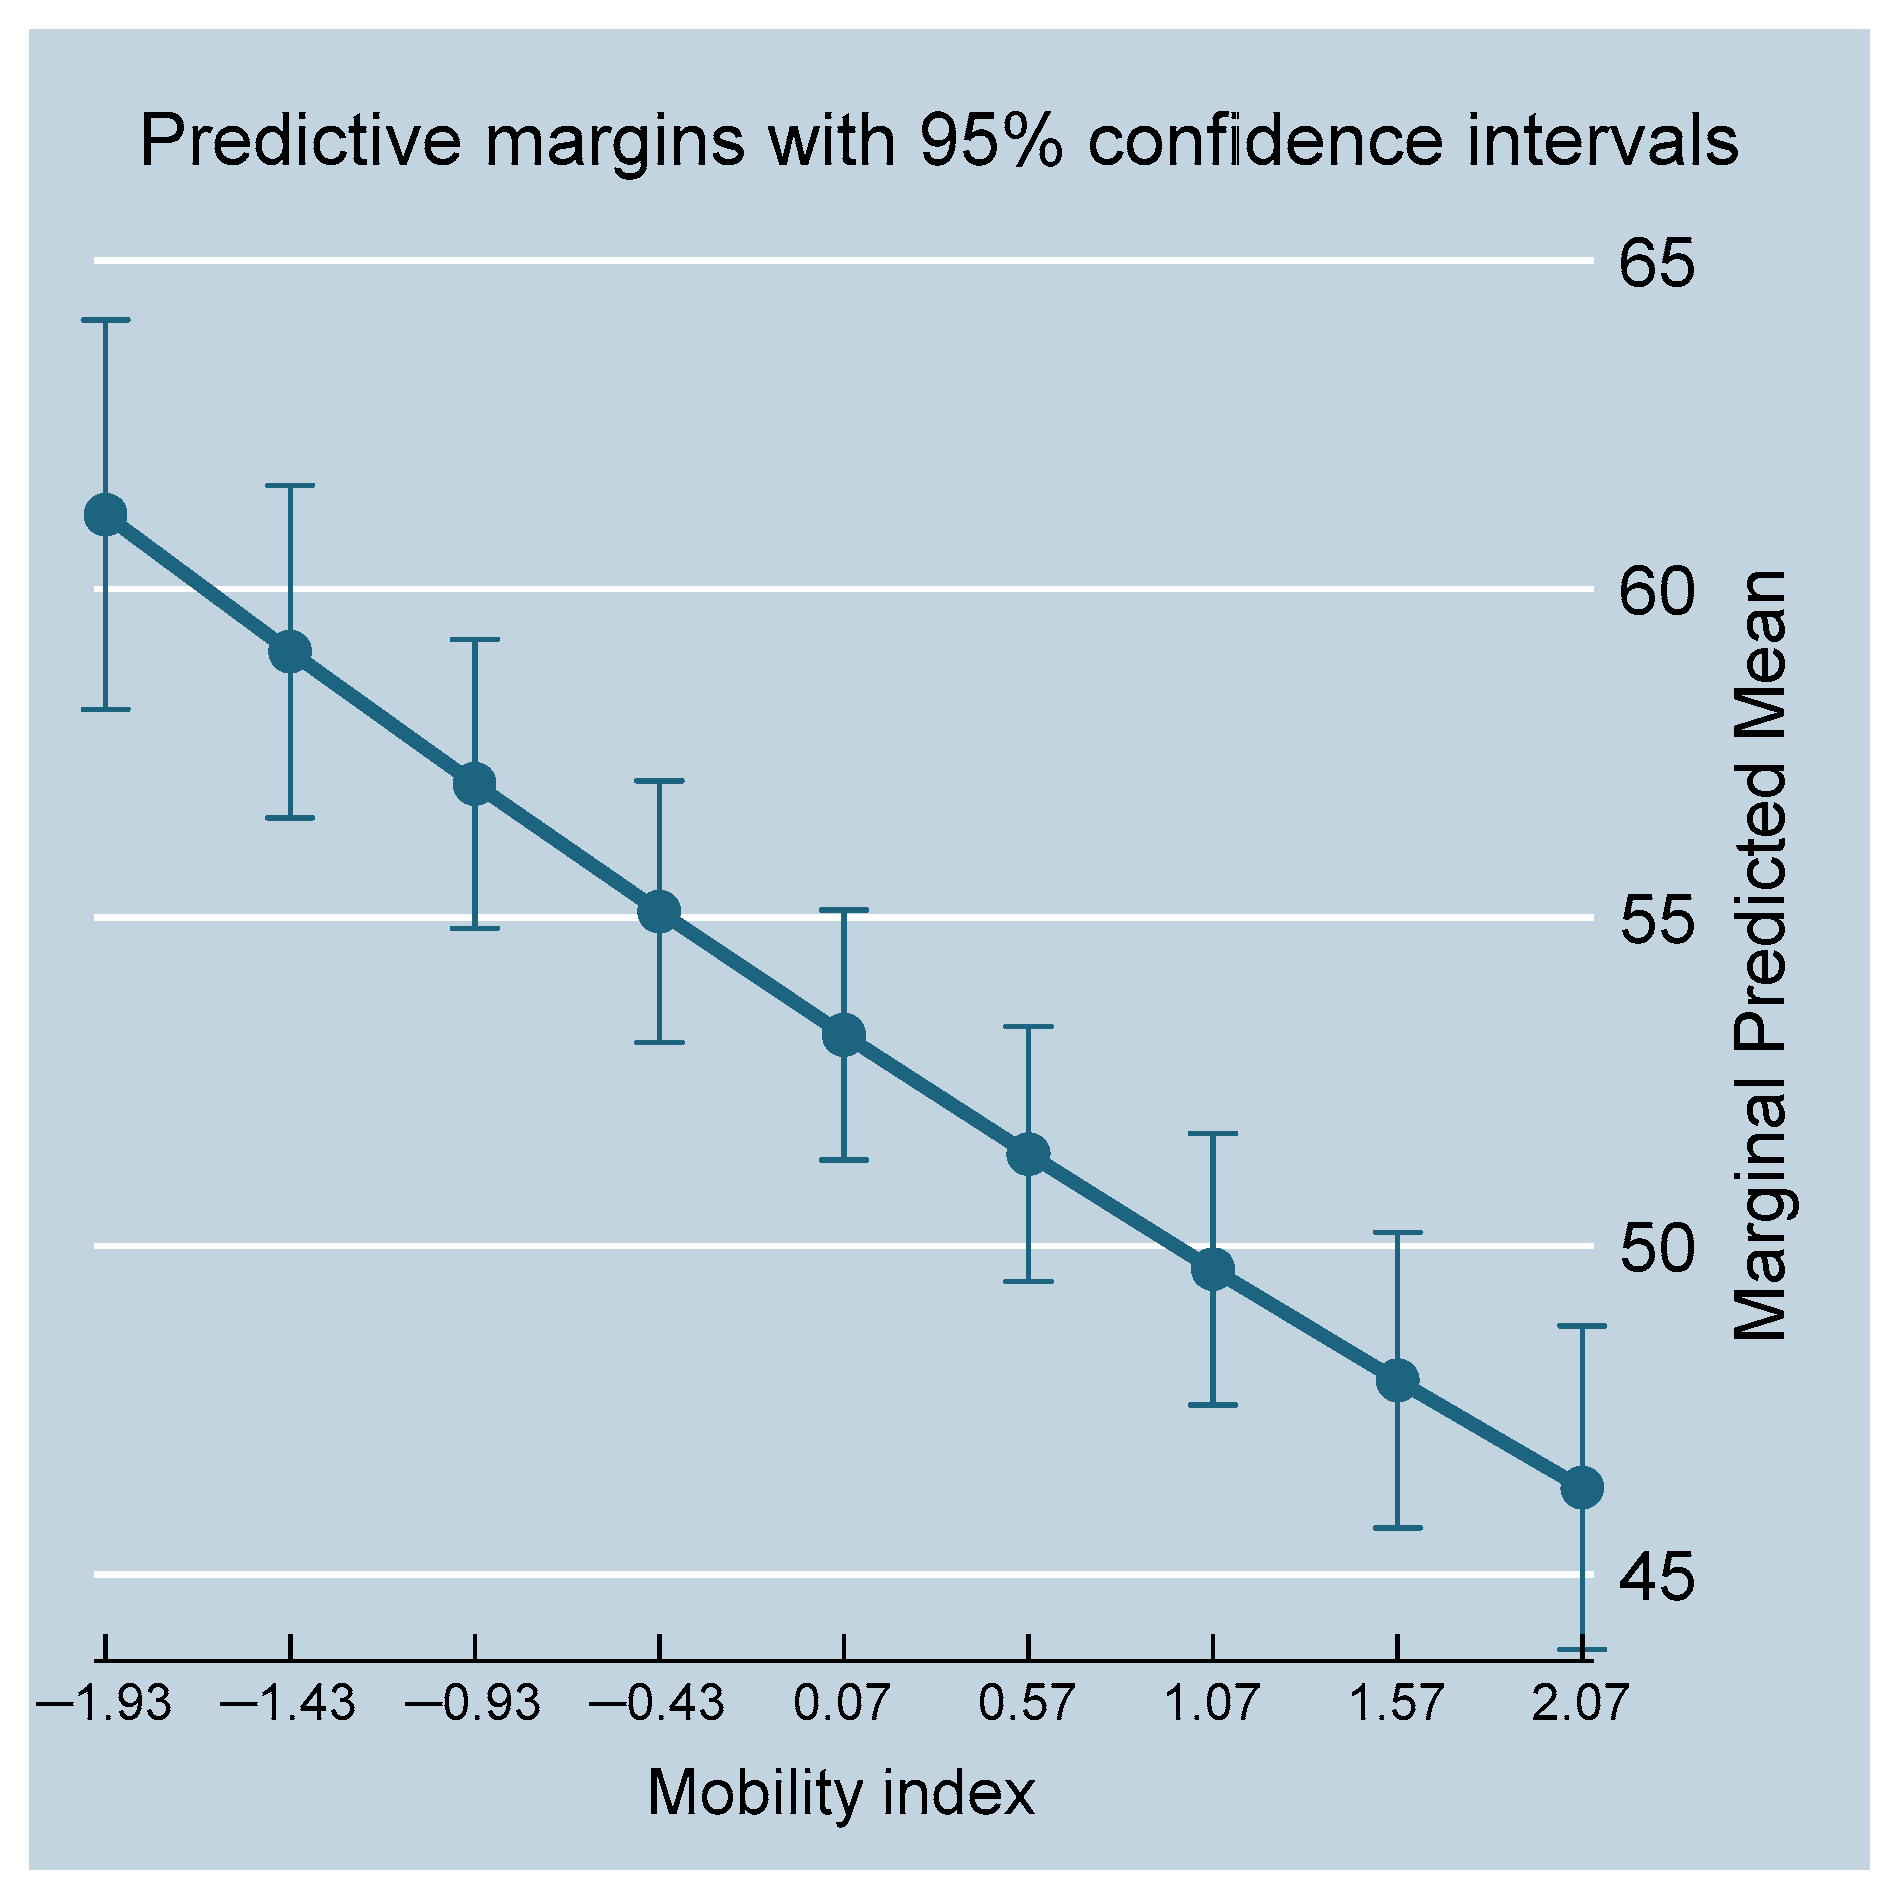
The effect of mobility on the duration of exports in the context of the COVID-19 pandemic had not been examined previously for LATAM. We found that the predicted marginal mean decreases with high-mobility levels (Figure 3). Exports from countries with higher mobility levels increase the risk of interruption and, therefore, the survival time.
This indicates that countries with fewer restrictions on mobility through lockdown measures differentiated by essential or priority activities recorded an increase in the risk rate of interruption of exports and, consequently, in the duration or survival of exports.
The survival rate of LATAM exports to the United States during the first months of the pandemic was higher than for the rest of the countries. Exports of products from countries with high mobility levels in March, such as Chile, Costa Rica, Bahamas, Jamaica, Brazil, Canada, Trinidad and Tobago, Belize, Antigua and Barbuda, Mexico, and Nicaragua—many of which are LATAM countriesshowed a higher probability of export survival in April 2020 relative to other LA countries with low mobility levels such as Ecuador, Peru, Bolivia, Honduras, Argentina, the Dominican Republic, Paraguay, Colombia, El Salvador, Guatemala, Venezuela, and Uruguay.
6. Conclusions
Exports from countries with high mobility levels showed a smaller permanence. Exports from countries with higher market concentration have a higher probability of survival. Higher innovation levels favored export survival. Countries with higher levels of REER have a lower probability of export survival. The differences in the permanence of exports between sectors indicate that the impact of the COVID-19 pandemic in each country depends on the export basket and mobility characteristics, actual exchange rate levels, innovation, and market concentration.
It is observed that, in general, products from countries with real exchange rate appreciations have a lower probability of surviving in the North American market. Exports of products from countries with higher market concentration levels have, on average, a greater probability of survival compared to those with lower market concentration levels. The time ratio for products from countries with different values of maritime connectivity indicates that they have the same probability of survival in the North American market for the study period. Products from countries with higher innovation levels and technological readiness have, on average, a higher probability of survival than those with lower innovation levels. Innovation and maritime connectivity in Latin American countries have a greater effect on the probability of export survival. Given that the impact of the COVID-19 pandemic on the economy and social interrelations is uncertain and can only be visualized in the long term, decision-makers need to use new information communication technologies, specifically Big Data analysis, to identify the best strategies to face the health and economic crises. In this sense, the results of the present work highlight that countries with higher mobility levels do not show higher export duration; on the contrary, it seems that higher mobility levels are associated with an accelerated risk of interruption of exports.
A pending topic for future studies is the need to conduct post-pandemic research to explore in detail the effects of social-distancing measures involving mobility restrictions on exports from Latin American countries.
Funding
This research was partially funded by the Centro de Investigaciones Biológicas del Noroeste, S.C., Grant number PC.1 Environmental Planning and Conservation Program.
Institutional Review Board Statement
Not applicable.
Informed Consent Statement
Not applicable.
Data Availability Statement
Not applicable.
Acknowledgments
I wish to especially thank Gerzaín Aviles Polanco and Marco Almendarez Hernández for their support and valuable comments on this work. Thanks also to Alex Borges Sánchez for his support in data science and excellent research assistance. María Elena Sánchez-Salazar translated the manuscript into English. I want to acknowledge the time and effort devoted by anonymous reviewers to improve earlier versions of this manuscript. Finally, I want to thank the support to Organization of American States (OAS), especially to Executive Secretariat for Integral Development (SEDI).
Conflicts of Interest
The authors declare no conflict of interest.
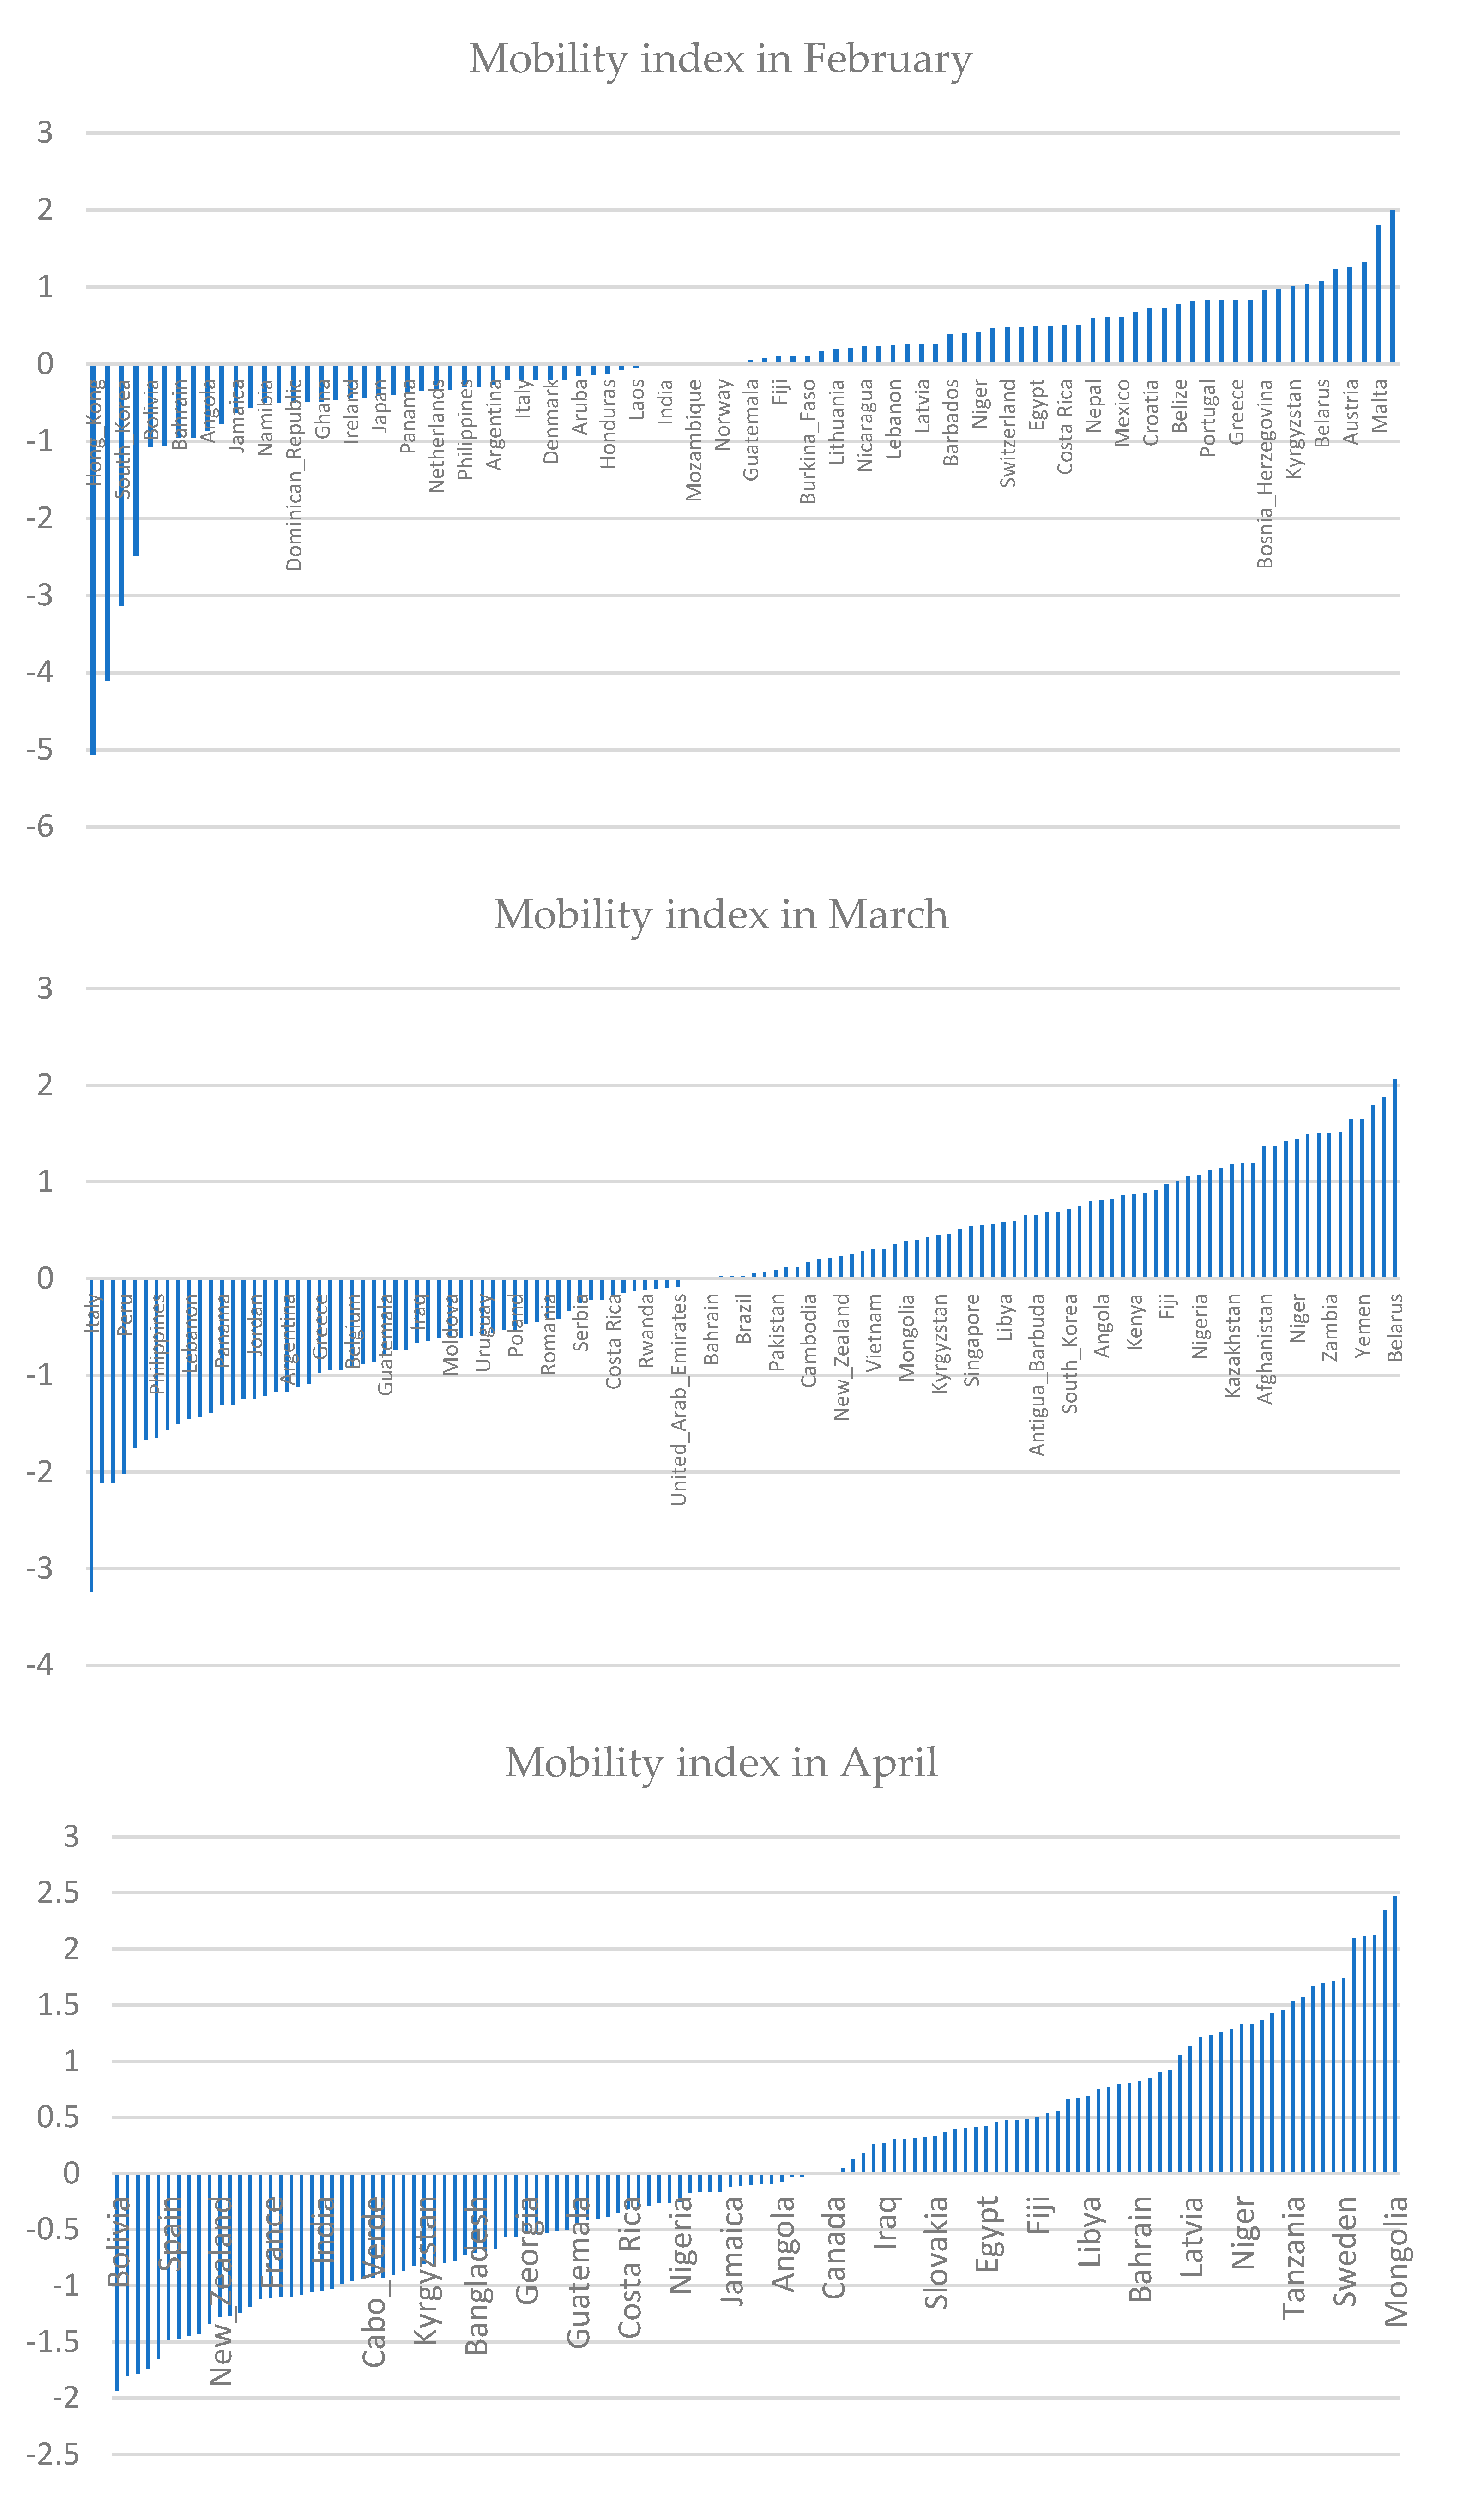
Appendix A. Mobility Index for February–April 2020
Figure A1.
Source: Own elaboration.

References
- Atkeson, A. What will be the economic impact of covid-19 in the us? In Rough Estimates of Disease Scenarios; NBER: Cambridge, UK, 2020. [Google Scholar]
- Barro, R.; Ursúa, J.; Weng, J. The Coronavirus and the Great Influenza Pandemic: Lessons from the “Spanish Flu” for the Coronavirus’s Potential Effects on Mortality and Economic Activity; NBER: Cambridge, UK, 2020. [Google Scholar]
- Gourinchas, P.O. Flattening the pandemic and recession curves. In Mitigating the COVID Economic Crisis: Act Fast and Do Whatever It Takes; Baldwin, R., Weder, D.M.B.., Eds.; Centre for Economic Policy Research: London, UK, 2020; pp. 31–39. [Google Scholar]
- Atlas of economic complexity of the Center for International Development at Harvard University. Available online: https://atlas.cid.harvard.edu/ (accessed on 22 May 2020).
- Dcode Economic & Financial Consulting. Decoding the Economics of COVID-19. Potential Winners & Losers in the Short Term in Egypt. Dcode Economic & Financial Consulting. Disponible en. 2020. Available online: https://dcodeefc.com/infographics (accessed on 16 June 2020).
- Jitsutthiphakorn, U. Innovation, firm productivity, and export survival: Firm-level evidence from ASEAN developing countries. J. Econ. Struct. 2021, 10, 22. [Google Scholar] [CrossRef]
- Yang, B.; Anderson, J.; Fang, Y. Trade duration of Chinese shrimp exports. Aquac. Econ. Manag. 2020, 25, 260–274. [Google Scholar] [CrossRef]
- Blanco, L.; Mora, J.; Olabisi, M.; Prieger, J. Synergies and competition: Export survival in Africa and Latin America. South. Econ. J. 2020, 87, 245–273. [Google Scholar] [CrossRef]
- Zhu, X.; Liu, B.; Wei, Q. Does participation in global value chains extend export duration? Rev. Dev. Econ. 2019, 23, 1282–1308. [Google Scholar] [CrossRef]
- Zhang, D.; Tveterås, R. A fish out of water? Survival of seafood products from developing countries in the EU market. Mar. Policy 2019, 103, 50–58. [Google Scholar] [CrossRef]
- Türkcan, K.; Saygili, H. Global Production Chains and Export Survival. East. Eur. Econ. 2019, 57, 103–129. [Google Scholar] [CrossRef]
- Lv, X.; Zhang, G.; Xu, X.; Li, Q. Weighted quantile regression for censored data with application to export duration data. Stat. Pap. 2019, 60, 1161–1192. [Google Scholar] [CrossRef]
- Anwar, S.; Hu, B.; Jin, Y.; Wang, K. China’s export tax rebate and the duration of firm export spells. Rev. Dev. Econ. 2019, 23, 376–394. [Google Scholar] [CrossRef]
- Sun, C.; Zhang, X. Duration of U.S. forest products trade. For. Policy Econ. 2018, 95, 57–68. [Google Scholar] [CrossRef]
- Martuscellia, A.; Varela, G. Survival is for the fittest: Export survival patterns in Georgia. Econ. Syst. 2018, 42, 397–413. [Google Scholar] [CrossRef] [Green Version]
- Díaz-Mora, C.; Gandoy, R.; González-Díaz, B. Looking into global value chains: Influence of foreign services on export performance. Rev. World Econ. 2018, 154, 785–814. [Google Scholar] [CrossRef]
- Cui, Y.; Liu, B. Manufacturing servitisation and duration of exports in China. World Econ. 2018, 41, 1695–1721. [Google Scholar] [CrossRef]
- Asche, F.; Cojocaru, A.; Gaasland, I.; Straume, H. Cod stories: Trade dynamics and duration for Norwegian cod exports. J. Commod. Mark. 2018, 12, 71–79. [Google Scholar] [CrossRef]
- Straume, H.-M. Here today, gone tomorrow: The duration of Norwegian salmon exports. Aquac. Econ. Manag. 2017, 21, 88–104. [Google Scholar] [CrossRef]
- Kadochnikov, S.; Fedyunina, A. The impact of financial and human resources on the export performance of Russian firms. Econ. Syst. 2017, 41, 41–51. [Google Scholar] [CrossRef]
- Carrère, C.; Strauss-Kahn, V. Export survival and the dynamics of experience. Rev. World Econ. 2017, 153, 271–300. [Google Scholar] [CrossRef]
- Bojnec, S.; Fertő, I. The duration of global agri-food export competitiveness. Br. Food J. 2017, 119, 1378–1393. [Google Scholar] [CrossRef] [Green Version]
- Pradhan, J.; Das, K. “Regional Profile of Export Duration of Firms”, en Jaya Pradhan y Keshab Das, Manufacturing Exports from Indian States: Determinants and Policy Imperatives, India Studies in Business and Economics; Springer: New Delhi, India, 2016. [Google Scholar] [CrossRef]
- Fugazza, M.; Molina, A. On the determinants of exports survival. Can. J. Dev. Stud. Rev. Can. D'études Du Développement 2016, 37, 159–177. [Google Scholar] [CrossRef] [Green Version]
- Stirbat, L.; Record, R.; Nghardsaysone, K. The Experience of Survival: Determinants of Export Survival in Lao PDR. World Dev. 2015, 76, 82–94. [Google Scholar] [CrossRef] [Green Version]
- Lejour, A. The Duration of Dutch Export Relations: Decomposing Firm, Country and Product Characteristics. Economist 2015, 163, 155–176. [Google Scholar] [CrossRef]
- Gullstrand, J.; Persson, M. How to combine high sunk costs of exporting and low export survival. Rev. World Econ. 2015, 151, 23–51. [Google Scholar] [CrossRef] [Green Version]
- Córcoles, D.; Díaz-Mora, C.; Gandoy, R. Export Survival in Global Production Chains. World Econ. 2015, 38, 1526–1554. [Google Scholar] [CrossRef]
- Tian, D.; Li, R.; Yao, W.; Huang, L. Study on the survival of China agri-food export trade relationships. China Agric. Econ. Rev. 2014, 6, 139–157. [Google Scholar] [CrossRef]
- Fu, D.; Wu, Y. Export survival pattern and its determinants: An empirical study of Chinese manufacturing firms. Asian-Pac. Econ. Lit. 2014, 28, 161–177. [Google Scholar] [CrossRef]
- Söderlund, B.; Tingvall, P. Dynamic effects of institutions on firm-level exports. Rev. World Econ. 2014, 150, 277–308. [Google Scholar] [CrossRef] [Green Version]
- Córcoles, D.; Díaz-Mora, C.; Gandoy, R. Product sophistication: A tie that binds partners in international trade. Econ. Model. 2014, 44, S33–S41. [Google Scholar] [CrossRef]
- Esteve-Pérez, S.; Requena-Silvente, F.; Pallardó-López, V. The duration of firm-destination export relationships: Evidence from Spain, 1997–2006. Econ. Inq. 2013, 51, 159–180. [Google Scholar] [CrossRef]
- Cadot, O.; Iacovone, L.; Pierola, M.; Rauch, F. Success and failure of African exporters. J. Dev. Econ. 2013, 101, 284–296. [Google Scholar] [CrossRef] [Green Version]
- Shao, J.; Xu, K.; Qiu, B. Analysis of Chinese Manufacturing Export Duration. China World Econ. 2012, 20, 56–73. [Google Scholar] [CrossRef]
- Hess, W.; Persson, M. The duration of trade revisited Continuous-time versus discrete-time hazards. Empir. Econ. 2012, 43, 1083–1107. [Google Scholar] [CrossRef]
- Görg, H.; Kneller, R.; Muraközy, B. What makes a successful export? Evidence from firm-product-level data. Can. J. Econ. Rev. Can. D’economique 2012, 45, 1332–1368. [Google Scholar] [CrossRef]
- Chen, W.-C. Innovation and duration of exports. Econ. Lett. 2012, 115, 305–308. [Google Scholar] [CrossRef]
- Bojnec, S.; Fertő, I. Does EU Enlargement Increase Agro-Food Export Duration? World Econ. 2012, 35, 609–631. [Google Scholar] [CrossRef]
- Hess, W.; Persson, M. Exploring the duration of EU imports. Rev. World Econ. 2011, 147, 665–692. [Google Scholar] [CrossRef] [Green Version]
- Harris, R.; Cher Li, Q. The Determinants of Firm Exit from Exporting: Evidence for the UK. Int. J. Econ. Bus. 2011, 18, 381–397. [Google Scholar] [CrossRef]
- Besedeš, T.; Prusa, T. The role of extensive and intensive margins and export growth. J. Dev. Econ. 2011, 96, 371–379. [Google Scholar] [CrossRef]
- Ilmakunnas, P.; Nurmi, S. Dynamics of Export Market Entry and Exit. Scand. J. Econ. 2010, 112, 101–126. [Google Scholar] [CrossRef] [Green Version]
- Brenton, P.; Saborowski, C.; von Uexkull, E. What Explains the Low Survival Rate of Developing Country Export Flows? World Bank Econ. Rev. 2010, 24, 474–499. [Google Scholar] [CrossRef] [Green Version]
- Nitsch, V. Die another day: Duration in German import trade. Rev. Word Econ. 2009, 145, 133–154. [Google Scholar] [CrossRef]
- Volpe Martincus, C.; Carballo, J. Survival of New Exporters in Developing Countries: Does it Matter how They Diversify? IDB Working Paper Series; Inter-American Development Bank: Washington, DC, USA, 2009. [Google Scholar]
- Besedeš, T. A Search Cost Perspective on Formation and Duration of Trade. Rev. Int. Econ. 2008, 16, 835–849. [Google Scholar] [CrossRef]
- Besedeš, T.; Prusa, T. Ins, outs, and the duration of trade. Can. J. Econ. /Rev. Can. D’economique 2006, 39, 266–295. [Google Scholar] [CrossRef]
- Besedeš, T.; Prusa, T. Product differentiation and duration of US import trade. J. Int. Econ. 2006, 70, 339–358. [Google Scholar] [CrossRef] [Green Version]
- Baldwin, R.; Krugman, P. Persistent Trade Effects of Large Exchange Rate Schoks. Q. J. Econ. 1989, 104, 635–657. [Google Scholar] [CrossRef]
- Bojnec, Š.; Fertő, I. Agri-Food Export Competitiveness in European Union Countries. J. Common Mark. Stud. 2015, 53, 476–492. [Google Scholar] [CrossRef] [Green Version]
- Staboulis, C.; Natos, D.; Tsakiridou, E.; Mattas, K. International trade in OECD countries. Oper. Res. Int. J. 2020, 20, 1177–1187. [Google Scholar] [CrossRef]
- Fabling, R.; Sanderson, L. Exporting and firm performance: Market entry, investment, and expansion. J. Int. Econ. 2013, 89, 422–431. [Google Scholar] [CrossRef]
- Google. COVID-19 Community Mobility Report. Available online: https://www.google.com/covid19/mobility/ (accessed on 14 June 2020).
- U.S. Census Bureau. Exports and Imports Totals 3-Digist SITC. Available online: https://www.census.gov/foreign-trade/statistics/country/sitc/index.html (accessed on 11 June 2020).
- World Bank. Herfindahl-Hirschman Index. Available online: https://wits.worldbank.org/CountryProfile/en/country/by-country/startyear/LTST/endyear/LTST/indicator/HH-MKT-CNCNTRTN-NDX (accessed on 20 June 2020).
- World Economic Forum. Real Effective Exchange Rate. 2020. Available online: https://data.worldbank.org/indicator/PX.REX.REER?locations=AL-DZ-AG&name_desc=true (accessed on 14 May 2020).
- World Economic Forum. The Global Competitiveness Report. 2019. Available online: http://reports.weforum.org/global-competitiveness-index-2017-2018/downloads/ (accessed on 19 May 2020).
- Fakur, A. The comparison of proportional hazards and accelerated failure time models in analyzing the first birth interval survival data. J. Phys. A: Math. Theor. 2018, 974, 012008. [Google Scholar]
Figure 1.
Hazard and survival curves.

Figure 2.
Survival curves of LATAM vs. other countries.

Figure 3.
Predictive margins and 95% Confidence Intervals for mobility levels.

Figure 4.
Predictive margins for Maritime connectivity index, Real Effective Exchange Rate, Competitiveness 12th pillar Innovation and Herfindahl-Hirschman Index.
Figure 4.
Predictive margins for Maritime connectivity index, Real Effective Exchange Rate, Competitiveness 12th pillar Innovation and Herfindahl-Hirschman Index.


Table 1.
Studies based on export survival analysis.
| Independent Variables | Country or Region | Econometric Technique | Study |
|---|---|---|---|
| Innovation, productivity | ASEAN countries | Probit model with fixed effects | [6] |
| GDP, GDP per capita, geographic distance, prices, initial value of exports. | China | Kaplan–Meier survival function, discrete-time duration models | [7] |
| Destination of the product, Herfindahl-Hirschmann Index | Africa and Latin America | Probit regression | [8] |
| GDP per capita, geographic distance, landlocked country, common border, common language, tariff | China | Kaplan–Meier survival function, discrete-time duration models | [9] |
| Price, real exchange rate, distance, GDP, tariff regimes, and region | Developing countries, European Union | Cox hazard model | [10] |
| GDP, geographic distance, common language, common border, | Turkey | Kaplan–Meier survival function, discrete-time duration models | [11] |
| Geographic distance, GDP, common language | China | Weighted quantile regression for censored data | [12] |
| GDP per capita, bilateral distance, trade cost, real exchange rate, product price. | China | Kaplan–Meier survival function, discrete-time duration models | [13] |
| GDP per capita, distance, relative real exchange rate, access to the sea, | United States | Kaplan–Meier survival function, discrete-time duration models | [14] |
| Initial value, foreign-owned company, Balassa’s RCA, real exchange rate, free trade agreement. | Georgia | Discrete-time duration models | [15] |
| GDP, geographic distance, initial trade value. | OECD countries | Discrete-time duration models | [16] |
| GDP, geographic distance, landlocked country, industry tariff rate on final products, | China | Kaplan–Meier survival function, discrete-time duration models | [17] |
| Geographic distance, GDP, GDP per capita. | Norway | Kaplan–Meier survival function, Cox hazard model | [18] |
| Geographic distance, GDP. | Norway | Kaplan–Meier survival function, Cox hazard model | [19] |
| Distance to export markets, common language, common border, GDP, tariffs | Russia | Kaplan–Meier survival function, Cox proportional hazard model, discrete-time duration models | [20] |
| GDP per capita, Balassa’s RCA, market access, market penetration, distance, contiguity, language. | 114 developing countries | Kaplan–Meier survival function, Cox hazard model, linear probability model with fixed effects | [21] |
| GDP per capita, population, number of products, | 23 major countries in the global trade of agri-food products. | Kaplan–Meier survival function, discrete-time duration models | [22] |
| R&D expenditure, royalty expenditure, capital goods and equipment import expenditure, advertising and marketing expenditure, Herfindahl Index on sales, GDP. | India | Discrete-time duration models | [23] |
| GDP, common language, border, colonial link, sea, geographical distance, real exchange rate, entry regulations. export and import costs | 96 countries | Discrete-time duration models | [24] |
| Balassa’s RCA, population, initial value, GDP, GDP per capita. | Laos | Kaplan–Meier survival function, discrete-time duration models | [25] |
| GDP, geographic distance, common language | The Netherlands | Cox proportional hazard model, discrete-time duration models | [26] |
| Geographic Distance, Multilateral Index, headcount, GDP. | Sweden | Discrete-time duration models | [27] |
| Initial export value, number of target markets, product diversification, market share (Herfindahl index), product share (Herfindahl index), GDP, geographic distance, | Spain | Discrete-time duration models | [28] |
| Degree of product processing, export experience, geographic distance | China | Kaplan–Meier survival function, Cox proportional hazard model | [29] |
| Export intensity, foreign-owned enterprises, type of industry. | China | Kaplan–Meier survival function, discrete-time duration models | [30] |
| GDP, population, tariffs, distance. | Sweden | OLS, probit, Fixed-Effect Variance Decomposition (FEVD) model applied within a Heckman framework, zero-inflated negative binomial model | [31] |
| Economic Complexity Index, GDP per capita, GDP, initial value, market and product diversification, geographic distance. | 60 countries | Kaplan–Meier survival function, discrete-time duration models | [32] |
| GDP, geographic distance, access to the sea, common language, common border. | Spain | Kaplan–Meier survival function, discrete-time duration models | [33] |
| Agglomeration, Balassa’s RCA | Malawi, Mali, Senegal, and Tanzania | Discrete-time duration models | [34] |
| GDP, GDP per capita, export value at the beginning of the period (spell), access to the sea, real exchange rate, | China | Kaplan–Meier survival function, Cox proportional hazard model, discrete-time duration models | [35] |
| Ad valorem transportation cost, GDP, tariff rate, relative real exchange rate, agricultural goods | United States | Cox proportional hazard model, discrete-time duration models | [36] |
| Foreign-owned companies, Hirschmann-Herfindahl Index, high-tech industries | Hungary | Discrete-time duration models | [37] |
| Patents, population, GDP per capita, geographic distance, common language, common border, actual exchange rate, number of exporters, initial value, freight rate | 105 countries | Cox proportional hazard model | [38] |
| GDP, GDP per capita, real effective exchange rate | European Union | Cox proportional hazard model | [39] |
| Geographic distance, common language, GDP, number of export products, real exchange rate | European Union | Kaplan–Meier survival function, discrete-time duration models | [40] |
| Foreign companies, total productivity factor, Herfindahl Index, market penetration | United Kingdom | Discrete-time duration models | [41] |
| Intensive and extensive import margins, sunk costs, fixed costs per period | 46 countries | Kaplan–Meier survival function | [42] |
| Labor productivity, capital intensity, foreign enterprises. | Finland | Kaplan–Meier survival function, discrete-time duration models | [43] |
| Initial value, geographic distance, border, common language, colonial history, GDP, real exchange rate, whether the country is a neighbor | 82 developing countries | Cox proportional hazard model | [44] |
| GDP, GDP per capita, distance, common border, real exchange rate, number of products | Germany | Kaplan–Meier survival function, Cox proportional hazard model | [45] |
| Herfindahl Index, Gini Index, number of products | Developing countries | Kaplan–Meier survival function, discrete-time duration models | [46] |
| Supplier production cost, search cost, relative trade costs, initial purchase size | United States | Cox proportional hazard model | [47] |
| GDP, weighted trade | United States | Kaplan–Meier survival function, Cox proportional hazard model | [48] |
| Ad valorem transportation cost, GDP, tariff rate, relative real exchange rate | United States | Kaplan–Meier survival function, Cox proportional hazard model | [49] |
Table 2.
Description of variables.
| Variable | Description |
|---|---|
| Retail & recreation | Variation in mobility related to restaurants, cafes, shopping centers, theme parks, museums, libraries, and movie theaters. |
| Grocery & Pharmacy | Variation in mobility related to grocery markets, food warehouses, farmer’s markets, specialty food shops, drugstores, and pharmacies |
| Parks | Variation in mobility related to national parks, public beaches, marinas, dog parks, plazas, and public parks. |
| Transit stations | Variation in mobility related to public transportation hubs such as subway, bus, and tram stations. |
| Workplaces | Variation in mobility related to the workplace |
| Residential | Variation in mobility related to the place of residence. |
Source: Own elaboration based on data from [54].
Table 3.
Total explained variance.
| Component | Initial Eigenvalues | Sums of the Squared Loadings of the Extraction | ||||
|---|---|---|---|---|---|---|
| Total | % of Variance | % Cumulative | Total | % of Variance | % Accumulated | |
| 1 | 4.838 | 80.635 | 80.635 | 4.838 | 80.635 | 80.635 |
| 2 | 0.587 | 9.775 | 90.410 | |||
| 3 | 0.229 | 3.814 | 94.224 | |||
| 4 | 0.174 | 2.897 | 97.121 | |||
| 5 | 0.121 | 2.016 | 99.137 | |||
| 6 | 0.052 | 0.863 | 100.000 | |||
Extraction method: Principal Component Analysis.
Table 4.
Matrix of standardized coefficients.
| Variable | CP 1 |
|---|---|
| Retail & recreation | 0.194 |
| Grocery & pharmacy | 0.186 |
| Parks | 0.151 |
| Transit stations | 0.194 |
| Workplaces | 0.192 |
| Residential | −0.192 |
Source: Own elaboration based on the results of the Principal Component Analysis.
Table 5.
Summary statistics.
| Variable | Description | Mean | Standard Deviation |
|---|---|---|---|
| Dexport | Duration of exports that takes the value of 1 if is an export observation and 0 if is a right-censored observation | 0.38 | - |
| SITC | Product code of the Standard International Trade Classification | - | - |
| February mobility | Mobility index in February | −0.01 | 1.00 |
| March mobility | Mobility index in March | −0.08 | 0.98 |
| April mobility | Mobility index in April | −0.06 | 0.96 |
| REER | Real Effective Exchange Rate | 98.68 | 13.7 |
| Concentration | Herfindahl-Hirschman Index | 0.11 | 0.12 |
| Connectivity | Maritime connectivity index | 29.11 | 26.81 |
| Innovation | Competitiveness 12th pillar Innovation | 3.35 | 1.26 |
| Food | Binary variable: food and live animals, 1; others, 0 | 0.12 | - |
| Beverages | Binary variable: beverages and tobacco, 1; others, 0 | 0.01 | - |
| Raw materials | Binary variable: Raw materials, 1; others, 0 | 0.09 | - |
| Fuels | Binary variable: mineral fuels, lubricants, and related materials, 1; others, 0 | 0.02 | - |
| Oils | Binary variable: Animal and vegetable fat, oils, and waxes, 1; others, 0 | 0.01 | - |
| Chemicals | Binary variable: chemicals, 1; others, 0 | 0.13 | - |
| Manufactured goods_ material | Binary variable: Manufactured goods per type, 1; others, 0 | 0.2 | - |
| Manufactured goods _equipment | Binary variable: machinery and transport equipment, 1; others, 0 | 0.22 | - |
| Various manufactured goods | Binary variable: various manufactured goods, 1; others, 0 | 0.14 | - |
Source: Own elaboration.
Table 6.
Results of the mixed-effects log-normal AFT models.
| Variable | Mobility Model in February | Mobility Model in March | Mobility Model in April | |||
|---|---|---|---|---|---|---|
| Coefficient | Time Ratio | Coefficient | Time Ratio | Coefficient | Time Ratio | |
| Latin American Countries | - | - | - | - | 0.0411 *** | 1.04 |
| Mobility | 0.02 | - | −0.09 * | 0.92 | −0.0691 * | 0.93 |
| Connectivity | 0.01 * | 1.01 | 0.00 * | 1.00 | 0.0032 * | 1.00 |
| Concentration | 0.72 * | 2.04 | 0.81 * | 2.24 | 0.5929 * | 1.81 |
| REER | −0.01 * | 0.99 | −0.01 * | 0.99 | −0.0102 * | 0.99 |
| Innovation | 0.15 * | 1.16 | 0.18 * | 1.20 | 0.1911 * | 1.21 |
| Food | −0.11 | - | −0.11 | - | −0.1052 *** | 0.90 |
| Beverages | 0.07 | - | 0.07 | - | 0.0757 | - |
| Raw materials | −0.50 * | 0.61 | −0.49 * | 0.61 | −0.4893 * | 0.61 |
| Fuels | −0.57 * | 0.56 | −0.50 * | 0.61 | −0.5073 * | 0.60 |
| Oils | −0.17 | - | −0.17 | - | −0.1709 | - |
| Chemicals | −0.05 | - | −0.05 | - | −0.0529 | - |
| Raw material for manufactured goods | 0.00 | - | 0.00 | - | −0.0018 | - |
| Various manufactured goods | 0.10 | - | 0.09 | - | 0.0986 | - |
| Constant | 3.53 | 34 | 3.76 | 43.10 | 3.7487 | 43.95 |
| February: number of observations = 8475; Log likelihood = −32480.879; Wald Chi2(14) = 1289.91; Prob > Chi2 = 0.0000. March: number of observations = 9734; Log likelihood = −36354.423; Wald Chi2(14) = 1579.95; Prob > Chi2 = 0.0000. April: number of observations: 10,160; Log likelihood: −37971.123; Wald Chi2(13): 1556.82; Prob > chi2 = 0.0000. | ||||||
(*) significant at 99% confidence; (***) significant at 90% confidence.
Publisher’s Note: MDPI stays neutral with regard to jurisdictional claims in published maps and institutional affiliations. |
© 2022 by the author. Licensee MDPI, Basel, Switzerland. This article is an open access article distributed under the terms and conditions of the Creative Commons Attribution (CC BY) license (https://creativecommons.org/licenses/by/4.0/).
Share and Cite
MDPI and ACS Style
Morales, L.F.B. Impact of the COVID-19 Pandemic on Export Survival from Latin American Countries. Sustainability 2022, 14, 8709. https://doi.org/10.3390/su14148709
AMA Style
Morales LFB. Impact of the COVID-19 Pandemic on Export Survival from Latin American Countries. Sustainability. 2022; 14(14):8709. https://doi.org/10.3390/su14148709
Chicago/Turabian StyleMorales, Luis Felipe Beltrán. 2022. "Impact of the COVID-19 Pandemic on Export Survival from Latin American Countries" Sustainability 14, no. 14: 8709. https://doi.org/10.3390/su14148709
Note that from the first issue of 2016, this journal uses article numbers instead of page numbers. See further details here.