
Relation between Cytokine Levels and Pulmonary Dysfunction in COVID-19 Patients: A Case-Control Study
 , and
, and 
Abstract
:1. Introduction
2. Subjects and Methods
2.1. Study Population
2.2. Laboratory Assay
2.3. High Resolution CT Chest
2.4. Statistical Analysis
3. Results
4. Discussion
5. Conclusions
Author Contributions
Funding
Institutional Review Board Statement
Informed Consent Statement
Data Availability Statement
Acknowledgments
Conflicts of Interest
References
- Yao, X.H.; Li, T.Y.; He, Z.C.; Ping, Y.F.; Liu, H.W.; Yu, S.C.; Mou, H.M.; Wang, L.H.; Zhang, H.R.; Fu, W.J.; et al. A pathological report of three COVID-19 cases by minimally invasive autopsies. Zhonghua Bing Li Xue Za Zhi 2020, 49, 411–417. [Google Scholar]
- Shimabukuro-Vornhagen, A.; Gödel, P.; Subklewe, M.; Stemmler, H.J.; Schlößer, H.A.; Schlaak, M.; Kochanek, M.; Böll, B.; Von Bergwelt-Baildon, M.S. Cytokine release syndrome. J. Immunother. Cancer 2018, 6, 56. [Google Scholar] [CrossRef] [Green Version]
- Moore, B.J.B.; June, C.H. Cytokine release syndrome in severe COVID-19. Science 2020, 368, 473–474. [Google Scholar] [CrossRef] [Green Version]
- Huang, C.; Wang, Y.; Li, X.; Ren, L.; Zhao, J.; Hu, Y.; Zhang, L.; Fan, G.; Xu, J.; Gu, X.; et al. Clinical features of patients infected with 2019 novel coronavirus in Wuhan, China. Lancet 2020, 395, 497–506, Erratum in Lancet 2020, 395, 496. [Google Scholar] [CrossRef]
- Chen, G.; Wu, D.; Guo, W.; Cao, Y.; Huang, D.; Wang, H.; Wang, T.; Zhang, X.; Chen, H.; Yu, H.; et al. Clinical and immunological features of severe and moderate coronavirus disease 2019. J. Clin. Investig. 2020, 130, 2620–2629. [Google Scholar] [CrossRef] [Green Version]
- Fang, Y.; Zhang, H.; Xie, J.; Lin, M.; Ying, L.; Pang, P.; Ji, W. Sensitivity of Chest CT for COVID-19: Comparison to RT-PCR. Radiology 2020, 296, E115–E117. [Google Scholar] [CrossRef]
- Rubin, G.D.; Ryerson, C.J.; Haramati, L.B.; Sverzellati, N.; Kanne, J.P.; Raoof, S.; Schluger, N.W.; Volpi, A.; Yim, J.-J.; Martin, I.B.; et al. The Role of Chest Imaging in Patient Management During the COVID-19 Pandemic: A Multinational Consensus Statement from the Fleischner Society. Chest 2020, 158, 106–116. [Google Scholar] [CrossRef]
- Prokop, M.; Van Everdingen, W.; van Rees Vellinga, T.; Quarles van Ufford, H.; Stöger, L.; Beenen, L.; Geurts, B.; Gietema, H.; Krdzalic, J.; Schaefer-Prokop, C.; et al. CO-RADS: A Categorical CT Assessment Scheme for Patients Suspected of Having COVID-19—Definition and Evaluation. Radiology 2020, 296, E97–E104. [Google Scholar] [CrossRef]
- El Kazafy, S.A.; Fouad, Y.M.; Said, A.F.; Assal, H.H.; Ali, T.M.; Ahmed, A.E.; Elesawy, B.H.; Ahmed, O.M. Correlations between Cytokine Levels, Liver Function Markers, and Neuropilin-1 Expression in Patients with COVID-19. Vaccines 2022, 10, 1636. [Google Scholar] [CrossRef]
- Wei, P. General Office of the National Health Commission and the Office of the National Administration of Traditional Chinese Medicine. Diagnosis and Treatment Protocol for Novel Coronavirus Pneumonia (Trial Version 7). Chin. Med. J. 2020, 133, 1087–1095. [Google Scholar] [CrossRef]
- Sultan, R.H.; Abdallah, M.; Ali, T.M.; Ahmed, A.E.; Assal, H.H.; Elesawy, B.H.; Ahmed, O.M. The Associations between Cytokine Levels, Kidney and Heart Function Biomarkers, and Expression Levels of Angiotensin-Converting Enzyme-2 and Neuropilin-1 in COVID-19 Patients. Vaccines 2022, 10, 1045. [Google Scholar] [CrossRef]
- Sultan, R.H.; Elesawy, B.H.; Ali, T.M.; Abdallah, M.; Assal, H.H.; Ahmed, A.E.; Ahmed, O.M. Correlations between Kidney and Heart Function Bioindicators and the Expressions of Toll-Like, ACE2, and NRP-1 Receptors in COVID-19. Vaccines 2022, 10, 1106. [Google Scholar] [CrossRef]
- IBM Corp. IBM SPSS Statistics for Windows, version 22.0; IBM Corp.: Armonk, NY, USA, 2013. [Google Scholar]
- El Khouli, R.H.; Macura, K.J.; Barker, P.B.; Habba, M.R.; Jacobs, M.A.; Bluemke, D.A. Relationship of temporal resolution to diagnostic performance for dynamic contrast enhanced MRI of the breast. J. Magn. Reason. Imaging 2009, 30, 999–1004. [Google Scholar]
- Rahman, A.; Shanjana, Y.; Tushar, I.; Mahmud, T.; Rahman, G.M.S.; Milan, Z.H.; Sultana, T.; Chowdhury, A.M.L.H.; Bhuiyan, M.A.; Islam, R.; et al. Hematological abnormalities and comorbidities are associated with COVID-19 severity among hospitalized patients: Experience from Bangladesh. PLoS ONE 2021, 16, e0255379. [Google Scholar] [CrossRef]
- Chen, L.; Liu, H.G.; Liu, W.; Liu, J.; Liu, K.; Shang, J.; Deng, Y.; Wei, S. Analysis of clinical features of 29 patients with 2019 novel coronavirus pneumonia. Zhonghua Jie He He Hu Xi Za Zhi 2020, 43, 203–208. [Google Scholar] [CrossRef]
- Sun, D.; Li, H.; Lu, X.-X.; Xiao, H.; Ren, J.; Zhang, F.-R.; Liu, Z.-S. Clinical features of severe pediatric patients with coronavirus disease 2019 in Wuhan: A single center’s observational study. World J. Pediatr. 2020, 19, 251–259. [Google Scholar] [CrossRef] [Green Version]
- Ishikawa, T. Clinical Preparedness for Cytokine Storm Induced By the Highly Pathogenic H5N1 Influenza Virus. J. Pharm. Pharm. 2012, 3, e131. [Google Scholar] [CrossRef] [Green Version]
- Scheller, J.; Chalaris, A.; Schmidt-Arras, D.; Rose-John, S. The pro- and anti-inflammatory properties of the cytokine interleukin-6. Biochim. Biophys. Acta 2011, 1813, 878–888. [Google Scholar] [CrossRef] [Green Version]
- Notz, Q.; Schmalzing, M.; Wedekink, F.; Schlesinger, T.; Gernert, M.; Herrmann, J.; Sorger, L.; Weismann, D.; Schmid, B.; Sitter, M.; et al. Pro- and Anti-Inflammatory Responses in Severe COVID-19-Induced Acute Respiratory Distress Syndrome—An Observational Pilot Study. Front. Immunol. 2020, 11, 581338. [Google Scholar] [CrossRef]
- Shimizu, M. Clinical features of cytokine storm syndrome. In Cytokine Storm Syn-Drome; Cron, R., Behrens, E., Eds.; Springer: Cham, Switzerland, 2019; pp. 31–42. [Google Scholar] [CrossRef]
- Pan, Y.; Guan, H. Imaging changes in patients with 2019-nCov. Eur. Radiol. 2020, 30, 3612–3613. [Google Scholar] [CrossRef] [Green Version]
- Kwee, R.M.; Adams, H.J.; Kwee, T.C. Diagnostic performance of CORADS and the RSNA classifica-tion system in evaluating COVID-19 at Chest CT: A meta-analysis. Radiol. Cardiothorac. Imaging 2021, 3, e200510. [Google Scholar] [CrossRef]
- Bao, C.; Liu, X.; Zhang, H.; Li, Y.; Liu, J. Coronavirus Disease 2019 (COVID-19) CT Findings: A Systematic Review and Meta-analysis. J. Am. Coll. Radiol. 2020, 17, 701–709. [Google Scholar] [CrossRef]
- Li, K.; Wu, J.; Wu, F.; Guo, D.; Chen, L.; Fang, Z.; Li, C. The Clinical and Chest CT Features Associated With Severe and Critical COVID-19 Pneumonia. Investig. Radiol. 2020, 55, 327–331. [Google Scholar] [CrossRef]
- Song, F.; Shi, N.; Shan, F.; Zhang, Z.; Shen, J.; Lu, H.; Ling, Y.; Jiang, Y.; Shi, Y. Emerging 2019 novel coronavirus (2019-nCoV) pneumonia. Radiology 2020, 295, 210–217. [Google Scholar]
- Guneyli, S.; Atceken, Z.; Dogan, H.; Altinmakas, E.; Atasoy, K.C. Radiological approach to COVID-19 pneumonia with an emphasis on chest CT. Diagn. Interv. Radiol. 2020, 26, 323–332. [Google Scholar] [CrossRef]
- Sadek, M.S.; Abdelshafy, S.; Abed, H.; Allam, A.H.; Sweed, E.M.M.; Mogahed, M.; Abdel-Aziz, T.; Mohammad, E.A.-E. CO-RADS versus Lymphopenia in diagnosing COVID-19. Benha Med. J. 2022, 39, 504–513. [Google Scholar] [CrossRef]
- Aydin, N.; Yildiz, P.; Cansu, D.; Gündogdu, E.; Mutluay, R.; Yorulmaz, G.; Tekin, M.S.; Kocaturk, E.; Alatas, I.; Kartal, E.D.; et al. Investigation of the relationship of CO-RADS and CT patterns with laboratory parameters in COVID-19 patients and a new perspective on the total CT scoring system. BMC Med. Imaging 2022, 22, 128. [Google Scholar] [CrossRef]
- Wang, L. C-reactive protein levels in the early stage of COVID-19. Med. Mal. Infect. 2020, 50, 332–334. [Google Scholar] [CrossRef]
- Ramadan, A.E.; Azab, M.S.; Abdelmaksoud, A.E.; Mohammad, E.A.; Amin, N.A.; Allam, A.H.; Eldsouky, S.M.; Shahat, A.K. Serum Levels of Intercellular Adhesion Molecule-1 and TNF-α in Patients with COVID-19 and Its Relation to Disease Severity. Egypt. J. Hosp. Med. 2022, 88, 3426–3432. [Google Scholar] [CrossRef]
- Dhar, S.K.; Vishnupriyan, K.; Damodar, S.; Gujar, S.; Das, M. IL-6 and IL-10 as predictors of disease severity in COVID-19 patients: Results from meta-analysis and regression. Heliyon 2021, 7, e06155. [Google Scholar] [CrossRef]
- Aykal, G.; Hatice, E.; Derya, S.; Tuğba, Ç. Could IL-6 predict the clinical severity of COVID-19? Turk. J. Biochem. 2021, 46, 499–507. [Google Scholar] [CrossRef]


| Variable | Moderate Patients | Severe Patients | Controls | p-Value |
|---|---|---|---|---|
| (n = 50) | (n = 50) | (n = 50) | ||
| Age (Year) | 60.56 ± 1.15 | 63.64 ± 1.27 | 58.48 ± 1.24 | 0.06 |
| Male, no. (%) | 25 (50%) | 33 (66%) | 28 (56%) | 0.263 |
| Female, no. (%) | 25 (50%) | 17 (34%) | 22 (44%) | |
| Oxygen therapy | 11 (22%) | 50 (100%) | -- | <0.001 |
| NIV | ------ | <0.001 | ||
| Yes, no. (%) | (0%) | 34 (68 %) | ||
| No, no. (%) | 50 (100%) | 16 (32%) |
| Variable | Moderate Patients | Severe Patients | p-Value |
|---|---|---|---|
| (n = 50) | (n = 50) | ||
| CO-RADS | |||
| -CO-RADS 3 | 5 (10 %) | 3 (6 %) | 0.463 a |
| -CO-RADS 4 | 8 (16 %) | 21 (42 %) | 0.004 a |
| -CO-RADS 5 | 37 (74 %) | 26 (52 %) | 0.023 a |
| CT pattern | |||
| -Consolidation | 3 (6%) | 10 (20 %) | 0.038 a |
| -GGO | 40 (80 %) | 30 (60 %) | 0.030 a |
| -Consolidation & GGO | 7 (14 %) | 8 (16 %) | 0.781 a |
| -GGO & Pleural effusion | --- | 2 (4 %) | 0.155 a |
| CT distribution | |||
| Subpleural & peripheral | 46 (92 %) | 45 (90 %) | 0.730 b |
| Subpleural & peripheral and central | 4 (8 %) | 5 (10 %) | |
| Bilateral lung lesions | 42 (92 %) | 45 (90 %) | 0.377 b |
| Unilateral lung lesions | 8 (8 %) | 5 (10 %) |
| Variable | CO-RADS | |||
|---|---|---|---|---|
| Moderate Patients | Severe Patients | |||
| r | p | r | p | |
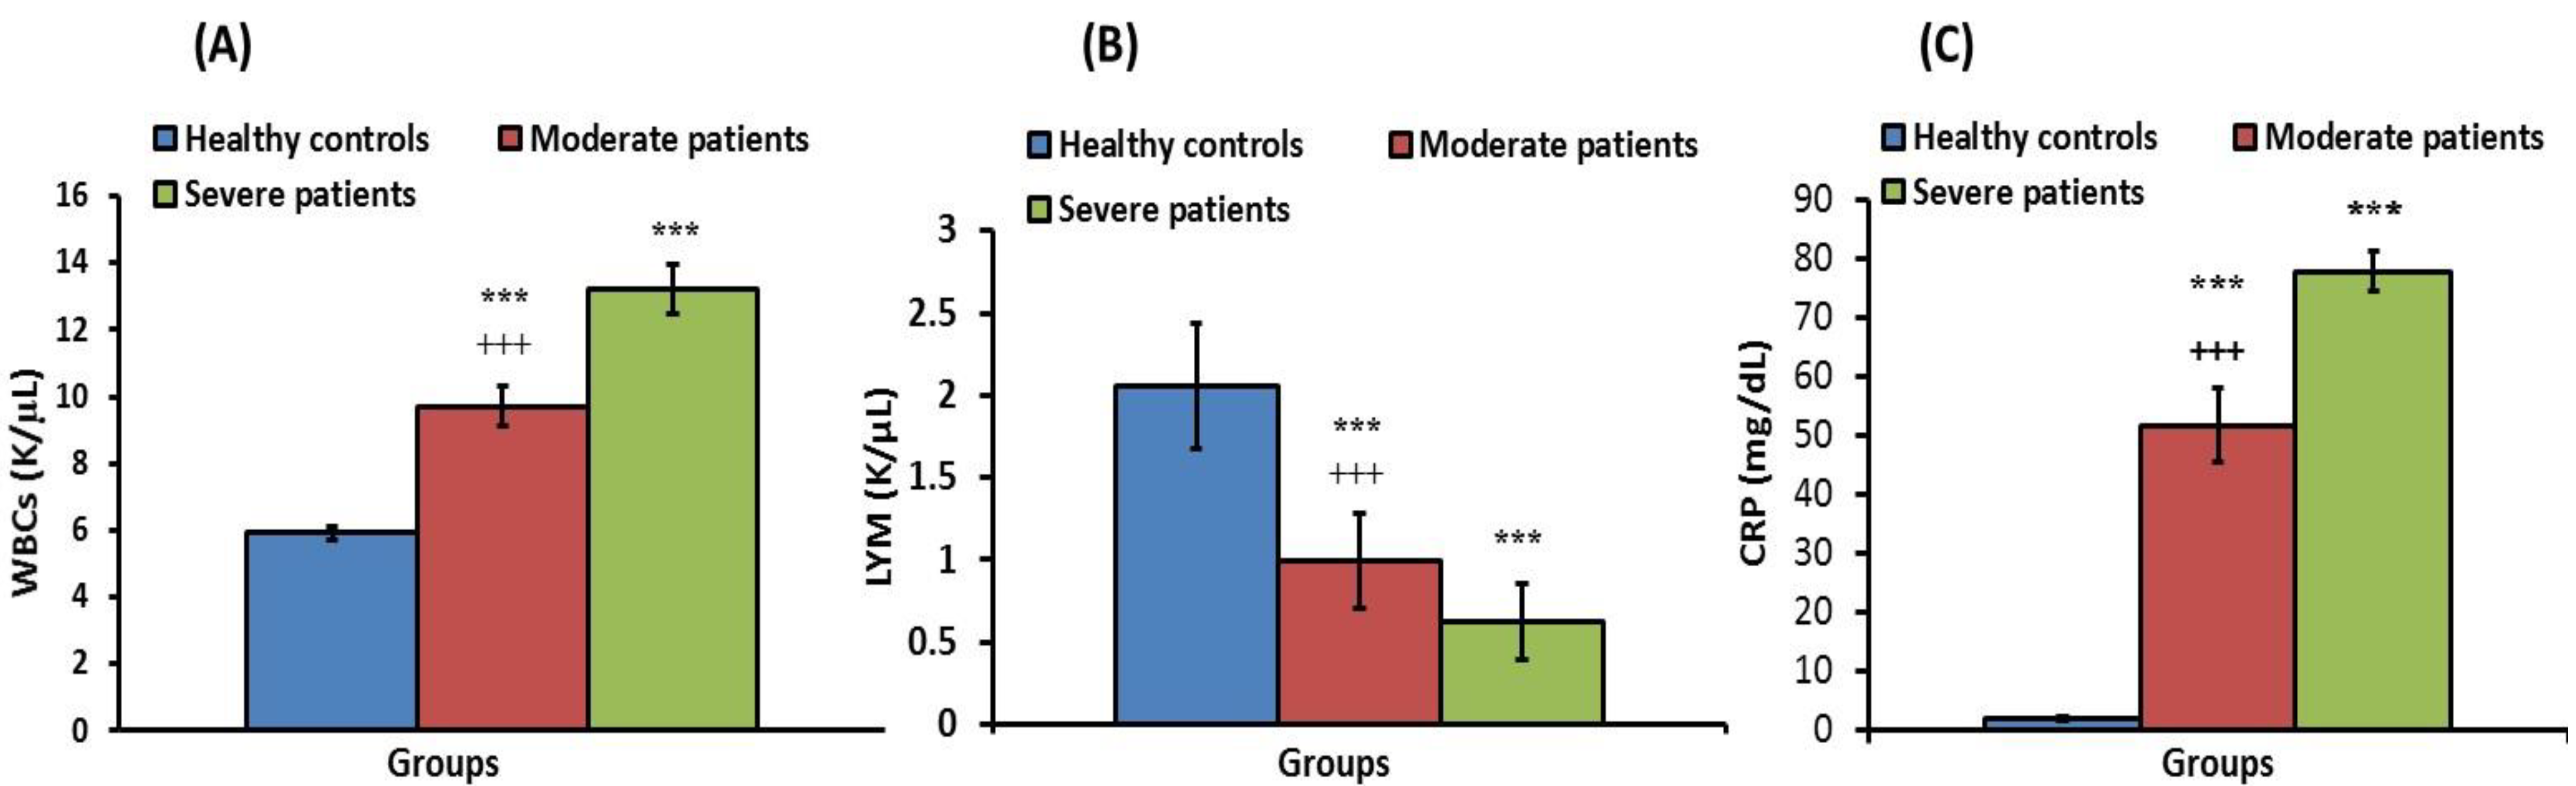
| WBCs | 0.510 *** | <0.001 | 0.650 *** | <0.001 |
| CRP | 0.642 *** | <0.001 | 0.894 *** | <0.001 |
| IL-1β | 0.680 *** | <0.001 | 0.578 *** | <0.001 |
| IL-4 | 0.563 *** | <0.001 | 0.426 *** | <0.001 |
| IL-6 | 0.812 *** | <0.001 | 0.924 *** | <0.001 |
| IL-18 | 0.823 *** | <0.001 | 0.869 *** | <0.001 |
| IL-35 | 0.794 *** | <0.001 | 0.777 *** | <0.001 |
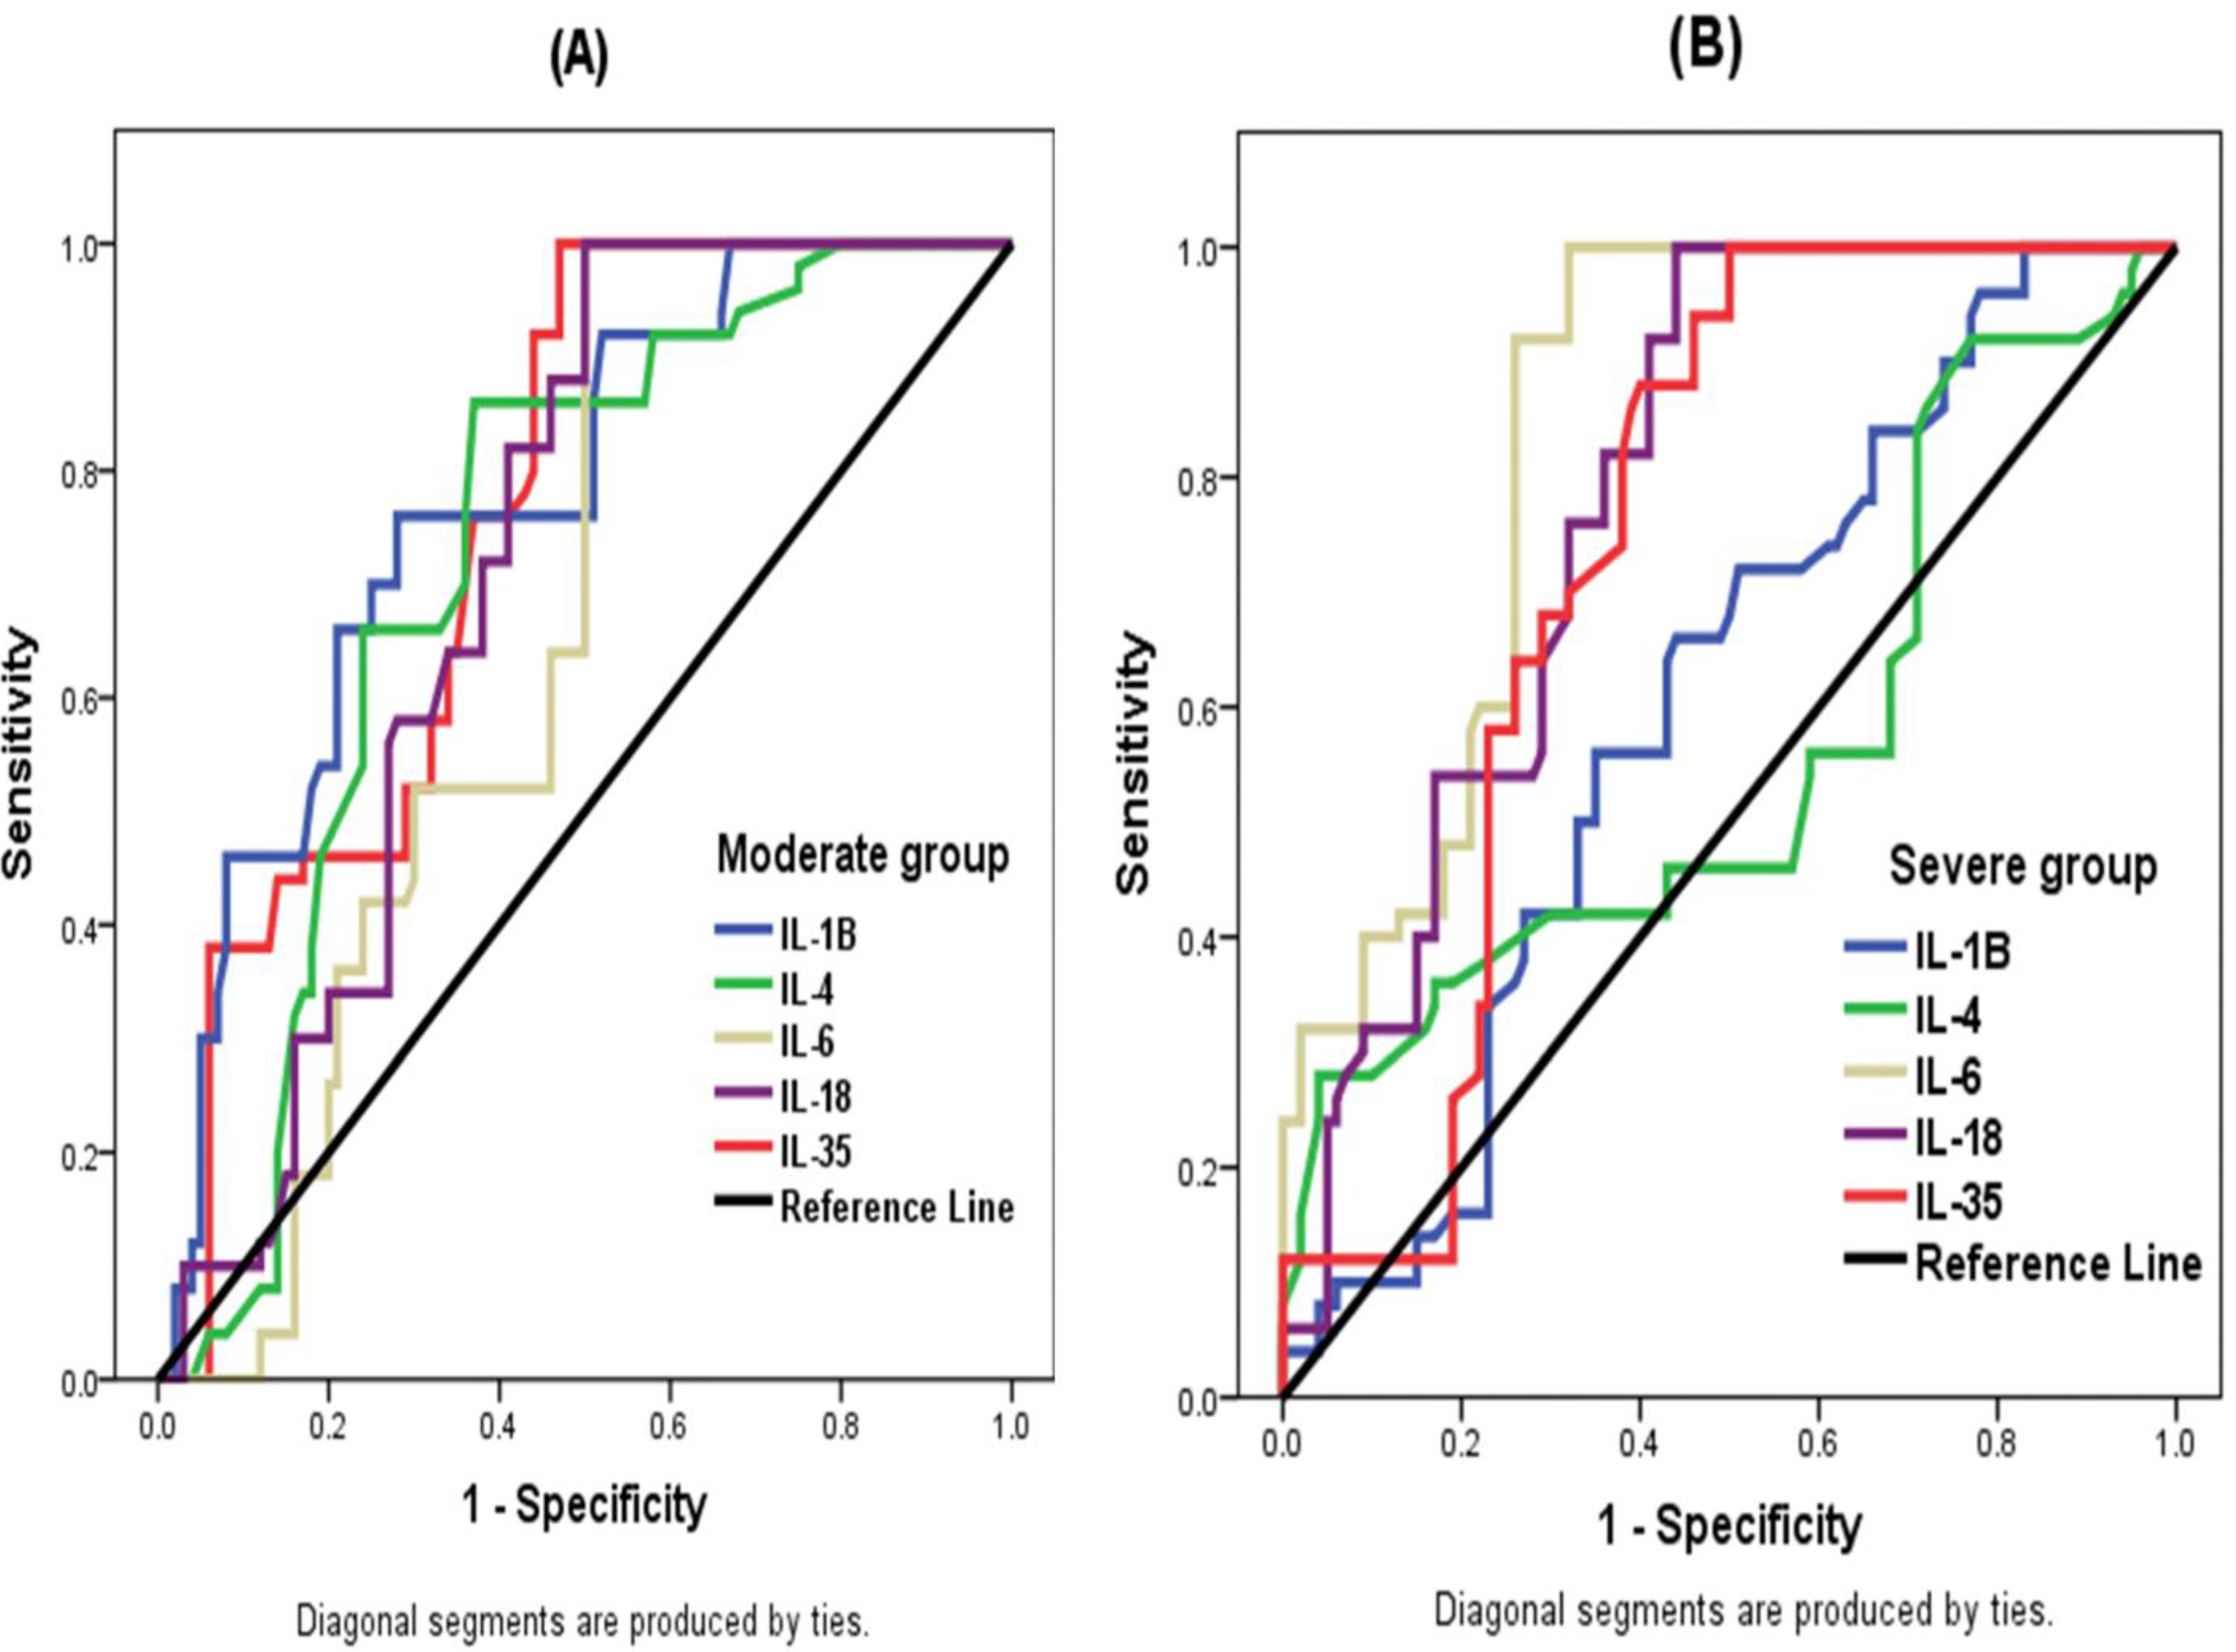
| AUC | CI 95% | p | Cut-Off Value | Sensitivity | Specificity | |
|---|---|---|---|---|---|---|
| IL-Iβ (pg/mL) | 0.774 | 0.698–0.851 | <0.001 | 17.51 | 86% | 49% |
| IL-4 (pg/mL) | 0.723 | 0.641–0.806 | <0.001 | 5.5 | 76% | 64% |
| IL-6 (pg/mL) | 0.656 | 0.517–0.742 | 0.002 | 24.31 | 100% | 50% |
| IL-18 (pg/mL) | 0.715 | 0.636–0.795 | <0.001 | 128.5 | 100% | 50% |
| IL-35(pg/mL) | 0.758 | 0.683–0.833 | <0.001 | 93.85 | 92% | 56% |
| AUC | CI 95% | p | Cut-Off Value | Sensitivity | Specificity | |
|---|---|---|---|---|---|---|
| IL-Iβ (pg/mL) | 0.604 | 0.513–0.696 | 0.038 | 18.95 | 66% | 56% |
| IL-4 (pg/mL) | 0.563 | 0.459–0.666 | 0.212 | 6.915 | 46% | 57% |
| IL-6 (pg/mL) | 0.844 | 0.783–0.904 | <0.001 | 51.01 | 100% | 68% |
| IL-18 (pg/mL) | 0.785 | 0.714–855 | <0.001 | 142.5 | 100% | 56% |
| IL-35 (pg/mL) | 0.742 | 0.665–0.819 | <0.001 | 94.80 | 88% | 60% |
Disclaimer/Publisher’s Note: The statements, opinions and data contained in all publications are solely those of the individual author(s) and contributor(s) and not of MDPI and/or the editor(s). MDPI and/or the editor(s) disclaim responsibility for any injury to people or property resulting from any ideas, methods, instructions or products referred to in the content. |
© 2022 by the authors. Licensee MDPI, Basel, Switzerland. This article is an open access article distributed under the terms and conditions of the Creative Commons Attribution (CC BY) license (https://creativecommons.org/licenses/by/4.0/).
Share and Cite
El Kazafy, S.A.; Fouad, Y.M.; Said, A.F.; Assal, H.H.; Ahmed, A.E.; El Askary, A.; Ali, T.M.; Ahmed, O.M. Relation between Cytokine Levels and Pulmonary Dysfunction in COVID-19 Patients: A Case-Control Study. J. Pers. Med. 2023, 13, 34. https://doi.org/10.3390/jpm13010034
El Kazafy SA, Fouad YM, Said AF, Assal HH, Ahmed AE, El Askary A, Ali TM, Ahmed OM. Relation between Cytokine Levels and Pulmonary Dysfunction in COVID-19 Patients: A Case-Control Study. Journal of Personalized Medicine. 2023; 13(1):34. https://doi.org/10.3390/jpm13010034
Chicago/Turabian StyleEl Kazafy, Salma A., Yasser M. Fouad, Azza F. Said, Hebatallah H. Assal, Amr E. Ahmed, Ahmad El Askary, Tarek M. Ali, and Osama M. Ahmed. 2023. "Relation between Cytokine Levels and Pulmonary Dysfunction in COVID-19 Patients: A Case-Control Study" Journal of Personalized Medicine 13, no. 1: 34. https://doi.org/10.3390/jpm13010034