
Relationship between the Chinese Main Air Transport Network and COVID-19 Pandemic Transmission


1
School of Maritime Economics and Management, Dalian Maritime University, Dalian 116026, China
2
School of Marine Law and Humanities, Dalian Ocean University, Dalian 116300, China
*
Authors to whom correspondence should be addressed.
Mathematics 2022, 10(13), 2348; https://doi.org/10.3390/math10132348
Submission received: 24 May 2022
/
Revised: 21 June 2022
/
Accepted: 3 July 2022
/
Published: 5 July 2022
(This article belongs to the Special Issue Feature Papers in Complex Networks and Their Applications)
Abstract
:The COVID-19 pandemic had an unprecedented impact on the civil aviation passenger transport industry. This study analyzes the scale change and spatial distribution of the Chinese main air transport network (CMATN) and its role in the early spread of the pandemic using a complex network analysis method and econometric model. The result shows that CMATN is mainly located in the economically developed and densely populated central and eastern regions of China. The normalized degree, closeness, and betweenness centralities of CMATN node cities show an overall increasing trend, indicating that the air transport network is constantly improving. There was a significant positive relationship between the centrality of node cities, the duration of the COVID-19 pandemic, and the number of confirmed cases, indicating that air transport networks were crucial in the pandemic’s early spread. Furthermore, social and economic variables such as GDP and population had a significant positive impact on the duration of the pandemic, indicating that higher levels of social and economic development increased the seriousness of the pandemic. Our findings are expected to supplement existing research and serve as a point of reference for pandemic prevention and control.
MSC:
05C82; 90B061. Introduction
In December 2019, some hospitals in Wuhan successively found and reported several cases of unexplained pneumonia in people who had a history of exposure to the seafood market in South China. Viruses with a high infection rate spread rapidly in various regions of China during January 2020 [1]. Wuhan, as the initial outbreak point of the pandemic, implemented a lockdown policy on 23 January 2020, to alleviate and suppress the spread of the pandemic. After that, various regions in China also began to implement travel bans [2], and population mobility was greatly reduced [3,4]. The transportation sector, particularly civil aviation, was struck hard [5,6,7]. The demands of domestic and international civil aviation passenger were decreased sharply, and the civil aviation passenger transport industry was also suspended [8,9]. It can be said that COVID-19 had an unprecedented impact on the aviation transportation industry [10,11], and worldwide many airlines struggled to survive [12,13].
Nowadays, the outlook on the global pandemic is still not optimistic. COVID-19 has become one of the most destructive pandemics in modern world history, as can be seen by the number of casualties and social and economic losses [14]. At the start of the outbreak, China’s civil aviation passenger transport market was impacted first by COVID-19. Due to the strict case tracking and flow restriction measures implemented by the Chinese government, the COVID-19 pandemic began to be controlled in early March 2020, and the Chinese civil aviation passenger transport market began to recover [15]. Before 2020, with the rapid development of China’s air transport network, many cities had developed into international hub airports [16], and the number of routes with annual passenger volumes of more than 300,000 was increasing. With the continuous strengthening of spatial links between different regions, population mobility was improved, which had a significant positive impact on the speed and scope of the spread of the pandemic [17]. Among these, efficient civil aviation connectivity posed severe obstacles to pandemic prevention and control, as well as promoted the spread of pandemics to some extent [18].
When it comes to the impact of civil aviation, high-speed rail, and buses on COVID-19 transmission, some scholars found that there was a significant positive correlation between these factors and the number of people diagnosed. In addition, they found that the speed of the pandemic spread had a significant relationship with the existence of airports and high-speed rail stations in cities [19]. In recent years, studies have focused on the intersection of transport networks with disease transmission, prevention, and control. Transport networks were used to predict the trend of pandemic transmission [20,21] and to formulate corresponding measures to alleviate and suppress the spread of the pandemic [22,23].
In the post-pandemic era, China continues to face the risk of international travelers increasing the number of COVID-19 cases [24]. We do not know how long this disaster will last, and how large the probability and scope of the outbreak will be. Because civil aviation is an important channel for the spread of pandemics, it is necessary to continue to conduct in-depth research on the interaction between civil aviation and the pandemic [25], to provide guidance for the disease’s prevention and control in the post-pandemic era.
This study adopts a complex network analysis method combined with an econometric model to analyze the relationship between civil aviation networks and pandemic transmission. At present, there are many relevant studies on the application of complex network theory in the field of transportation, but most of them researched the structure of high-speed passenger transport network systems such as high-speed rail and civil aviation [26,27,28,29]. In the 1980s, China’s civil aviation network developed to a larger scale and began to evolve into complex networks [30,31], which showed typical small-world network characteristics [32,33]. With the continuous expansion of the scale of air transport networks, scholars continued to use complex network analysis methods to study civil aviation, focusing mainly on the topological structure of air transport networks [34,35]. In addition, scholars examined civil aviation networks from the perspective of multi-layer networks based on complex network analysis methods [36]. However, to the best of our knowledge, there is no research related to the use of complex network analysis methods to study the relationship between air transport networks and the pandemic’s transmission. Therefore, we address this gap. Civil aviation, as a transportation tool with efficient connectivity, can effectively improve global accessibility, strengthen spatial links in different regions, and promote population mobility. As the backbone of China’s air transport network, CMATN plays an extremely important role. An empirical study that assesses the spatial distribution of CMATN and the pandemic’s transmission, as well as the relationship between them, will facilitate discovering the extent of the role civil aviation passenger transport plays in the early stage of a pandemic’s transmission.
Therefore, this study examines the CMATN scale, node city centrality, and pandemic data, and comprehensively uses a complex network analysis method and econometric model. It analyzes the evolution of CMATN, the spatial distribution of the pandemic, and the role of the air transport network in the early stage of a pandemic’s transmission. This is of great significance for pandemic prevention and control in the post-pandemic era. The important contributions of this study are as follows. First, we analyze the changes in China’s aviation passenger transport market by using route data of CMATN, the cumulative number of confirmed cases and duration of COVID-19 in various regions, and socio-economic development data to gain insight into the latest development of the aviation passenger transport industry. Studies have not previously used this type of data. Second, before proving the role of CMATN in the early stages of pandemic spread, we analyze the relationship between the number of confirmed cases and the change in civil aviation passenger throughput, to more intuitively illustrate the impact of the pandemic on the civil aviation passenger industry. Finally, we examine the spread of the pandemic to find the role of CMATN in the early spread of the pandemic from a statistical perspective. Our research can enrich the literature and provide policy references for policymakers and civil aviation operators.
2. Materials and Methods
The study area was the mainland of China. To analyze the change of CMATN passenger volume under the COVID-19 pandemic, we viewed cities as the nodes and the inter-city flight routes as the edges, selected the undirected network formed by the routes with an annual passenger volume of more than 300,000, and built a database containing relevant indicators such as civil aviation passenger volumes, local social and economic data, the number of newly diagnosed people, and the duration. CMATN is the busiest passenger transport network in China, which is formed by a route with more than 300,000 passengers per year. The total amount of passenger transport accounts for more than 60% of the total domestic passenger transport in China and has strong representativeness. The data sources are as follows:
- The data on China’s main air transport network routes were derived from Statistical Data on Civil Aviation of China, a publication compiled and published by the Development Planning Division of the China Civil Aviation Administration. Due to the rapid development of China’s civil aviation, the statistical standard of passenger traffic in China’s main domestic routes has changed. Since 2014, only passenger volumes that were over 300,000 would be recorded. To unify the standard, this study selected flight routes with annual passenger volumes of more than 300,000.
- The data on the cumulative number of confirmed cases and duration of COVID-19 are mainly from the websites of local governments and national health commissions. Using municipalities, prefecture-level cities, and certain provincial municipalities as statistical units, we integrated the pandemic data of COVID-19. Among them, the cumulative number of confirmed cases of COVID-19 refers to the cumulative number of confirmed cases in 2020. The duration of the pandemic is the cumulative number of days with newly diagnosed cases in various regions.
- The socio-economic data was obtained from the China Urban Statistical Yearbook published by the China Bureau of Statistics and the Statistical Bulletin of National Economic and Social Development published by various regions. Socio-economic data include the 2019 GDP and total population of 67 node cities in CMATN.
The descriptive statistics are shown on Table 1.
2.1. Complex Network Analysis
The complex network is the topological basis of complex system research and originated from graph theory. In recent years, applying complex network theory to the transport field has become popular in research. Complex systems are composed of many interacting components. The relationship between components can be abstracted as points and edges of complex networks forming complex networks with point-edge structures. The structure-determining function is the basic principle of complex network analyses; in other words, the main purpose of a network analysis is to explain the structural relationship of complex networks. Among them, the composition of social structure is the regularity of the relationship model between tangible entities [37]. Entities can be natural persons, small groups, organizations, or countries. Therefore, CMATN can be regarded as network with nodes , edges , node set , and edge set . Adjacency matrix . represents the connectivity of the network and . indicates node is directly connected to node ; otherwise, .
To analyze the network structure, in this study we mainly selected network density, average path length, and average clustering coefficients to analyze the evolutionary trend of the network structure. In addition, we referred to some literature and found that the network type does not affect the conclusions of this paper. Bagler studied the Indian airport network as a weighted network, and found that whether the Indian airport network is weighted or not, it presented the characteristics of a small-world network [38]. Kim and Yoon took link distance and the link-wise air traffic volume as weights, analyzed the centrality of key nodes of an unweighted and weighted Northeast Asia route network, and reached the same conclusion [39]. Deng et al. found that there was no significant change in the weighted and unweighted intermediate centrality ranking of node cities in the analysis of the Chinese scheduled freighter network [40]. Thus, we used the undirected network formed by the segments with an annual passenger volume of more than 300,000 for analysis.
Network density (D) measures the degree of interconnection between each node city, reflecting the overall distribution and tightness of the entire network. The greater the network density, the closer the relationship between the network node cities. The network density calculation is shown in Equation (1), and the variable descriptions are shown in Table 2.
The average path length (L) is defined as the average value of the shortest path edge number between any two nodes in the network, which reflects the compactness and accessibility of the network and is an important indicator to measure the performance of the air transport network. The calculation of the average path length is shown in Equation (2).
The clustering coefficient (C) measures the clustering degree of nodes in the network and reflects the local cohesion of the network and the degree of interconnection between a node and its adjacent nodes. The average clustering coefficient is the average of the clustering coefficient of all nodes, which reflects the clustering degree of the entire network. The clustering coefficient calculation is shown in Equation (3).
We further analyzed the centrality of node cities in air transport networks by selecting degree, closeness, and betweenness centralities. Centrality is an indicator to determine the importance of nodes in a network, and it is a quantification of node importance. The measurement indicators for determining centrality are different in different situations, but degree, closeness, and betweenness centralities are the most important measurement indicators at present. Specifically, degree centrality is the most direct indicator to describe the importance of a node in the network; closeness centrality reflects the degree of proximity between a node and other nodes in the network; and betweenness centrality is a control indicator, reflecting the degree to which a single node becomes the intermediary of connections between other nodes. Therefore, the intensity of population flow between node cities in the civil aviation network and the risk of pandemic spread can be well described by these three centrality indicators. In addition, we used the normalized value to eliminate the influence of network size on the centrality of node cities for the centrality analysis index.
Degree centrality is the most direct indicator of node centrality in network analyses. Normalized degree centrality measures the degree of connection between a single node city and all other node cities in the network, which reflects the correlation between the node city and other node cities and the relative degree of being in the central position of the entire air transport network. The normalized degree centrality calculation is shown in Equation (4).
Normalized closeness centrality measures the proximity of a node city to other node cities in the network, and normalized closeness centrality is the reciprocal of the cumulative sum of the shortest distance from a node city to other node cities. If the distance between a node and other points in the network is very short, the node has a high normalized closeness centrality, which is the center of gravity of the entire network. The normalized closeness centrality calculation is shown in Equation (5).
Normalized betweenness centrality is a control index that reflects the degree to which a single node city becomes the intermediary of passenger flow linkage between other node cities. The normalized betweenness centrality calculation is shown in Equation (6).
2.2. Econometric Model
We found that the node cities with a higher centrality have a higher spatial coincidence with the cities with higher pandemic durations, based on the data released by the Civil Aviation Administration of China and the pandemic data released by regional health committees. Therefore, we found that CMATN promotes the spread of the pandemic to some extent. In addition, there may be a lag relationship between civil aviation passenger transport and pandemic spread, that is, the civil aviation passenger transport network still transports passengers with its original structure before the pandemic, which may lead to the early spread of the pandemic. To verify our finding and further analyze the transmission relationship between CMATN and the pandemic, we selected relevant variables to construct an econometric model, Equation (7).
We also considered that flight routes between cities with relatively high centrality tend to have large annual passenger volumes and flights. Therefore, to further verify the relationship between the air transport network and pandemic transmission, we selected the relevant data of the route with annual passenger volumes of more than 300,000, and constructed an econometric model based on the pandemic’s duration, GDP, and population density as shown in Equation (8). In Equation (7), the centrality index is used to quantify the importance of node cities in the civil aviation network, and then we can analyze the risks of different node cities in the spread of the pandemic. Equation (8) selects the annual passenger volume and flight frequency data of the flight segment between the node cities, and analyzes the relationship between civil aviation and the spread of the pandemic from the perspective of the total transportation volume.
In Equations (7) and (8), i denotes the city where the departure station is located and j denotes the city where the terminal station is located. The dependent variable is the average duration of the COVID-19 pandemic in regions i and j in 2020, representing the status of the COVID-19 pandemic in regions i and j. is the average value of normalized centrality for region i and region j, where is the average normalized closeness centrality of region i and region j. is the average relative betweenness centrality of region i and region j. is a dummy variable. If regions i or j are in Wuhan, then is 1; otherwise, it is 0.
Generally, GDP and population (as economic factors) are considered the main factors affecting transportation services and are widely used as explanatory variables in empirical research [41,42]. CMATN is mainly located in the central and eastern parts of China where the economy is relatively developed and the population is relatively dense. Therefore, GDP and population are the main factors that affect air transport services and are included in the analysis model. is the average per capita GDP of region i and region j and is the average population density of region i and region j. is data for i and j, including flights and annual passenger volumes for i and j.
3. Results
3.1. Evolution Analysis of the Air Transport Network Structure
3.1.1. Network Scale
With the rapid development of China’s economy, China’s civil aviation passenger transport industry has also been booming. The annual passenger volume of an increasing number of flight routes has reached 300,000, which has gradually expanded CMATN. However, in the pandemic era, how will changes in the scale and structure of CMATN affect the spread of the pandemic? To answer this question, we attempted to analyze the connection between the civil aviation network and the spread of the pandemic by examining the development of CMANT.
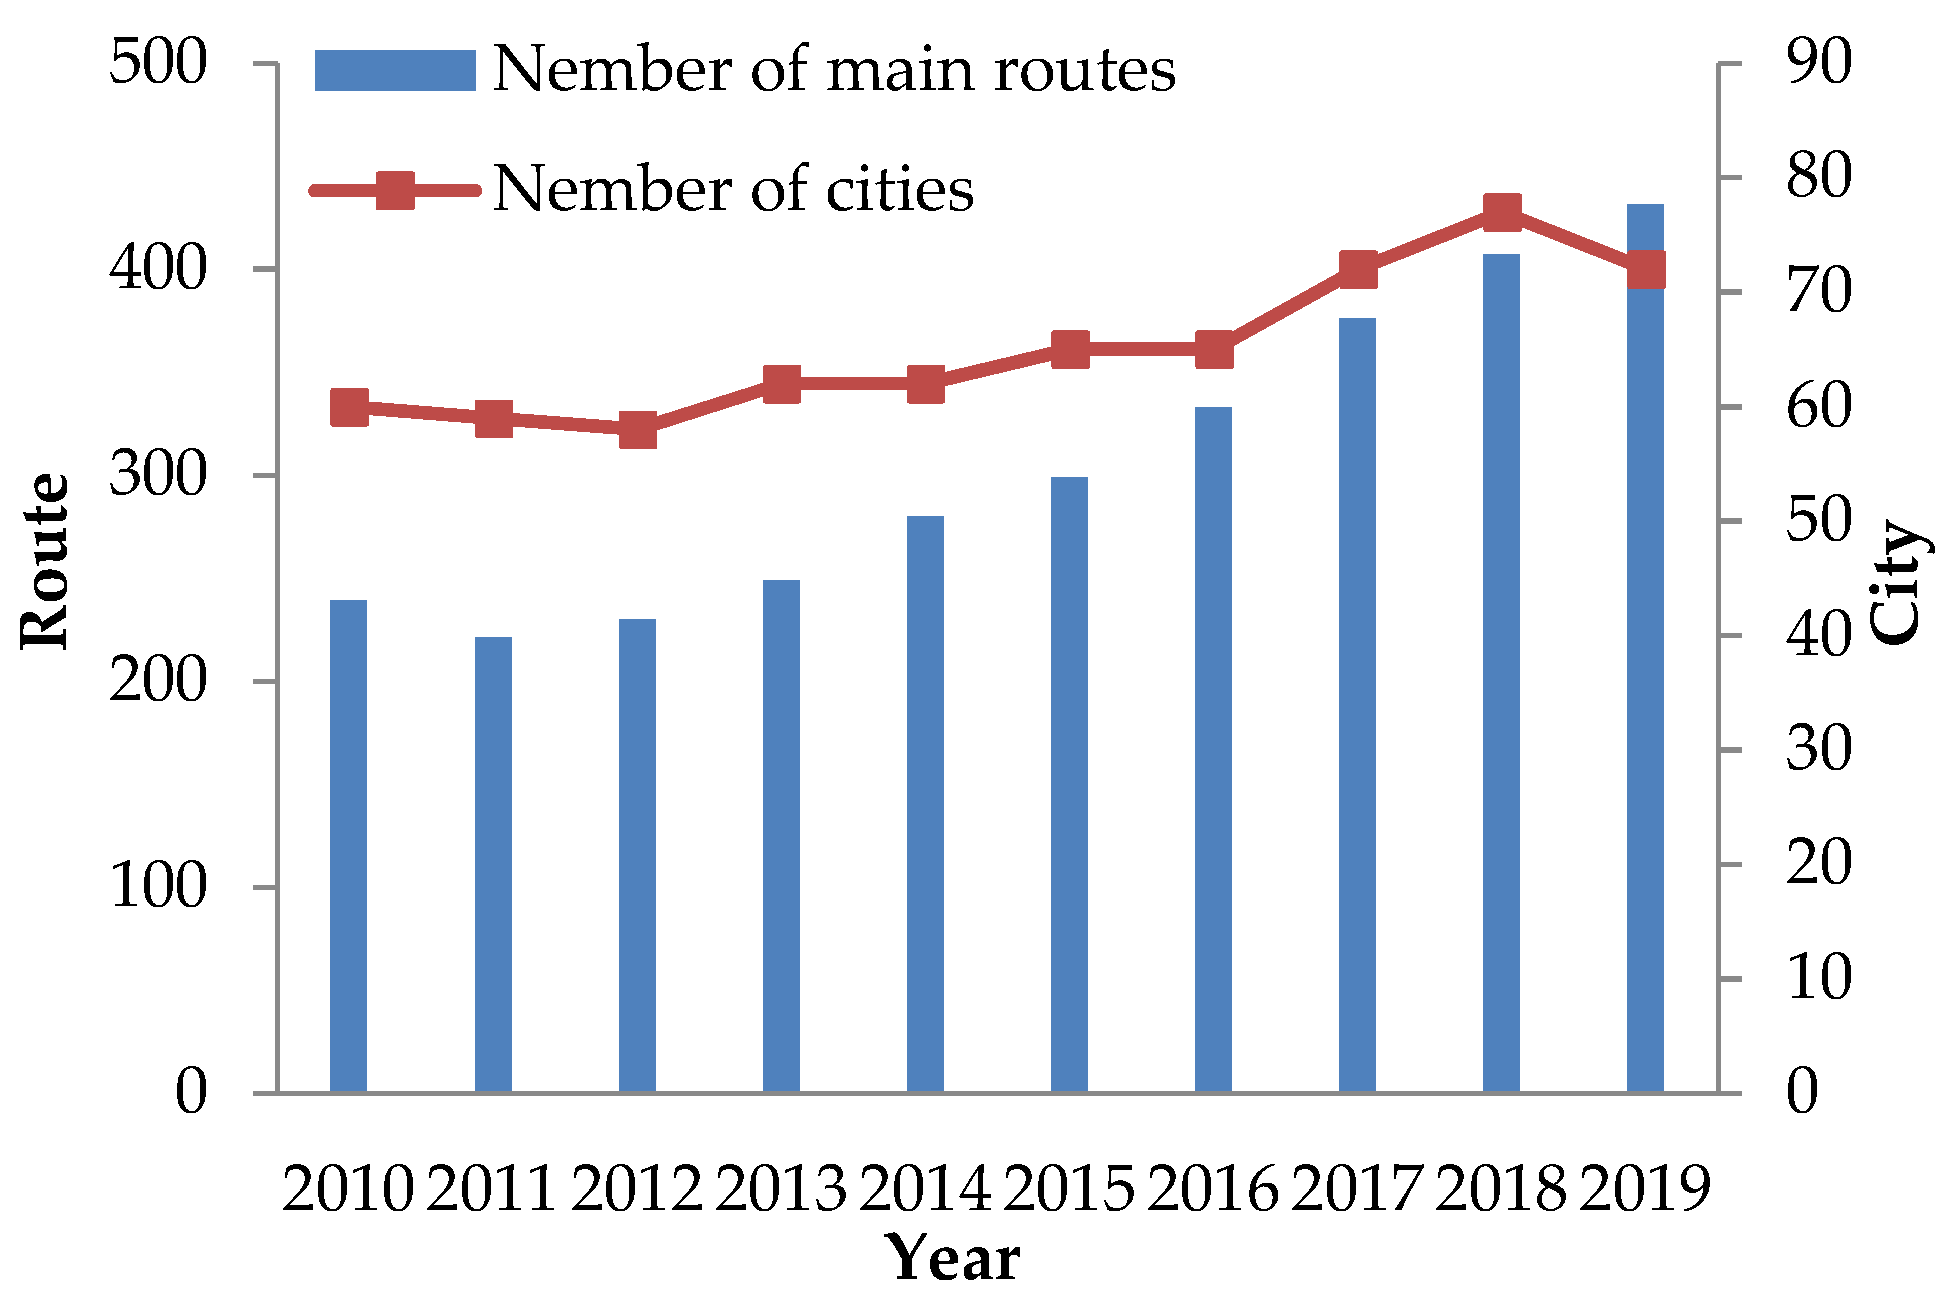
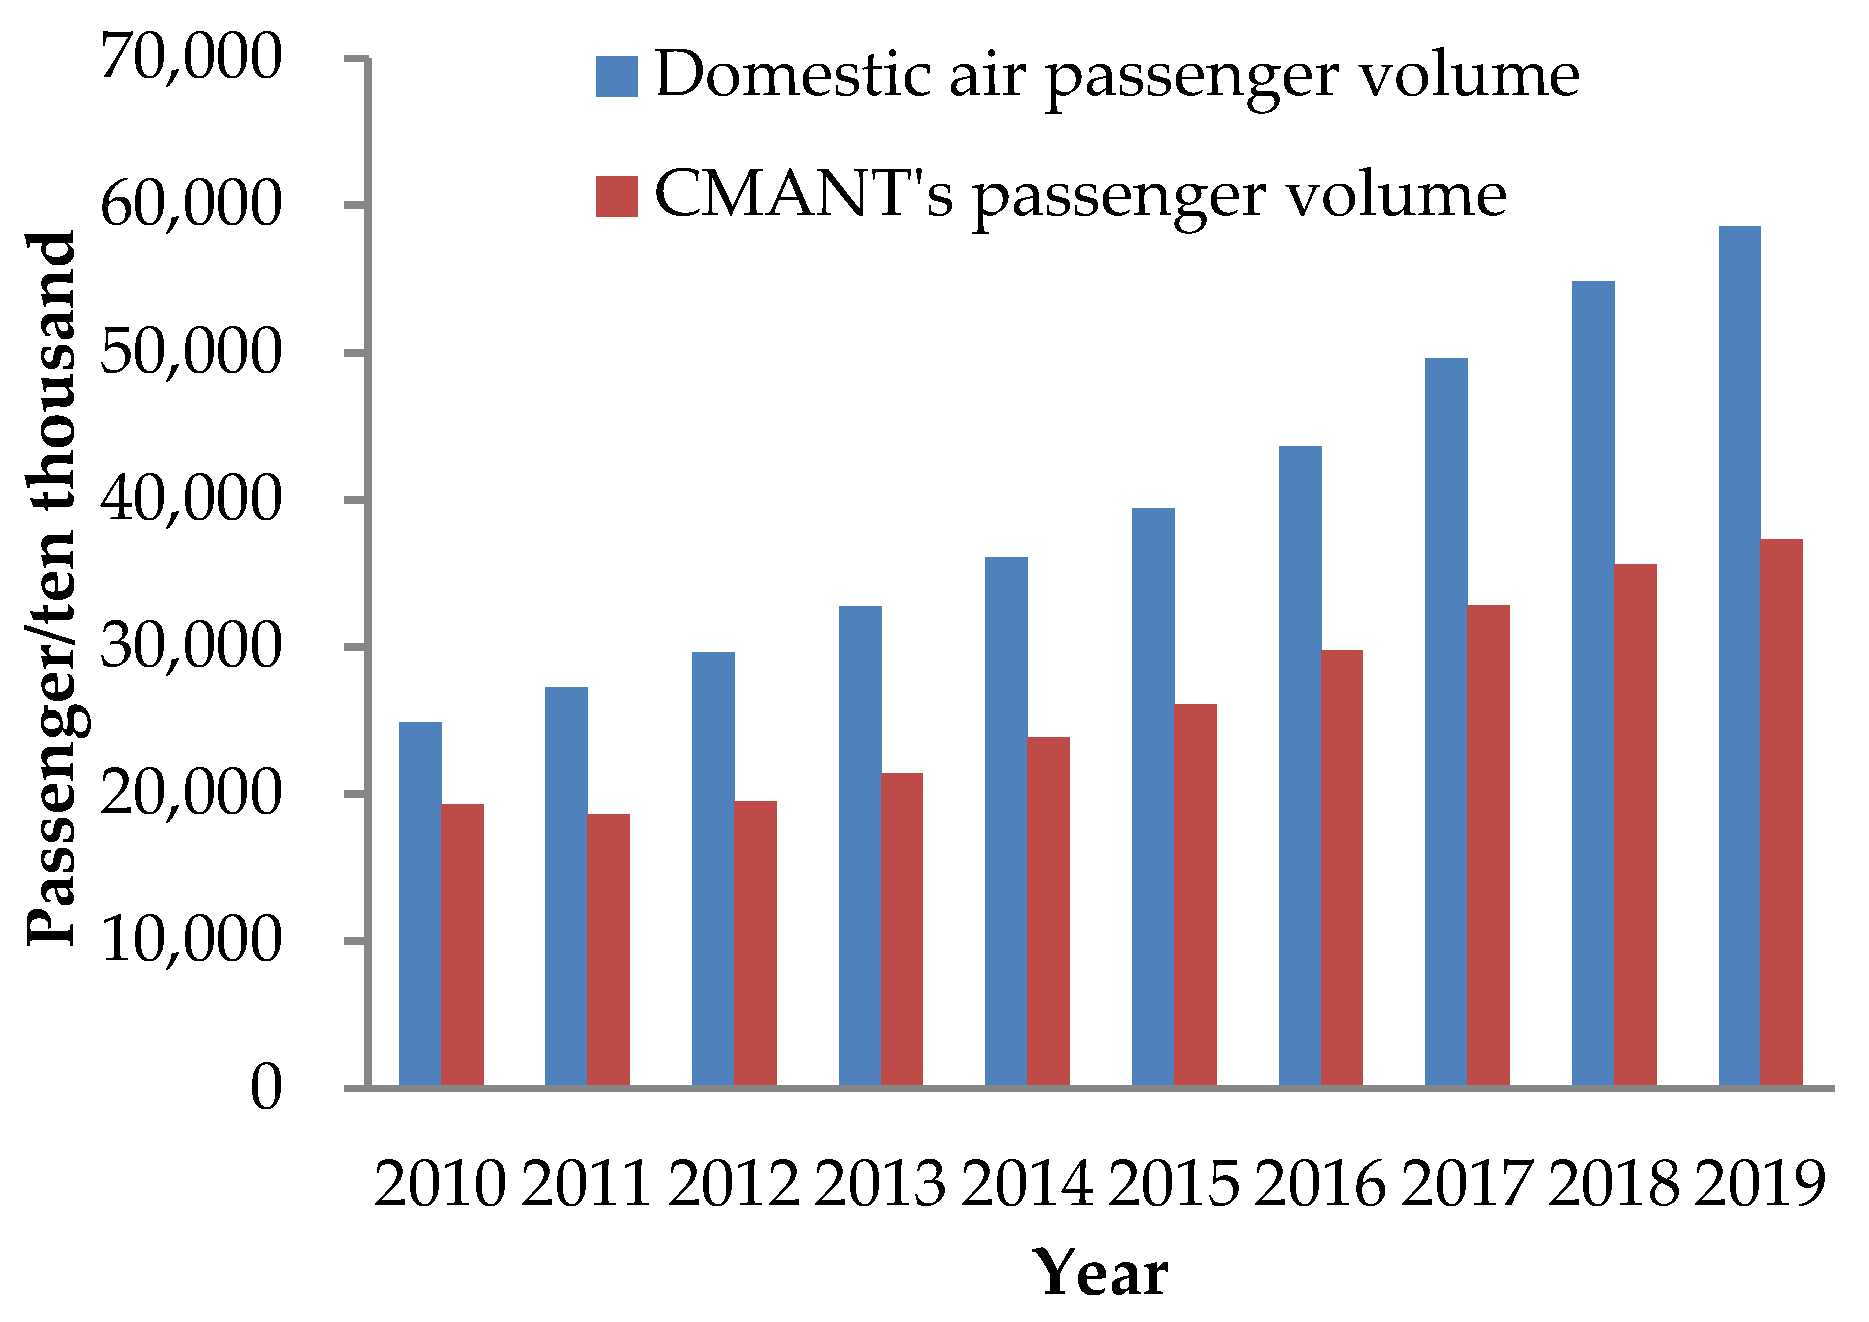
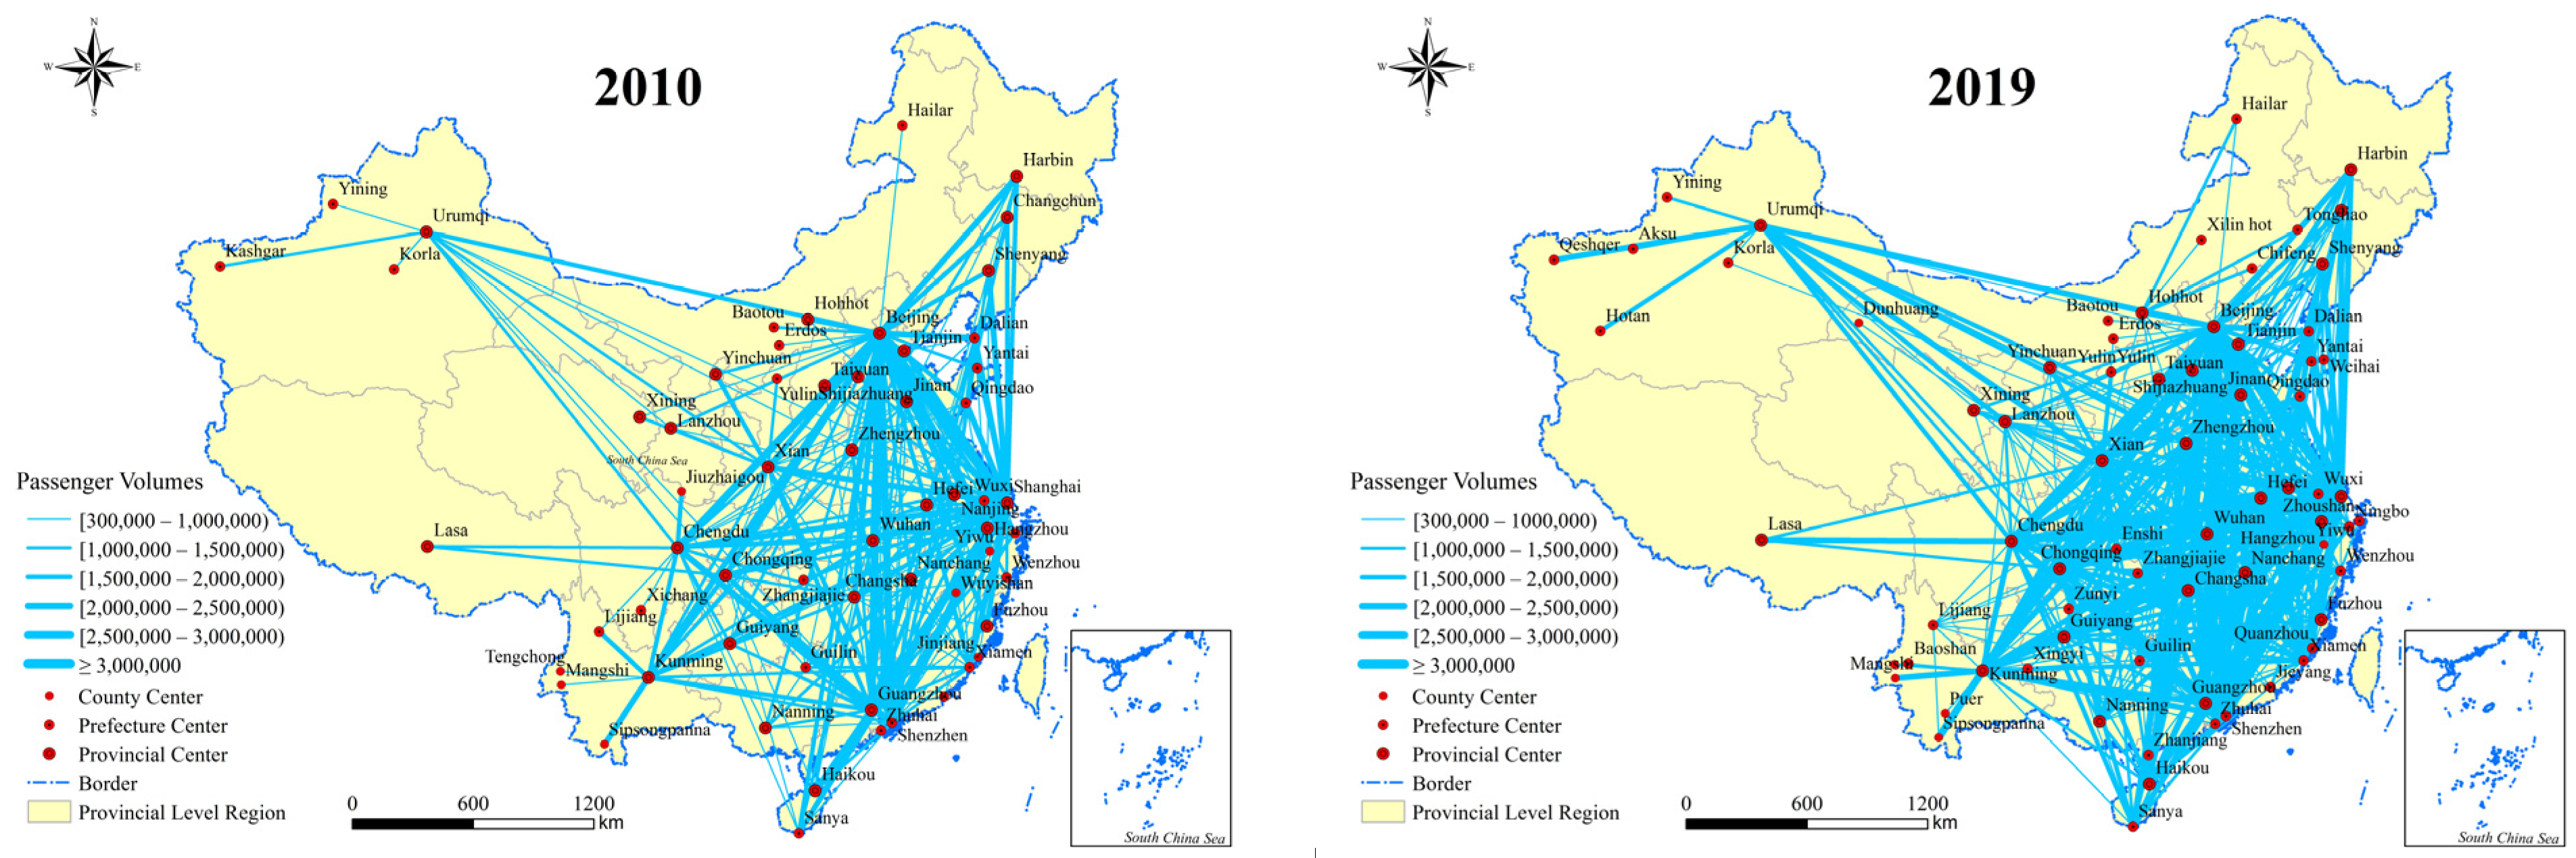
The number of node cities and main routes in CMATN increased significantly. The number of main routes with more than 300,000 passengers was 1.8 times more in 2019 than in 2010, and the number of node cities increased by 11 compared to 2010 (Figure 1). In addition, the passenger volume of civil aviation was greatly improved, including the domestic civil aviation and CMATN passenger volumes. The domestic civil aviation and CMATN passenger volumes were 2.36 times and 1.94 times more in 2019 than in 2010, respectively (Figure 2). Overall, the scale of China’s air transport network is constantly expanding, and the domestic air transport network system and aviation hub functional system is gradually being built and improved, which can also be seen in the CMATN topology diagram in 2010 and 2019 (Figure 3).
The number of CMATN main routes and annual passenger volumes is very large and mainly concentrated in the central and eastern region of China, which has a developed economy and dense population. Specifically, CMATN is mainly distributed in the southeast side of the Hu Line (the Hu Line is a comparative line for dividing China’s population density, proposed by Huanyong Hu (1901–1998), a Chinese geographer, in 1935. It is a straight line from Heihe to Tengchong. More than 90% of China’s population and economic activity is on the southeast side of the Hu Line) and the provincial capital cities that play the role of regional transport hubs (Figure 3). This is because the population and economic development levels are important factors that affect the development of civil aviation networks. In addition, civil aviation transportation is an important way in which pandemics can spread. The relatively perfect civil aviation passenger transport network will also substantially increase the risk of infection in the central and eastern regions.
3.1.2. Network Density, Average Clustering Coefficient, and Path Length
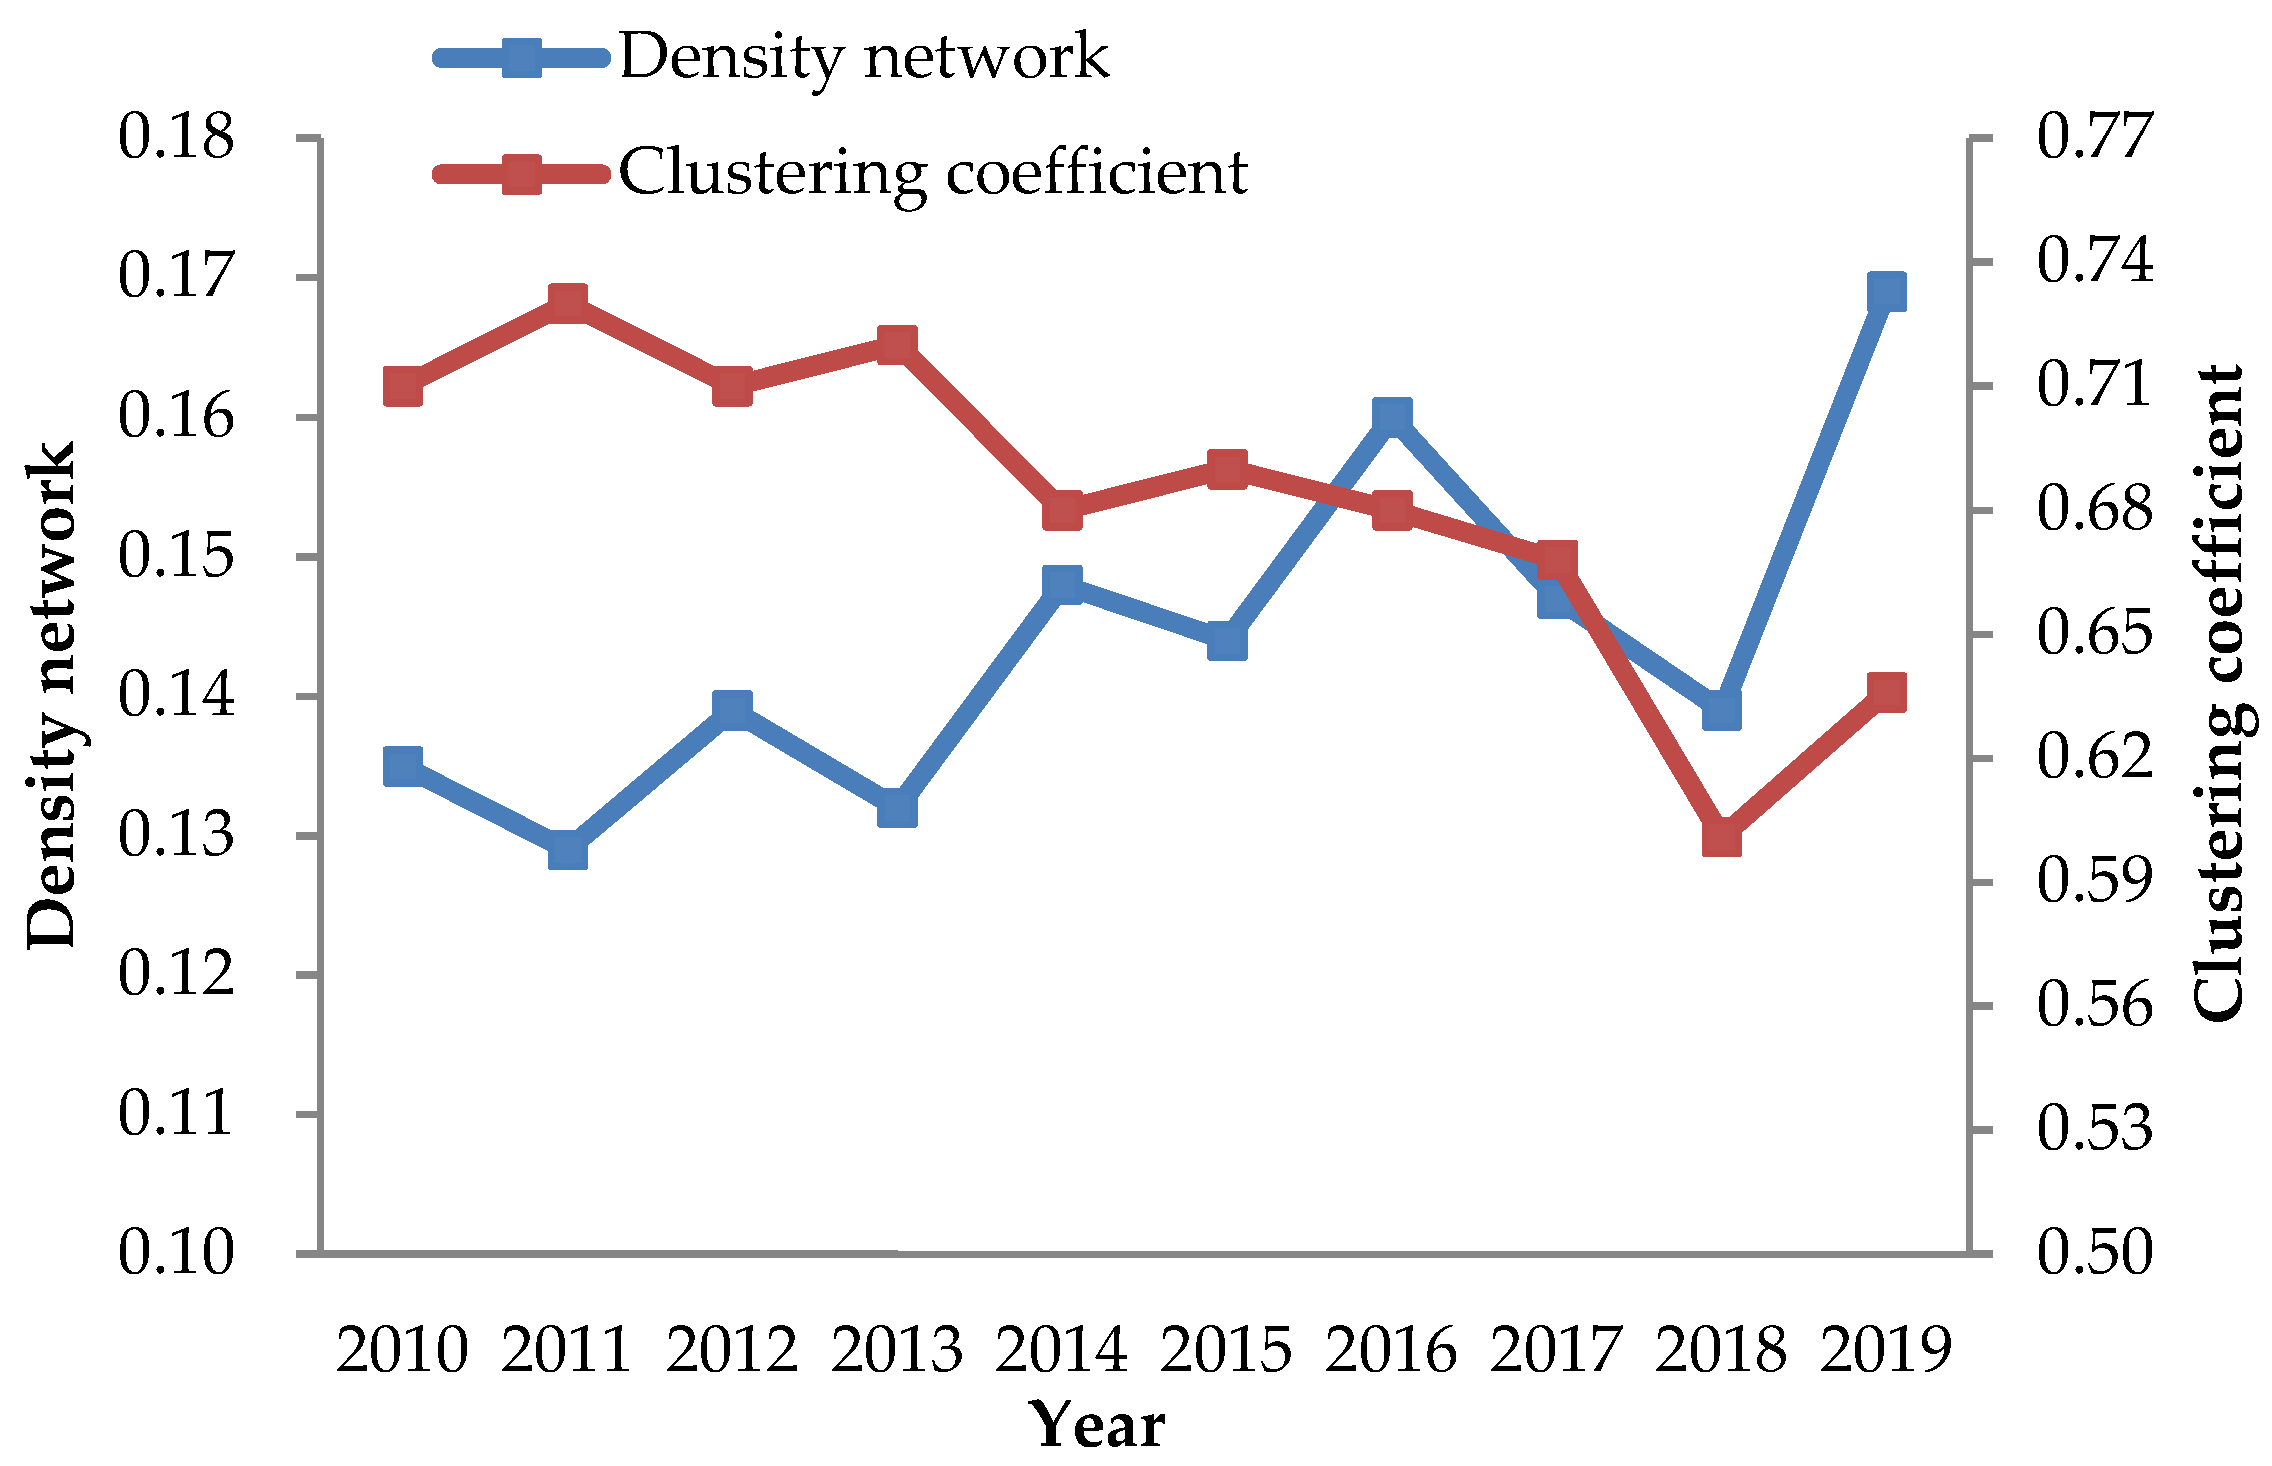
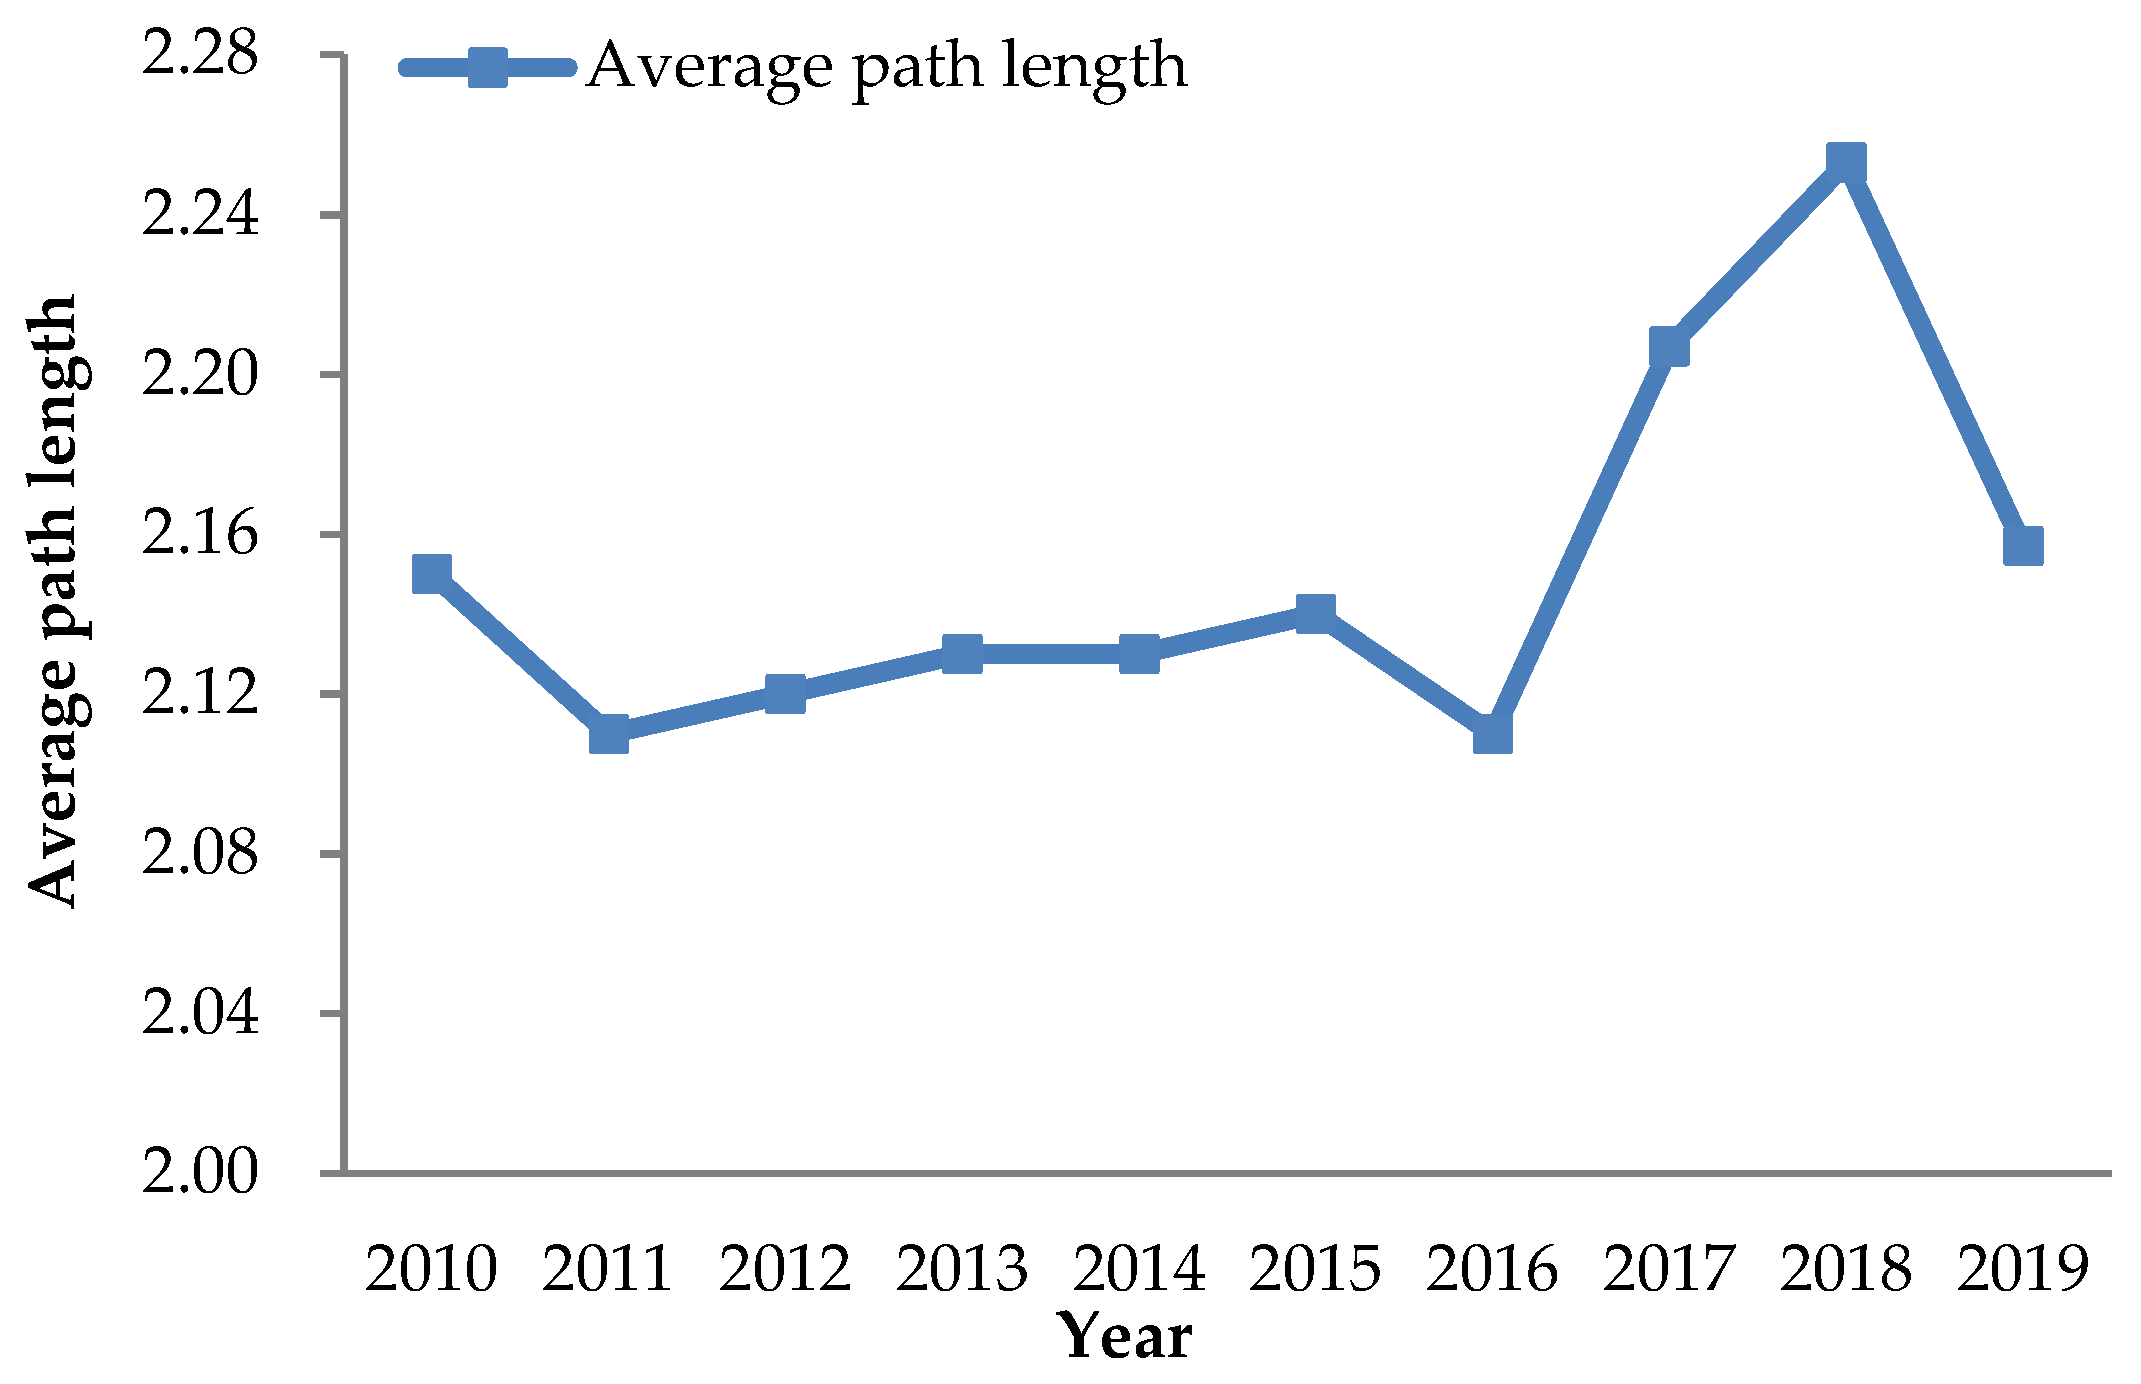
Figure 4 shows the variation trend of the network density and average clustering coefficient of CMATN. We found that in the past 10 years, the network density of CMATN has shown an overall fluctuating increasing trend, which is mainly due to the rapid growth in the number of routes (annual passenger traffic volume is more than 300,000). Especially from 2015 to 2019, the number of flight routes increased by an average of 30 routes per year, which again proves that the scale of the CMATN network is expanding. From 2010 to 2019, the average clustering coefficient of CMATN showed a decreasing trend. In addition, the average path length of CMATN showed a slight increasing trend (Figure 5) because certain cities in CMATN are connected to only one regional hub. Overall, there is room for improvement in connectivity between the node cities in CMATN, and the average transfer times in CMATN have not decreased. Combined with the change of CMATN, shown in Figure 3, we found that CMATN appears to be developing in the direction of building a more efficient local-hub-and-spoke network system, and the links between local hub cities are continuously being strengthened.
3.1.3. Centrality Analysis of Node Cities
To further explore the relationship between CMATN node cities and the pandemic transmission, we analyzed the normalized degree, closeness, and betweenness centralities of node cities. Table 3 lists the top 20 cities for 2010 and 2019.
In terms of normalized degree centrality, Beijing, Shanghai, and Guangzhou are ranked the top three cities. However, there is a declining trend, which indicates that despite Beijing, Shanghai, and Guangzhou’s relatively strong control over air transport networks, their control is gradually declining. In contrast, by comparing the normalized degree centrality of 17 cities in 2010 to 2019, we found that the overall trend is increasing, indicating that the number of flight routes in CMATN is rapidly growing and the links between cities are enhanced. The strengthening of inter-city links is bound to promote the spread of pandemics, and the risk of infection in node cities in CMATN will also increase. This is discussed in detail in the econometric model.
In terms of normalized closeness centrality, the fluctuations in the top 10 cities were negligible with the exceptions of Zhengzhou and Chongqing, which increased significantly, and Shenzhen, which decreased significantly. However, the ranking of the bottom 10 cities fluctuated greatly. Overall, except for Beijing, Shanghai, and Shenzhen, the normalized closeness centrality of other node cities has shown a clear increasing trend. Therefore, after ten years of development of CMATN, the average shortest distance from many large cities to other cities has declined, which indicates that the accessibility between these large cities has improved.
In terms of normalized betweenness centrality, the changing trends of different cities vary. The normalized betweenness centrality of cities such as Beijing, Shanghai, Guangzhou, and Chengdu show a significant decreasing trend. However, overall, the normalized betweenness centrality was significantly improved in 80% of CMATN node cities, such as Kunming, Urumqi, and Hohhot. The main reason for this phenomenon is that the number of node cities and routes in CMATN is increasing, and the transit or connection function in CMATN is no longer completely dependent on core node cities such as Beijing, Shanghai, and Guangzhou. For example, Urumqi developed into a hub, with Korla, Hotan, Kashgar, Aksu, and Yining as its spokes due to the rapid development of tourism, and the normalized betweenness centrality of Urumqi has significantly improved. Overall, an increasing number of cities in CMATN are expanding to become important nodes of passenger links between other cities.
3.2. COVID-19 Spatial Distribution Analysis
The transportation network, as an important carrier of population mobility and social and economic activities, directly affects spatial factors and may have an extremely important impact on the spatial distribution of COVID-19. The development of the air transport network promotes traffic accessibility, thereby strengthening the spatial correlation of different regions. This causes the spatial distribution of pandemics to be closely related to the air transport network. To observe the spatial distribution of the pandemic more intuitively, we created a spatial distribution map of COVID-19 cumulative confirmed cases (Figure 6).
The number of COVID-19 confirmed cases is concentrated in the central and eastern regions of China, showing a certain spatial clustering characteristic (Figure 6). Specifically, it mainly includes densely populated areas such as the urban agglomeration in the middle reaches of the Yangtze River, the Beijing–Tianjin–Hebei urban agglomeration, the Pearl River Delta urban agglomeration, and the Hong Kong–Zhuhai–Macao Greater Bay Area, which have close social and economic ties and relatively developed air transport networks. Among them, Wuhan City, Hubei Province, as the initial point of the outbreak, caused the pandemic in Hubei Province to be the most serious. The cumulative confirmed cases of COVID-19 in Wuhan account for more than 80% of the country’s cases, and diffusion from Wuhan to the surrounding areas can be seen. In addition to Hubei Province, among the 20 cities in China with the highest number of confirmed cases, 75% of the cities are CMATN node cities. For example, the number of COVID-19 confirmed cases in Urumqi, Beijing, Chongqing, Wenzhou, Shenzhen, Guangzhou, and Shanghai is more than 300, which confirms that the pandemic and air transport network are inextricably linked. In cities other than Hubei Province, Urumqi ranked first with a cumulative number of 850 confirmed cases. We believe that this is related to the significantly improving normalized betweenness centrality which is caused by the rapid development of tourism in Urumqi.
3.3. Analysis of the Relationship between CMATN and COVID-19
3.3.1. Scatter Plot Analysis of Urban Centrality and Status of the Pandemic
To further analyze the relationship between the pandemic and CMATN, we selected data on the centrality indicators of CMATN node cities, number of confirmed cases, duration of the pandemic, change in passenger transport, and number of aircraft take-offs and landings. Centrality indicators include normalized degree, closeness, and betweenness centralities. Normalized degree centrality is the most direct indicator to describe node centrality in network analysis, and these three indicators are highly correlated. Therefore, we consider normalized degree centrality as the representative for our analysis. In addition, the cities selected in this study are CMATN node cities, which are representatives in China’s civil aviation passenger transport network.
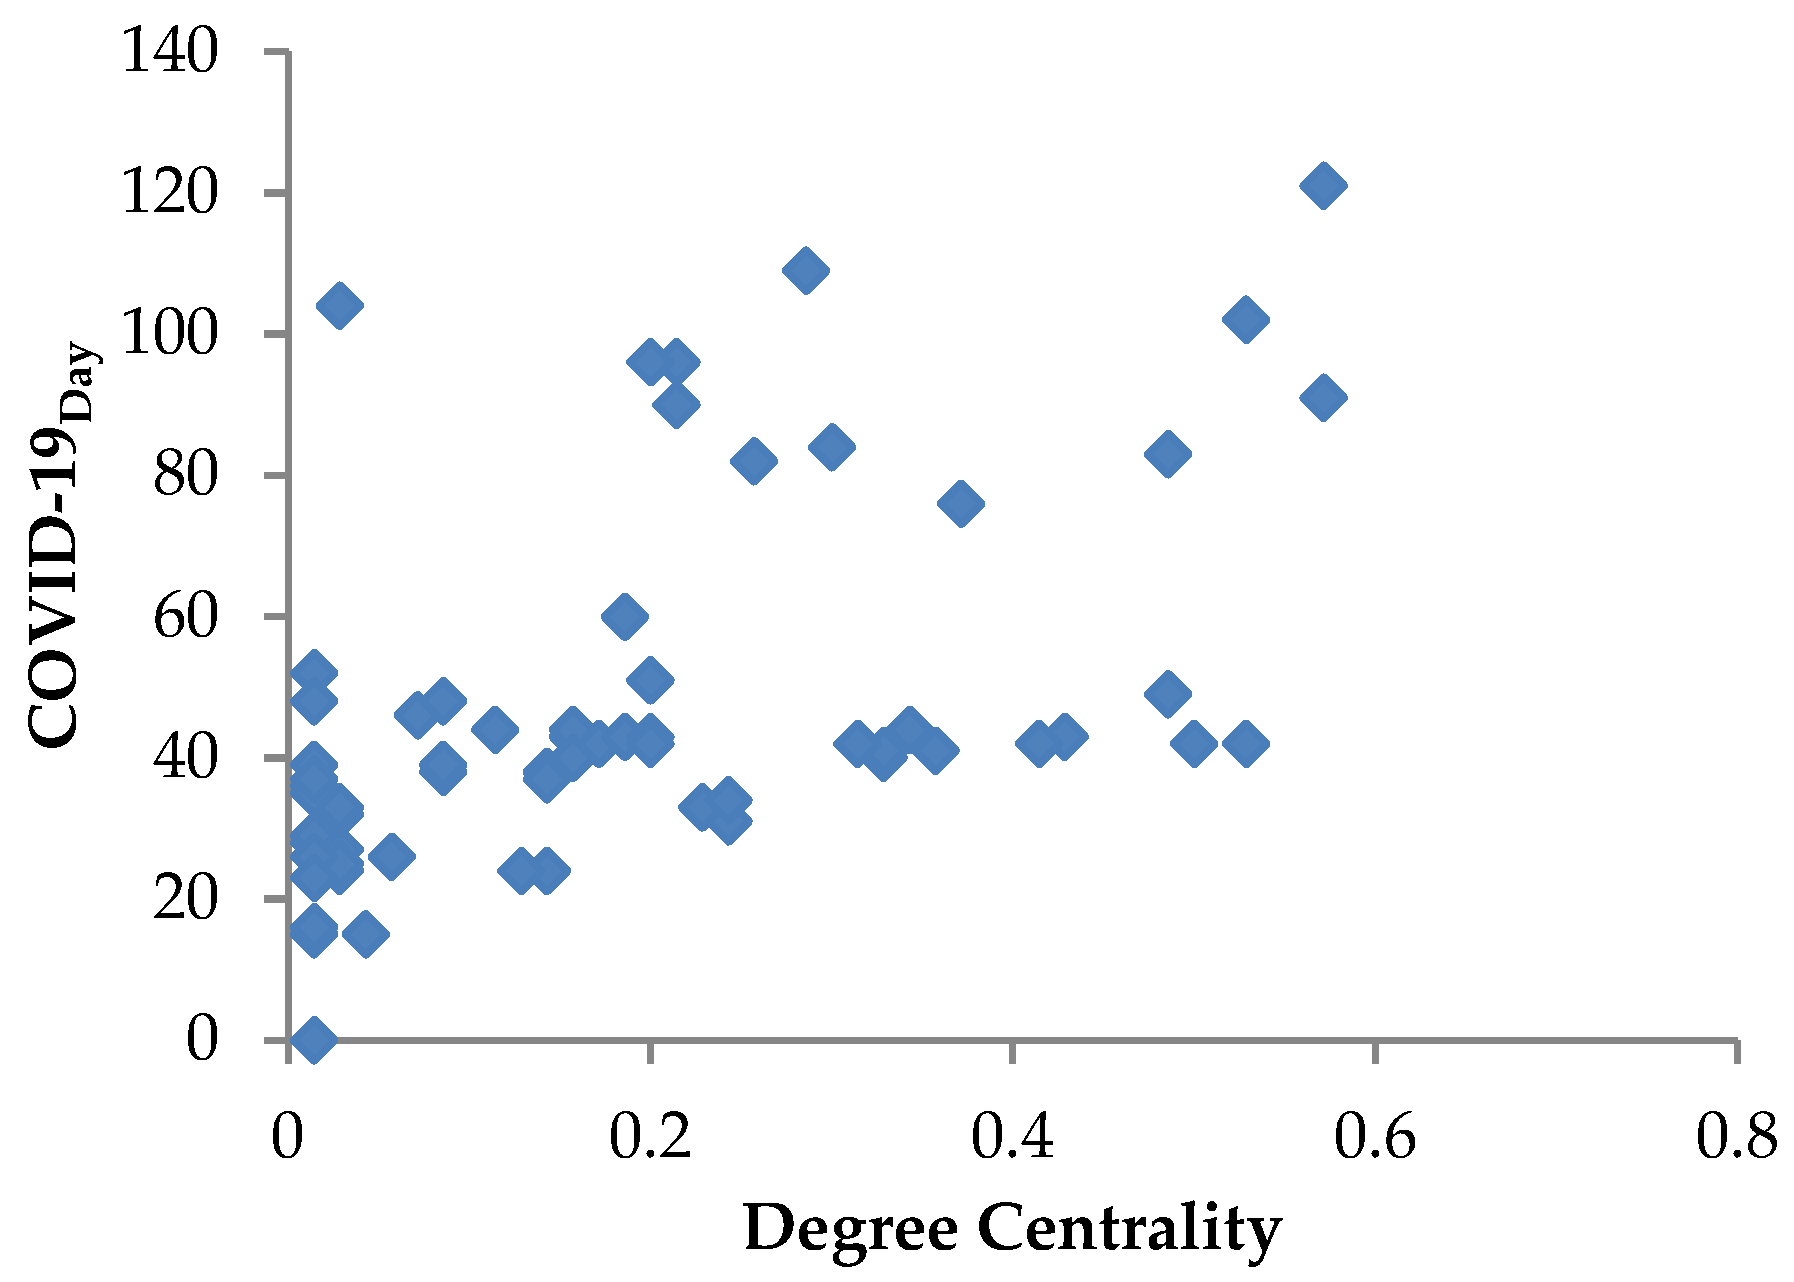
The greater the city’s normalized degree centrality, the closer the city’s traffic links to other cities in the air transport network, which means that these cities’ populations are more likely to incur infections during a pandemic. Overall, there is a relatively obvious positive correlation between the normalized degree centrality of the city, the cumulative number of confirmed cases and duration of COVID-19 (Figure 7 and Figure 8). In addition, we used the city’s normalized degree centrality value of 0.2 as the dividing point for our specific analysis. In the cities with a normalized degree centrality between 0 and 0.2, the proportion of cities with fewer than 100 COVID-19 confirmed cases reached 87.5%, and the proportion of cities where the pandemic lasted for fewer than 40 days reached 70%. In cities with a normalized degree centrality greater than 0.2, more than 100 people were infected in 51.85% of the cities, and the duration of the pandemic exceeded 40 days in 85.19% of the cities. In other words, the risk of urban infection with a low normalized degree centrality is relatively low, and the risk of urban infection with a high normalized degree centrality is relatively high. There is a significant positive correlation between the two.
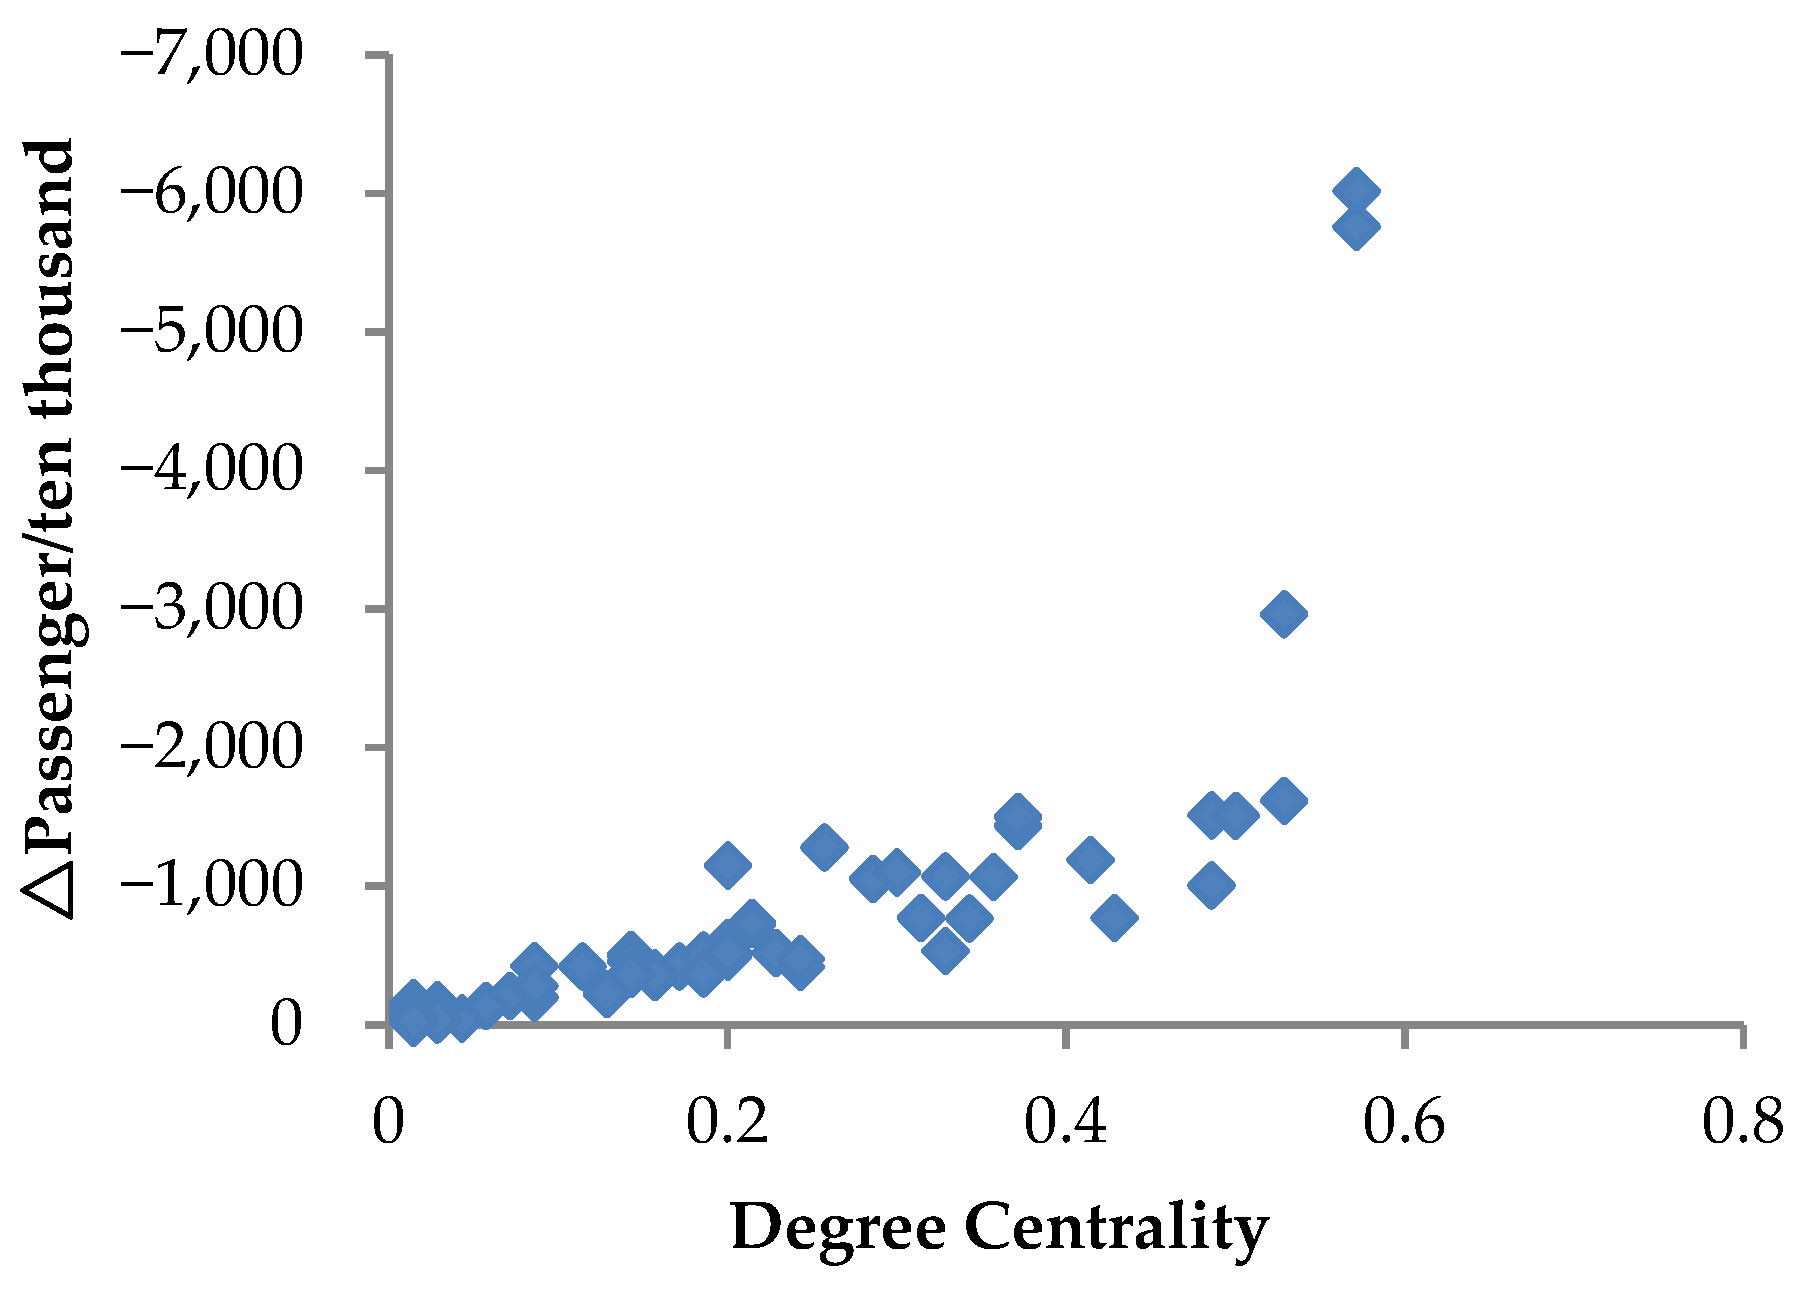
The COVID-19 pandemic severely impacted China’s air transport market, and the supply capacity of air transport across the country substantially declined. Figure 9 and Figure 10 show that for CMATN node cities, normalized centrality has a significant positive correlation with the decline in passenger transport and the decline in aircraft take-offs and landings. This is because there is a positive correlation between the normalized centrality and the severity of the pandemic, and the pandemic was the main factor causing the decline in the supply capacity of air transport in China. Among these cities, Beijing and Shanghai have the most obvious decline in passenger traffic and aircraft take-offs and landings. Specifically, 57.6 million passengers and 224,286 aircraft traveled to and from Beijing, and 60.15 million passengers and 239,692 aircraft traveled to and from Shanghai. Because these two cities are the core node cities in CMATN, their normalized degree, closeness, and betweenness centralities are ranked in the top three among the cities.
3.3.2. Analysis of Regression Results of the Econometric Model
To further analyze the communication relationship between the air transport network and COVID-19, we constructed an econometric model and used the ordinary least squares and robust standard deviation methods for our regression analysis. We used the centrality index to describe the development of civil aviation in node cities, and the duration of the pandemic represents the city’s pandemic status.
Table 4 shows the regression results of Equation (7) between the centrality of node cities and the duration of the COVID-19 pandemic. In Equation (7), 426 observations were used to regress the goodness-of-fit R2, which is the degree of fit of the model to the sample, and the results are between 0.265 and 0.292. According to the regression results, it can be seen that the coefficients of normalized degree, closeness, and betweenness centralities are all significantly positive whether the GDP, population, or dummy variables are added to the control variables, which indicates that the centrality of the node city has a significant impact on the continuation of the pandemic. In sum, the higher the centrality of the node city, the more important its position in the civil aviation network, the closer the traffic connection with other cities, and the greater the risk of being infected by the pandemic. This is consistent with the conclusion drawn in Figure 7 and Figure 8.
The coefficient of the dummy variable Connect is also positive, indicating that if the city is directly connected to Wuhan by flights, the pandemic will last longer. In addition, the correlation analysis between dummy variables and the number of confirmed cases shows that cities with direct flights to Wuhan have more confirmed cases. The reason is that during the early outbreak, when preventative measures were not in place, it was easier for these cities to receive infected people, and the risk of transmissions was higher. The per capita GDP and population density of socio-economic factors also have a significantly positive impact on the duration of the pandemic, that is, the pandemic mostly occurs in cities with high socio-economic developments and dense populations, which is consistent with the conclusion shown in Figure 6.
Table 5 shows the regression results of flight route data and the pandemic’s duration, namely the regression results of Equation (8). These results show that the number of flights and passenger traffic have a significant positive impact on the duration of the pandemic, which reflects that a city’s air transport network being more developed results in a greater number of flights and passenger volumes and consequently a more serious spread of infections. The reason is that the development of an air transport network will improve traffic accessibility, and the spatial correlation of different cities will be strengthened, thus promoting the spread of the pandemic. For example, in the node cities corresponding to the top ten routes of domestic passenger traffic in 2019, the number of confirmed cases in Beijing, Shanghai, Guangzhou, Chongqing, and Shenzhen was more than 300, and the number of confirmed cases in Chengdu and Xi’an was more than 100. Moreover, the duration of the pandemic in these seven cities was more than 40 days, indicating that these cities suffered serious effects from the pandemic in 2020.
4. Discussion and Conclusions
Based on China’s data of COVID-19 in 2020, CMATN route data in 2010 to 2019, and socio-economic data, this study analyzed the relationship between the air transport network and COVID-19 through the complex network analysis method and econometric model. The following conclusions are drawn:
- CMATN developed rapidly from 2010 to 2019, and the network scale expanded. The number of node cities and routes with annual passenger volumes of more than 300,000 increased significantly. In terms of spatial location, it is mainly located in the economically developed and densely populated central and eastern regions of China. The network density of CMATN shows an overall fluctuating increasing trend, whereas the average clustering coefficient shows a gentle decreasing trend, and the average path length shows a slight increasing trend, indicating that CMATN is developing towards the construction of a more efficient local hub-and-spoke network system, and the links between local hub cities are continuously strengthened. In addition, the development of CMATN shows the characteristics of changing from a small number of major node cities to multi-cities. The network structure is more complex, and the local hub-and-spoke network is close to perfect.
- The COVID-19 pandemic was mainly concentrated in the densely populated, developed cities of the air transport network that have close socio-economies ties in central and eastern China, and in node cities of the local hub-and-spoke network. This shows certain spatial clustering characteristics. The pandemic was the most serious in Wuhan in the Hubei province, as the initial point of the outbreak, and a Wuhan-centered spread to the surrounding areas was observed. Outside Hubei Province, there was a multi-point to comprehensive diffusion, and most of the CMATN node cities had outbreaks except for Dunhuang. In this regard, many node cities in CMATN should pay more attention to the prevention and control of the pandemic in the post-pandemic era. City managers should formulate appropriate pandemic prevention standards and requirements for the status of cities in the air transport network to resist the risk of pandemic transmission by air transport.
- There is a significant positive correlation between the normalized degree centrality of cities and the number of COVID-19 confirmed cases and the duration of the pandemic. A higher normalized degree centrality of the node city results in a closer connection between the node city and all other node cities in CMATN. Therefore, compared to other cities, the risk of pandemic transmission is more serious. In addition, although the normalized degree, closeness, and betweenness centralities are highly correlated, their impacts on the pandemic vary, among which the normalized betweenness centrality has the greatest impact on the pandemic.
- A city’s normalized centrality has a significant positive correlation with a decline in passenger transport and aircraft take-offs and landings. In 2020, the pandemic seriously damaged the domestic air transport business. Strict personnel flow restriction measures and aviation control policies greatly reduced the elastic demand for civil aviation, and the rigid demand also significantly decreased. Accordingly, the greater the normalized centrality is, the more obvious the decline in passenger transport and aircraft take-offs and landings is due to the positive correlation between cities’ normalized centrality and the pandemic. In addition, cities with dense populations, high socio-economic levels, and developed air transport networks are still the main markets for the air transport industry, although the continuous spread and frequent occurrence of pandemics in the region will lead to substantial declines in passenger traffic. With the gradual recovery of the social economy and the relaxation of control measures, airlines should seize the opportunity to formulate business strategies for major passenger markets, and recover from the trauma caused by the COVID-19 pandemic as soon as possible by adjusting fares and flight frequency.
- Economic factors such as GDP and population have a significantly positive impact on the pandemic, that is, the pandemic occurs frequently in cities with high levels of socio-economic development and dense populations. Economic factors such as GDP and population are the main factors affecting the development of air transport networks. With higher levels of economic development and denser populations, cities have more developed civil aviation and their spatial connections with other cities are closer; thus, the risk of pandemic transmission is greater.
Due to the unpublished flight route passenger volume data for 2020, we cannot further analyze the impact of the pandemic on passenger volume changes. However, CMATN is the busiest passenger transport network and is composed of routes with an annual passenger volume of more than 300,000. It has a certain reference value and strong credibility for the study of the relationship between traffic networks and pandemic transmission. In addition, we propose some avenues for future research. In the post-pandemic era, the prevention and control of pandemics should be paid more attention to in accuracy and timeliness, and the prediction requirements for the risk of pandemic transmission in different cities should be more accurate. The establishment of a pandemic transmission model based on complex networks can better predict the pandemic transmission risk in a certain area, which has a certain reference value for urban managers to allocate medical resources and make emergency plans. At the same time, targeted pandemic prevention and control measures can effectively avoid the excessive waste of medical resources, which is of great significance in routine pandemic prevention and control.
Author Contributions
Conceptualization, M.S. and Y.J.; methodology, B.H.; software, Z.Z. and Z.L.; validation, M.S., B.H. and Y.J.; data curation, M.S.; writing—original draft preparation, B.H.; writing—review and editing, Y.J.; visualization, Z.Z. and Z.L. All authors have read and agreed to the published version of the manuscript.
Funding
This research received no external funding.
Institutional Review Board Statement
Not applicable.
Informed Consent Statement
Not applicable.
Data Availability Statement
Not applicable.
Conflicts of Interest
The authors declare no conflict of interest.
References
- Zhu, N.; Zhang, D.; Wang, W.; Li, X.; Yang, B.; Song, J.; Zhao, X.; Huang, B.; Shi, W.; Lu, R.; et al. A Novel Coronavirus from Patients with Pneumonia in China, 2019. N. Engl. J. Med. 2020, 382, 727–733. [Google Scholar] [CrossRef] [PubMed]
- Chinazzi, M.; Davis, J.T.; Ajelli, M.; Gioannini, C.; Litvinova, M.; Merler, S.; Pastore, Y.; Piontti, A.; Mu, K.; Rossi, L.; et al. The effect of travel restrictions on the spread of the 2019 novel coronavirus (COVID-19) outbreak. Science 2020, 368, 395–400. [Google Scholar] [CrossRef] [PubMed] [Green Version]
- Liu, Y.; Wang, Z.; Rader, B.; Li, B.; Wu, C.; Whittington, J.D.; Zheng, P.; Stenseth, N.C.; Bjornstad, O.N.; Brownstein, J.S.; et al. Associations between changes in population mobility in response to the COVID-19 pandemic and socioeconomic factors at the city level in China and country level worldwide: A retrospective, observational study. Lancet Digit. Health 2021, 3, e349–e359. [Google Scholar] [CrossRef]
- Pan, Y.; He, S.Y. Analyzing COVID-19’s impact on the travel mobility of various social groups in China’s Greater Bay Area via mobile phone big data. Transp. Res. Part A Policy Pract. 2022, 159, 263–281. [Google Scholar] [CrossRef]
- Suau-Sanchez, P.; Voltes-Dorta, A.; Cugueró-Escofet, N. An early assessment of the impact of COVID-19 on air transport: Just another crisis or the end of aviation as we know it? J. Transp. Geogr. 2020, 86, 102749. [Google Scholar] [CrossRef] [PubMed]
- Bulchand-Gidumal, J.; Melián-González, S. Post-COVID-19 behavior change in purchase of air tickets. Ann. Tour. Res. 2021, 87, 103129. [Google Scholar] [CrossRef]
- Serrano, F.; Kazda, A. The future of airports post COVID-19. J. Air. Transp. Manag. 2020, 89, 101900. [Google Scholar] [CrossRef]
- Piccinelli, S.; Moro, S.; Rita, P. Air-travelers’ concerns emerging from online comments during the COVID-19 outbreak. Tour. Manag. 2021, 85, 104313. [Google Scholar] [CrossRef]
- Hotle, S.; Mumbower, S. The impact of COVID-19 on domestic U.S. air travel operations and commercial airport service. Transp. Res. Interdiscip. Perspect. 2021, 9, 100277. [Google Scholar] [CrossRef]
- Sotomayor-Castillo, C.; Radford, K.; Li, C.; Nahidi, S.; Shaban, R.Z. Air travel in a COVID-19 world: Commercial airline passengers’ health concerns and attitudes towards infection prevention and disease control measures. Infect. Dis. Health 2021, 26, 110–117. [Google Scholar] [CrossRef]
- Monmousseau, P.; Marzuoli, A.; Feron, E.; Delahaye, D. Impact of COVID-19 on passengers and airlines from passenger measurements: Managing customer satisfaction while putting the US Air Transportation System to sleep. Transp. Res. Interdiscip. Perspect. 2020, 7, 100179. [Google Scholar] [CrossRef] [PubMed]
- Amankwah-Amoah, J.; Khan, Z.; Osabutey, E.L.C. COVID-19 and business renewal: Lessons and insights from the global airline industry. Int. Bus Rev. 2021, 30, 101802. [Google Scholar] [CrossRef]
- Amankwah-Amoah, J. Stepping up and stepping out of COVID-19: New challenges for environmental sustainability policies in the global airline industry. J. Clean. Prod. 2020, 271, 123000. [Google Scholar] [CrossRef] [PubMed]
- Sun, X.; Wandelt, S.; Zhang, A. On the degree of synchronization between air transport connectivity and COVID-19 cases at worldwide level. Transp. Policy 2021, 105, 115–123. [Google Scholar] [CrossRef]
- Hou, M.; Wang, K.; Yang, H. Hub airport slot Re-allocation and subsidy policy to speed up air traffic recovery amid COVID-19 pandemic—Case on the Chinese airline market. J. Air Transp. Manag. 2021, 93, 102047. [Google Scholar] [CrossRef]
- Fu, X.; Lei, Z.; Wang, K.; Yan, J. Low cost carrier competition and route entry in an emerging but regulated aviation market–The case of China. Transp. Res. Part A Policy Pract. 2015, 79, 3–16. [Google Scholar] [CrossRef] [Green Version]
- Mu, X.; Yeh, A.; Zhang, X. The interplay of spatial spread of COVID-19 and human mobility in the urban system of China during the Chinese New Year. Environ. Plan. B Urban Anal. City Sci. 2020, 48, 1955–1971. [Google Scholar] [CrossRef]
- Sun, X.; Wandelt, S.; Zhang, A. How did COVID-19 impact air transportation? A first peek through the lens of complex networks. J. Air Transp. Manag. 2020, 89, 101928. [Google Scholar] [CrossRef]
- Zhang, Y.; Zhang, A.; Wang, J. Exploring the roles of high-speed train, air and coach services in the spread of COVID-19 in China. Transp. Policy 2020, 94, 34–42. [Google Scholar] [CrossRef]
- Christidis, P.; Christodoulou, A. ThePredictiveCapacityofAirTravelPatternsduringtheGlobalSpreadoftheCOVID-19Pandemic: Risk, Uncertainty and Randomness. Int. J. Environ. Res. Public Health 2020, 17, 3356. [Google Scholar] [CrossRef]
- Zhao, S.; Zhuang, Z.; Ran, J.; Lin, J.; Yang, G.; Yang, L.; He, D. The association between domestic train transportation and novel coronavirus (2019-nCoV) outbreak in China from 2019 to 2020: A data-driven correlational report. Travel. Med. Infect. Dis. 2020, 33, 101568. [Google Scholar] [CrossRef] [PubMed]
- Colizza, V.; Barrat, A.; Barthelemy, M.; Vespignani, A. The role of the air line transport at ion network in the prediction and predictability of global epidemics. Proc. Natl. Acad. Sci. USA 2006, 103, 2015–2020. [Google Scholar] [CrossRef] [PubMed] [Green Version]
- Kraemer, M.U.G.; Yang, C.; Gutierrez, B.; Wu, C.; Klein, B.; Pigott, D.M.; du Plessis, L.; Faria, N.R.; Li, R.; Hanage, W.P.; et al. The effect of human mobility and control measures on the COVID-19 epidemic in China. Science 2020, 368, 493–497. [Google Scholar] [CrossRef] [Green Version]
- Zhang, L.; Yang, H.; Wang, K.; Zhan, Y.; Bian, L. Measuring imported case risk of COVID-19 from inbound international flights—A case study on China. J. Air Transp. Manag. 2020, 89, 101918. [Google Scholar] [CrossRef]
- Lamb, T.L.; Ruskin, K.J.; Rice, S.; Khorassani, L.; Winter, S.R.; Truong, D. A qualitative analysis of social and emotional perspectives of airline passengers during the COVID-19 pandemic. J. Air Transp. Manag. 2021, 94, 102079. [Google Scholar] [CrossRef]
- Fang, D.C.; Sun, M.Y.; Business, S.O. The Reconstruction of the Spatial Structure of the Yangtze River Delta City Group in the High-speed Rail Era—Based on the Social Network Analysis. Econ. Geogr. 2015, 35, 50–56. [Google Scholar]
- Jiao, J.; Wang, J.; Jin, F. Impacts of high-speed rail lines on the city network in China. J. Transp. Geogr. 2017, 60, 257–266. [Google Scholar] [CrossRef]
- Jiang, X.; Wen, X.; Wu, M.; Song, M.; Tu, C. A complex network analysis approach for identifying air traffic congestion based on independent component analysis. Phys. A Stat. Mech. Its Appl. 2019, 523, 364–381. [Google Scholar] [CrossRef]
- Wang, H.; Wen, R.; Zhao, Y. Analysis of topological characteristics in air traffic situation networks. Proc. Inst. Mech. Eng. Part G J. Aerosp. Eng. 2015, 229, 419–425. [Google Scholar]
- Lin, J. Network analysis of China’s aviation system, statistical and spatial structure. J. Transp. Geogr. 2012, 22, 109–117. [Google Scholar] [CrossRef]
- Lei, Z.; O Connell, J.F. The evolving landscape of Chinese aviation policies and impact of a deregulating environment on Chinese carriers. J. Transp. Geogr. 2011, 19, 829–839. [Google Scholar] [CrossRef]
- Du, W.; Liang, B.; Hong, C.; Lordan, O. Analysis of the Chinese provincial air transportation network. Phys. A Stat. Mech. Its Appl. 2017, 465, 579–586. [Google Scholar] [CrossRef] [Green Version]
- Zhang, J.; Cao, X.; Du, W.; Cai, K. Evolution of Chinese airport network. Phys. A Stat. Mech. Its Appl. 2010, 389, 3922–3931. [Google Scholar] [CrossRef] [PubMed]
- ZENG, X.; TANG, X.; JIANG, K. Empirical Study of Chinese Airline Network Structure Based on Complex Network Theory. J. Transp. Syst. Eng. Inf. Technol. 2011, 11, 175–181. [Google Scholar] [CrossRef]
- Bombelli, A.; Santos, B.F.; Tavasszy, L. Analysis of the air cargo transport network using a complex network theory perspective. Transp. Res. Part E Logist. Transp. Rev. 2020, 138, 101959. [Google Scholar] [CrossRef]
- Du, W.; Zhou, X.; Lordan, O.; Wang, Z.; Zhao, C.; Zhu, Y. Analysis of the Chinese Airline Network as multi-layer networks. Transp. Res. Part E Logist. Transp. Rev. 2016, 89, 108–116. [Google Scholar] [CrossRef] [Green Version]
- Boorman, S.A.; White, H.C. Social Structure from Multiple Networks. II. Role Structures. Am. J. Sociol. 1976, 81, 1384–1446. [Google Scholar] [CrossRef]
- Bagler, G. Analysis of the airport network of India as a complex weighted network. Phys. A Stat. Mech. Its Appl. 2008, 387, 2972–2980. [Google Scholar] [CrossRef] [Green Version]
- Kim, S.; Yoon, Y. On node criticality of the Northeast Asian air route network. J. Air Transp. Manag. 2019, 80, 101693. [Google Scholar] [CrossRef]
- Deng, Y.; Zhang, Y.; Wang, K. An analysis of the Chinese scheduled freighter network during the first year of the COVID-19 pandemic. J. Transp. Geogr. 2022, 99, 103298. [Google Scholar] [CrossRef]
- Bhadra, D.; Kee, J. Structure and dynamics of the core US air travel markets: A basic empirical analysis of domestic passenger demand. J. Air Transp. Manag. 2008, 14, 27–39. [Google Scholar] [CrossRef] [PubMed]
- Zhang, Q.; Yang, H.; Wang, Q. Impact of high-speed rail on China’s Big Three airlines. Transp. Res. Part A Policy Pract. 2017, 98, 77–85. [Google Scholar] [CrossRef]
- Su, M.; Luan, W.; Li, Z.; Wan, S.; Zhang, Z. Evolution and Determinants of an Air Transport Network: A Case Study of the Chinese Main Air Transport Network. Sustainability 2019, 11, 3933. [Google Scholar] [CrossRef] [Green Version]
Figure 1.
Number of node cities and main route of Chinese main air transport network.

Figure 2.
Domestic and Chinese main air transport network passenger volumes.

Figure 3.
Chinese main air transport network’s structure in 2010 [43] and 2019.
Figure 3.
Chinese main air transport network’s structure in 2010 [43] and 2019.

Figure 4.
Chinese main air transport network’s network density and average clustering coefficient.

Figure 5.
Chinese main air transport network’s average path length.

Figure 6.
COVID-19 spatial distribution map of cumulative confirmed cases in 2020.

Figure 7.
Normalized degree centrality and COVID-19 duration in days.

Figure 8.
Normalized degree centrality and COVID-19 confirmed cases.

Figure 9.
Normalized degree centrality and passenger volumes.

Figure 10.
Normalized degree centrality and aircraft movements changes.


Table 1.
Statistical description of relevant data.
| Variables | Obs | Mean | Std. Dev. | Min | Max |
|---|---|---|---|---|---|
| Flight Frequency 1 (2019) | 426 | 6.185 | 4.861 | 0.909 | 39.175 |
| Passengers 2 (2019) | 426 | 86.847 | 86.102 | 30.005 | 824.615 |
| People 3 (2019) | 67 | 703.145 | 655.799 | 55.89 | 3390 |
| GDP 4 (2019) | 67 | 7041.682 | 8041.824 | 385.503 | 38,053.67 |
| COVID-19 cases 5 (2020) | 67 | 863.582 | 6137.694 | 0 | 50,333 |
| COVID-19 days 6 (2020) | 67 | 46.478 | 26.346 | 0 | 121 |
1 Number of aircraft take-offs and landings in thousands, 2 number of passengers in units of ten thousand, 3 total population in units of ten thousand, 4 per billion yuan, 5 cumulative number of confirmed cases, 6 duration of the pandemic in days.
Table 2.
Variable descriptions.
| Variable | Description |
|---|---|
| n | Represents the number of node cities in CMATN. |
| m | Represents the number of routes in CMATN. |
| Represents the number of shortest path edges between any two nodes in CMATN. | |
| . | |
| in a network. | |
| . | |
| Represents the shortest distance from node city i to node city j. | |
| Represents the number of shortest paths between node city j and node city k. | |
| Represents the number of shortest paths between node city j and node city k through node city i. |
Table 3.
Top 20 cities in terms of centrality in 2010 and 2019.
| Rank | 2010 | 2019 | ||||||||||
|---|---|---|---|---|---|---|---|---|---|---|---|---|
| City | Value | City | Value | City | Value | City | Value | City | Value | City | Value | |
| 1 | Beijing | 0.695 | Beijing | 0.766 | Beijing | 0.282 | Beijing | 0.571 | Beijing | 0.700 | Kunming | 0.149 |
| 2 | Shanghai | 0.610 | Shanghai | 0.720 | Shanghai | 0.224 | Shanghai | 0.571 | Shanghai | 0.700 | Beijing | 0.139 |
| 3 | Guangzhou | 0.542 | Guangzhou | 0.686 | Guangzhou | 0.120 | Guangzhou | 0.529 | Guangzhou | 0.680 | Shanghai | 0.137 |
| 4 | Shenzhen | 0.424 | Chengdu | 0.615 | Chengdu | 0.119 | Xi’an | 0.529 | Xi’an | 0.673 | Urumqi | 0.121 |
| 5 | Chengdu | 0.390 | Shenzhen | 0.608 | Kunming | 0.116 | Kunming | 0.500 | Chengdu | 0.642 | Hohhot | 0.088 |
| 6 | Xi’an | 0.339 | Xi’an | 0.596 | Urumqi | 0.101 | Chongqing | 0.486 | Chongqing | 0.636 | Guangzhou | 0.084 |
| 7 | Changsha | 0.322 | Changsha | 0.578 | Xi’an | 0.065 | Chengdu | 0.486 | Kunming | 0.619 | Xi’an | 0.082 |
| 8 | Kunming | 0.322 | Kunming | 0.578 | Xiamen | 0.037 | Zhengzhou | 0.429 | Zhengzhou | 0.614 | Zhengzhou | 0.059 |
| 9 | Hangzhou | 0.305 | Chongqing | 0.567 | Shenzhen | 0.036 | Hangzhou | 0.414 | Wuhan | 0.598 | Chongqing | 0.040 |
| 10 | Chongqing | 0.288 | Hangzhou | 0.557 | Chongqing | 0.024 | Wuhan | 0.371 | Changsha | 0.593 | Wuhan | 0.040 |
| 11 | Nanjing | 0.237 | Wuhan | 0.546 | Changsha | 0.015 | Shenzhen | 0.371 | Hangzhou | 0.583 | Chengdu | 0.037 |
| 12 | Qingdao | 0.237 | Zhengzhou | 0.546 | Hangzhou | 0.011 | Nanjing | 0.357 | Nanjing | 0.579 | Guiyang | 0.037 |
| 13 | Xiamen | 0.220 | Nanjing | 0.536 | Nanjing | 0.009 | Changsha | 0.343 | Shenzhen | 0.565 | Lanzhou | 0.033 |
| 14 | Wuhan | 0.220 | Jinan | 0.536 | Qingdao | 0.008 | Xiamen | 0.329 | Xiamen | 0.560 | Xiamen | 0.026 |
| 15 | Jinan | 0.203 | Qingdao | 0.532 | Zhengzhou | 0.007 | Guiyang | 0.329 | Tianjin | 0.560 | Changsha | 0.023 |
| 16 | Zhengzhou | 0.186 | Urumqi | 0.532 | Wuhan | 0.004 | Haikou | 0.314 | Haikou | 0.556 | Hangzhou | 0.019 |
| 17 | Dalian | 0.186 | Xiamen | 0.527 | Dalian | 0.004 | Qingdao | 0.300 | Lanzhou | 0.551 | Nanjing | 0.015 |
| 18 | Urumqi | 0.186 | Guiyang | 0.518 | Jinan | 0.003 | Tianjin | 0.286 | Guiyang | 0.547 | Shenzhen | 0.010 |
| 19 | Sanya | 0.153 | Sanya | 0.504 | Shenyang | 0.001 | Urumqi | 0.257 | Qingdao | 0.547 | Tianjin | 0.007 |
| 20 | Guiyang | 0.136 | Qingdao | 0.496 | Harbin | 0.001 | Lanzhou | 0.243 | Urumqi | 0.530 | Haikou | 0.007 |
Table 4.
Regression results of Equation (7).
| COVID-19day | 7–1 | 7–2 | 7–3 | 7–4 | 7–5 | 7–6 |
|---|---|---|---|---|---|---|
| Degree Centrality | 0.86 *** (8.87) | 0.60 *** (6.32) | ||||
| Closeness Centrality | 1.82 *** (10.34) | 1.35 *** (7.75) | ||||
| Between Centrality | 1.86 (6.19) | 1.65 *** (6.21) | ||||
| Connect | 14.24 *** (5.19) | 13.81 *** (5.06) | 15.15 *** (5.59) | |||
| GDP_per | 1.20 *** (3.69) | 1.10 *** (3.45) | 1.37 *** (4.42) | |||
| Pop_density | 0.37 *** (3.47) | 0.37 *** (3.63) | 0.51 *** (5.04) | |||
| Constant | 31.40 *** (9.59) | −43.69 *** (−4.35) | 52.40 *** (36.93) | 20.76 *** (5.21) | −35.45 *** (−3.67) | 30.41 *** (9.03) |
| R-squared | 0.152 | 0.188 | 0.089 | 0.265 | 0.292 | 0.270 |
| Obs. | 426 | 426 | 426 | 426 | 426 | 426 |
*** Significant at 1%.
Table 5.
Regression results of Equation (8).
| COVID-19day | 8–1 | 8–2 | 8–3 | 8–4 |
|---|---|---|---|---|
| Flight | 1.40 *** (8.56) | 0.98 *** (5.47) | ||
| Passengers | 0.85 *** (9.98) | 0.63 *** (6.98) | ||
| Connect | 15.75 *** (5.88) | 16.11 *** (6.03) | ||
| GDP_per | 1.35 *** (3.96) | 1.33 *** (3.99) | ||
| Pop_density | 0.33 *** (2.94) | 0.30 *** (2.69) | ||
| Constant | 51.35 *** (38.78) | 52.64 *** (45.24) | 33.42 *** (9.84) | 34.56 *** (10.37) |
| R-squared | 0.126 | 0.144 | 0.253 | 0.268 |
| Obs. | 426 | 426 | 426 | 426 |
*** Significant at 1%.
Publisher’s Note: MDPI stays neutral with regard to jurisdictional claims in published maps and institutional affiliations. |
© 2022 by the authors. Licensee MDPI, Basel, Switzerland. This article is an open access article distributed under the terms and conditions of the Creative Commons Attribution (CC BY) license (https://creativecommons.org/licenses/by/4.0/).
Share and Cite
MDPI and ACS Style
Su, M.; Hu, B.; Jiang, Y.; Zhang, Z.; Li, Z. Relationship between the Chinese Main Air Transport Network and COVID-19 Pandemic Transmission. Mathematics 2022, 10, 2348. https://doi.org/10.3390/math10132348
AMA Style
Su M, Hu B, Jiang Y, Zhang Z, Li Z. Relationship between the Chinese Main Air Transport Network and COVID-19 Pandemic Transmission. Mathematics. 2022; 10(13):2348. https://doi.org/10.3390/math10132348
Chicago/Turabian StyleSu, Min, Baoyang Hu, Yipeng Jiang, Zhenchao Zhang, and Zeyang Li. 2022. "Relationship between the Chinese Main Air Transport Network and COVID-19 Pandemic Transmission" Mathematics 10, no. 13: 2348. https://doi.org/10.3390/math10132348
Note that from the first issue of 2016, this journal uses article numbers instead of page numbers. See further details here.