Communication

Evolution of SARS-CoV-2 Strains in Senegal: From a Wild Wuhan Strain to the Omicron Variant

by
Khadim Gueye
1,
Abdou Padane
1,2,*,
Cyrille Kouligueul Diédhiou
1,
Samba Ndiour
1,
Ndéye Diabou Diagne
1,
Aminata Mboup
1,
Moustapha Mbow
1,
Cheikh Ibrahima Lo
2,
Nafissatou Leye
1,
Aissatou Sow Ndoye
1,
Anna Julienne Selbé Ndiaye
1,
Seyni Ndiaye
1,
Gora Lo
1,
Djibril Wade
1,
Ambroise Ahouidi
1,
Papa Alassane Diaw
1,
Marièma Sarr
2,
Mamadou Beye
2,
Badara Cissé
1,
Cheikh Sokhna
2,3,
Makhtar Camara
1,
Ndéye Coumba Touré Kane
1 and
Souleymane Mboup
1
add Show full author list remove Hide full author list
1
Institut de Recherche en Santé, de Surveillance Épidémiologique et de Formation (IRESSEF), Dakar BP 7325, Senegal
2
Institut Hospitalo Universitaire Méditerranée Infection, 13 385 Marseille, France
3
IRD Institut de Recherche et de Développement, Dakar BP 1386, Senegal
*
Author to whom correspondence should be addressed.
COVID 2022, 2(8), 1116-1124; https://doi.org/10.3390/covid2080082
Submission received: 20 May 2022 / Revised: 5 July 2022 / Accepted: 11 July 2022 / Published: 9 August 2022
(This article belongs to the Special Issue The Genetic Diversity, Evolution and Epidemiology of SARS-CoV-2)

Abstract

:
The coronavirus disease 2019 (COVID-19) is a contagious disease caused by a new coronavirus called SARS-CoV-2. The first case was discovered in Wuhan, China, in December 2019, raising concerns about the emergence of a new coronavirus that poses a significant public health risk. The objective of this study, based on data collected and sequenced at the Institut de Recherche en Santé, de Surveillance Epidémiologique et de Formations (IRESSEF), is to characterize the pandemic evolution, establish a relationship between the different strains in each wave, and finally determine the phylodynamic evolution of the pandemic, utilizing microreact simulations. The study shows that SARS-CoV-2 strains have evolved over time and the variability of the virus is characterized by sequencing during each wave, as is its contagiousness (the speed at which it spreads). The pandemic has spread at a rate of 44.34 cases/week during the first wave. Twelve weeks later it has risen to 185.33 cases/week during the second wave. Twenty-three weeks into the pandemic, the numbers have reached 681.77 cases/week during the third wave. During the fourth wave, the rate of infection was found to decrease slightly at 646 cases/week between early December 2021 and mid-January 2022. Data collected during this study also provided us with a geographical distribution of COVID-19, indicating that the epidemic started in Dakar before spreading inland.

1. Introduction

Coronavirus 2019 (COVID-19) is a contagious disease caused by the coronavirus 2, which results in severe acute respiratory syndrome (SARS-CoV-2) [1,2]. The first case was detected in Wuhan, China, in December 2019, raising concerns about the advent of a novel coronavirus that poses a huge public health threat [3]. It has not only progressed since then, but it has also become a greater danger to the world economy. In West Africa, Senegal has the third highest number of COVID-19 positive cases and the second highest number of deaths, behind Nigeria [4]. Senegal, which reported its first case of COVID-19 on 2 March 2020 [5], is in the midst of the epidemic’s third phase, which is more severe than the previous two. SARS-CoV-2 is a virus that has undergone multiple mutations causing the pandemic to resurface. The virus’s high transmissibility from human to human has accelerated its spread across the globe, resulting in the formation of various variations such as B.1.1.7, B.1.351, P.1, B.1.427, and B.1.429 [6]. As a result, the number of positive cases, deaths, and hospitalized patients has increased around the world [7]. In Senegal, the origin of the epidemic is believed to be the capital Dakar, following the appearance of the first case and its diagnosis; however, there is very little data in the scientific literature on the evolution dynamics of COVID-19 in Senegal. During the first two waves of the epidemic in Senegal, only the Alpha variant form was documented [8]. The B.1.617.2 variant (Delta), which has been shown to be more transmissible [9], was predominantly potent during the third wave. On 24 November 2021, the Omicron (B.1.1.529) variant was detected for the first time in South Africa [10].
The objective of the present study is to understand and document the dynamics of the evolution of the COVID-19 pandemic in Senegal. Along with characterizing the evolution of each strain and their transmissibility over time, we established their relationships with each wave using phylodynamic propagation.

2. Material and Methods

2.1. Study Subject

In this study, we analysed genomic data from coronavirus disease 2019 (COVID-19) samples collected in Senegal between June 2020 and March 2022; these samples had high quality and large demographic and geographical coverage. A total of 1009 samples were collected between Thiès region (28.05%) (283/1009) and Dakar (71.95%) (726/1009). According to the established ARTIC protocol, they were sequenced using Oxford Nanopore technology at the IRESSEF genomic laboratory with the approval from the Senegalese Ministry of Health (000159/MSAS/CNERS/Sec, on 21 August 2020, allowing IRESSEF to carry out epidemiological surveillance of SARS-CoV-2 in Senegal).

2.2. Genome Sequencing and Analysis

2.2.1. RNA Extraction

The oropharyngeal and/or nasopharyngeal samples were first inactivated in a water bath at 90 °C for 30 min and then aliquoted in a 1.5 mL vial. RNA was then extracted and eluted in 50 μL using the Kingfisher’s platform according to the manufacturer’s guidelines (www.thermofisher.com; accessed on 22 January 2022). SARS-CoV-2 support and solutions KingFisher instruments and MagMAX isolation kit (Thermo Fisher Scientific, 168 Third Avenue, Waltham, MA États-Unis 02451, USA).

2.2.2. Reverse Transcriptase-Polymerase Chain Reaction

The RNA extracts were not diluted. The plates were stored at 4 °C during the preparation of the master mix. Allplex™ 2019-nCoV assays from Seegene Inc. (Seoul, Korea) were used according to the manufacturer protocol to perform RT-PCR. For a single reaction, 5 μL of 2019-nCoV MOM, 5 μL of buffer 5×, 5 μL of RNase-free water, 1 μL of internal control (IC), and 2 μL of enzymes were used. In each well, 18 μL of master mix was distributed and either 8 μL of sample, 8 μL of positive control, or 8 μL of RNase-free water was added for negative control. Plates were then spun down at 2500 rpm for 5 s and analysed on a CFX96 Touch Real-Time PCR from BioRad (Hercules, CA, USA); Reverse Transcription reaction using the following setting: 1 cycle: 50 °C/20 min–95 °C/15 min, PCR reaction 45 cycles: 94 °C/15 s–60 °C/30 s–72 °C/15 s. Fluorescence was measured at 60 °C and 72 °C using channels FAM (E gene), HEX (IC), Cal Red 610 (RdRP), and Quasar 670 (N gene). Results were compiled and analysed using 2019-nCoV viewer from Seegene Inc. according to the manufacturer’s instructions (Seegene. AllplexTM 2019-nCoV Assay) (Cat no. RP10250X/RP10252W).
Artic protocol from Oxford Nanopore was used to sequence the SARS-CoV-2 genome with native barcoding (EXP-NBD104, EXP-NBD114 and EXP-NBD196). RNA reverse transcriptase samples were performed using LunaScriopt RT or SuperMix kit. DNA obtained was then amplified by tiled PCR using separate primer pools. Primer pools were combined, purified, and quantified. DNA ends were prepared for adaptor attachments. Ligation native barcodes were supplied before ligation sequencing adapters. Priming Kit and DNA library were then loaded into the flow cell.

2.3. Data Analysis

The genome was assembled using the ARTIC pipeline bioinformatics workflow (https://artic.network/ncov-2019/ncov2019-bioinformatics-sop.html). We used the Nexclade website v1.13.2 (https://clades.nextstrain.org) to undertake a quality inspection of the sequencing as well as clade determinations of each sequence after assembly. The Pangolin web platform v3.1.20 (https://pangolin.cog-uk.io) was used to determine the lineage of each sequence.
The evolution of the different strains according to their collection date was carried out using the matplotlib package of Python version 3.9.7. The data was used to determine the most representative strain in each wave as shown in Figure 1. Identity by state (IBS) was used to establish the evolution between the different strains circulating in Senegal during the four SARS-CoV-2 epidemic waves (Figure 2). In addition, a Python script was used to calculate the IBS matrix between the strains of each wave. The visualization was done using the Seaborn library of Python version 3.9.7. The time signal approach was used to determine the dates of sample collection and sequencing to establish the phylodynamic evolution of SARS-CoV-2 over time. Maximum Likelihood (ML) inference in IQ-tree v2.0.3 was used to determine the best substitution model in the phylogenetic tree. Then, in TempEst v1.5.3, we used the IQ-tree file to obtain root-to-root regressions by selecting the best-fitting root. Selection were made based on the R2 correlation coefficient for optimization.
The speed of spread of the pandemic was calculated from statistical data on Senegal extracted from the WHO website. This data was then plotted using Matplotlib according to the following formula between the beginning of each wave and their peaks:
V = N C t i N C t j δ t i j             N C t = number   of   cases   at   time   t
We performed two simulations on phylodynamics to obtain the best results. To determine the origin and direction of the spread of the pandemic in Senegal, a simulation was performed on Microreact (https://microreact.org) using Mafft version 7.0 for multiple alignment, then IQ-tree version 2.0.3 to create the phylogenetic tree. Another simulation was done on nextstrain, but this time with Augur for the construction of the tree with a filter length of 27,000 base pairs, followed by a visualization and an auspice simulation (https://auspice.us). We used a neural network model to study the transmission network after determining the origin of the epidemic in Senegal using MicrobeTrace (https://microbetrace.cdc.gov/MicrobeTrace). To identify the sequences and determine the clusters, we extracted the timetree file (newick). The visualization was completed on MicrobeTrace.

3. Results

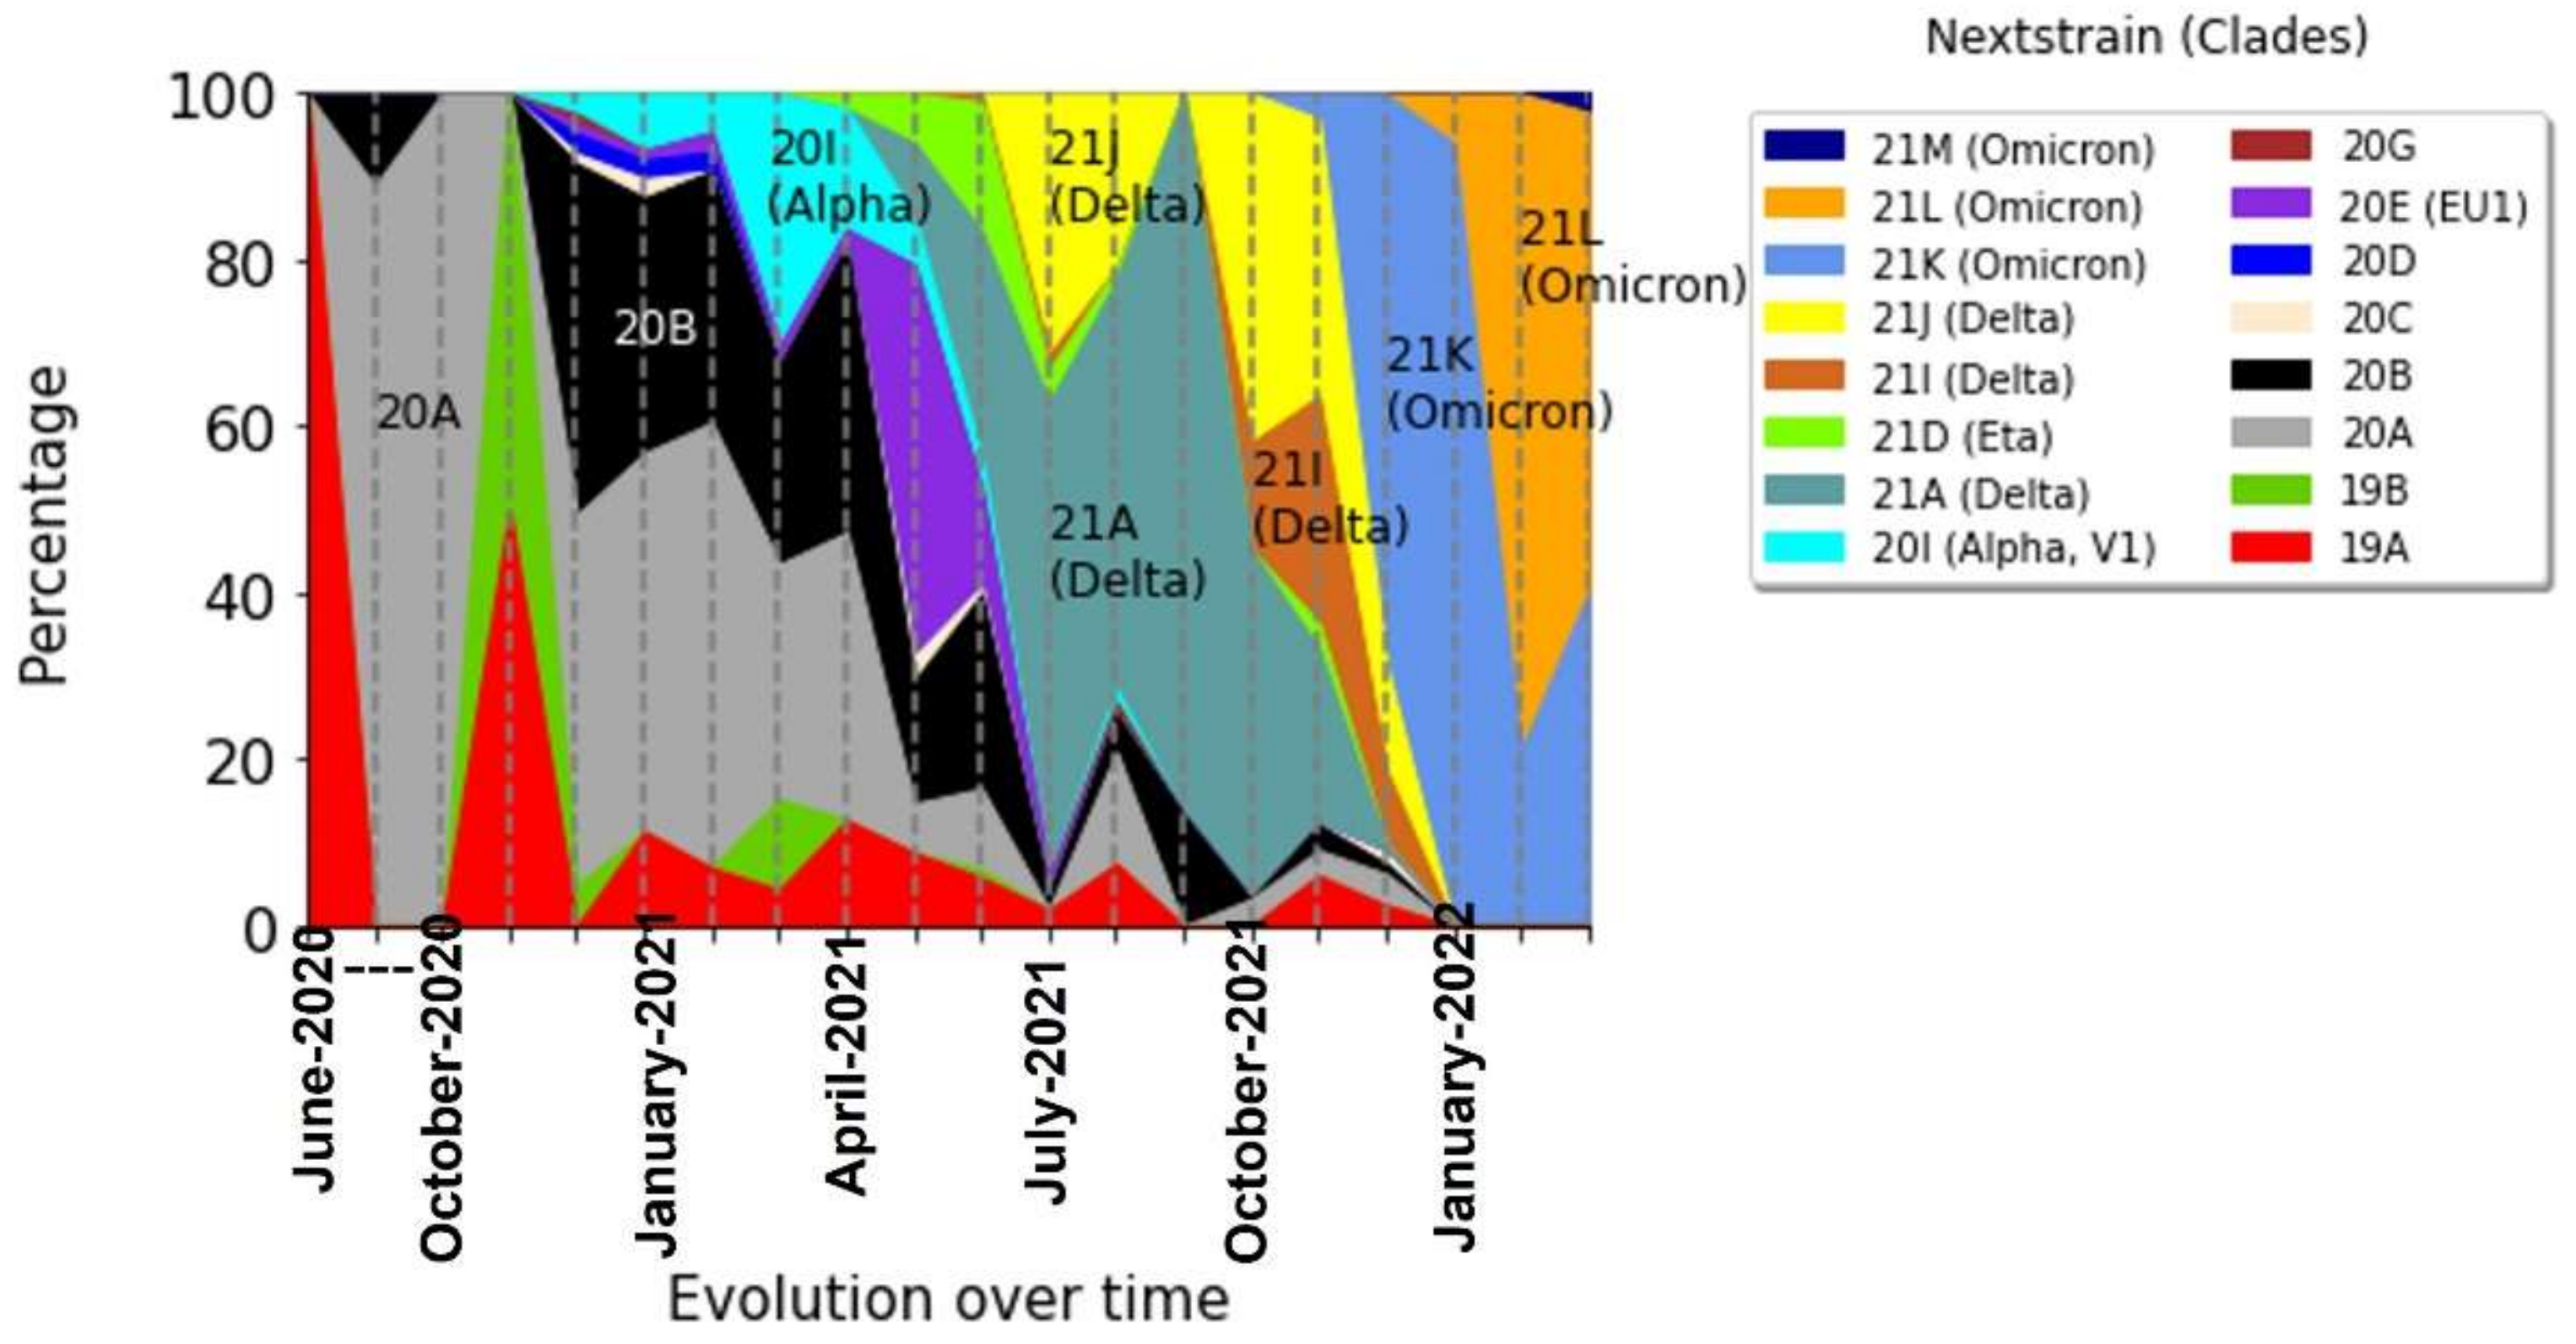
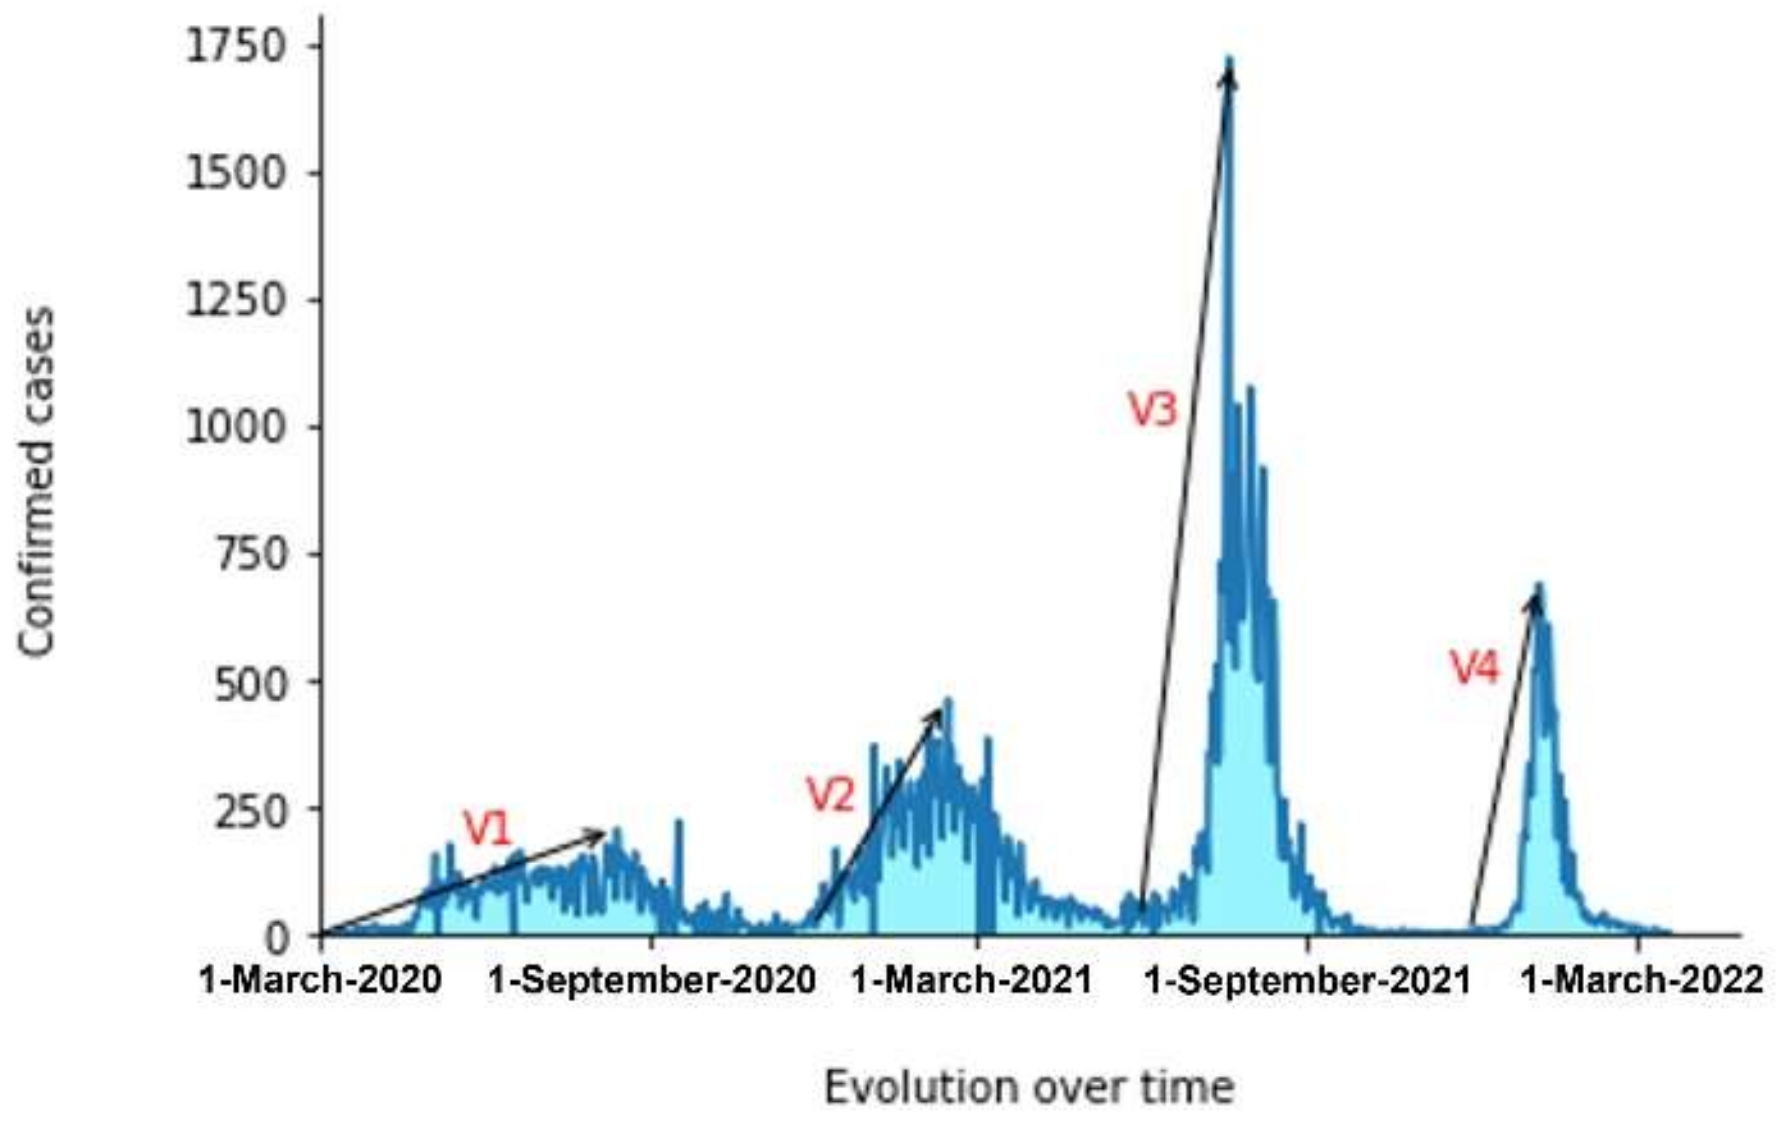
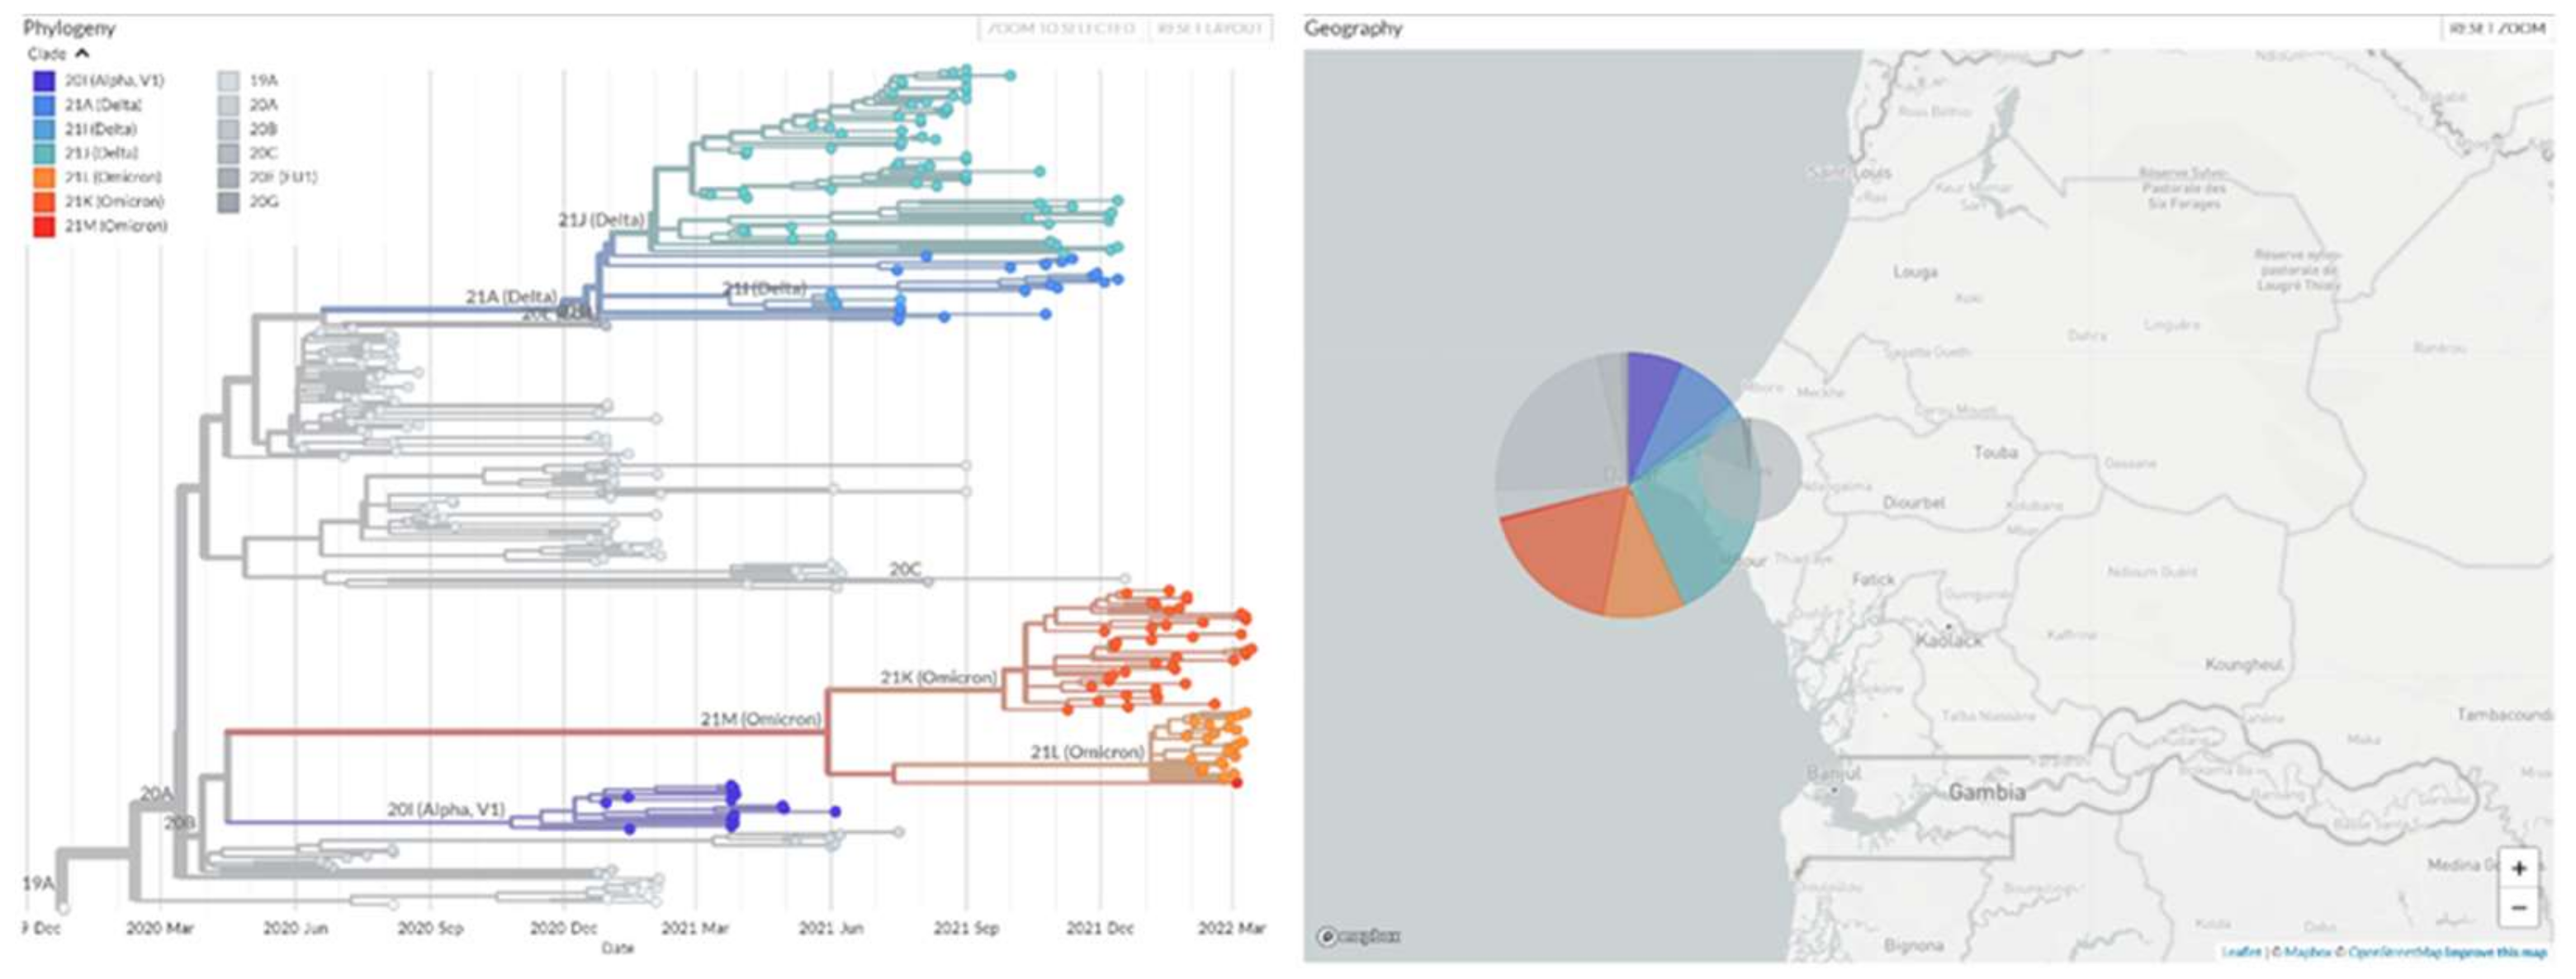
3.1. The Evolution of the Different Variants over Time

During the first wave, clades 19A and 20A were the most represent COVID-19 variants. In contrast to the first wave, the second wave of the pandemic in Senegal was dominated by clades 20I (Alpha, V1), 20A, and 20B (Figure 1). Before the appearance of the 21A (Delta) and 21J (Delta) variants and subsequently 21I (Delta), we noticed an increase in the Eta variant at the beginning of the third wave. The 21J and 20I clades reached their peaks on September 2021, accounting for more than 80% of the sequenced samples. At the end of November and the beginning of December 2021, coinciding with the fourth wave in Senegal, an increase in the 21K (Omicron) variant was observed. This was followed by heterogeneity in the Omicron variant giving rise to BA.2 (21L).

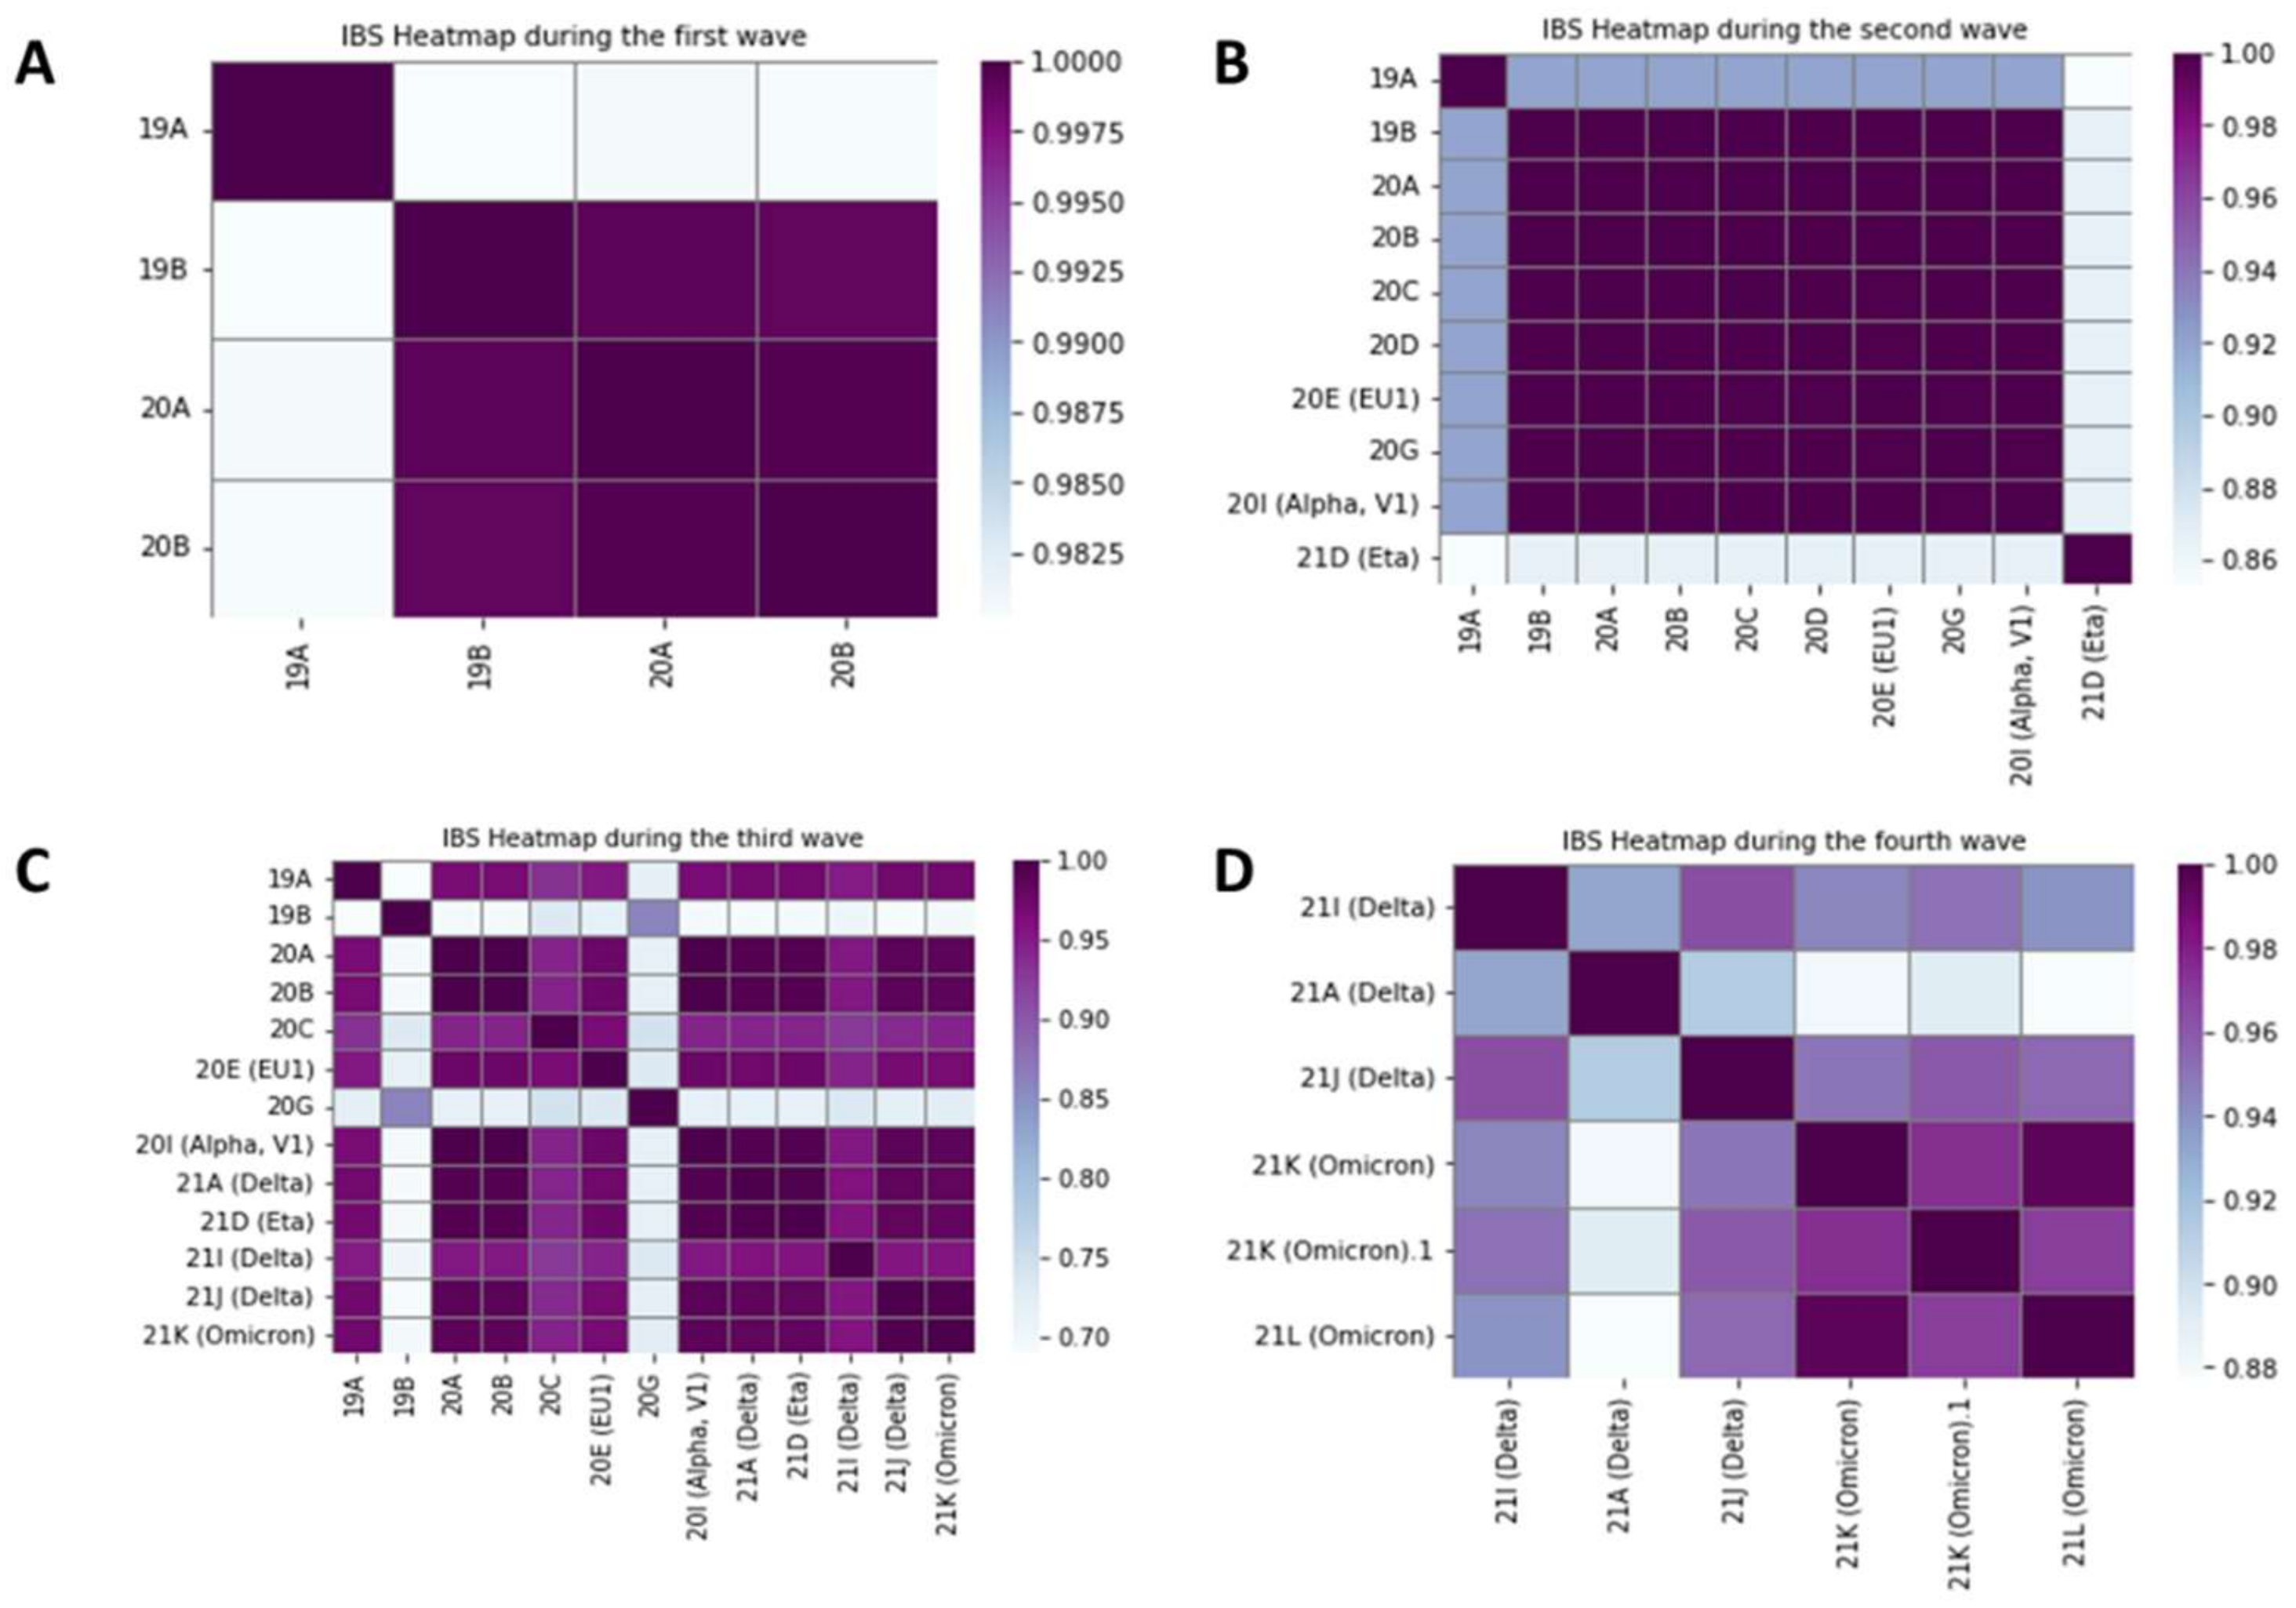
3.2. Relationships between Variants on Each Wave

When we compare the relationships between these distinct strains over the four waves, we find that they are substantially related (Figure 2). In the first wave, the IBS values are between 0.98 and 1, indicating a strong correlation. However, the correlation among clades 19B, 20A, and 20B is relatively stronger in comparison to clade 19A.
In the second wave, the IBS interval remains constant between 0.86 and 1. Clade 19A, as described in the previous wave, is not as closely related to the other clades, nor is clade 21D (Eta). Apart from these two clades, the others are extremely intertwined. During the third wave however, we see lesser correlation between clades 19B and 20G when compared to the two previous waves, with IBS values varying between 0.70 and 1. The Alpha, Eta, Delta, and Omicron variants show simulacra.
During the fourth wave, we observe the appearance of the Omicron variant, which evolved into sub-variants (BA.1, BA.2, and BA.3). The signal and the time trend are plotted in Figure 3 resulting to a correlation coefficient of 0.4017 and an R-squared value equal to 0.1613.

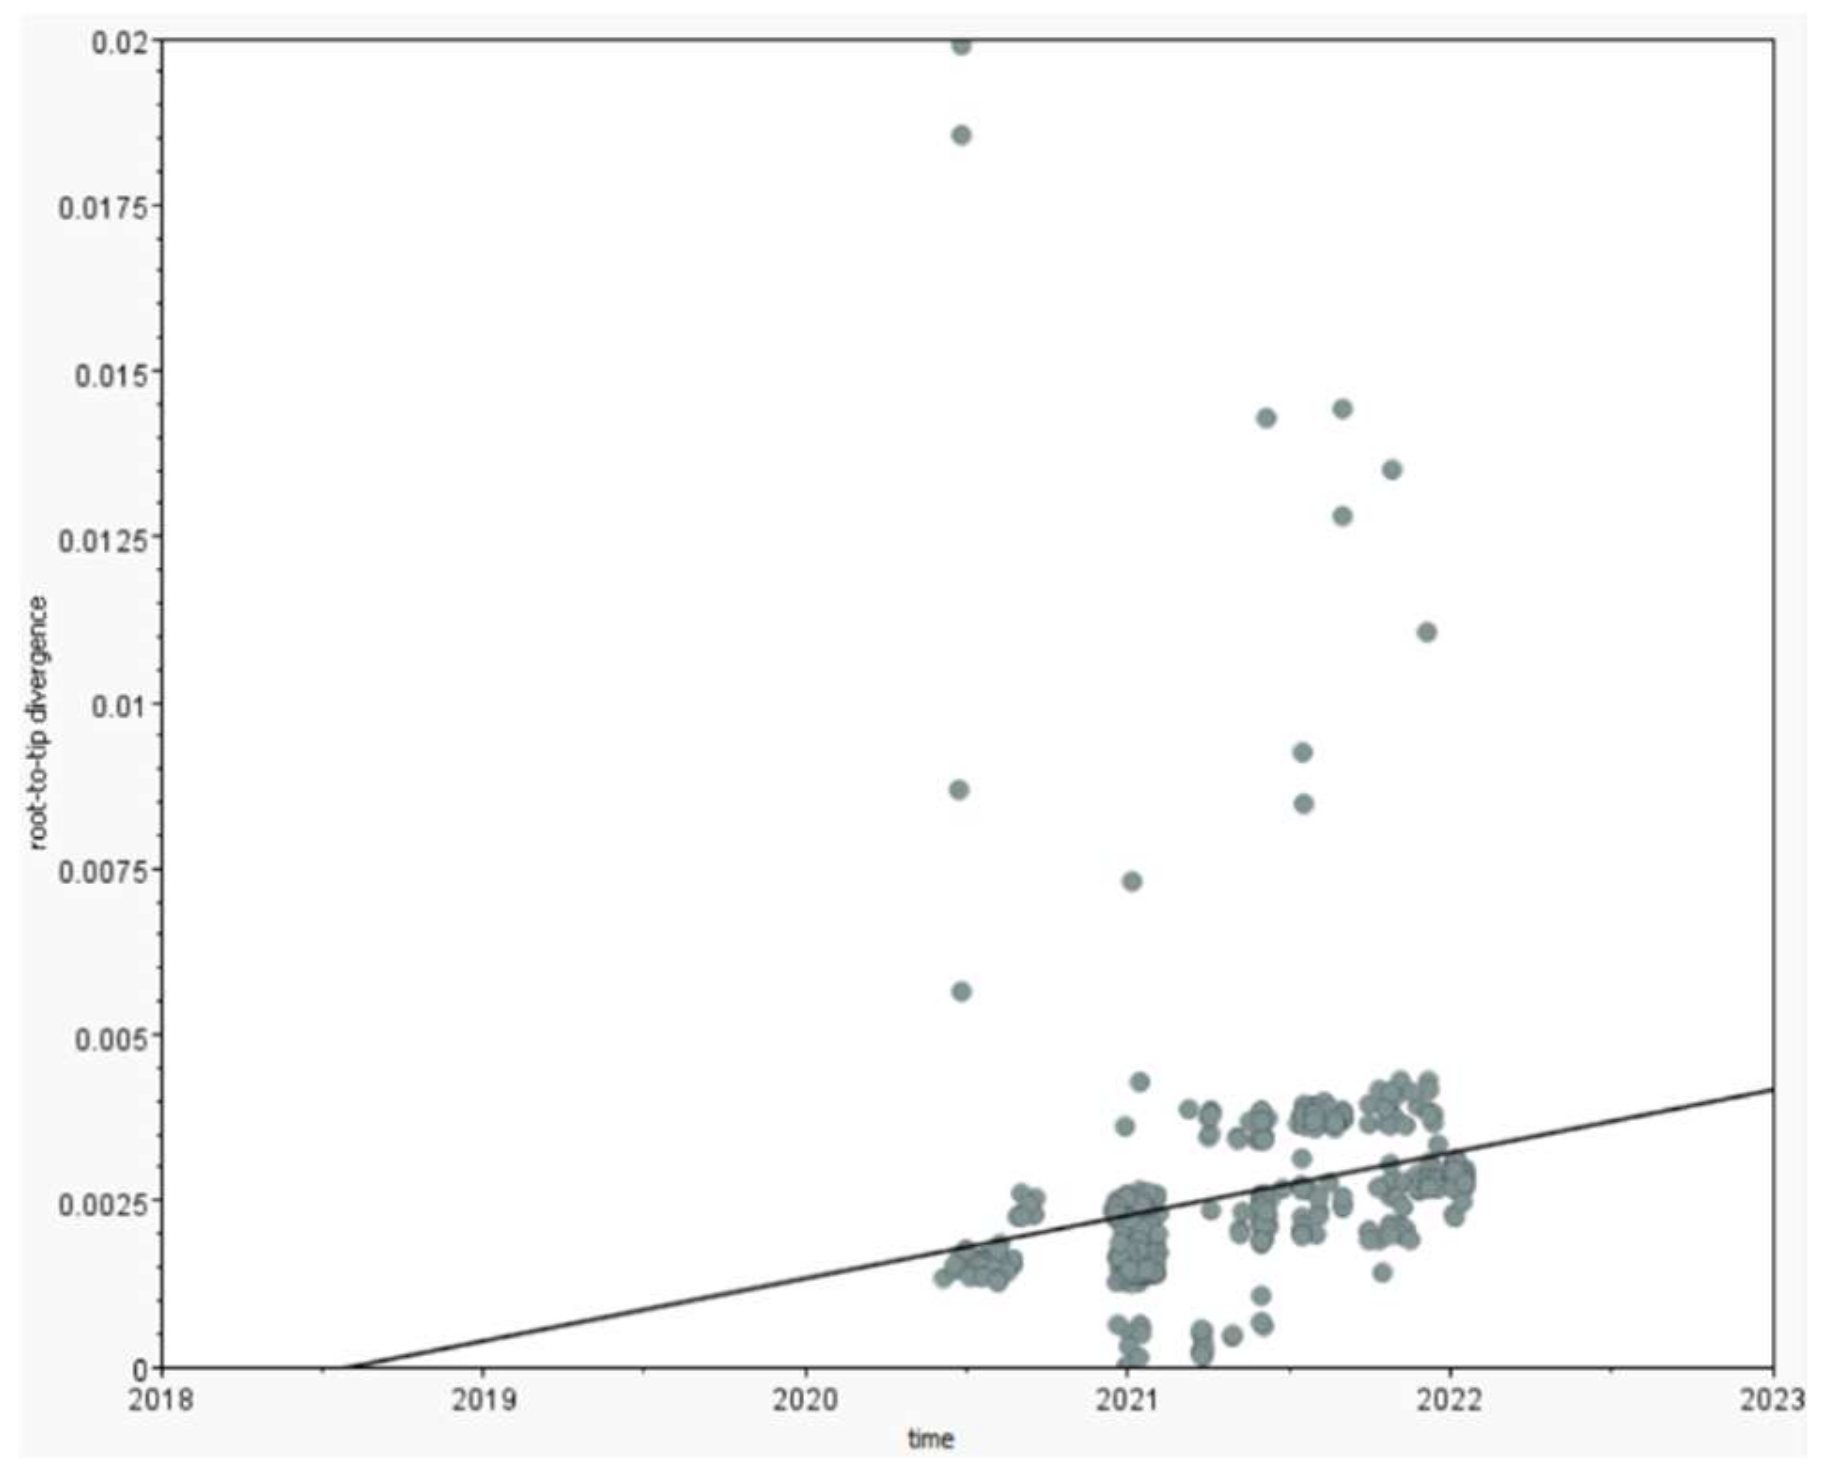
3.3. The Pandemic’s Speed of Spread

Figure 4 shows a plot of number of confirmed COVID-19 cases as a function of evolution time. We observe a notable increase, nearly triple at one point, in the number of confirmed cases during the third wave.
The highest number of confirmed cases during the fourth wave, although higher than that of the first and second waves, was still lower than that of the third wave. After 23 weeks from its first appearance in Senegal, the pandemic spread at a rate of 44.34 cases/week in the first wave, 12 weeks later at a rate of 185.33 cases/week in the second wave, and finally 9 weeks later at rate 681.77 cases/week in the third wave. By the beginning of December 2021 and the first half of January 2022, the fourth wave had reached a rate of 646 cases/week.

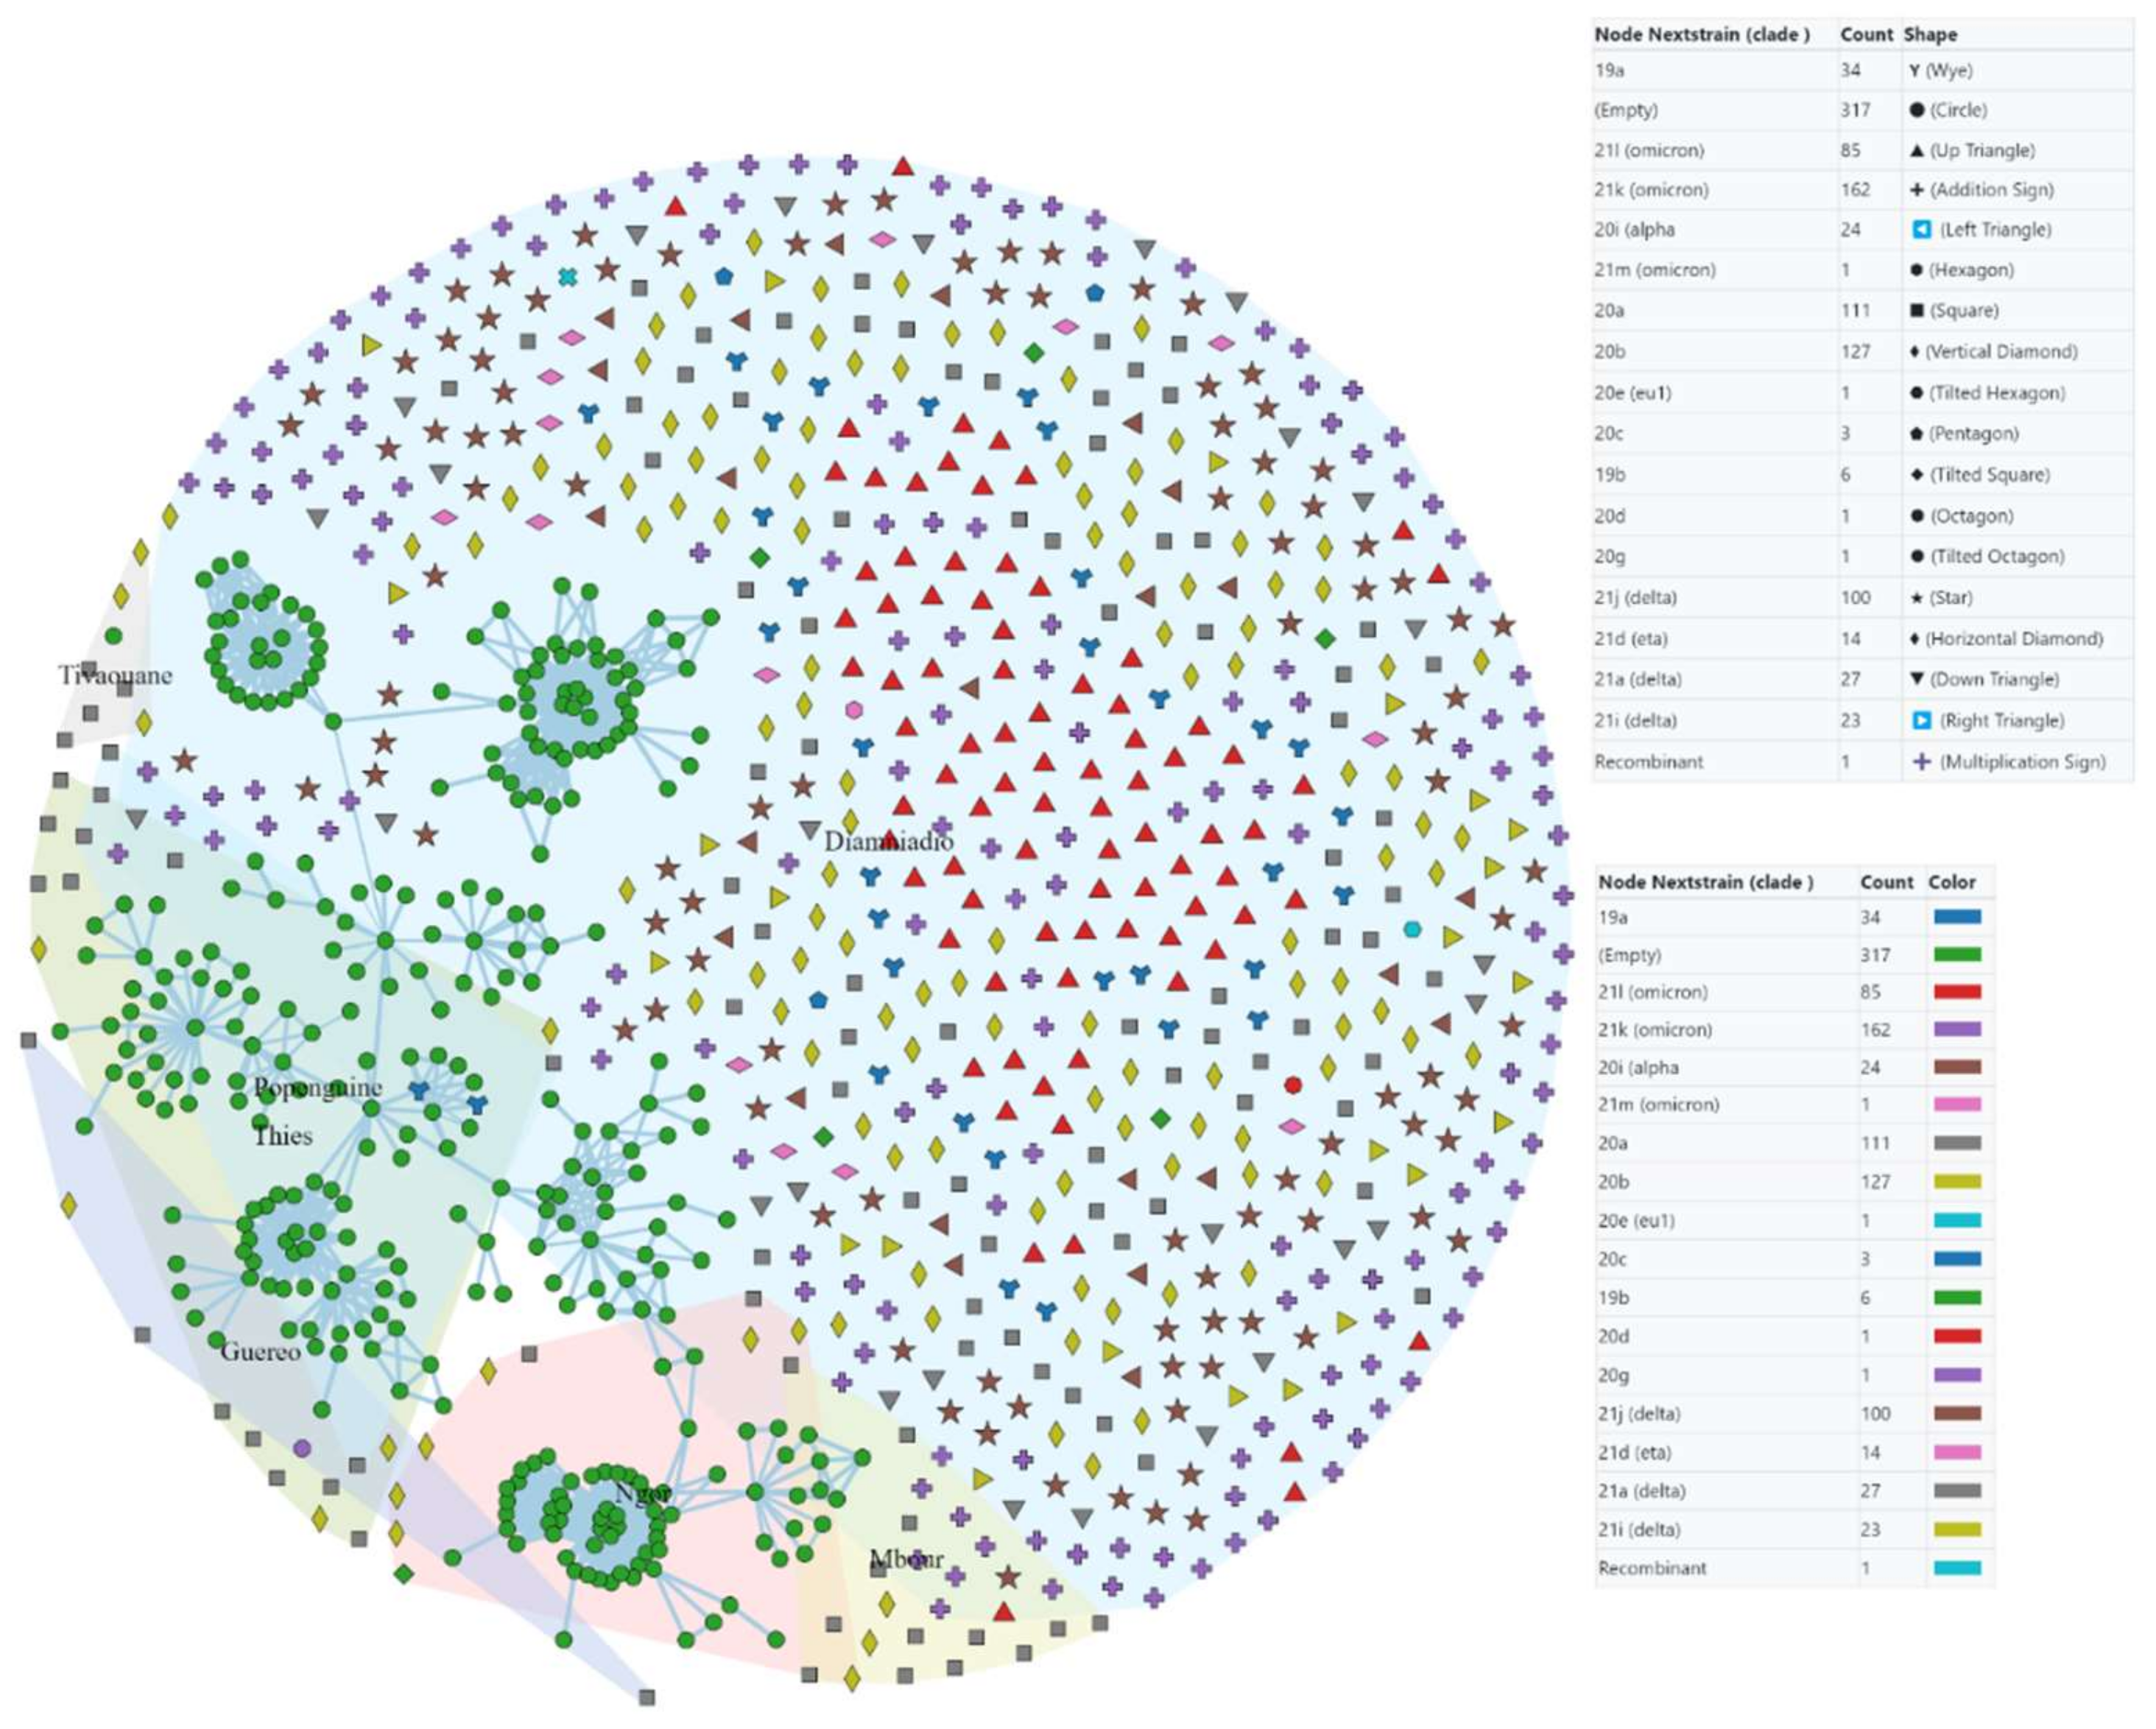
3.4. Origin and Transmission Network of the Pandemic

The epidemic started in Dakar, according to Microreact simulations based on sequence data collected at the IRESSEF genomics laboratory. It then spread to Thiès and other cities in Senegal (Figure 5).
Studies have shown that determining the origin of a COVID-19 case (imported, secondary, or tertiary) can be a challenge [11,12]. However, secondary and tertiary transmission of COVID-19 have been confirmed [12], and these cases are thought to be the main sources of rapid transmission cycles of the disease from one population group to another [13]. Biologically, COVID-19 is transmitted from human to human. In silico, we have created a transmission network to better understand transmission (Figure 6). We found that most of the samples collected in Dakar (Diamniadio) did not cluster together. On the other hand, samples collected in the Thiès region (Mbour, Tivaoune, and Guero) had a common transmission link.
If the number of single nucleotide polymorphisms (SNPs) is set to 50, the samples collected in Ngor, together with those collected in Thiès and Péguine, create a transmission network. Looking at this diagram, we can see that the virus appears to be transmitted through four groups of samples collected in Diamniadio, one of which is extremely similar to the samples from Thiès and Popenguine, and another which is quite similar to the samples from Ngor.

4. Discussion

4.1. The Evolution of Phylodynamic Variants and Their Transmissibility

SARS-Cov-2 has many variants circulating worldwide, including in Senegal [14]. The B.1 lineage was largely dominant in the first wave in Senegal. In late 2020, the first variants of concern (VOC) appeared [14]. The Alpha variant (20I or B.1.1.7) was announced by the UK government in December 2020 [15]. In the second wave, this variant was the most worrying. The emergence of variants is a normal part of the epidemic process [16]. After the Alpha variant, various variants were discovered around the world, including Beta (B.1.351) in South Africa, Gamma (P.1) in Brazil, Delta (B.1.617.2) in India, and Omicron (B.1.1.529) in South Africa [16]. A strong increase of the Eta variant was observed in Senegal before the third wave, which constituted a transition phase between the second and third waves. In the third wave in Senegal, 15 AY.* (Delta plus) was found in addition to the Delta variant (B.1.617.2). After the predominance of the Delta variant (B.1.617.2), the AY.4 variant was significantly isolated. Despite the high transmissibility of the Delta variant, the introduction of the Omicron variant has gradually replaced the Delta variant worldwide [17]. At the GISAD platform, more than half a million genomic sequences of the Omicron variant have been submitted [18].
At the IRESSEF genomics laboratory, many SARS-CoV-2 variants were discovered in Senegal during the epidemic. IBS results during the first wave as well as subsequent waves revealed that the variants are strongly related, with IBS values above 95%. This strong relationship is also seen from time signal analyses, which reveal that the clades are strongly smoothed over time.

4.2. The Pandemic’s Origin, Speed of Spread, and Transmission Network

The origin of the transmission of the virus and the existence of a vector is not yet elucidated. This knowledge can help to decipher the molecular mechanism of its interspecies spread and to put in place effective control measures to limit the spread. The speed of spread increases from wave to wave as variants evolve over time. Thus, much research has been carried out to better understand and limit the spread of the virus [19]. It is known that transmissibility depends on the number of mutations in the virus [20]. Increase in contagiousness is the result of rapid transmissibility [21]. With the introduction of the Omicron variant, the rate of spread was 646 cases/week in Senegal. One of the ways to combat the spread of the pandemic is to understand the transmission mechanisms of the virus responsible [22]. On 2 March 2020, Senegal reported its first case of COVID-19, with a patient returning from France and who lived in Dakar [23]. This underlines the importance of the research, which shows that the pandemic in Senegal appears to have started in Dakar and then spread to the nearest city before spreading inland. Our approach to characterize the transmission network using MicrobeTrace produced data on existing contact networks that describe the most likely transmission routes; this facilitate the understanding and visualization of relationships between patients (nodes). The limitation of this study is that many samples are missing in the area of transmissibility. Indeed, the bias in this study is that the majority of samples collected at IRESSEF are from travellers, the Diamniadio health district, Thiès, and Popenguine. This observation was described by Thai et al. [24]. Finally, a large transmission network is formed by the majority of samples coming from the Thiès region, in particular Popenguine and Guero. Reported rates of contagion from a patient with a symptomatic infection vary by location [25]. This is explained by the fact that these regions are not only geographically close but are also interconnected by a large transportation network.

5. Conclusions

SARS-CoV-2 is an emerging pathogen that spreads rapidly. Patients that are infected can die. To this date, SARS-CoV-2 continues to spread through the many mutations of the virus that are responsible for different waves. It continues to wreak havoc in the world, especially in Senegal. The virus also diversifies from wave to wave. Each wave is dominated by one type of variant, notably Delta in the third wave and Omicron in the fourth wave. These variants also have very strong relationships over time. From the first to the third wave, we have found that the contagiousness of the virus increases. Our work has also shown that the SARS-CoV-2 epidemic started in Dakar and spread to the rest of the country. Furthermore, our results showed that the contamination was done by cluster except for some of the samples collected at IRESSEF Diamniadio. A high percentage of the patients are incoming or outgoing travellers.
For the next steps we will:
  • Continue to monitor the genome for new mutations in SARS-CoV-2 that could cause new outbreaks.
  • Expand this research to the whole country to better understand the progression of the disease.
  • Prepare for new outbreaks.

Author Contributions

K.G., A.P., C.K.D. and S.M. conceived and designed the study. N.L., S.N. (Seyni Ndiaye), N.D.D. performed the experiments. A.P., C.K.D., S.N. (Samba Ndiour), K.G. and N.D.D. recruited study participants and collected data. A.P. and K.G. analyzed and interpreted the data. S.M., P.A.D., M.M., D.W., N.L. and G.L. contributed to reagents/materials/analysis tools. A.P., P.A.D., K.G., C.K.D., A.A., A.S.N., A.J.S.N., M.S. and M.B. participated to study design. A.P. and S.M. participated in study coordination. A.P., K.G., S.N. (Samba Ndiour) and C.I.L. wrote/drafted the manuscript. A.M., D.W., N.L., G.L., C.I.L., M.M., P.A.D., N.C.T.K., S.M., A.A., G.L., P.A.D. and M.C. critically reviewed the manuscript for important intellectual content. C.S., B.C., S.M., N.C.T.K. and M.C. approved the final version to be published. All authors have read and agreed to the published version of the manuscript.

Funding

This study was funded by the “European and Developing Countries Clinical Trials Partnership” (EDCTP) (Grant Nr: RIA2020EF-2961), the “West African Task Force for the Control of Emerging and Re-emerging Infectious Diseases” (WATER), and “Innovation in Laboratory Engineered Accelerated Diagnosis” (iLEAD) (Grant Nr. OPP1214434/INV-009631). The funders had no role in the study design, data collection and analysis, decision to publish, or preparation of the manuscript. The views expressed are those of the authors, and the funders are not responsible for any use that may be made of the information contained herein. This work was supported in part through National Institutes of Health USA grant U01 AI151698 for the United World Antivirus Research Network (UWARN). This article was supported by WANETAM as part of the EDCTP program.

Institutional Review Board Statement

This study was approved by the National Ethics Committee for Health Research of Senegal under the following number: 000159/MSAS/CNERS/SN. Free and informed consent is provided by each adult individual who participated in this study.

Informed Consent Statement

Not applicable.

Data Availability Statement

Not applicable.

Acknowledgments

We gratefully thank the individuals that participated in this study and the IRESSEF’s personnel involved in the SARS-CoV-2 testing and sequencing. We also thank Didier Raoult from the Institut Méditérannée Infection de Marseille and Abdul Sesay from the Medical Research Council of Gambia for their support. We also thank Sidy Ndao and Korka Fall for their support for the last version English.

Conflicts of Interest

The authors have declared that no competing interest exist.

References

  1. Huang, C.; Wang, Y.; Li, X.; Ren, L.; Zhao, J.; Hu, Y.; Zhang, L.; Fan, G.; Xu, J.; Gu, X.; et al. Clinical features of patients infected with 2019 novel coronavirus in Wuhan, China. Lancet 2020, 395, 497–506. [Google Scholar] [CrossRef] [Green Version]
  2. WHO|Novel Coronavirus—China. WHO n.d. Available online: http://www.who.int/csr/don/12-january-2020-novel-coronavirus-china/en/ (accessed on 25 January 2022).
  3. WHO Director-General’s Remarks at the Media Briefing on 2019-nCoV on 11 February 2020 n.d. Available online: https://www.who.int/director-general/speeches/detail/who-director-general-s-remarks-at-the-media-briefing-on-2019-ncov-on-11-february-2020 (accessed on 25 January 2022).
  4. Coronavirus-West-Africa—Sahel and West Africa Club Secretariat n.d. Available online: https://www.oecd.org/swac/coronavirus-west-africa/ (accessed on 25 January 2022).
  5. Senegal Reports First COVID-19 Case. WHO|Regional Office for Africa n.d. Available online: https://www.afro.who.int/news/senegal-reports-first-COVID-19-case (accessed on 25 January 2022).
  6. Volz, E.; Hill, V.; McCrone, J.T.; Price, A.; Jorgensen, D.; O’Toole, Á.; Southgate, J.; Johnson, R.; Jackson, B.; Nascimento, F.F.; et al. Evaluating the Effects of SARS-CoV-2 Spike Mutation D614G on Transmissibility and Pathogenicity. Cell 2021, 184, 64–75.e11. [Google Scholar] [CrossRef] [PubMed]
  7. Aleem, A.; Akbar Samad, A.B.; Slenker, A.K. Emerging Variants of SARS-CoV-2 and Novel Therapeutics Against Coronavirus (COVID-19); StatPearls Publishing: Treasure Island, FL, USA, 2021. [Google Scholar]
  8. Padane, A.; Kanteh, A.; Leye, N.; Mboup, A.; Manneh, J.; Mbow, M.; Diaw, P.; Ndiaye, B.; Lo, G.; Lo, C.; et al. First detection of SARS-CoV-2 variant B.1.1.7 in Senegal. N. Microbes N. Infect. 2021, 41, 100877. [Google Scholar] [CrossRef] [PubMed]
  9. Li, B.; Deng, A.; Li, K.; Hu, Y.; Li, Z.; Xiong, Q.; Liu, Z.; Guo, Q.; Zou, L.; Zhang, H.; et al. Viral infection and transmission in a large well-traced outbreak caused by the Delta SARS-CoV-2 variant. medRxiv 2021. [Google Scholar] [CrossRef] [PubMed]
  10. Sahoo, J.P.; Samal, K.C. World on Alert: WHO Designated South African New COVID Strain (Omicron/B.1.1.529) as a Variant of Concern. Biot. Res. Today 2021, 3, 1086–1088. [Google Scholar]
  11. The Transmission Modes and Sources of COVID-19: A Systematic Review—PMC. Available online: https://www.ncbi.nlm.nih.gov/pmc/articles/PMC7484735/ (accessed on 28 March 2022).
  12. Xu, T.; Chen, C.; Zhu, Z.; Cui, M.; Chen, C.; Dai, H.; Xue, Y. Clinical features and dynamics of viral load in imported and non-imported patients with COVID-19. Int. J. Infect. Dis. 2020, 94, 68–71. [Google Scholar] [CrossRef] [PubMed]
  13. Shen, Z.; Xiao, Y.; Kang, L.; Ma, W.; Shi, L.; Zhang, L.; Zhou, Z.; Yang, J.; Zhong, J.; Yang, D.; et al. Genomic diversity of SARS-CoV-2 in Coronavirus Disease 2019 patients. Clin. Infect. Dis. 2020, 71, 713–720, published online ahead of print. [Google Scholar] [CrossRef] [PubMed] [Green Version]
  14. Coronavirus: Circulation Des Variants Du SARS-CoV-2. Available online: https://www.santepubliquefrance.fr/dossiers/coronavirus-COVID-19/coronavirus-circulation-des-variants-du-sars-cov-2 (accessed on 25 January 2022).
  15. Otto, S.P.; Day, T.; Arino, J.; Colijn, C.; Dushoff, J.; Li, M.; Mechai, S.; Van Domselaar, G.; Wu, J.; Earn, D.J.; et al. The origins and potential future of SARS-CoV-2 variants of concern in the evolving COVID-19 pandemic. Curr. Biol. 2021, 31, R918–R929. [Google Scholar] [CrossRef] [PubMed]
  16. Bertholom, C. Évolution Génétique du Sars-CoV-2 et ses Conséquences. Option/Bio 2021, 32, 22–23. [Google Scholar] [CrossRef]
  17. Kannan, S.R.; Spratt, A.N.; Cohen, A.R.; Naqvi, S.H.; Chand, H.S.; Quinn, T.P.; Lorson, C.L.; Byrareddy, S.N.; Singh, K. Evolutionary analysis of the Delta and Delta Plus variants of the SARS-CoV-2 viruses. J. Autoimmun. 2021, 124, 102715. [Google Scholar] [CrossRef] [PubMed]
  18. COVID-19: Qu’est-Ce Que Le Variant Omicron? ONU France, 13 Janvier 2022. Available online: https://unric.org/fr/COVID-19-quest-ce-que-le-variant-omicron/ (accessed on 25 January 2022).
  19. Amir, I.J.; Lebar, Z.; Yahyaoui, G.; Mahmoud, M. Covid-19: Virologie, épidémiologie et diagnostic biologique. Option/Bio 2020, 31, 15–20. [Google Scholar] [CrossRef]
  20. Alizon, S.; Sofonea, M.T. SARS-CoV-2 contagious evolution: Acontagious theory, immunity and trade-offs. J. Evol. Biol. Juill. 2021, 34, 1867–1877. [Google Scholar] [CrossRef] [PubMed]
  21. Geoghegan, J.; Holmes, E.C. The phylogenomics of evolving virus virulence. Nat. Rev. Genet. 2018, 19, 756–769. [Google Scholar] [CrossRef] [PubMed]
  22. Meyerowitz, E.A.; Richterman, A.; Gandhi, R.T.; Sax, P.E. Transmission of SARS-CoV-2: A Review of Viral, Host, and Environmental Factors. Ann. Intern. Med. 2021, 174, 69–79. [Google Scholar] [CrossRef] [PubMed]
  23. Le Sénégal Déclare Le Premier Cas De COVID-19, OMS|Bureau Régional Pour l’Afrique. Available online: https://www.afro.who.int/fr/news/le-senegal-declare-le-premier-cas-de-COVID-19 (accessed on 25 January 2022).
  24. Pham, T.Q.; Hoang, N.-A.; Quach, H.-L.; Nguyen, K.C.; Colquhoun, S.; Lambert, S.; Duong, L.H.; Tran, Q.D.; Ha, D.A.; Phung, D.C.; et al. Timeliness of contact tracing among flight passengers during the COVID-19 epidemic in Vietnam. BMC Infect. Dis. 2021, 21, 1–9. [Google Scholar] [CrossRef] [PubMed]
  25. Lotfi, M.; Hamblin, M.R.; Rezaei, N. COVID-19: Transmission, prevention, and potential therapeutic opportunities. Clin. Chim. Acta 2020, 508, 254–266. [Google Scholar] [CrossRef] [PubMed]
Figure 1. Evolution over time of the different COVID-19 variants. This figure shows successive waves of variants in Senegal, occurring about 3 months apart over the course of 18 months.
Covid 02 00082 g001
Figure 2. IBS Heatmap between clades for each wave. Subfigures (AD) show the IBS Heatmap during the first, second, third, and fourth waves respectively.
Covid 02 00082 g002
Figure 3. Time signal. Root-to-tip regression analyses on the SARS-CoV-2 genomic data set. The y-axis corresponds to the distance between the root and the tip of the phylogenetic trees and the x-axis corresponds to the time evolution.
Covid 02 00082 g003
Figure 4. Evolution over time of confirmed cases per day and the instantaneous rates of spread of the pandemic.
Covid 02 00082 g004
Figure 5. Phylogenetic tree and phylogeographic using data collected at IRESSEF. The nextstrain/ncov tool (https://github.com/nextstrain/ncov) was used to reconstruct the phylogeny, which was then visualized with Auspice (https://auspice.us/). As a subgroup, the genome of the original Wuhan-Hu-1 coronavirus isolate was contributed (GenBank accession number NC 045512.2). As an outgroup, it has been added. The major (most common) versions are highlighted. Nextstrain, or WHO clade variations, are mentioned. The X axis represents the number of mutations found in the Wuhan-Hu-1 isolate’s genome (GenBank accession number NC 045512.2).
Covid 02 00082 g005
Figure 6. Transmission network of the COVID-19 epidemic data collected and sequenced at IRESSEF using a MicrobeTrace-based transmission network with nodes and shapes in Clade color.
Covid 02 00082 g006
Publisher’s Note: MDPI stays neutral with regard to jurisdictional claims in published maps and institutional affiliations.

