Article Text

Abstract
Objective To assess association of clinical features on COVID-19 patient outcomes.
Design Retrospective observational study using electronic medical record data.
Setting Five member hospitals from the Mount Sinai Health System in New York City (NYC).
Participants 28 336 patients tested for SARS-CoV-2 from 24 February 2020 to 15 April 2020, including 6158 laboratory-confirmed COVID-19 cases.
Main outcomes and measures Positive test rates and in-hospital mortality were assessed for different racial groups. Among positive cases admitted to the hospital (N=3273), we estimated HR for both discharge and death across various explanatory variables, including patient demographics, hospital site and unit, smoking status, vital signs, lab results and comorbidities.
Results Hispanics (29%) and African Americans (25%) had disproportionately high positive case rates relative to their representation in the overall NYC population (p<0.05); however, no differences in mortality rates were observed in hospitalised patients based on race. Outcomes differed significantly between hospitals (Gray’s T=248.9; p<0.05), reflecting differences in average baseline age and underlying comorbidities. Significant risk factors for mortality included age (HR 1.05, 95% CI 1.04 to 1.06; p=1.15e-32), oxygen saturation (HR 0.985, 95% CI 0.982 to 0.988; p=1.57e-17), care in intensive care unit areas (HR 1.58, 95% CI 1.29 to 1.92; p=7.81e-6) and elevated creatinine (HR 1.75, 95% CI 1.47 to 2.10; p=7.48e-10), white cell count (HR 1.02, 95% CI 1.01 to 1.04; p=8.4e-3) and body mass index (BMI) (HR 1.02, 95% CI 1.00 to 1.03; p=1.09e-2). Deceased patients were more likely to have elevated markers of inflammation.
Conclusions While race was associated with higher risk of infection, we did not find racial disparities in inpatient mortality suggesting that outcomes in a single tertiary care health system are comparable across races. In addition, we identified key clinical features associated with reduced mortality and discharge. These findings could help to identify which COVID-19 patients are at greatest risk of a severe infection response and predict survival.
- health informatics
- epidemiology
- infectious diseases
- COVID-19
This is an open access article distributed in accordance with the Creative Commons Attribution Non Commercial (CC BY-NC 4.0) license, which permits others to distribute, remix, adapt, build upon this work non-commercially, and license their derivative works on different terms, provided the original work is properly cited, appropriate credit is given, any changes made indicated, and the use is non-commercial. See: http://creativecommons.org/licenses/by-nc/4.0/.
Statistics from Altmetric.com
Strengths and limitations of this study
Comprehensively summarised clinical charateristics for COVID-19 patients through the peak of the pandemic in the greater New York City area using electronic medical record (EMR) data.
The COVID-19 cohort extracted from the EMR are racially and socially diverse.
Modelled the prognosis of hospitalised COVID-19 patients using competing risks survivial analyses.
Our model may have limited generalisability as the data is from a group of hospitals located in the New York City region.
Many patients in our cohort were missing key laboratory tests (eg, C reactive protein and degradation dimer), limiting power of association analyses.
Introduction
COVID-19 is a global pandemic that has infected over 16 million individuals, including over 4.2 million in the USA as of 27 July 2020.1 Given recent reports on the high proportion of COVID-19 infections among those who remain asymptomatic, however, the true rate of infection is expected to be significantly higher than reported.2 3 More than 147 000 US residents have died, the majority in epicentres like New York City (NYC), where 224 051 cases and 23 485 deaths have occurred as of July 2020. Mortality rates have been disproportionately high among Hispanic and African American individuals. In NYC, death rates for these groups are nearly double those in Whites or Asians, but the factors contributing to this racial disparity remain unclear.4 Furthermore, reducing mortality among all critically ill individuals is the highest priority, and although some clinical risk factors have been noted in recent publications,5 6 there remains much to learn about which patients are at highest risk, what factors are most indicative of disease progression and prognosis, and which interventions may be most effective.
A systematic review of studies predicting coronavirus-related outcomes concluded that all of the publications were biased in some way, limiting their utility in practice.7 They noted that prognostic models often excluded patients for which no outcome was yet determined (eg, patients that had neither recovered nor died) leading to selection bias, used relatively small samples (eg, 26–577 patients) increasing the risk of overfitting, or in many cases did not use features or time points that could be measured prospectively (eg, last available vital sign).7 Furthermore, few of these studies were conducted in the USA where population factors, health-related behaviours, cultural differences and hospital standard of care protocols may be different.8 Indeed, case characteristics among hospitalised patients in China seem meaningfully different than those in the USA5—for example, mortality rates were much lower in China for unclear reasons.
There have been several recent descriptive reports of clinical characteristics among COVID-19 patients admitted to US hospitals,9 including an ongoing, population-based report from the Centers for Disease Control and Prevention6 and another from NYU Langone Health.5 While data are mounting regarding racial disparities and COVID-19,10 most of these studies have not offered in depth analysis by race to investigate racial disparities in mortality. Since few proven effective therapies exist for COVID-1911, up-to-date clinical outcomes and data on factors influencing risk for mortality and recovery over time are urgently needed.
Given the high mortality rate in NYC and the uncertainty regarding COVID-19 progression during inpatient stays, accurately evaluating prognosis of both mortality and discharge among hospitalised individuals is critically needed. Identifying which patients are at highest risk for mortality will enable clinicians to target interventions, allocate resources and make more informed triage decisions. Highlighting factors most associated with mortality will also help prioritise factors to monitor during hospital admission. Prognostic models have the potential to improve the standard of care for COVID-19, open opportunities for testing investigational drugs in clinical trials, and guide clinical decision-making.
In this study, the largest and most racially diverse US-based COVID-19 case series to date, we provide descriptive statistics on laboratory-confirmed cases (N=6158) and hospitalised patients (N=3273) from the Mount Sinai Health System (MSHS). In particular, we investigated the association between race and mortality, given the known racial disparities in mortality rates observed in the USA.12 We also evaluated the link between demographics, smoking status, and clinical variables and mortality and recovery among hospitalised patients admitted to MSHS hospitals in Manhattan, Brooklyn and Queens. As in previous studies,5 6 9 we considered comorbidities, vital signs and lab results for COVID-19 disease and the potential to improve patient outcomes. We report HRs for all risk factors estimated for both death and discharge. We also developed a prognostic model to assess mortality vs disease recovery. Together, we believe these estimates can help inform stakeholders which COVID-19 patients are at greatest risk for poor outcomes and evaluate the impact on survival.
Methods
Electronic medical record data and processing
This study used the deidentified electronic medical record (EMR) data from the MSHS (all EPIC systems) and was considered a non human subject study. We obtained deidentified data from the EMR via the Mount Sinai Data Warehouse through 15 April 2020. Patients were included in the dataset if they had an encounter (in person or virtual) at a Mount Sinai facility in which a COVID-19 test was ordered or a COVID-19 related diagnosis was given.
Demographics including age, sex, race and ethnicity were captured in this dataset. We used self-reported race and ethnicity to jointly categorise patients into five disjoint racial groups: African American, Asian/Pacifica Islander, white, Hispanic/Latino and other. The Hispanic/Latino group include all patients who are ethnically Hispanic, regardless of their races. In other words, the other four racial groups (African American, Asian/Pacific Islander, white, other) are all non-Hispanics. In addition smoking status and disease comorbidities were also extracted from the EMR. Comorbidities were defined as the presence or absence of the following chronic conditions recorded as ‘Active’ in the Epic Problem List: diabetes mellitus, hypertension, asthma, chronic obstructive pulmonary disease (COPD), HIV infection, obesity and cancer. For each encounter, initial measurements of vital signs including BMI, temperature, systolic blood pressure (BP), diastolic BP, O2 saturation, heart rate and respiratory rate were provided. Laboratory test orders and results throughout these encounters were also extracted; common lab test orders included complete blood count and differentials, metabolic panels, blood lactate dehydrogenase, ferritin, fibrin degradation dimer (D-Dimer), serum procalcitonin, hepatic function panel, blood culture, fibrinogen, C reactive protein (CRP).
Since vital signs can vary over the course of a single encounter, we also extracted the maximum temperature and minimum O2 saturation recorded in EMR for each encounter, as well as the length of stay for inpatients.
COVID-19 case definition
A confirmed case of COVID-19 was defined as a positive test result from a real-time reverse-transcriptasePCR-based clinical test carried out on nasopharyngeal swab specimens collected from the patient. For vast majority of tests, MSHS uses Roche cobas 6800 which tests on two targets, the ORF1/a nonstructural region that is specific for SARS‐CoV‐2 (target 1), and the structural protein envelope E gene that is shared by the Sarbecovirus subgenus (target 2). A positive test result requires both targets to be detected as present in the patient sample (https://www.fda.gov/media/136049/download). A patient under investigation of COVID-19 was clinically defined as a patient who experienced (1) fever and/or cough, shortness-of-breath, sore throat, nasal congestion not related to typical seasonal allergies or (2) fever and/or cough and a history of exposure to COVID-19.
Source population used as demographic reference
We analysed patients who had at least one visit at either of five member hospitals that use EPIC system to serve as a background demographic reference. We selected all patients with encounters of any type (outpatient, inpatient, emergency) recorded in the MSHS EMR since 2016 and retrieved their self-reported races, ethnicities and age in years. Patients were categorised into five disjoint racial groups using the same procedure as described in the first Method section. The patients with unknown race/ethnicity information were excluded from this analysis.
COVID-19 cohort
Our study population comprised COVID-19 patients as defined above as of 15 April 2020 (table 1). We next selected COVID-19 patients who were admitted as inpatients and stayed at least 1 day in the hospital to study prognosis. We recorded the durations of hospital stay and the number of days since SARS-CoV-2 positive. Three possible outcomes were defined for our hospitalised study population: in-hospital death (deceased), discharged to home or other locations not concerning intensive medical care (recovered), and continued hospitalisation (right censored).
Composition of patients in the source population from MSHS EMR, patients tested for SARS-CoV-2 infection, SARS-CoV-2 infected patients and patients deceased from COVID-19
Examination of racial disparities in diagnosis and mortality rates
To test for racial disparities in positive test frequencies and COVID-19 in-hospital mortality, we compared observed rates of COVID-19 diagnosis and mortality relative to the race frequencies in the MSHS source population. For these two outcome variables of interest (positive test rate and in-hospital mortality rate) we performed a χ2 test to assess whether a given rate was detected as significantly different among any of the five racial groups. Under the null hypothesis of the χ2 test test, the rates are assumed to be the same across the five racial groups. We also fitted a multivariate logistic regression (implemented in ‘glm’ function in R V.3.6.1) to adjust for variables such as age that are confounded with diagnosis and mortality rates. Finally, competing risks survival analysis was employed to analyse the mortality rate and discharge rate over time.
Analyses of individual factors on inpatient mortality over time
We were first interested in observing any demographic or hospital site-specific or specialty-specific associations with mortality and discharge individually over time. To do this, we estimated the cumulative incidence functions (CIFs) for in-hospital death and discharge using a univariate competing risks survival analysis for each covariate individually: race, sex, hospital and care area within the hospital.
Multivariate regression among inpatients with known outcomes
We fitted a multivariate logistic regression on clinical outcome (deceased=1, recovered=0) using covariates available in more than 85% of the patient in the staty cohort. These covariates include: duration of stay, demographic factors (age, sex, race and BMI), smoking status, vital signs (temperature, O2 saturation, heart rate, respiratory rate and BP), comorbidities (asthma, COPD, hypertension, obesity, diabetes, HIV and cancer), intensive care unit (ICU) admission and common laboratory tests (white cell count (WCC), creatinine and ALT) ordered at time of hospital admission. Level of significance considered for this study is p<0.05.
Multivariate analyses on inpatient mortality: competing risk survival analysis
To assess the associations between clinical variables and survival, we modelled the outcomes of hospitalised COVID-19 study population using competing risks survival analyses, which treats the two distinctive outcomes, in-hospital death and recovered as two competing causes for the same event, that is, termination of hospitalisation. Competing risks models are recommended over Kaplan-Meier survival analysis for studying events with multiple underlying causes.13–15 More formally, we denote the duration of hospital stay since diagnosis as t and the total duration from diagnosis to termination of hospitalisation as  . The goal of competing risks survival analysis is to estimate the CIF for each individual cause k. CIF is a function of time defined as the probability of a patient who stayed at hospital for a duration of
  :
:

where  is the survival function and
  is the hazard function for the cause k. To estimate the CIFs for in-hospital death and recovery for COVID-19 patients, we used the ‘cuminc’ function in the R package ‘cmprsk’. Gray’s test16 was conducted to determine if there were statistical differences among CIFs corresponding to subgroups of patients, under the null hypothesis that the CIFs under consideration were not different from each other.
To identify covariates associated with the two clinical outcomes—represented in the covariate vector x—we performed multivariate statistical analyses to estimate the contribution of each potential covariate to the cause-specific hazard function  as follows:

where  is the baseline hazard of case k, and
  is the coefficient for covariate i. When estimating the
  for competing risks analyses, we applied two families of models: cause-specific hazard models and subdistribution hazard models.17 We used cause-specific hazard model when fitting aetiological variables and subdistribution hazard model for prognostic variables, respective, as per recommendation.13 Cause-specific hazard models were estimated using the Cox proportional hazard approach18 using the ‘coxph’ function in the R package ‘survival’ by treating one cause as the event and the other as right-censored, whereas subdistribution hazard models were fitted using the ‘cmr’ function in the R package ‘cmprsk’.19 The R software used throughout this research is in V.3.6.1.
To help with forcasting the prognosis, we performed the same analysis used for estimating HRs on mortality, but limited features to only those available at baseline when patients were admitted to the hospital.
Patient and public involvement
Our research is based on deidentified EMR data from the MSHS and it is not considered as human subject research. Patients or the public were not involved in the design, or conduct, or reporting, or dissemination plans of our research. This research was done without patient involvement. Patients were not invited to comment on the study design and were not consulted to develop patient relevant outcomes or interpret the results. Patients were not invited to contribute to the writing or editing of this document for readability or accuracy.
Results
Our cohort included 28 336 individuals tested (table 1) for COVID-19 in the MSHS. A total of 6158 (21.7%) patients tested positive for SARS-CoV2 and an additional 428 (1.5%) were presumed positive and thus included as cases by our definition. A total of 3273 cases out of all positives (53.2%) were admitted to one of five hospitals in the MSHS which use the EPIC EMR system. Of those admitted, 742 died in the hospital (22.6%), 1706 were discharged (52%) and 825 remained hospitalised (25.2%) at the end point of this study (15 April 2020).
We investigated the association between race, age and COVID-19 diagnosis rates and in-hospital mortality. We then estimated the strength of associations between a variety of factors and in-hospital mortality. First, we estimated the individual effect of race, sex, hospital and specialty unit on inpatient mortality over time. Next, we identified the strongest predictors of inpatient mortality considering all possible indicators regardless of time, which can help prioritise clinical features to monitor. Then, to assess the connection between each feature and survival, we estimated HRs from a competing risks survival analysis. Finally, to offer a prognostic tool for prioritising the highest risk patients, we used baseline information to forecast in-hospital mortality.
Hispanics and African-Americans have elevated COVID-19 diagnosis rates
To examine a potential racial disparity for SARS-CoV-2 infection, we compiled a source population composed of 1.6 million people from the Mount Sinai EMR, with 45.6% White, 19.2% African American/black, 14.6% other, 7.7% Asian/Pacific Islander and 12.8% Hispanic/Latinos (table 1). We found Hispanics and African Americans were over-represented in the SARS-CoV-2 infected cohort, accounting for 28.5% and 24.6%, respectively, of all infected patients with known self-reported races, which were both significantly higher rates than expected based on the population base rate (X2=2504.1; p<0.05; table 1). We also noted the age distributions of infected patients within each race were different relative to our source population (online supplemental table S3). Furthermore, the White deceased cohort shows a different age distribution from the other race groups. Its density increases continuously as age increases, forming a triangle shape, while African-Americans shows the highest density at the age of 74 years (online supplemental figure S1B). However, even after adjusting for age in logistic regression, we found that Hispanics, African-Americans and people identified as other races have significantly higher odds of being infected by SARS-CoV-2 compared with White individuals (online supplemental table S1). Age-adjusted COVID-19 diagnosis rates in White and Asian-American groups were not statistically different. Together, these data clearly demonstrates that some minority groups, including Hispanics and African Americans, were at higher risk of being infected by SARS-CoV-2 in the New York metropolitan area served by the MSHS.
Supplemental material
Supplemental material
No racial disparity is detected among COVID-19 patients for in-hospital mortality
Importantly, we found non-significant differences in age-adjusted in-hospital mortality rates across all racial groups (p=0.068; figure 1). We also found that older age increased risk for mortality (figure 1), as has been previously reported elsewhere.5 6 11 Furthermore, we did not find an association between race and clinical outcome after adjusting for underlying covariates (figure 2), which further suggests racial parity in terms of in-hospital mortality in our cohort.

In-hospital mortality rates of COVID-19 patients breakdown by self-reported races and age groups. In-hospital mortality rate is defined by the number of deceased patients during hospitalisation divided by the total number of COVID-19 patients and PUIs in our cohort. The mortality rates of different age groups are plotted across different racial groups indicated in the legend. The 95% CIs for the mortality rates across race groups are estimated using bootstrap by sampling the patients in that a rolling 10-year age window 500 times. There is non-significant differences in age-adjusted in-hospital mortality rates across all racial groups (p=0.068). PUIs, patient under investigation.

Coefficients from logistic regression models analysing covariates associated with final outcomes (recovered vs deceased) for COVID-19 patients. The estimated coefficients from the logistic regression model, also known as log odds, are plotted for the covariates. An intercept term was included in the model but excluded from the plot, which has a coefficient of −2.07 (p=0.72). Error bars indicate 95% CI. BMI, body mass index; BP, blood pressure; COPD, chronic obstructive pulmonary disease; ICU, intensive care unit; WCC, white cell count.
Factors influencing inpatient mortality
To identify factors involved in the progression and prognosis of the disease, we focused on COVID-19 patients admitted to the hospital. Our study cohort contains 3273 patients with at least 1 day in the hospital, among whom 742 died, 1706 were discharged (presumed recovered), and 825 were still hospitalised as of 15 April 2020 (table 2). We summarise their demographic features, comorbidities, vital signs (online supplemental figure S2, S3) and laboratory tests at admission, as well as the distribution of patients by hospital site, care in the ICU area, and number of days from diagnosis to discharge or last follow-up (table 2).
Supplemental material
Supplemental material
Characteristics of the hospitalised COVID-19 cohort grouped by their outcomes
Associating demographics, hospital site and care area with time to death or discharge
To assess the association between individual covariates and clinical outcomes over time, we estimated the CIFs for in-hospital death and discharge using a univariate competing risks survival analysis. In our full cohort, we estimated that by 10 days postdiagnosis, patients have a 51.1% chance of being recovered and being discharged from the hospital and a 21.7% chance of death (online supplemental figure S4). By grouping our cohort using different demographic and hospitalisation factors, we found the differences in time-adjusted mortality among different racial groups (p=0.003, Gray’s test) is more enriched in Whites due to its older age group (online supplemental figure S1B), but no differences in the CIFs of the recovered patients (p=0.408) (figure 3A). We also found females have better outcomes compared with males; they have significantly higher discharge rates (p=2.36e-4) over time (figure 3B), which translates to shorter in-hospital stays. Hospitalised patient outcomes also differed by hospital and care area types within hospitals, including ICUs, medical and surgical units and other specialties (figure 3C,D). We found that patients admitted to hospitals in Brooklyn and Queens experienced significantly worse outcomes (Gray’s T=248.9; p<0.05) compared with three hospitals based in Manhattan (figure 3C). This can be attributed at least partly to relatively older COVID-19 cohorts in Brooklyn and Queens compared with the Manhattan hospitals (online supplemental table S2). As expected, we also observed drastically worse outcomes for all patients admitted to ICU care areas compared with other care areas (figure 3D).
Supplemental material
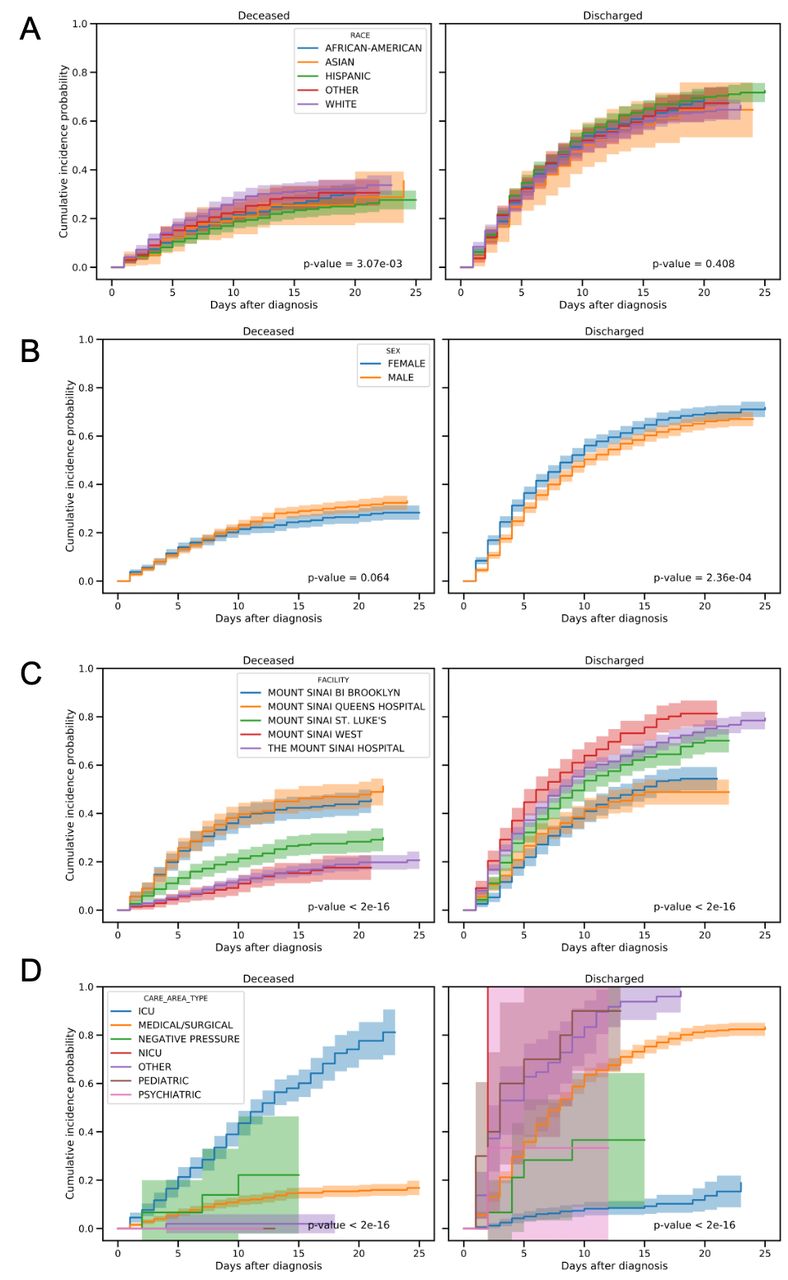
Cumulative incidence functions of two events, deceased and discharged, with univariate competing risks modelling. The left panels show the cumulative probability of in-hospital death for COVID-19 patients whereas the right panels show the cumulative probability of discharged after inpatient stay. The cohort was grouped by different factors including self-reported races, sex, inpatient stays at different Mount Sinai facilities and care area types, shown in rows a through D. The p values from Gray’s test which comparing the subdistribution for deceased and discharge events across groups are shown. A significant p<0.05 indicates significant differences among groups in the cumulative incidence functions for the corresponding events. ICU, intensive care unit.
Multivariate associations between mortality and discharge
Next, we identified aetiological factors associated with death among hospitalised patients with known outcomes (death: N=742; discharge: N=1706) and found many significant associations (figure 2). Risk factors for death included advanced age (OR 1.08 95% CI 1.06 to 1.09; p=7.07e-29), maximum temperature during hospitalisation (OR 1.19, 95% CI 1.08 to 1.32; p=5.51e-4), respiratory rate >25 breaths per minute (OR 1.74, 95% CI 1.13 to 2.68; p=0.012), ICU care area (OR 20.78, 95% CI 12.57 to 35.21; p=6.0e-31), higher WCC (OR 1.06, 95% CI 1.02 to 1.10; p=1.02e-3), elevated serum creatinine >1.2 mg/dL (OR 2.77, 95% CI 2.05 to 3.75; p=3.16e-11) and high ALT (OR 1.004, 95% CI 1.001 to 1.006; p=3.98e-3). We also found patients with higher temperature at admission (OR 0.87, 95% CI 0.79 to 0.96; p=6.65e-3), higher oxygen saturation at admission (OR 0.97, 95% CI 0.95 to 1.00; p=0.0022), as well as those with higher minimum oxygen saturation levels during hospitalisation (OR 0.91, 95% CI 0.90 to 0.93; p=4.05e-25) were more likely to be discharged (logit model OR 0.94, 95% CI 0.91 to 0.97; p=6.67e-4, figure 2).
We also performed subgroup analyses for patients with and without an ICU stay and found advanced age and minimum oxygen saturation were significantly associated with death in both groups of patients (online supplemental figure S5).
Supplemental material
Competing risks survival analyses for inpatient mortality or discharge
We employed a competing risks survival analysis to estimate the HRs of covariates on both mortality and discharge using two Cox proportional hazard models, yielding cause-specific HR for each of the two events across all aetiological factors under consideration. This allowed us to dissect the association of those factors with (1) reducing in-hospital mortality rate and (2) shortening hospitalisation (early discharge). Survival analyses also allowed us to leverage the additional information for patients who were still hospitalised by treating them as right-censored (ie, the final outcome of the patients cannot be determined by the end of the study period).
The cause-specific hazards models showed advanced age significantly increased the risk of in-hospital death (HR 1.05, 95% CI 1.04 to 1.06; p=1.15e-32) and decreased the probability of discharge (HR 0.98, 95% CI 0.978 to 0.986; p=4.07e-21) (figure 4). Minimum oxygen saturation (death: HR 0.985, 95% CI 0.981 to 0.988, p=1.57e-17; discharge: HR 1.09, 95% CI 1.08 to 1.10, p=2.45e-49), care in ICU (death: HR 1.58, 95% CI 1.29 to 1.92, p=7.81e-6; discharge: HR 0.21, 95% CI 0.15 to 0.29, p=1.06e-19), elevated creatinine (death: HR 1.75, 95% CI 1.29 to 1.92, p=7.48e-10; discharge: HR 0.82, 95% CI 0.72 to 0.92, p=1.22e-3) and ALT (death HR 1.002, 95% CI 1.001 to 1.003, p=8.86e-5; discharge: HR 0.998, 95% CI 0.998 to 1.000, p=0.029) also all increased the risk of in-hospital death while prolonging the hospital stay (figure 4). Interestingly, we found that some aetiological factors only significantly influenced one outcome. For instance, BMI (death: HR 1.02, 95% CI 1.00 to 1.03; p=0.021) showed a significant risk and history of COPD had a trend toward risk (death: HR 1.39, 95% CI 0.98 to 1.96; p=0.066) for in-hospital death, but had no significant effects on the length of hospitalisation before discharge. Similarly, African-American had a trend towards lower risk of death (death HR 0.79, 95% CI 0.63 to 0.99, p=0.040) while no significant differences in recovery compared with whites. Meanwhile, maximum temperature during hospitalisation, abnormally high respiratory rate, high WCC, and history of asthma did not have significant effects on in-hospital death, but did significantly increase the length of hospital stay with HR 0.86, 95% CI 0.82 to 0.89, p=5.91e-14; HR 0.66, 95% CI 0.54 to 0.81, p=6.66e-5; HR 0.98, 95% CI 0.97 to 1.00, p=0.011; and HR 0.78, 95% CI 0.62 to 0.98, p=0.031, respectively (figure 4).

HR plots showing the results from the aetiological model. The HR from the cause-specific hazard model with competing risks (death (A) and recovered (B)) are plotted for individual covariates in logarithmic scale. The estimated HR and p values are indicated in the tick labels for those covariates. Covariates with significant elevated HR (HR >1 and p<0.05) or decreased HR (HR <1 and p<0.05) are highlighted in red and blue, respectively. Error bars indicate 95% CI. BMI, body mass index; BP, blood pressure; COPD, chronic obstructive pulmonary disease; ICU, intensive care unit; WCC, white cell count.
Prognostic model to forecast mortality or discharge for inpatients
Given the large sample size, richness in clinical baseline measurements, and well-defined outcomes, we developed a prognostic model for COVID-19. Several significant predictors increased the risk for in-hospital death and decreased chance of recovery including age, BMI, oxygen saturation, elevated respiratory rate, WCC, creatinine and ALT (figure 5). We additionally found that Hispanic and African American patients have slightly reduced mortality rates compared with people of other races when controlling for the initial baseline physiological measurements and comorbidities (figure 5A). Moreover, we found history of cancer increased the length of hospitalisation and delayed recovery, although it did not significantly increase risk of mortality (figure 5B). This prognostic model may be of significant practical value for clinicians and hospital management.

HR plots showing the results from the prognostic model. The HR from the subdistribution hazard model with competing risks (death (A) and recovered (B)) are plotted for individual covariates in logarithmic scale. The estimated HR and p values are indicated in the tick labels for those covariates. Covariates with significant elevated HR (HR >1 and p<0.05) or decreased HR (HR <1 and p<0.05) are highlighted in red and blue, respectively. Error bars indicate 95% CIs. BMI, body mass index; BP, blood pressure; COPD, chronic obstructive pulmonary disease; ICU, intensive care unit; WCC, white cell count.
Assessment of multivariate aetiological and prognostic models
We applied multivariate linear modelling approaches including logistic regression (figure 2) and competing risks survival models (figures 4 and 5) to associate patient charateristics with their outcomes. We found our models were able to fit the dataset well as measured by area under the receiver operating characteristic and concordance index for logistic regression and survival models, respectively (online supplemental table S3). As expected, models using aetiological covariates achieved better fit compared with models using prognostic covariates, which only examined baseline measurements. We also examined potential multicolinearity among the sets of aetiological and prognostic covariates using generalised variance-inflation factors (GVIFs).20 We found GVIFs for all covariates to be <5 (online supplemental table S4, S5), indicating that multicollinearity is not a significant concern in our models.
Association of elevated inflammation or biomarkers and mortality
We also assessed many laboratory tests extracted for hospitalised COVID-19 patients (in addition to WCC, creatinine and AST) and their association with mortality. These laboratory tests were only available for 30%–75% of patients in our hospitalised cohort, and therefore, are not incorporated as covariates for the previous analyses to avoid potential availability biases and decreased sample size. To estimate their associations with mortality, we fitted individual multivariate regression models for each of these lab tests controlling for age, sex and race in the corresponding subsets of cohort where these lab tests are available at baseline. Our analysis found that elevated d-dimer (OR 1.16, 95% CI 1.12 to 1.21; p=1.05e-15), elevated procalcitonin (OR 1.12, 95% CI 1.09 to 1.17; p=1.08e-10) and decreased haemoglobin (OR 1.07, 95% CI 1.01 to 1.13; p=0.04) were significantly associated with increased mortality (online supplemental table S6).
Discussion
Using the largest and most racially diverse US case cohort to date, we have evaluated the impact of demographics and clinical characteristics on inpatient mortality in COVID-19 patients treated in the MSHS. Among 6158 positive or presumed positive diagnosed cases, 3273 (50%) were admitted to one of five hospitals; of those admitted, 742 died (22%) and 1706 recovered and discharged (52%) by the end of the study period on 15 April 2020. While we did observe higher rates of COVID-19 diagnosis among African-American and Hispanic individuals, we did not observe any significant impact of race on mortality among inpatients. Consistent with previous reports,5 6 we found that older individuals and men were at higher risk for mortality, as were critically ill patients cared for in the ICU. We also found that mortality varied by hospital. We identified many clinical features significantly associated with morality that may be important factors to monitor during hospital admission including respiration, temperature, heart rate, WCC count and creatinine. We also estimated HRs for survival, identifying low oxygen saturation, ICU care, elevated creatinine as strong predictors of mortality. Finally, we developed a prognostic model (figure 5) to forecast risk for mortality using only baseline features, which we hope will help clinicians and hospitals identify individuals at highest risk earlier on in disease progression.
Case prevalence in African Americans and Hispanics is disproportionately high in NYC,12 which is reflected in our cohort. However, in our study, racial disparities in positive COVID-19 diagnosis rates did not translate to higher in-hospital mortality for African-Americans and Hispanics, suggesting that inpatient care in a single health system does not further this disparity. Moreover, we found African-Americans are associated with lower mortality rate (figure 4A), while no significant differences in recovery compared with Whites (figure 4B). While this study cannot prove it, this data suggests that there are no intrinsic biological differences which explain racial disparities in mortality. Differences in rates of positive cases may be due to true differences in infection rates, which is consistent with higher case density in areas like Brooklyn and Queens,1 where relatively more African American and Hispanic individuals live.21 These areas are also more densely populated (eg, persons per household is higher relative to Manhattan), making social distancing more challenging.21 In the USA, African-American and Hispanic individuals are more likely to live in crowded housing and unable to social distance. It is also consistent with racial differences in occupation—African American and Hispanic residents are less likely than residents of any other race to be able to work from home, according to the Bureau of Labor Statistics.22 This puts these minority groups at increased risk of infection through elevated exposure. Another probable upstream cause of the racial disparity we observed in infection rates may be differential access to healthcare, particularly to COVID-19 diagnostic tests. Positive case rate differences may also in part be due to limitations on number of available tests in high case density locations, especially in the height of the pandemic. According to testing rates made available by NY State (https://github.com/nychealth/coronavirus-data) combined with population estimates,1 3.5 residents in Brooklyn and 2.7 residents in Queens per 100 have been tested, while 4.2 per 100 have been tested in Staten Island, for example. Test availability may have resulted in biasing testing among those residents to individuals more likely to be positive, thus artificially raising the positive rate by testing fewer individuals seen as less likely to be positive (eg, asymptomatic individuals). Fewer tests also reduce the ability to track and contain the virus, so this may contribute to higher case rates, as well. While we are encouraged to report no in-hospital differences in mortality by race, the burden of mortality remains disproportionately held by African American and Hispanic individuals until rates of infection can be targeted and reduced.
We also found that where patients were treated affected their risk for in-hospital mortality. Patients admitted to hospitals in Brooklyn or Queens were at higher risk than those at one of the Manhattan hospitals. The outer boroughs have consistently higher rates of comorbidities relevant to COVID-19 infection compared with Manhattan.23 We found that average age in patients admitted to hospitals in Brooklyn or Queens was higher and oxygen saturation lower than those in Manhattan (online supplemental table S2). Rates of comorbidities were higher in Queens, as well (56% with any comorbidity vs 36%–47% at other hospitals). Another contributing factor may be case prevalence differences by borough. There were nearly twice as many cases in Brooklyn (>31 000) and Queens (>36 000)—the counties where the Mount Sinai Brooklyn and Mount Sinai Queens hospitals are located, respectively—than in Manhattan (>15 000).1 Hospitals in New York were overwhelmed and struggling to provide sufficient staff and hospital resources to meet the peak needs of the pandemic. It may be that the density of cases outside of Manhattan put additional strain on those hospitals or that only more severe patients were able to be admitted. This is an important health disparity for policymakers to address, as it may contribute to the disproportionate deaths of individuals living in certain neighbourhoods.
The strongest predictors of hospital termination in our data—either death or discharge—were older age, higher BMI, lower oxygen saturation, care in ICU, elevated creatine and ALT levels, and history of COPD (figure 4). These findings were highly similar to descriptive differences reported between critically and non-critically ill hospitalised patients at NYU,5 with the exception of COPD (not significant) and ALT (not reported). They also reported many significant differences in lab values, including CRP, d-dimer, ferritin, and procalcitonin. These lab tests were not routinely collected on all of our patients, however, among patients with available measures, we were able to corroborate their evidence that higher baseline measures of all aforementioned labs were associated with mortality (online supplemental table S6). Given the consistency of these findings, we suggest oxygen saturation, creatine, CRP, d-dimer, ferritin and procalcitonin are relevant tests to monitor throughout hospital admission as they are sensitive to clinical outcome across reported data. We additionally found that high temperature, abnormally high respiratory rate, high WCC, and history of asthma significantly lengthened hospital stays (figure 4), suggesting that these parameters may also be of use for monitoring disease progression and severity.
One major reason for high mortality rates from COVID-19 is that few proven effective therapies exist as yet.11 Many new treatments have been quickly developed or adapted, and despite incomplete evidence of efficacy, have been incorporated into current clinical practice. For instance, heparin was administered as part of standard of care at Mount Sinai as of 10 April 2020 due to the negative impact of SARS-CoV-2 on coagulation and consequent professional recommendations.24 However, data on the efficacy of heparin remains limited. While results from ongoing clinical trials are evolving,25 26 there remains an immediate need for useful information on patient response to pharmacological treatments.
Finally, we discovered several significant baseline predictors increasing risk for in-hospital death: older age, higher BMI, lower oxygen saturation, elevated respiratory rate, elevated WCC, elevated creatinine and elevated ALT (figure 5). Assessing these patient characteristics immediately on hospital admission may help identify individuals at the highest risk and help determine clinical action. We hope this prognostic model may be of significant practical value for clinicians and hospital management.
Our study should be considered in light of several important limitations. First, our data are only based on the five MSHS hospitals in the NYC area. The prognostic models developed in this study may not generalise well to other hospitals with significantly difference patient demographics and treatment protocols. Second, many patients were missing key inflammatory markers like CRP and d-dimer, so we could not include them in our multivariate models without losing significant power. We have provided results for these labs analysed individually (online supplemental table S6) that are in line with other reports,5 and future work incorporating these labs with other measures would yield a more comprehensive ranking of significant indicators of mortality. Additionally, clinical course trajectories of lab values and vital signs across hospitalisation are likely to give valuable insight into disease severity and progression, but analysis at this level requires substantially more repeated measurements per patient than were available at the time of this study. We also expect outcomes to change as local outbreaks become contained (or not) and additional information on novel treatments is made available. However, given the urgent need for prognostic indicators amidst the ongoing pandemic, we believe this report, the largest and more diverse population to date, provides an important initial summary of clinical features associated with mortality and can facilitate risk assessment and care. While further studies are imperative, our ability to use modelling techniques to assimilate and analyse large data sets quickly and efficiently provide a complimentary approach as we await vital data from clinical trials. We anticipate that emerging reports across the country will be combined and compared, as health-related behaviours (both personal and mandated by state and local governments), as well as hospital protocols and resources vary considerably.
In this study, we estimated the effect of key clinical characteristics on mortality among patients hospitalised in one of five Mount Sinai hospitals in Manhattan, Brooklyn and Queens. We found and increased risk of infection based on race, but no difference in inpatient mortality. Based on these findings, first, we recommend considering for hospital admission patients with the following characteristics: older age, higher BMI, lower oxygen saturation, elevated respiratory rate and elevated lab parameters (WCC, creatinine and ALT) as prognostic indicators for increased risk for mortality. Second, we identified changes in respiration, temperature, heart rate, WCC count, creatinine and ALT as particularly important features to monitor during hospital admission to track risk for increased mortality. Together, we hope these estimates can help inform clinicians and hospitals early on which patients are at greatest risk, what ongoing clinical features track with disease progression.
Acknowledgments
We would like to express our sincerest condolences to the patients and their families who underwent from the COVID-19 outbreak. We greatly appreciate the all medical staff who worked together to overcome the COVID-19 outbreak. We are grateful of research opportunity from Eric Nestler. We also thank the helpful comments from Dr. Emma Benn.
References
Supplementary materials
Supplementary Data
This web only file has been produced by the BMJ Publishing Group from an electronic file supplied by the author(s) and has not been edited for content.
Footnotes
Twitter @ZichenWangPhD, @BenGlicksberg, @williamohmd
Contributors LL and ZW had full access to all of the data in the study and takes responsibility for the integrity of the data and the accuracy of the data analysis. Concept and design: LL, RC. Acquisition, analysis or interpretation of data: ZW, Y-HK, LL, RC, WKO, ES, PK, SN, AZ and SG. Drafting of the manuscript: ZW, AZ, LL, WKO, SG and RC. Critical revision of the manuscript for important intellectual content: ZW, AZ, LL, RC, WKO, ES, SG, KA, BSG, AC, GN, PO, AJ, CH, AB, DC, DR and JKDF. Statistical analysis: ZW, Y-HK, KA, LL, RC. Administrative, technical, or material support: LL, ZW, Y-HK, AZ, PK, SN, GM and ES. Supervision: LL, RC and ES.
Funding The authors have not declared a specific grant for this research from any funding agency in the public, commercial or not-for-profit sectors.
Competing interests WKO is a paid consultant to Astellas, Astra Zeneca, Bayer, Janssen, Sanofi, Sema4, and TeneoBio.
Patient consent for publication Not required.
Ethics approval This study was exempted from the Mount Sinai Institutional Review Board.
Provenance and peer review Not commissioned; externally peer reviewed.
Data availability statement Data sharing not applicable as no datasets generated and/or analysed for this study.
Supplemental material This content has been supplied by the author(s). It has not been vetted by BMJ Publishing Group Limited (BMJ) and may not have been peer-reviewed. Any opinions or recommendations discussed are solely those of the author(s) and are not endorsed by BMJ. BMJ disclaims all liability and responsibility arising from any reliance placed on the content. Where the content includes any translated material, BMJ does not warrant the accuracy and reliability of the translations (including but not limited to local regulations, clinical guidelines, terminology, drug names and drug dosages), and is not responsible for any error and/or omissions arising from translation and adaptation or otherwise.