1. Introduction
The COVID-19 pandemic resulted in a state of emergency that has affected every aspect of social and productive life in many countries, including school life. Due to school and university closures, about 1.6 billion students in 190 countries around the world stayed home [
1].
In Italy, at the beginning of March 2020, a temporary suspension of classroom teaching activities was organised, which continued until the end of the school year. To cope with the emergency, virtual learning environments were arranged, which allowed distance learning activities to continue.
Distance Learning “is a complex process that requires careful planning, designing and determination of aims to create an effective learning ecology” [
2] (p. ii). For this reason, the teaching methods applied in Italy and other countries to deal with emergencies have been more correctly called “Emergency Remote Teaching” [
2,
3].
Many studies have investigated how schools dealt with this emergency situation and what the consequences were. Some of these studies focused on the role of technology, both from the point of view of the availability of instruments for students and schools, and the adequate preparation of teachers in the use of technologies in teaching. In relation to the first aspect, the problem of the digital divide and educational equity emerged [
4]. The fact that not all students had the necessary technology available at home negatively affected the success of their learning experiences [
5], especially for students with special education needs [
6]. In this sense, the experience of emergency remote teaching raised the issue of ensuring a “universal remote public education” [
7].
Regarding schools and teachers, previous experience in the use of digital learning platforms was crucial in coping with the experience [
8]. Mostly, a lack of digital skills among teachers [
9,
10] and an unpreparedness for online teaching in particular [
11] were reported. As in other countries, the Emergency Remote Teaching experience found Italian educational institutions unprepared; in a short time, they had to review the teaching methods and strategies implemented previously.
The Italian Society for Educational Research (SIRD) carried out a survey to determine the methods used and the positive and critical aspects teachers identified; more than 16,000 teachers of all levels took part in it [
12,
13].
To best prepare schools and teachers to use distance learning, whether in emergency situations or not, it is essential to know what worked and what did not work during the Emergency Remote Teaching experience.
This paper is an in-depth exploration of some aspects of the SIRD national survey. More specifically, it aims to: (1) examine any particular features of the answers given by the teachers of two central Italian regions, Tuscany and Umbria, more strictly in relation to the teaching and assessment aspects and to the previous experience of preparation for Distance Learning (DL); and (2) investigate the association between the didactic and assessment strategies adopted in the national sample, the previous training, and the perception of the quality of the experience in relation to the effectiveness for student learning and the possibility of carrying out an appropriate student performance assessment. In Italy, the National Assessment System analyses the data for five macro geographical areas (North-West, North-East, Centre, South, and Islands), as well as at national and regional levels. The focus on the two regions of Tuscany and Umbria represents an initial attempt to analyse the data at the regional level before moving to the macro area level by integrating data from the other central Italian regions, Marche and Lazio. In Tuscany, a follow-up was also conducted in the following school year, but this aspect will only be briefly mentioned as only the assessment strategies have been analysed at the moment.
2. Materials and Methods
The submitted study focuses on the data collected by the national SIRD survey “For a comparison on the distance teaching methods adopted in Italian schools during the COVID-19 emergency period”, which is the first national research promoted by a scientific society in collaboration with the Teachers’ Associations [
12,
13]. The objective of the national research was to understand and learn from the first emergency distance learning experience through discussions with teachers. The research was carried out through an anonymous online questionnaire consisting of 122 questions, 6 of which were open-ended. The questionnaire was organised into ten topics:
Impact on the redesign of teaching;
Technological tools used;
Teaching methods used: synchronous and asynchronous;
Teaching strategies used;
Preparation for DL;
Critical issues encountered;
Collaboration;
Student assessment;
Interventions for Specific Learning Disorders and Special Educational Needs;
Evaluation of the experience.
The open-ended questions focused on students’ difficulties in following DL (from the teachers’ point of view), DL strengths (2 answers), DL weaknesses (2 answers), reflections, and comments.
The survey used a non-probabilistic sample. The completion of the questionnaire was conducted through relations between pedagogical academics and schools, and with the cooperation of teachers’ associations. The research was conducted from April to June 2020. The teachers who responded represented about 2% of Italian teachers. For an in-depth examination of the structure of the questionnaire and an overall review of the national results [
12,
13] and other regional differences [
14], please refer to studies that have already been published. The results of the national survey will be recalled in this study.
The present study had two main objectives: (1) to examine any particular features of the teachers’ answers regarding specific aspects (teaching and assessment strategies, previous training in DL); and (2) to investigate the association between the teaching and assessment strategies adopted, as well as previous training in DL, and the assessment of the quality of the experience in relation to the effectiveness for student learning and the possibility of carrying out an appropriate student performance assessment.
In line with these objectives, the following aspects were selected from the ten topics covered by the questionnaire: (1) the impact on the redesign of teaching planning (in relation to learning objectives, teaching strategies, and assessment methods); (2) the way in which the teaching was carried out (synchronous and asynchronous); (3) the teaching strategies used; (4) student assessment methods; (5) the teachers’ readiness for DL; and (6) an overall evaluation of the experience (in relation to effectiveness for student learning and the possibility of carrying out an appropriate performance assessment) and critical issues (in relation to reorganizing the planning and the assessment methods). Secondly, concerning assessment and teaching aspects, the categories that emerged from the analysis of the open-ended questions were examined [
15,
16].
The information will be useful to better target teacher training strategies both locally and nationally.
Overall, more than 16,000 questionnaires were collected from the national survey. There were 1160 Tuscan units of analysis (2.2% of the teachers), with 170 in Umbria (1.3% of the teachers). Given the peculiarity of the variables we chose to analyse, kindergarten teachers and support teachers were excluded from our sample. These teachers, in our opinion, constituted two subgroups with different characteristics compared with the curricular teachers and the teachers at the other school levels. It was, therefore, decided to exclude them.
Table 1 shows the distribution of the sample by school level and geographical area (without kindergarten teachers and support teachers). As the distributions were different, comparisons of the variables of interest will be conducted within each school level. The sample was non-probabilistic, so it was not possible to extend the results of this study to the entire population of Italian teachers. Lastly, the sample of Umbrian teachers was much smaller than the other two sample groups; this resulted in a lower power of the statistical tests used, which did not indicate, in the Umbrian group, significant differences with respect to the others where a statistical difference would probably have emerged with a larger sample.
In general, we will focus on the differences that were statistically significant, while highlighting certain aspects that we consider notable, despite their non-statistical significance.
The comparison between averages was performed by means of analysis of variance, including the geographical distribution (Italy, Tuscany, and Umbria) as a factor. Given the problem of non-homogeneity of the groups, the Games–Howell test was used for post hoc comparisons, which is more robust when the assumption of homogeneity of the groups is not met. Since several items or scales do not have a normal distribution, non-parametric tests (Kruskal–Wallis or Mann–Whitney U) were compared; in the event of divergence regarding significance values, the values of the non-parametric tests were considered. Analyses were performed using the software SPSS Statistics v.26.
3. Results
3.1. Comparison between the National, Tuscan, and Umbrian Samples
3.1.1. Educational Redesign, Teaching Methods, and Strategies
Conducting teaching activities in virtual learning environments required teaching planning reorganization. One of the first aspects investigated by the SIRD survey thus examines teachers’ commitment to educational redesign. Therefore, we investigated the teachers’ answers in relation to the redesign of (1) learning objectives, (2) teaching strategies, and (3) assessment methods. As already noted [
13], in general, the effort in reorganizing was stronger in the first school cycle and relatively weaker in the upper secondary cycle. Focusing on the three selected aspects, the greatest commitment appeared to be related to teaching strategies and assessment methods, and not to learning objectives redesign (although high).
We are interested in investigating whether there was a significant difference in relation to these aspects between the Tuscan and Umbrian teachers and the national sample. In this regard, a greater effort by the Tuscan lower secondary school sample to reformulate assessment methods was observed (
Table 2A). For this aspect and for the same level of school, it is also worth noting the lower average value in Umbria, though the difference with the national and the Tuscan averages was not statistically significant, probably for the reasons mentioned.
With regard to teaching methods, both synchronous (in presence, live with the students) and asynchronous (sending materials, audio, e-mails, etc.) learning were widely used during the DL, with asynchronous being more frequently used in primary schools and synchronous being more used at the other school levels. Teachers in Tuscan lower secondary schools showed a more frequent use of synchronous modes than the national average (
Table 2B). In the Tuscan and Umbrian upper secondary schools, the trend of greater use of synchronous modes also emerged with respect to the national sample, although the difference was not statistically significant.
The questionnaire then investigated the frequency of use of transmissive and interactive teaching strategies. The frequency of interactive teaching strategies was rather low; these strategies were little used (even less among primary school teachers) in contrast to the extensive use of transmissive strategies. In the comparison between the two regions and the national average, overall, no differences emerged in the use of transmissive teaching strategies, except for a greater use of face-to-face explanations in Umbrian secondary schools; this finding is consistent and partly coincides with that of the synchronous mode (
Table 2D). A few more differences were registered within the interactive modes (
Table 2C)—in the Tuscan sample, collective discussion and unstructured group work seemed to be used more frequently by primary school teachers, short individual or group presentations were used more often by lower secondary school teachers, and upper secondary school teachers used group work and the flipped classroom strategy less frequently than the national average. The Umbrian sample, especially primary schools, apparently used interactive strategies more frequently than the national average, but the small number of teachers did not allow for the research to go beyond this point.
3.1.2. Assessment Methods
As Lucisano et al. already noted [
13], one of the most critical and difficult aspects for teachers to deal with was learning assessment. The questionnaire recorded both the type of guidelines for assessment and the type of tools used (classified into ‘traditional’ and ‘alternative’ assessment tools) (
Table 3). Although some subgroups were smaller than 100, percentage values are given in
Table 3 and
Table 4. The numerical bases of all subgroups are present in the tables and the reader can assess the relevance of the percentage values.
In general, more primary teachers used different assessment criteria to those they would have usually used. It would be interesting to further examine what criteria were used, but, unfortunately, the data collected do not allow us to conduct further in-depth investigations beyond noting, as we will see more clearly later, a widespread difficulty in carrying out appropriate student performance assessments.
In relation to the assessment methods used, those most common at a national level in primary schools were written assignments (78.7%), followed by tests (63.3%), oral questions (62.0%), and research and other practical work (59.0%). The first three methods were also the main ones used by Tuscan primary school teachers who, however, used fewer written assignments (69.7%) and tests (55.8%). Tuscan primary teachers seemed to have used fewer assessment methods.
The results in Umbria were different: the first two modes, with the same percentage (73.5%), were written assignments and research and other practical work, the latter being much more used than the national and Tuscan averages. Additionally, to be noted is the greater use of group work (29.4%).
At the national level, in lower secondary schools, written homework was most used (80.5%) followed by research and other practical work (79.9%), and tests (77.4%). While in Tuscany, oral questions and research and other practical work prevailed (79.3%), followed by tests (78.4%), in Umbria, the three traditional methods were the most used at the first level, and there was also less use of alternative assessments compared with the national data.
Finally, in upper secondary schools, oral questions were the most used nationwide (81.7%), followed by written homework (75.6%), and research and other practical work (71.1%). The first two were also the most used in Tuscany, where, however, tests ranked third (73.1%). It is worth noting the lower use of all alternative modes compared with the national data (
Table 3). Umbria also used mainly traditional methods, but the use of specifically constructed assessment rubrics was much higher than the national and Tuscan data (74.1%), and, to a lesser extent, group work (42.6%). On the other hand, the use of research and other group work was lower than the national data.
3.1.3. Previous Training in DL
The survey also investigated teachers’ readiness for DL in the use of the electronic register and training in new technologies and distance learning.
A lack of specific training in distance teaching appears evident, but the Umbrian secondary schools sample showed previous training in both new technologies and DL (
Table 4). However, it must be remembered that the Umbrian sample was very small, and also keep in mind the non-probabilistic type of sampling, which is why the data must be read with great caution.
Tuscany, on the other hand, was in line with the national average, even though there was less willingness to use distance teaching methods at the end of the emergency among lower secondary school teachers. The difference was not statistically significant, but it was nevertheless an interesting fact when considered in relation to the whole experience, which was apparently more negative than the national average, as will be seen below. On the contrary, Umbrian teachers seemed to be more inclined to use DL in the future.
3.1.4. Quality of Experience Evaluation and Critical Aspects
Considering distance learning quality evaluation, the questions regarding the perceived effectiveness of the experience and the opportunity for an appropriate performance assessment were selected. Overall, these represent two of the most critical points of the experience [
13]. As far as the perception of effectiveness regarding student learning was concerned, Tuscany showed a lower value than the national average in all school orders and grades (
Table 5). Umbria was also in line with Tuscany, which recorded a significantly lower level in lower secondary schools regarding the possibility of carrying out appropriate student performance assessments.
The criticality of redesigning, planning, and assessment methods was highest in Tuscany.
3.2. Qualitative Data
Using the same sample, the results obtained from the categorical analysis of the open-ended questions of the questionnaire (aimed at highlighting strengths and weaknesses of DL), difficulties students experienced (as perceived by the teachers), and further comments and reflections are described below [
15,
16]. For each question, percentages were calculated for the total number of subjects, both at national and regional levels. Considering the focus of the present paper, the analysis of the answers concerning students’ difficulties will not be covered.
3.2.1. Teaching Planning, Teaching Methods, and Strategies Redesign
From the analysis of the answers regarding the strengths of the DL, in the sub-category “Innovation and didactic strategies/methodologies”, the percentage of teachers who identified a positive influence of distance learning on didactic innovation, through the use of new strategies, was higher for the Tuscan sample (9.44%) than for the national (6.43%) and Umbrian (4.58%) samples. These data can be read coherently with the quantitative data as a greater effort of Tuscan teachers in the remodulation of teaching. However, investigating the trend in regional answers divided by school level, opposite patterns emerged for Tuscany and Umbria. The percentage of answers reporting educational renewal in primary schools was higher in the Umbrian sample (7.35%) than in the national sample (6.46%) and the Tuscan sample (3.83%). Such a difference was reversed for higher levels: in Umbria, it was drastically reduced in upper secondary schools (1.85%). Therefore, in Umbria, the higher the school level considered, the lower the redesign of teaching and the use of innovative strategies.
The data from Tuscany show an opposite trend, in line with the national data: the number of teachers who identified the use of new teaching strategies as a strong point of DL increased in lower secondary schools (5.90%) and even more so in the upper secondary school (7.18%) levels, surpassing the national data (6.41%).
This figure is consistent with that which emerged from the answers to the question that highlighted two weak points of the DL. The perception of the inadequacy of the learning environment for carrying out practical/laboratory activities and collaborative activities was generally greater for Umbrian teachers (3.31%) compared with the Tuscan (2.67%) and national (2.45%) data. The difference persisted when observing the higher school levels: regarding upper secondary school, the percentage of answers that highlighted an inadequate learning environment was again higher for Umbria (4.36%) than the national figure (2.25%) and Tuscany (3.18%). On the contrary, the Umbrian qualitative data for the primary school were in line with those of the other samples; a lower perception of the inadequacy of the learning environment emerged. The data can probably be interpreted according to what was described above: a lower redesign of teaching strategies can lead to a greater perception of the inadequacy of the learning environment.
It is also important to pay attention to the response frequencies concerning difficulties in designing and achieving objectives.
It is possible to assume that the didactic redesign led to greater difficulties in planning activities. At a general level, the data were comparable between Italy (3.98%) and the two regions (Tuscany: 3.54% and Umbria: 4.20%). However, the percentage of primary school teachers who highlighted critical points in teaching planning was higher in Umbria (7.35%) than in Tuscany (4.74%) and Italy (4.92%). The data are in line with the results regarding the strengths, with a greater teaching redesign at the primary school level for the Umbrian sample.
Furthermore, in the last section of the questionnaire where the teachers expressed comments or personal reflections on the DL experience, a relevant aspect emerged in line with what has already been described regarding the strengths and the quantitative data.
The percentage of primary school teachers who commented on the discovery of new teaching strategies was higher in Umbria (2.94%) than in Tuscany (1.09%) and at the national level (1.48%). The percentage of evidence relating to didactic innovation in the Umbrian data decreased when considering higher levels of school—for upper secondary schools, the Umbrian percentage dropped (1.85%) to the same values as those for Tuscany (1.66%%) and the national level (1.85%). Therefore, in Umbria, the higher the school grade considered, the lower the redesign of teaching. In Tuscany, on the other hand, the reverse trend (observed for strengths) was not observed; therefore, there was no increase in frequencies as a function of school grade. This was probably due to the specific character of the question itself, which called for more in-depth analysis.
3.2.2. Assessment Methods
In the sub-category “Monitoring, assessment, and self-assessment” of the question on strengths, the national data (1.83%) were similar to the regional data from Tuscany (1.42%) and Umbria (1.15%). Teachers emphasised faster correction of tests, more immediate results, better feedback, and more individual monitoring. However, it should be noted that primary school teachers in Umbria did not seem to have found any strength in the differentiation of monitoring, assessment, and self-evaluation methods (0%).
The qualitative data for lower secondary schools in Tuscany, on the other hand, were in line with the quantitative data—the teachers seemed to have made a greater effort to diversify their monitoring, assessment, and self-evaluation methods compared with the national and regional data in lower secondary schools (2.36% Tuscany; 2.33% Umbria; and 1.87% National) and upper secondary schools (2.35% Tuscany; 1.85% Umbria; and 1.64% National).
The teachers in Umbria (8.44%) and Tuscany (8.04%) also exhibited fewer weaknesses in the sub-category “Difficulties in assessment processes” than the national data (12.98%). This difference did not emerge in relation to the difficulties encountered in monitoring and checking.
The limited possibility to carry out appropriate performance assessments, as from the quantitative data for the Tuscan secondary school teachers, was in line with the data of the sub-category of comments concerning difficulties in assessment and follow-up.
Indeed, Tuscan teachers reported a higher percentage (3.30%) than those in Umbria (0%) in lower secondary schools. They were instead in line with the national data of 2.78%. The Tuscan upper secondary schools sample reported a higher percentage (4.70%) than the national data (2.37%) and Umbria (3.70%). The case of Umbrian secondary schools is interesting, since they were the only level in which teachers reported difficulties (3.70%).
3.3. Effectiveness for Student Learning and the Possibility of Appropriate Performance Assessment
3.3.1. The Role of Training
These insights were related to the national sample considered in this study. The association of a number of factors with two specific aspects of the DL experience evaluation was explored in depth: (1) the effectiveness for student learning and (2) the possibility of appropriate performance assessment.
One of the first analyses concerned the comparison of prior learning and averages of the perceived effectiveness for learning on the one hand, and the possibility of appropriate performance assessment on the other.
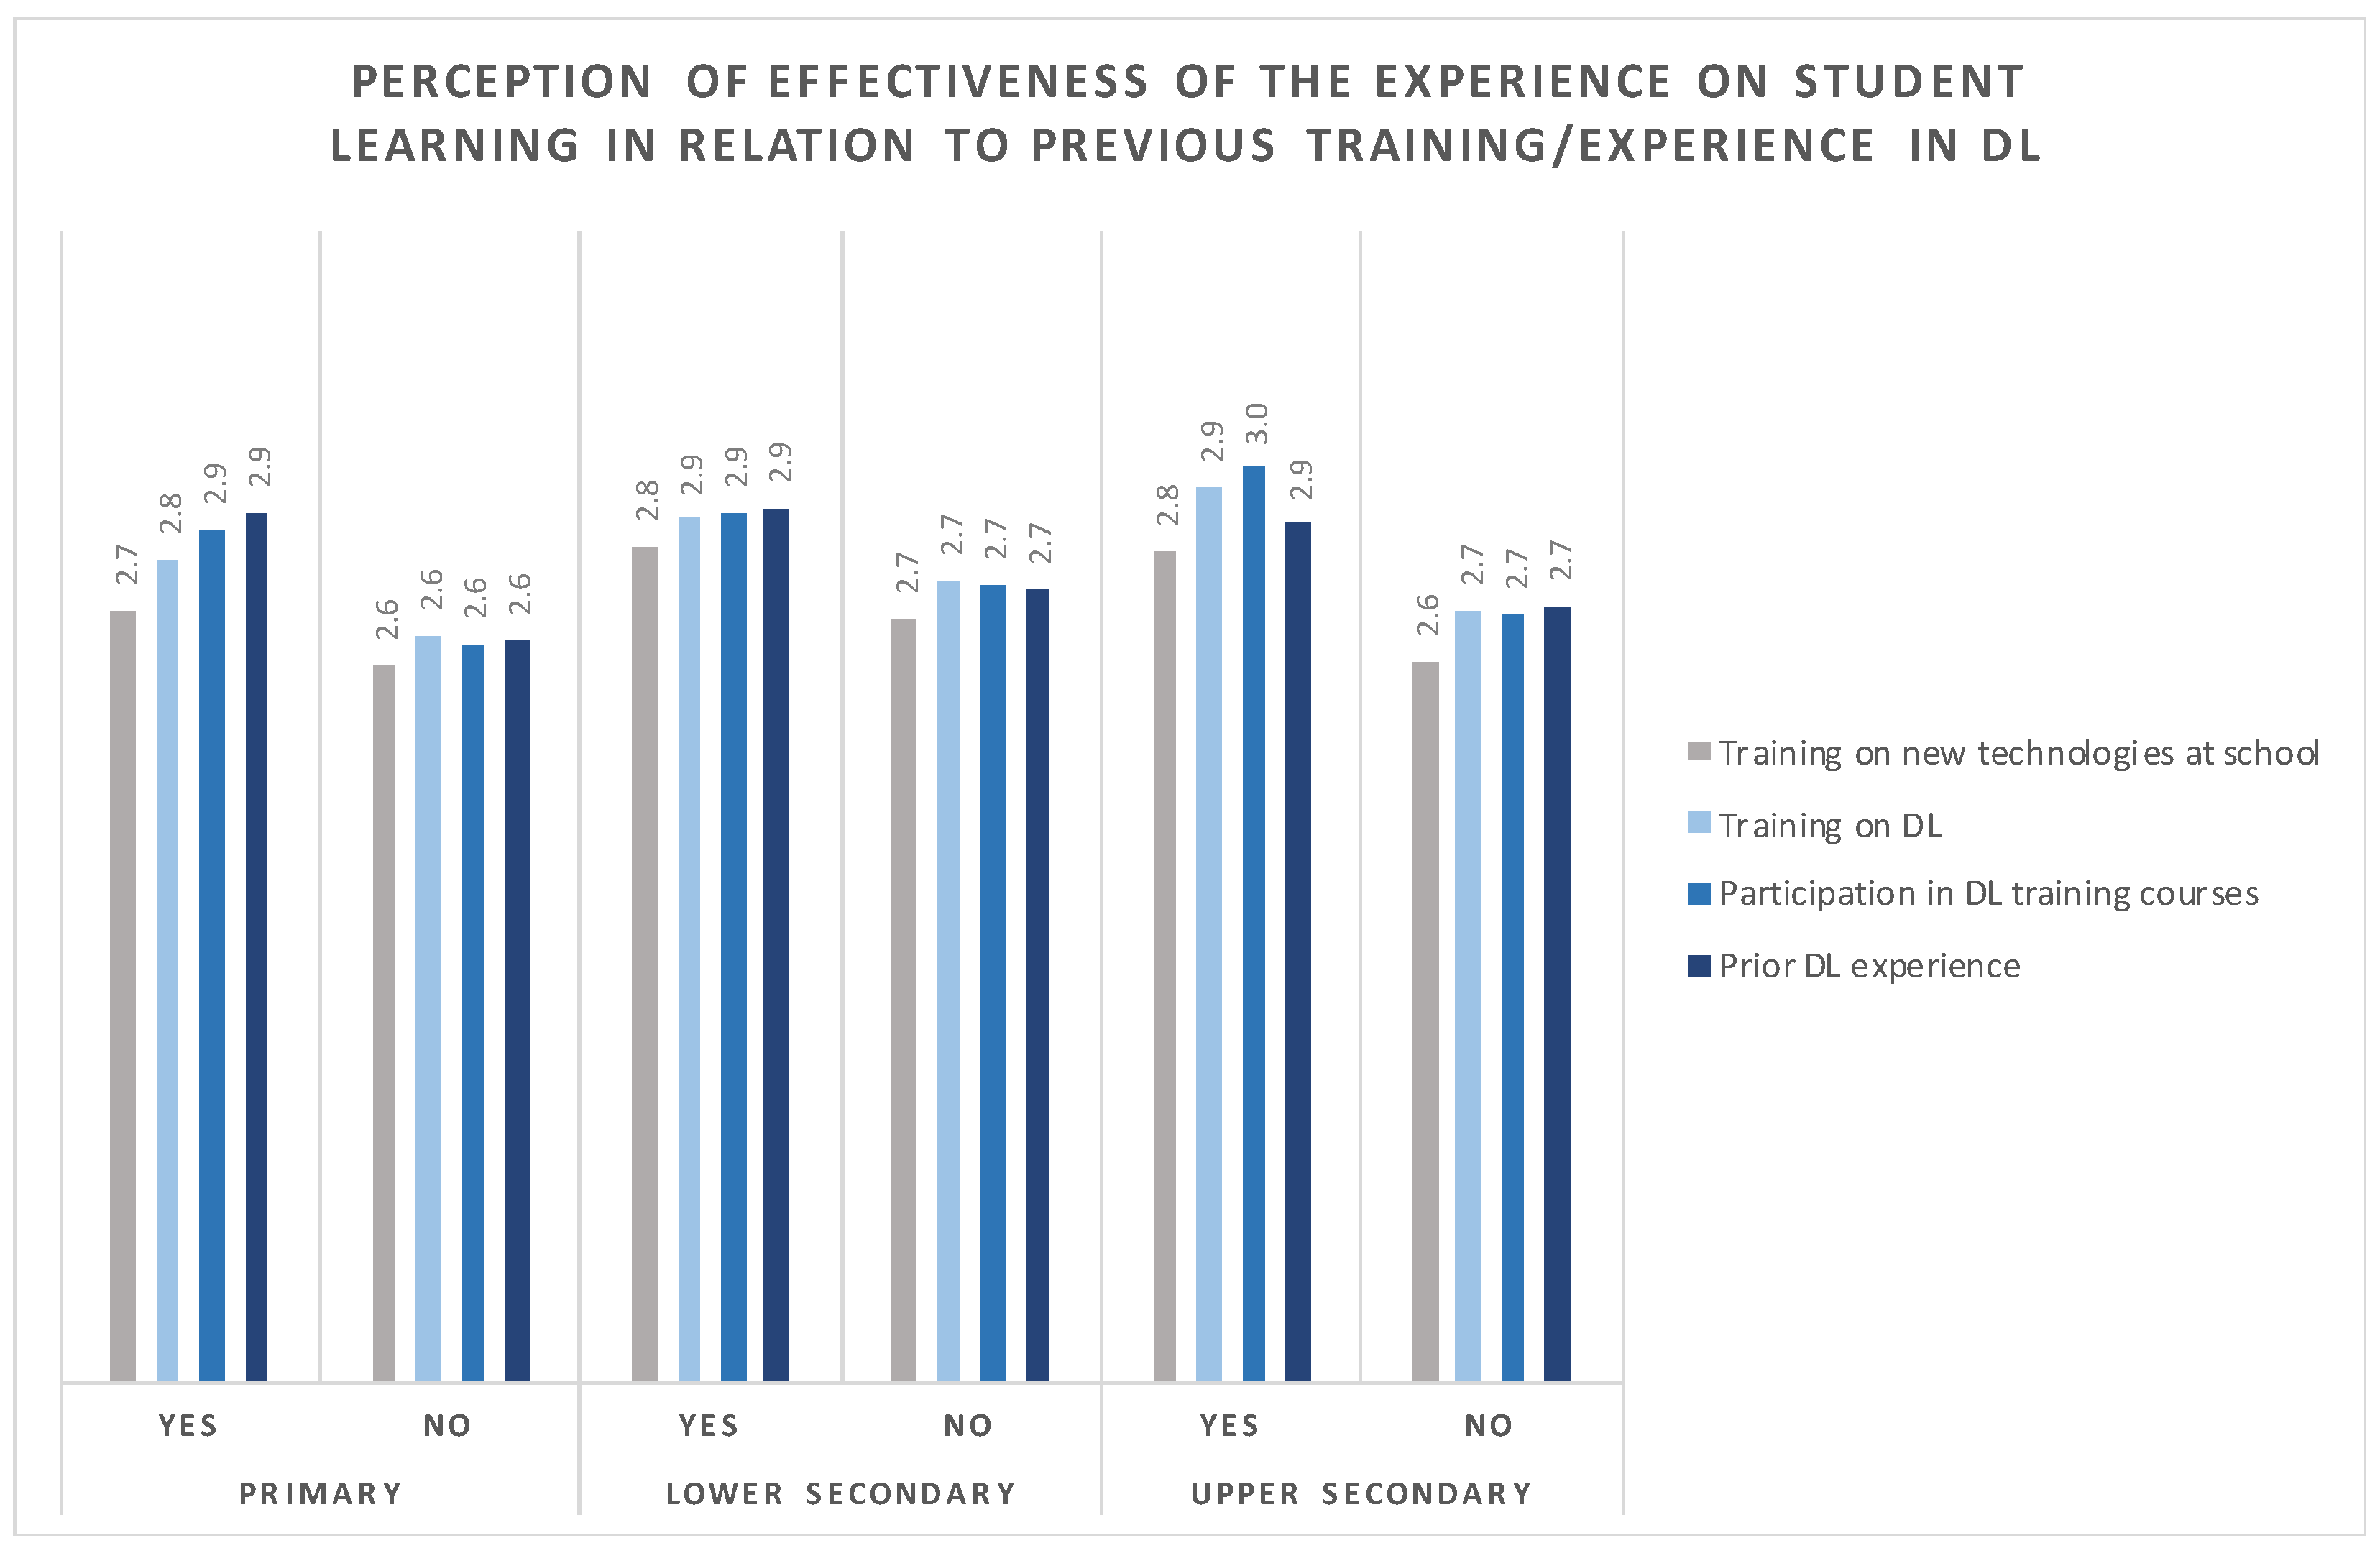
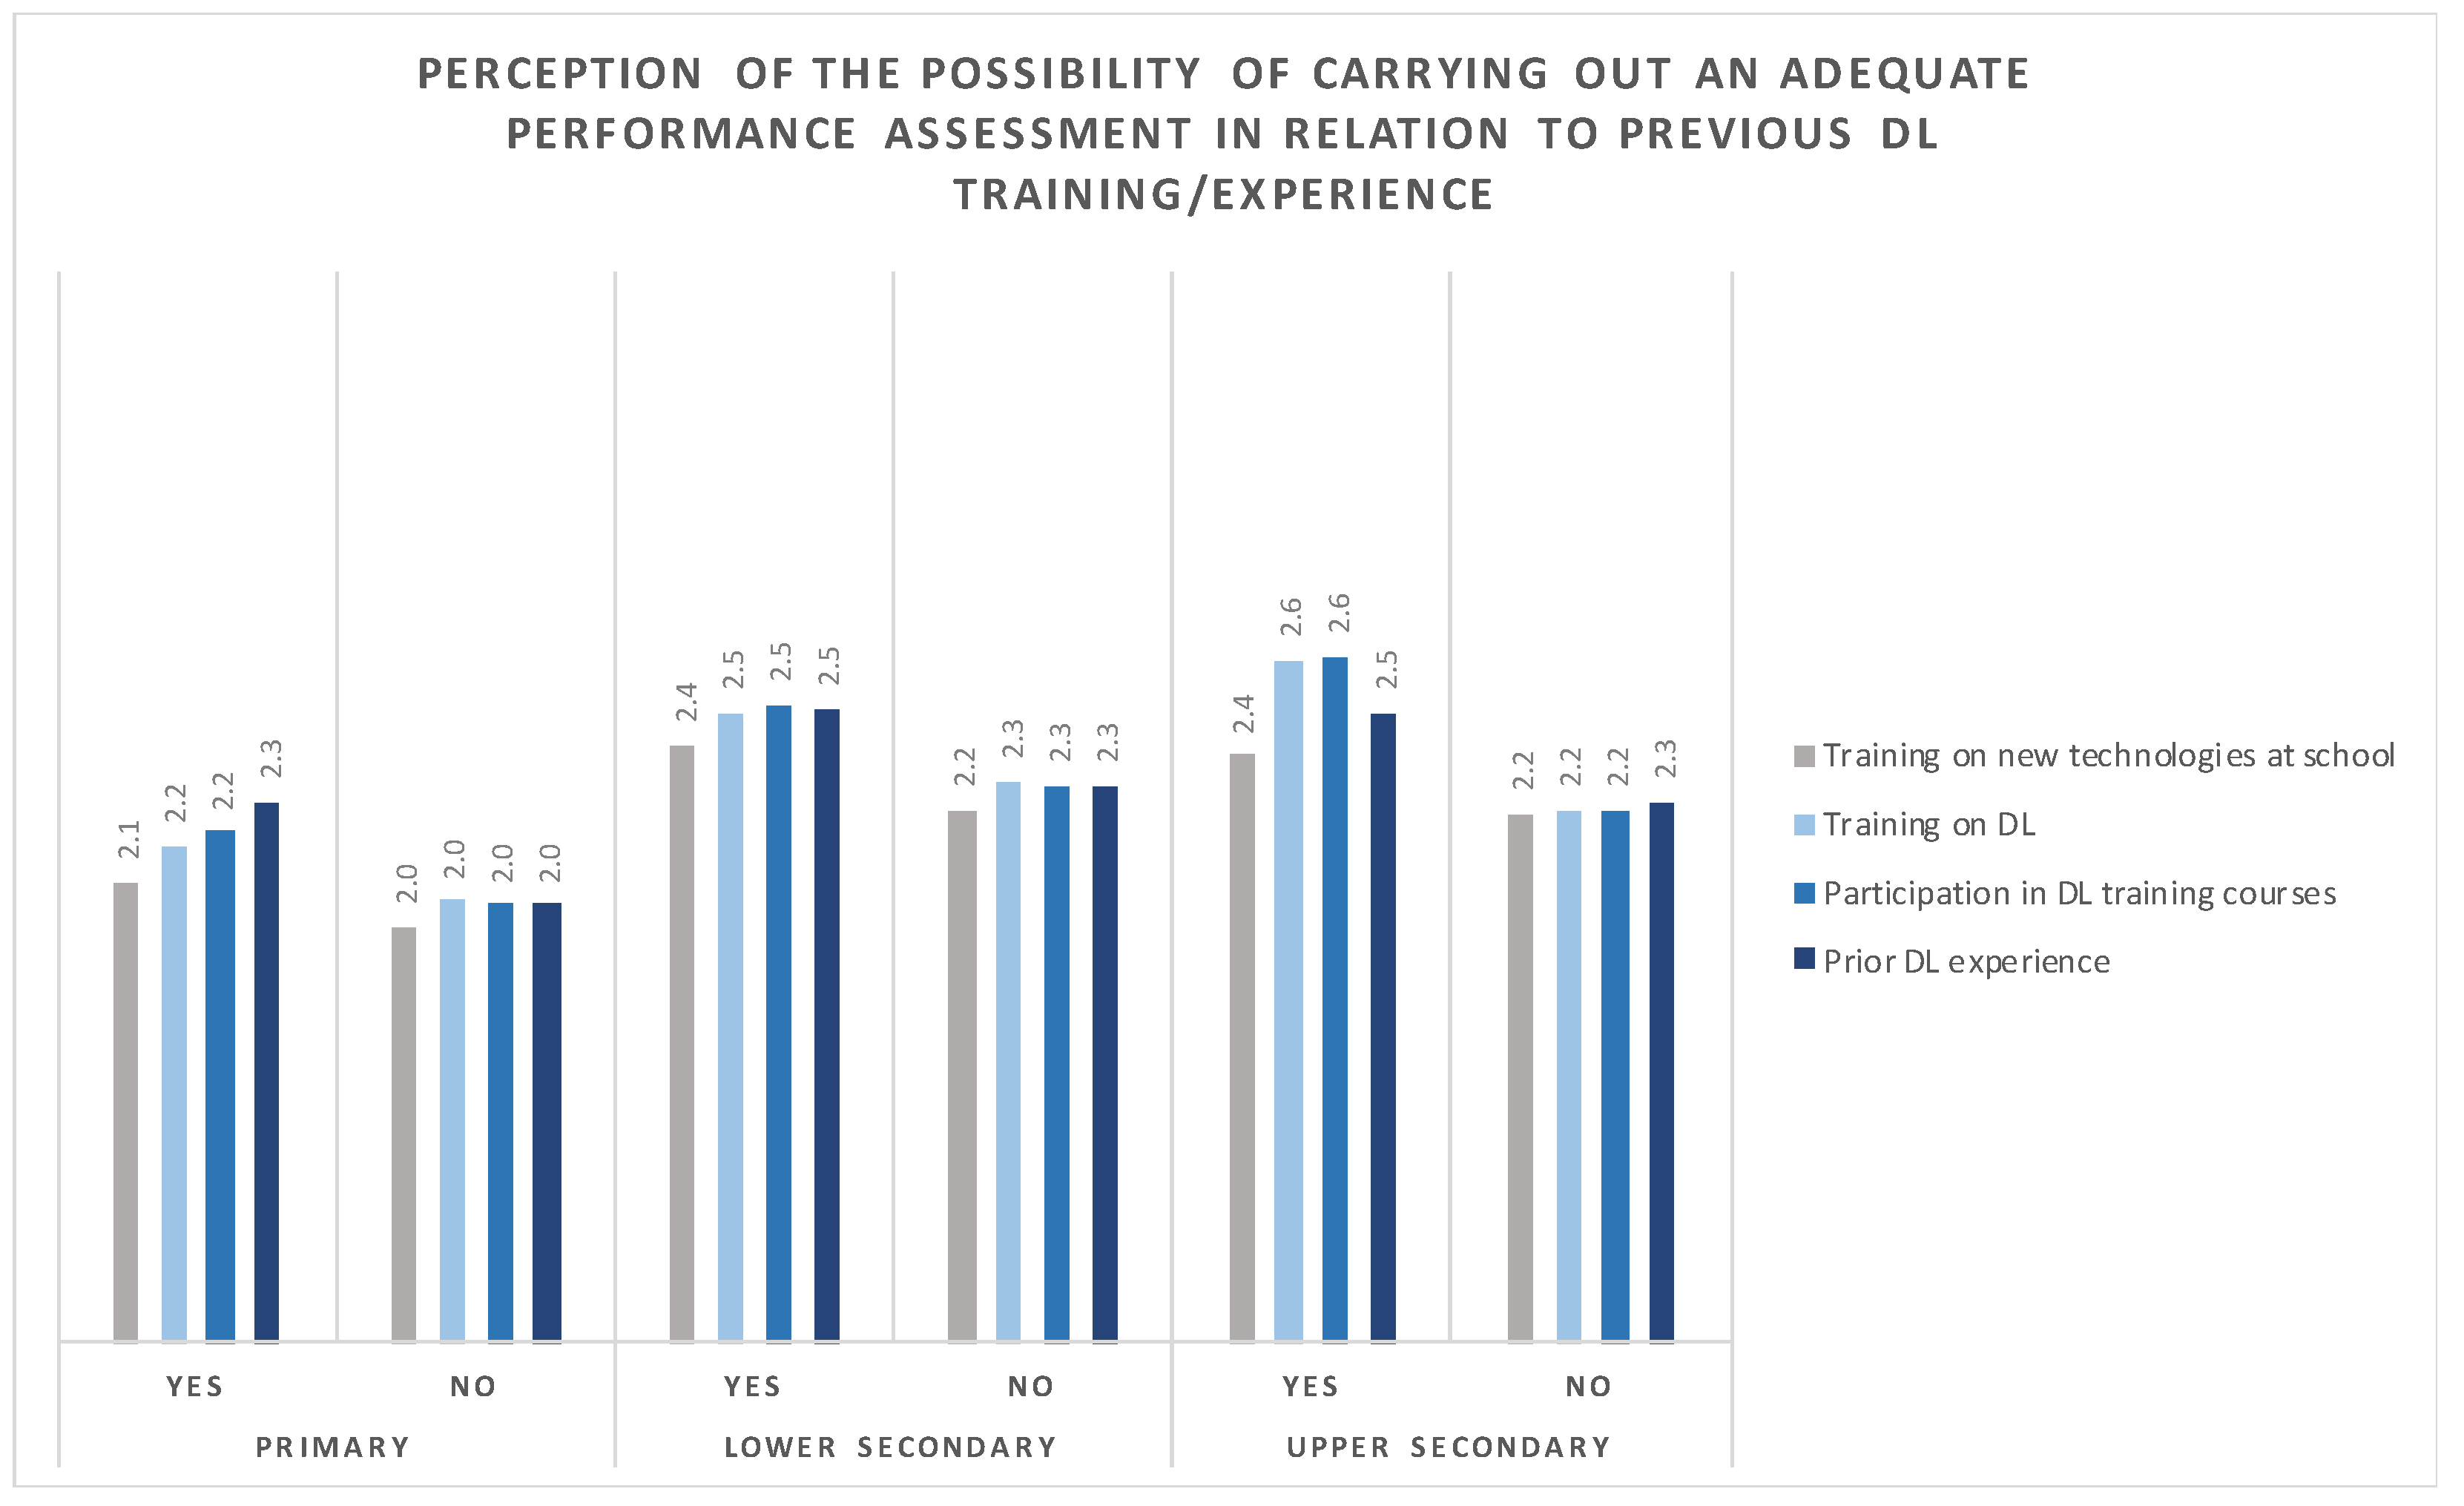
All the factors in
Table 4, except having already used the electronic register, were reported to have a significant effect (
p ≤ 0.001) on the evaluation of the experience. However, the effect size was very low, especially in primary and lower secondary schools (η
2 never exceeded 0.01), and slightly higher in upper secondary schools (η
2 reached a maximum of 0.03 in relation to P4 “Have you already participated in training courses on DL?”). It should be remembered that the experience of training and practice of DL was more widespread among upper secondary school teachers than among their colleagues at the other levels. More in-depth analyses would be necessary. However, simply comparing the values of the effect sizes, it is possible to observe that, concerning the quality assessment of the experience with relation to the effectiveness of student learning and the possibility of an appropriate performance assessment, the previous training in the new technologies, despite being widespread (over 65%,
Table 4), had little effect at all school levels on the two variables in question (
Figure 1 and
Figure 2).
Previous experience in the school of specific training in DL (both within the school and, above all, personally experienced by the teacher) appeared to be somewhat more effective, while having already practised forms of distance learning appeared to have a greater effect than training only among primary and lower secondary teachers, but not among upper secondary teachers, for whom previous training seemed to have a greater effect (
Figure 1 and
Figure 2).
3.3.2. The Role of Assessment Methods
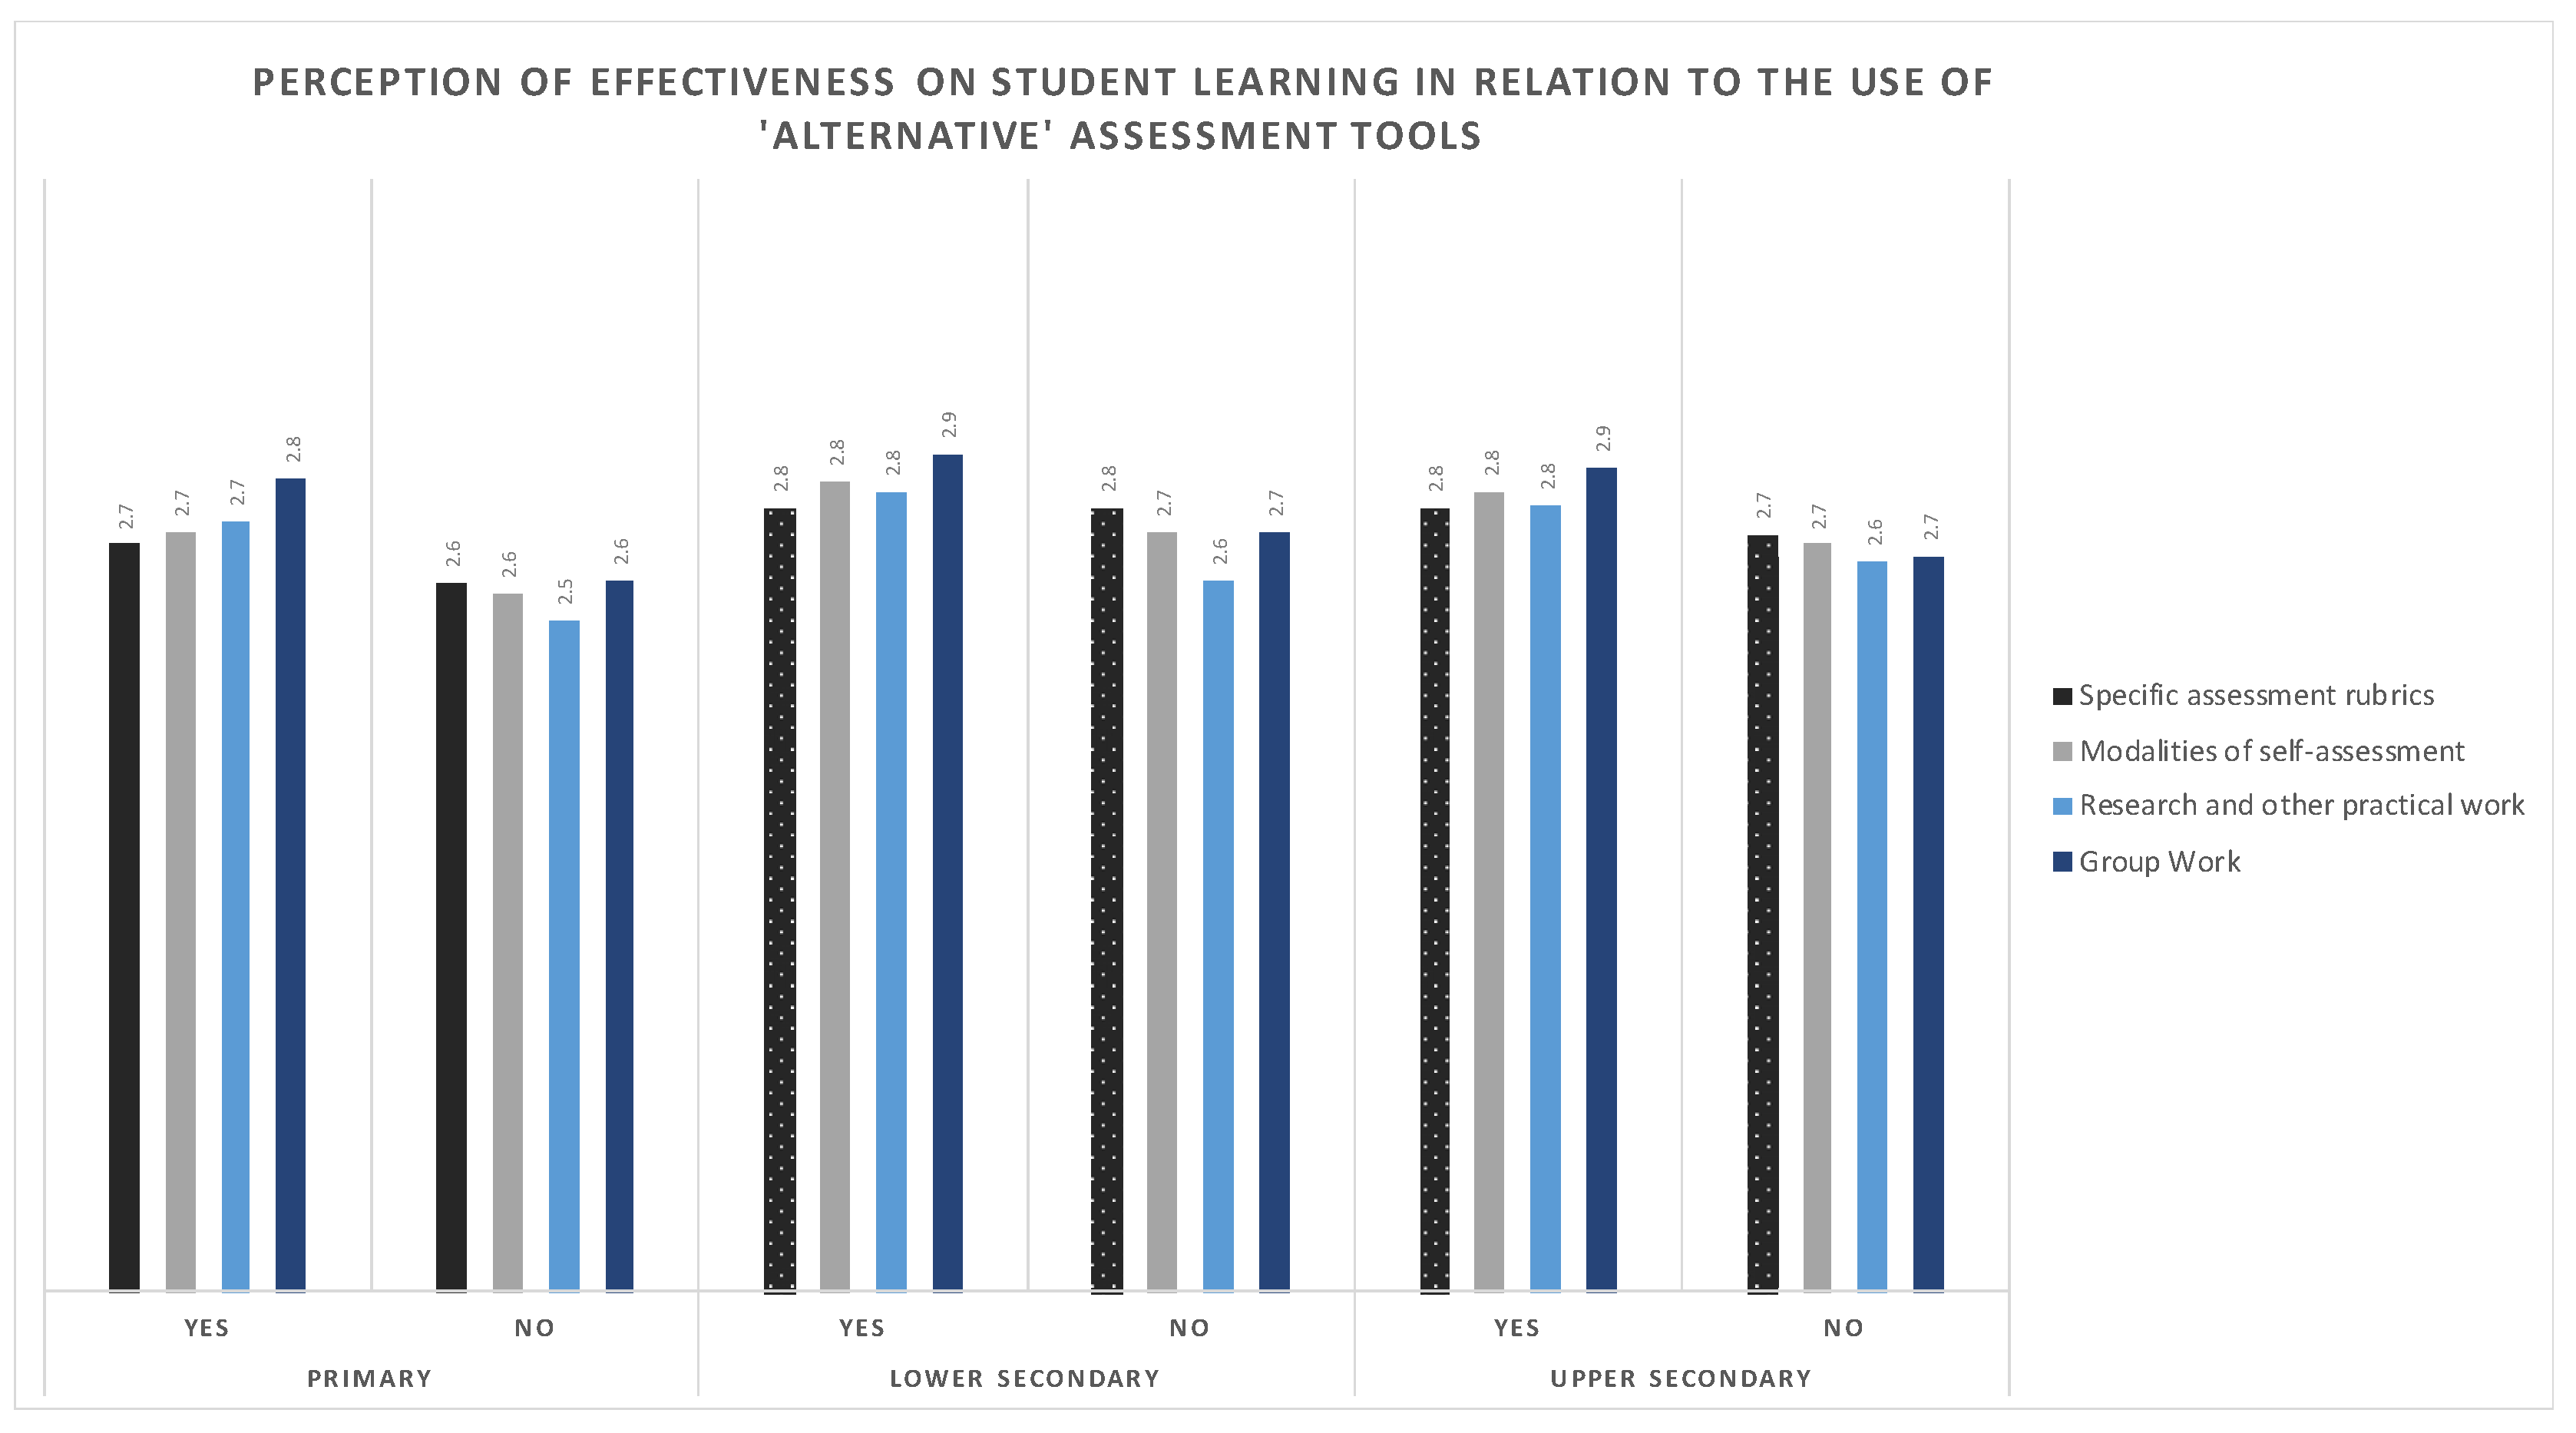
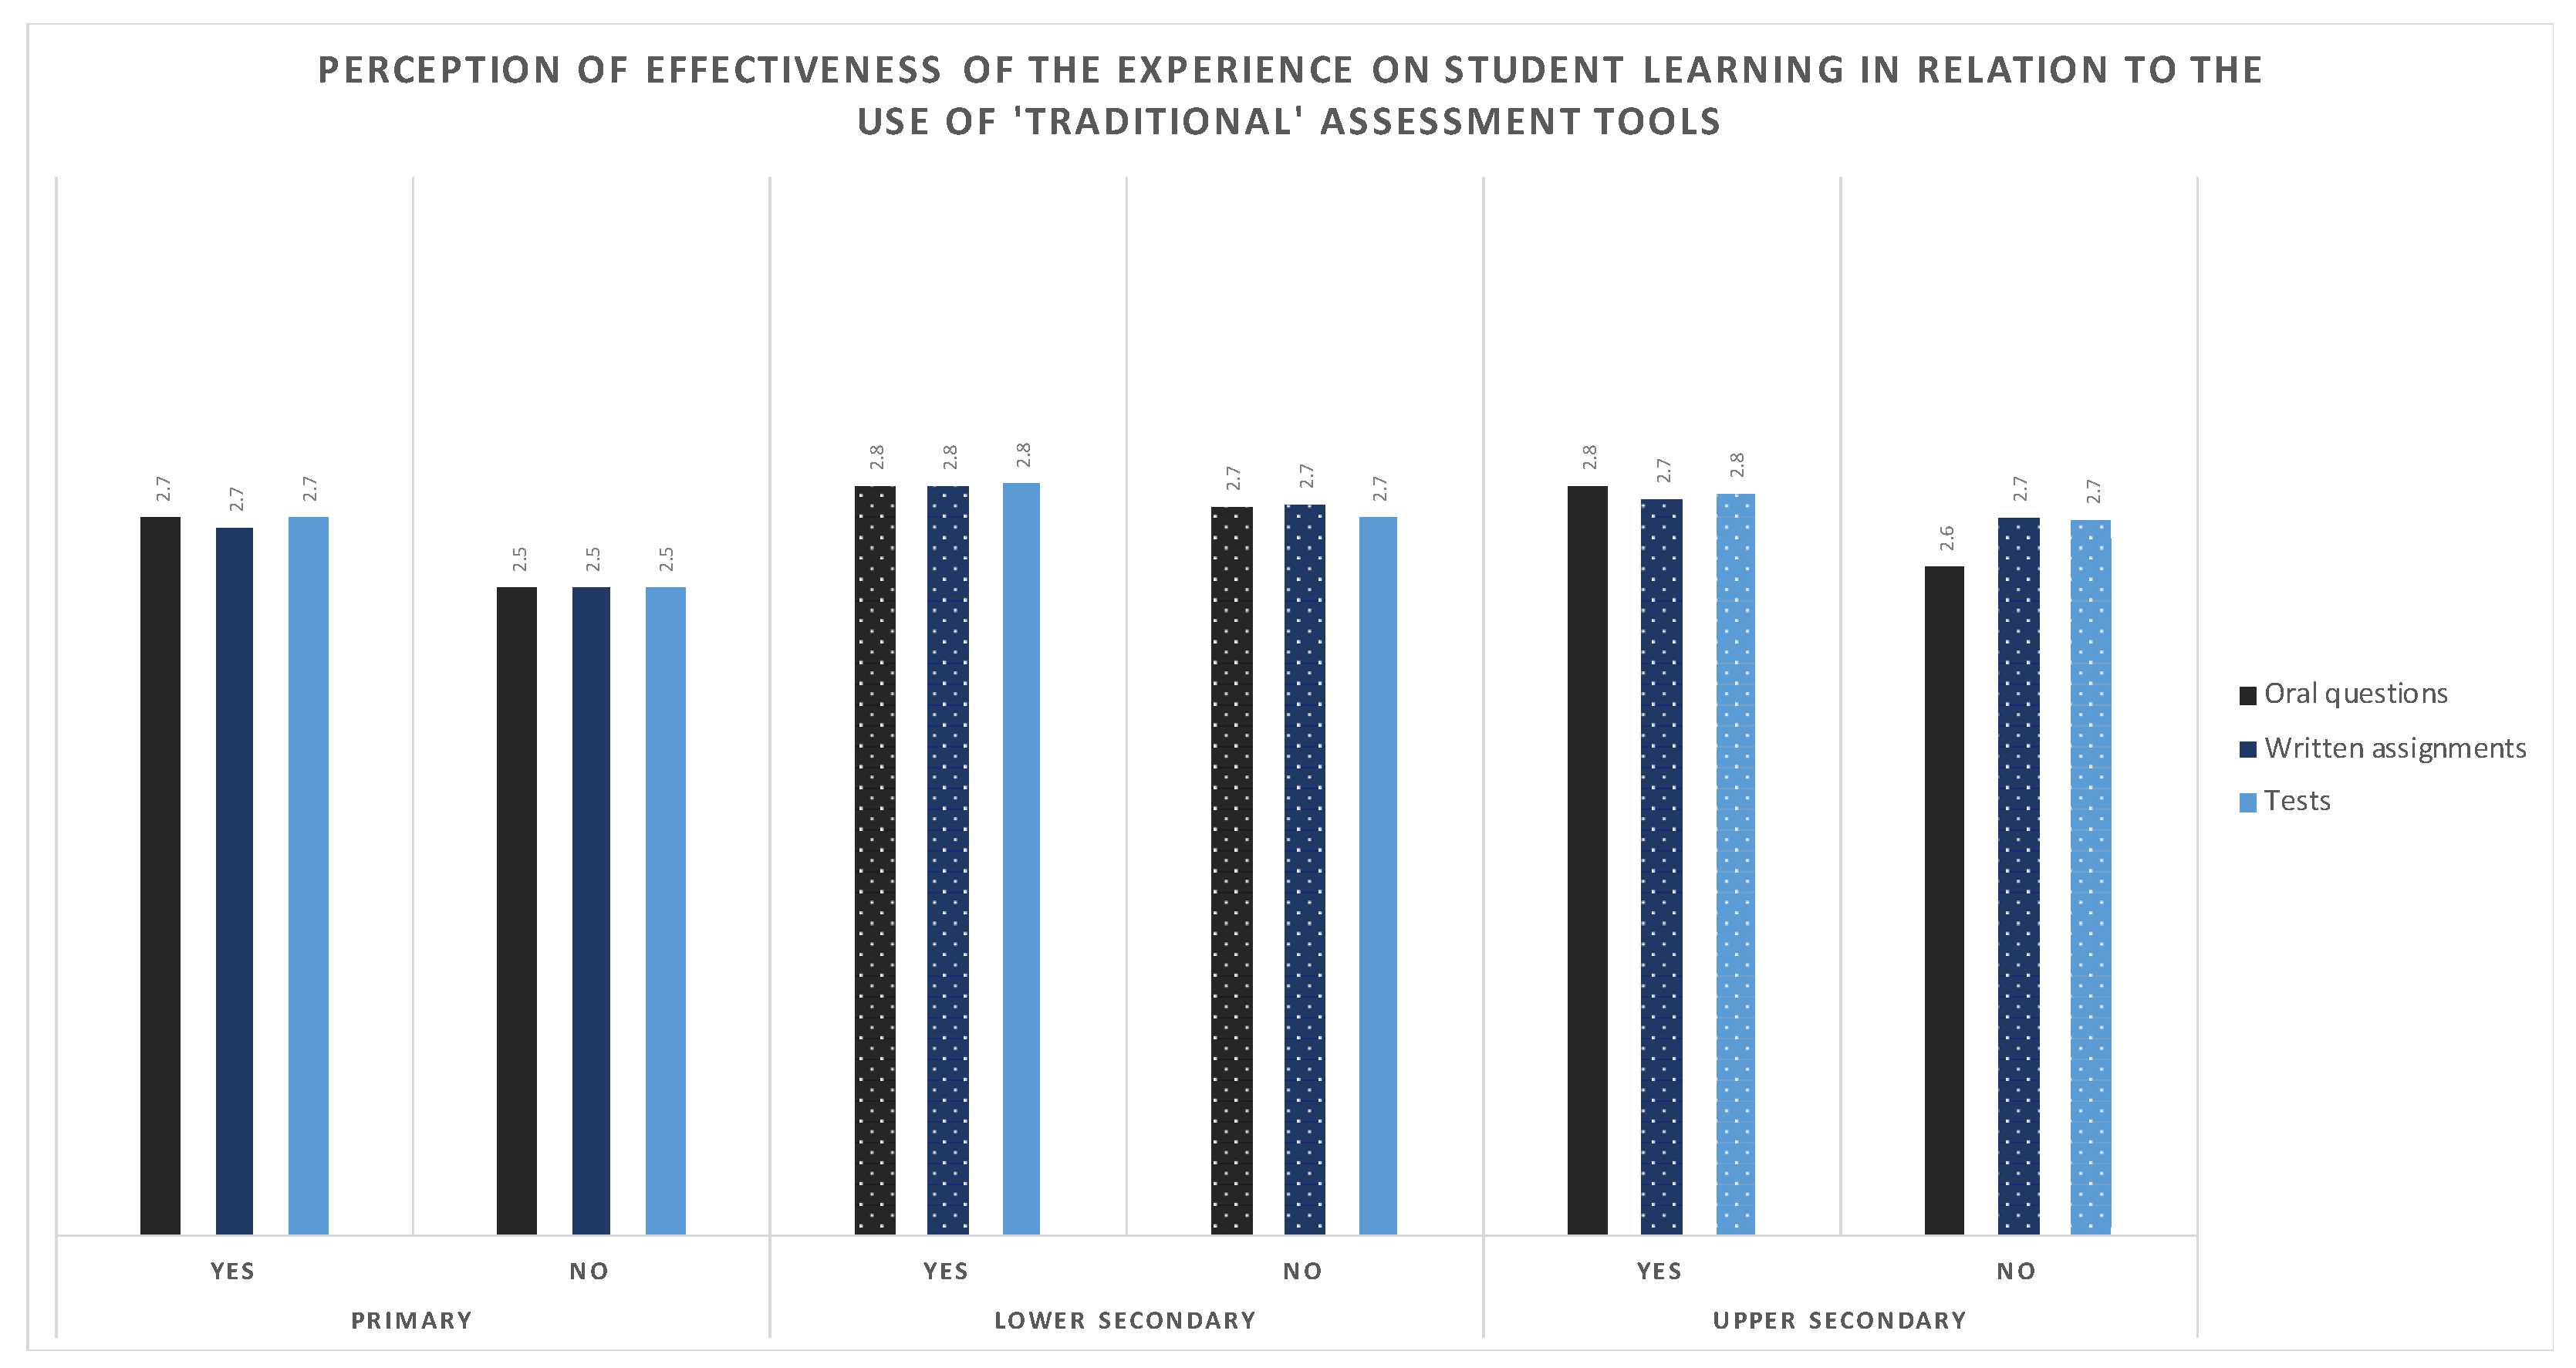
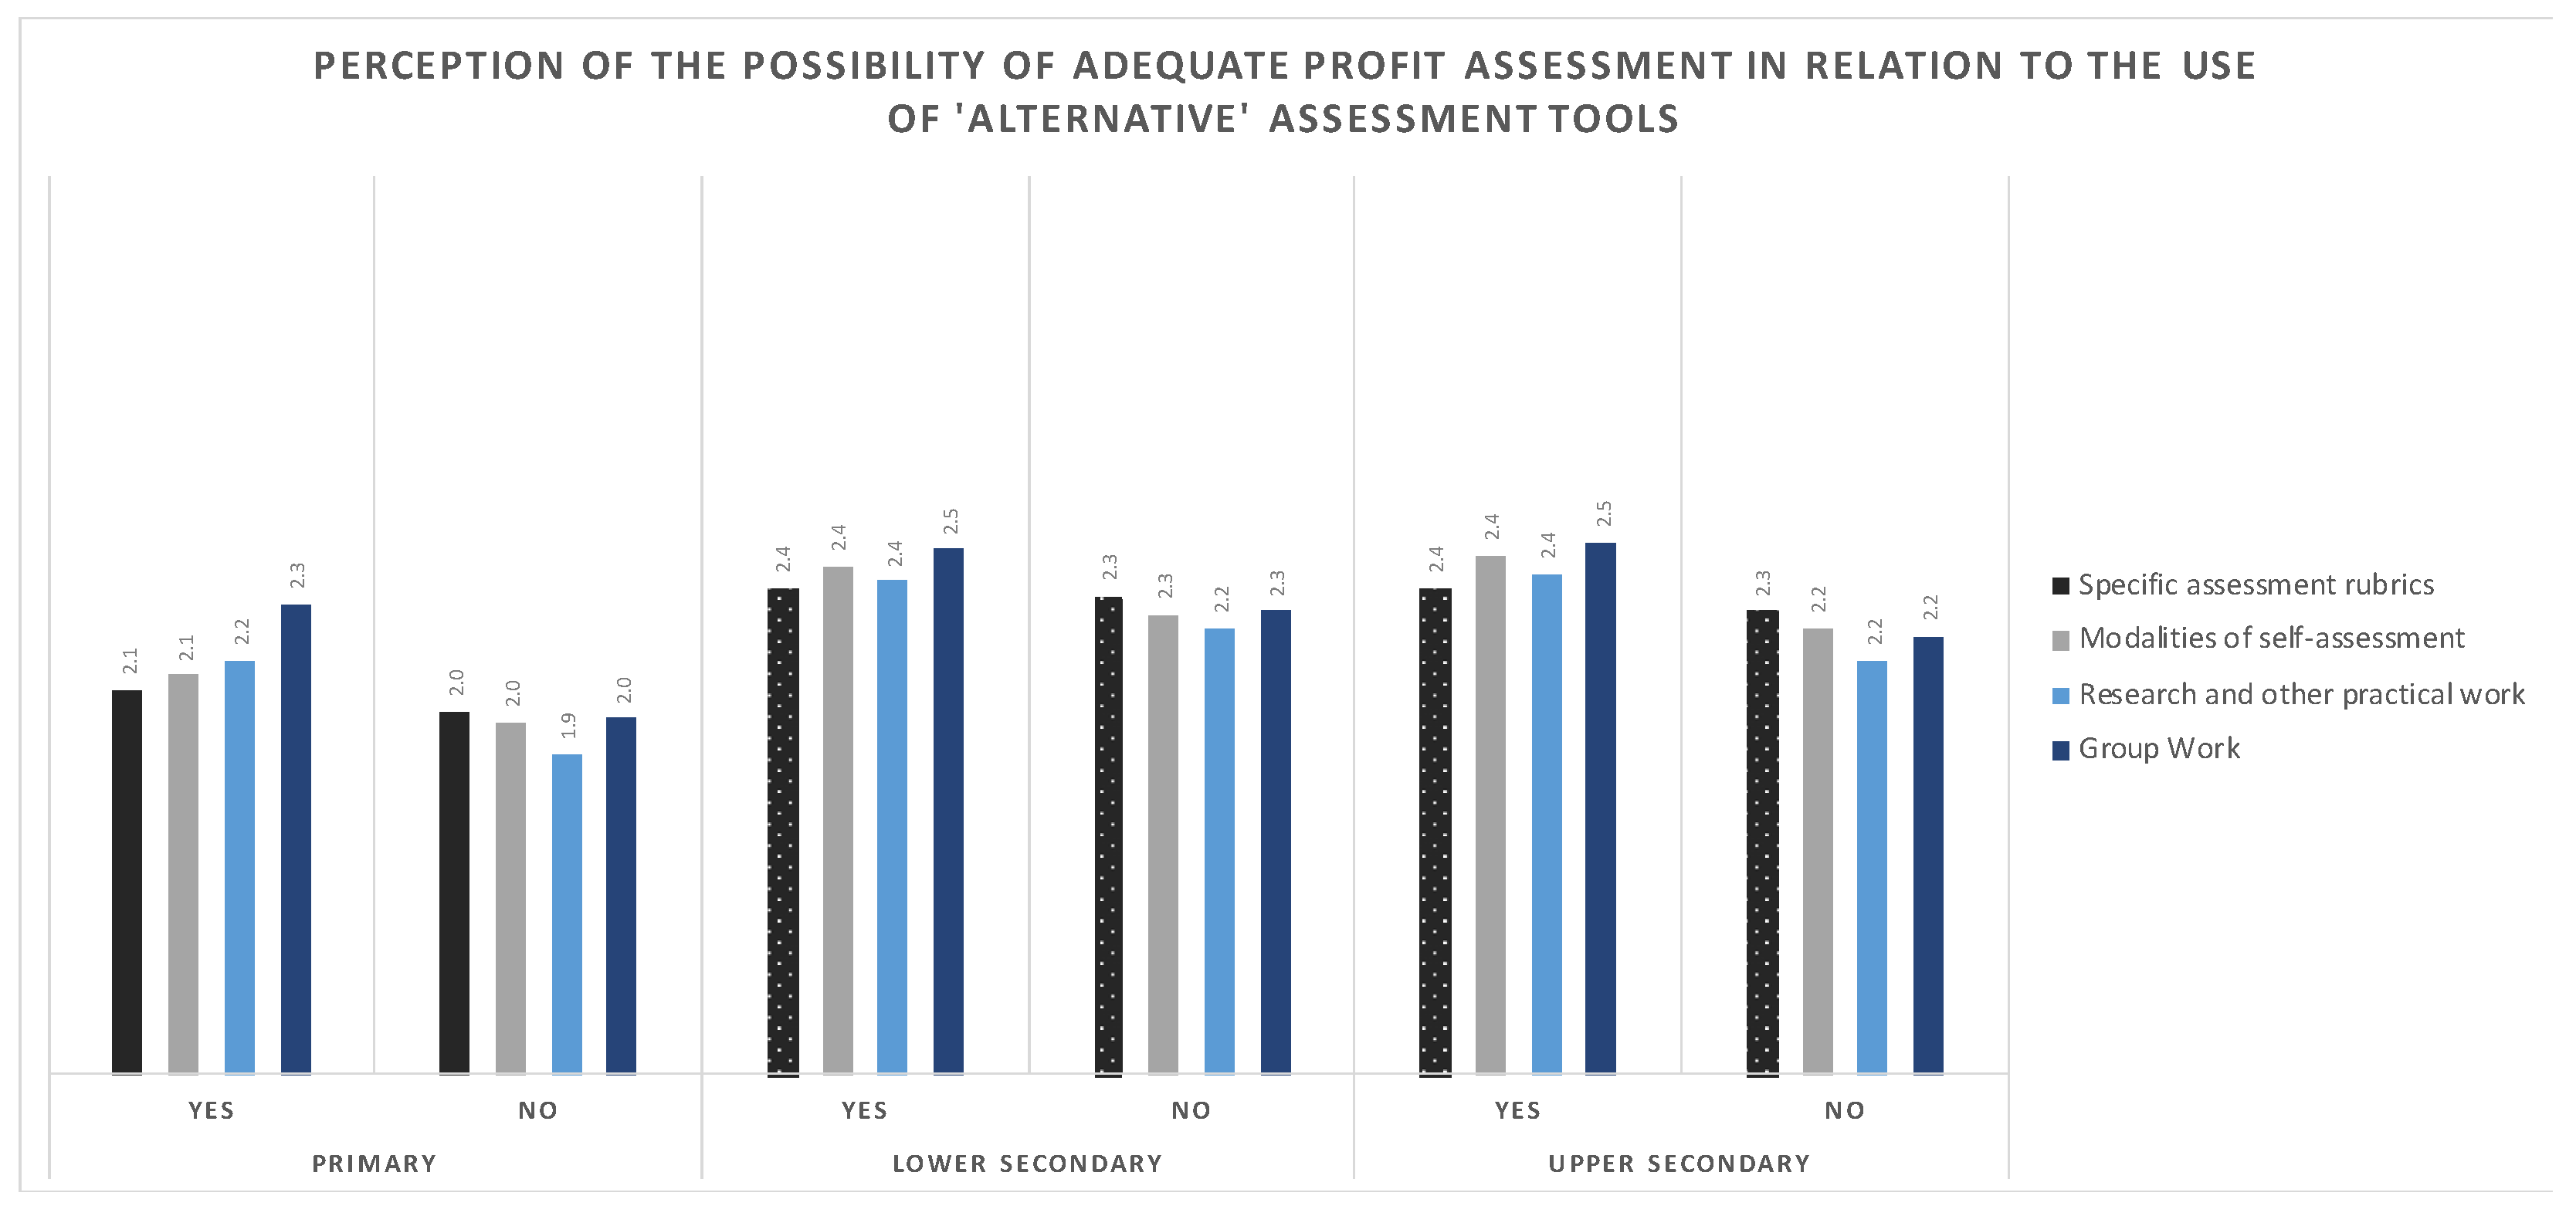
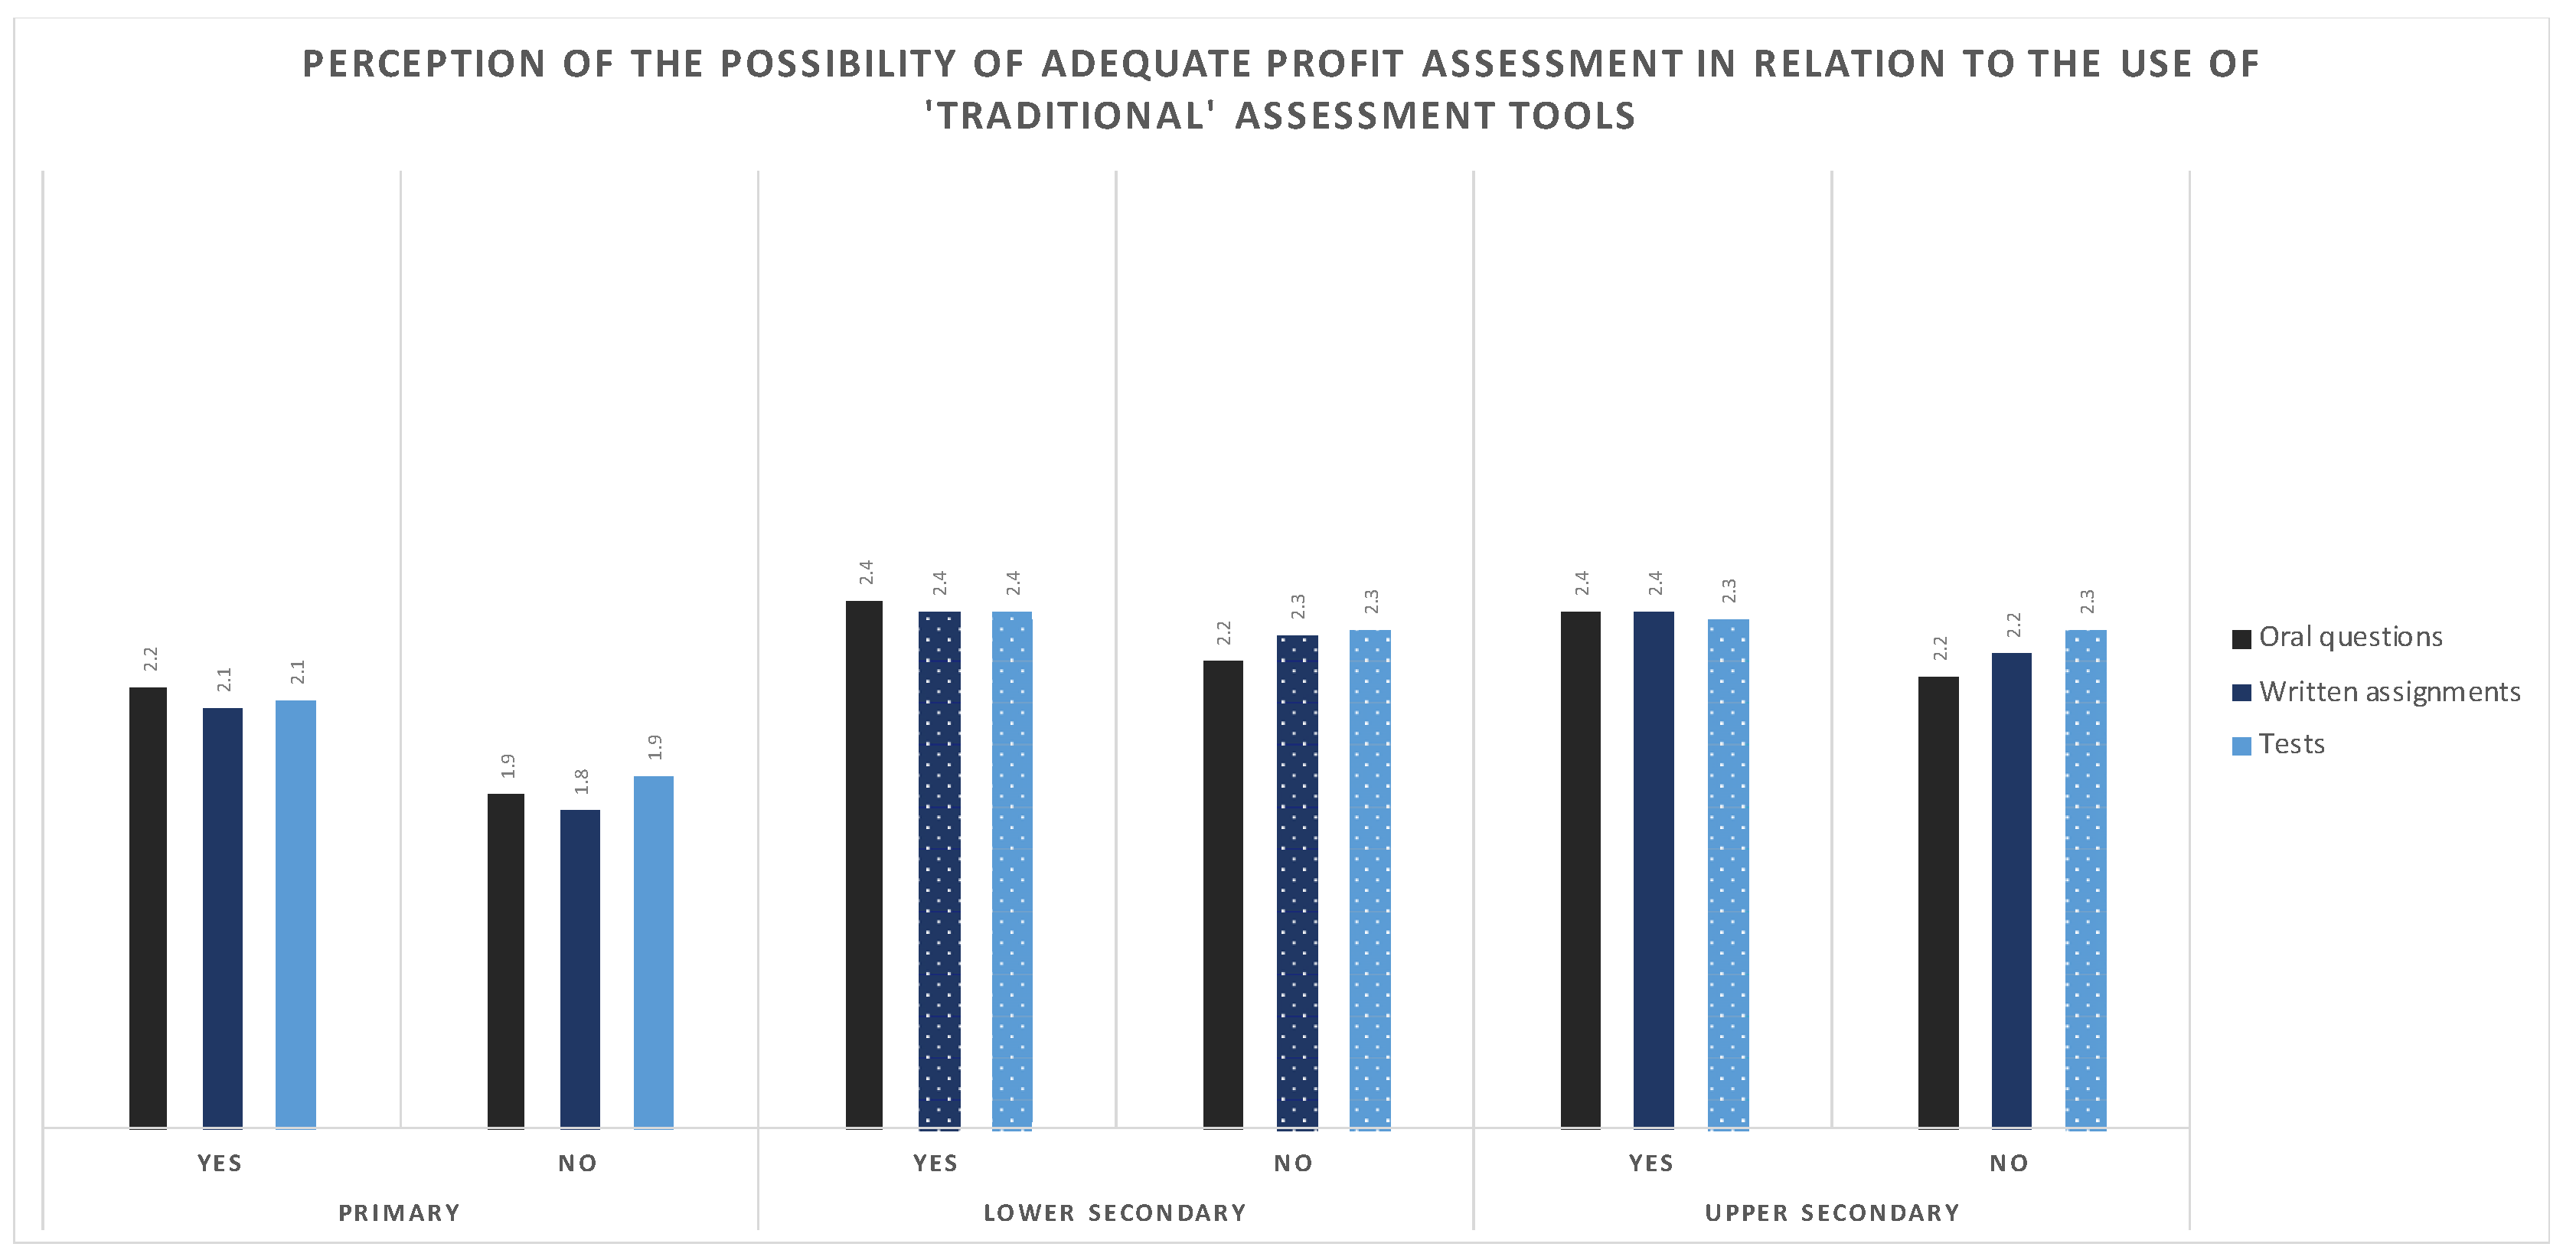
Similar analyses were undertaken to evaluate the effects of some assessment tools on the perceived effectiveness for student learning and the possibility of appropriate performance assessment.
In primary school, the comparison always showed a statistically significant difference (
p ≤ 0.001), but with a very small effect (η
2 did not exceed 0.03) (
Figure 3,
Figure 4,
Figure 5 and
Figure 6). Here again, more in-depth analyses would be necessary. Among the assessment tools that have relatively greater strength of association with the variables, “research and other practical work” and “group work” were found to have the strongest association with the perception of learning effectiveness (
Figure 3). On the other hand, the assessment tools we found the strongest association with the possibility of adequate profit assessment are “research and other practical work”, “group work” (
Figure 5), and “oral questions” (
Figure 6).
In the secondary schools, a difference in the dependent variables was not recorded for all assessment tools: “group work” appeared to be the one most associated with learning effectiveness and with the possibility of an adequate performance assessment (
Figure 3 and
Figure 5).
In summary, the use of assessment tools centred on group work and practical activities seemed to be more associated with adequate assessment of learning and greater effectiveness in student learning, from the teachers’ point of view.
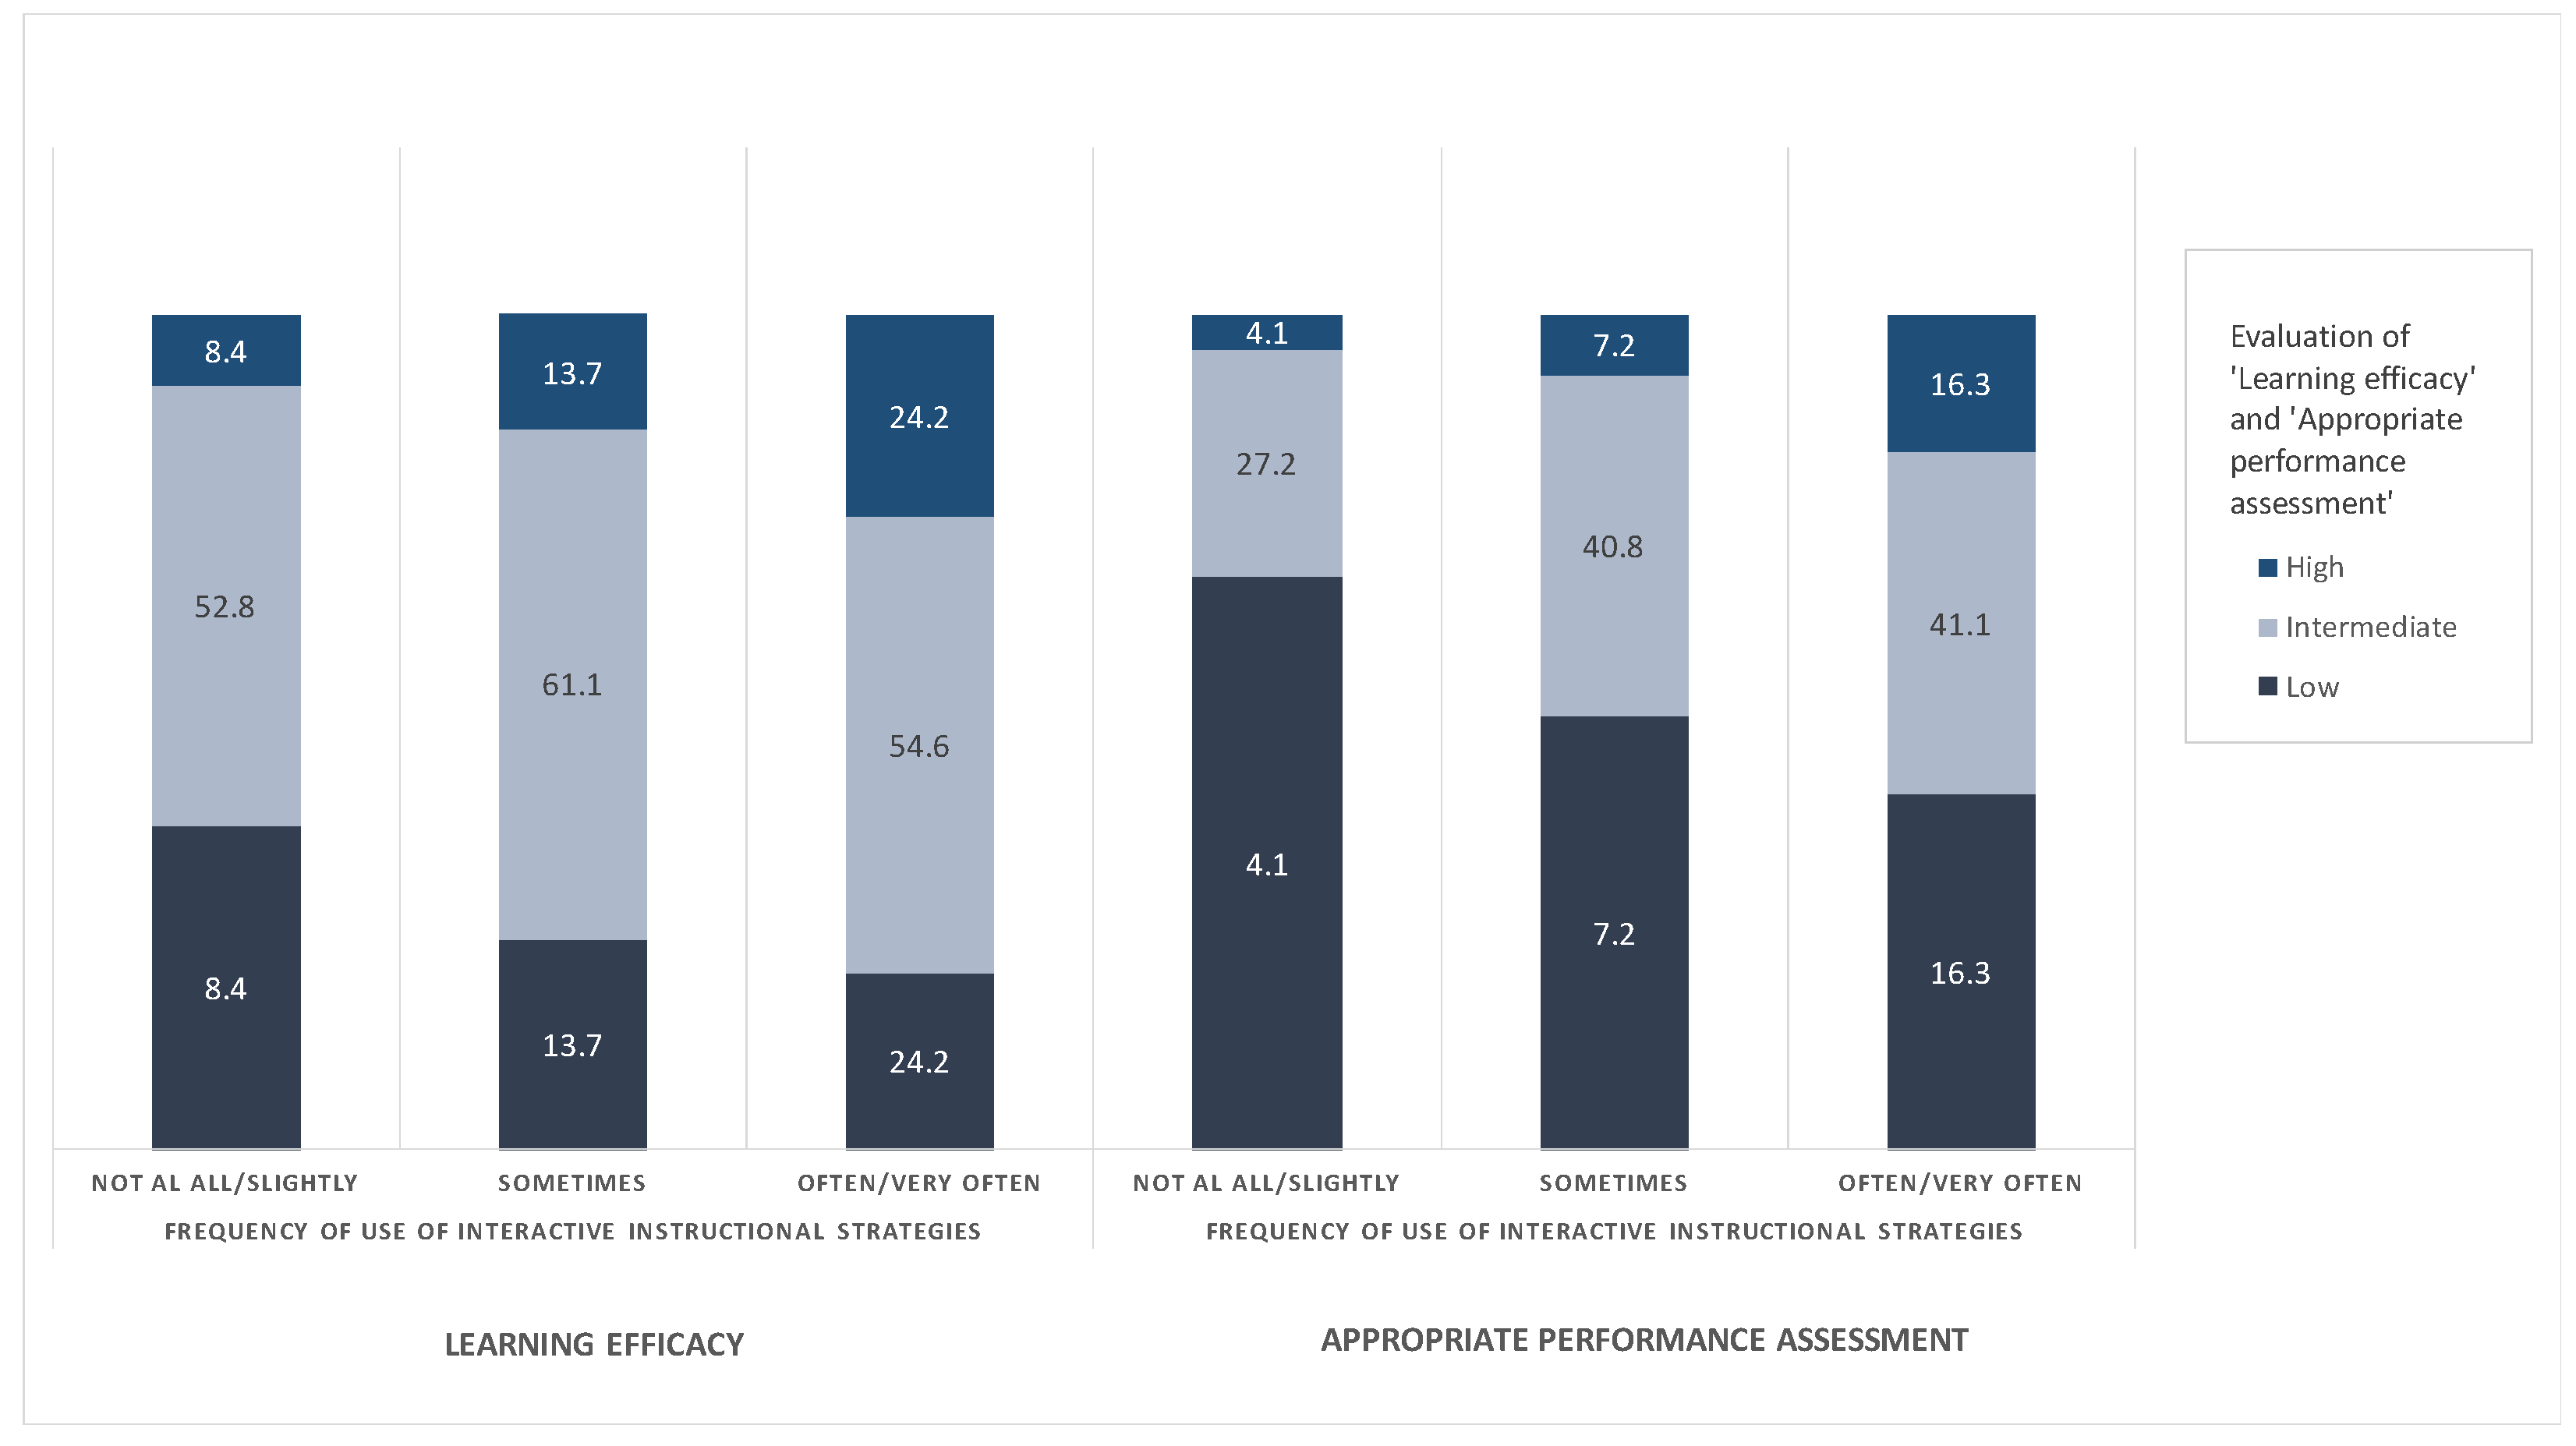
3.3.3. The Role of Redesigning Teaching Methods and Strategies
The association between the factors measured by Likert scales and effectiveness for student learning were examined by means of correlations (
Table 6).
It can be seen that, except for the transmissive teaching strategies scale and, to some extent, asynchronous teaching modes, all of the other items and the interactive teaching strategies scale had a significant correlation with the two quality of experience variables. These were correlations with weak strength. However, it is possible to highlight that a higher declared effort in redesigning teaching correlated with a lower assessment of learning effectiveness and adequate assessment. It seems that the perception of the need to reshape teaching methodologies has not been compensated in terms of quality of experience in the aspects discussed here. The relatively strongest negative correlation was registered in the effort required for the redesigning of assessment methods and the possibility of appropriate assessment, and then in the redefinition of learning objectives and the effectiveness of learning itself. Regarding synchronous or asynchronous teaching modes, the former appeared to be more positively related to effectiveness for learning and assessment. However, the greater use of interactive teaching strategies seemed to be more correlated with the evaluation of the quality of the experience than transmissive strategies, which did not appear to be related to these aspects (see also
Figure 7).
Considering that the efficacy for student learning was the result of the subjective perception of teachers, any interpretation of the correlations must be carried out with caution.
4. Discussion and Conclusions
This paper presents an in-depth examination of some aspects of the SIRD national survey on distance learning during the COVID-19 emergency. The survey had some limitations that should be stressed. Firstly, it was conducted on a non-representative sample of the target population, so it was not possible to generalise the results. Secondly, the student learning aspects were highly subjective, as the participants were the teachers and not the students, and there was no objective measurement of student learning nor a survey of their views on the DL experience. Future studies could focus on comparing students ‘and teachers’ perceptions of these issues.
However, the results that emerged may provide food for thought on issues related to teaching and evaluation strategies, not only in distance learning.
Briefly summarizing some of the differences found in the redesign of teaching planning, greater effort in the reformulation of lower secondary school assessment methods appeared to be more evident in the Tuscan sample than in the Umbrian and national samples. There was also a more frequent use of synchronous modes among the Tuscan and Umbrian secondary school teachers (for the latter, only for the secondary level).
Regarding the teaching strategies used, transmissive strategies prevailed everywhere, and there were no significant regional differences.
In relation to the evaluation of the quality of the experience, the Tuscan data are particularly relevant: the perception of learning effectiveness was, in fact, lower than the national average at all school levels. The situation was similar for secondary schools in Umbria. When carrying out an appropriate performance assessment, Tuscany recorded a lower level in lower secondary schools. Finally, the highest data in Tuscany were reported for critical aspects.
The trends summarised above were substantially confirmed by the qualitative data, although they only represent a small part of the overall data (see [
17] for more details).
A further aim of this paper was to investigate, in the national sample, the association between assessment methods and teaching strategies adopted and the evaluation of the quality of the remote teaching experience in relation to the effectiveness for learning and adequate performance assessment.
In summary, teachers who use “alternative” ways of assessment—in particular, group work—also provided a higher evaluation of the experience in terms of student learning and appropriate assessment (for this aspect, in primary schools, also oral questions). It also emerged that higher effort in redesigning teaching was correlated with a lower assessment of learning and assessment effectiveness. The unexpected and unprecedented situation forced everyone to redefine their ways of teaching and learning, but the effort to reorganise teaching would seem not to have paid off in terms of the quality of the training processes and the overall quality of the experience, which, undoubtedly, has extensive room for improvement [
18].
The aspect of greatest relevance was the use of interactive teaching strategies, which seem to be the most related to a better evaluation of the experience in terms of effectiveness for learning and appropriate performance assessment. Several research experiences have shown how the use of interactive teaching strategies, centred on student activation and participation, can improve learning [
19]. Therefore, it is not surprising that the same teachers who used teaching and assessment methods that most require student participation were also the same ones who provided a higher evaluation of the learning and assessment experience. We may advance the hypothesis that those teachers had already used these modes in traditional teaching and that this had a “protective” effect against the difficulties of distance teaching.
Undoubtedly, the assessment dimension emerged as one of the main critical points during remote teaching, not only in the Italian context [
20,
21]. A subsequent follow-up study on the Tuscan sample, concerning the second year of DL, showed that the situation was still critical: if, on the one hand, there was less need to revise the assessment methods and less criticality in doing so, the difficulty in adequately assessing student performance remained almost unchanged [
22].
The role of earlier training deserves further emphasis. Training in new technologies is now quite widespread, despite the fact that, for a long time, such training was lacking [
23]; on the other hand, previous training in new technologies had little effect on the quality of the DL experience. It was indeed more effective to have had previous specific training in distance learning. In the follow-up study already mentioned, two factors were examined: having had DL experience in 2020 and having received specific training in assessment methods during or after the 2020 DL experience. Only the second factor was found to have a positive impact on the evaluation of the 2021 DL experience in terms of perception being more effective for student learning and for the possibility of adequate assessment of student learning [
22]. Emergency remote teaching has confirmed the already known [
24,
25] need to improve teachers’ assessment literacy. It is crucial for teachers to combine DL experience with adequate training (and vice versa) [
26] and have the opportunity to develop teaching skills in online and blended learning environments so as to be prepared to teach in different learning contexts [
27,
28,
29].
However, it is not enough to have adequate “digital” training. The difficulties in implementing effective teaching and assessment strategies, especially in terms of adequate student involvement, go beyond the characteristics of the learning environment. The ability to manage teaching and assessment methods at distance has, as a necessary prerequisite, the ability to manage teaching and assessment methods in presence. Concerning these aspects, we believe that adequate teacher training can do much to improve the quality of teaching–learning processes in any learning environment.

 ,
, 


