
Clinical Characteristics of COVID-19 Patients and Application to an Artificial Intelligence System for Disease Surveillance

 , , ,
, , ,
Abstract
:1. Introduction
2. Materials and Methods
2.1. Study Population
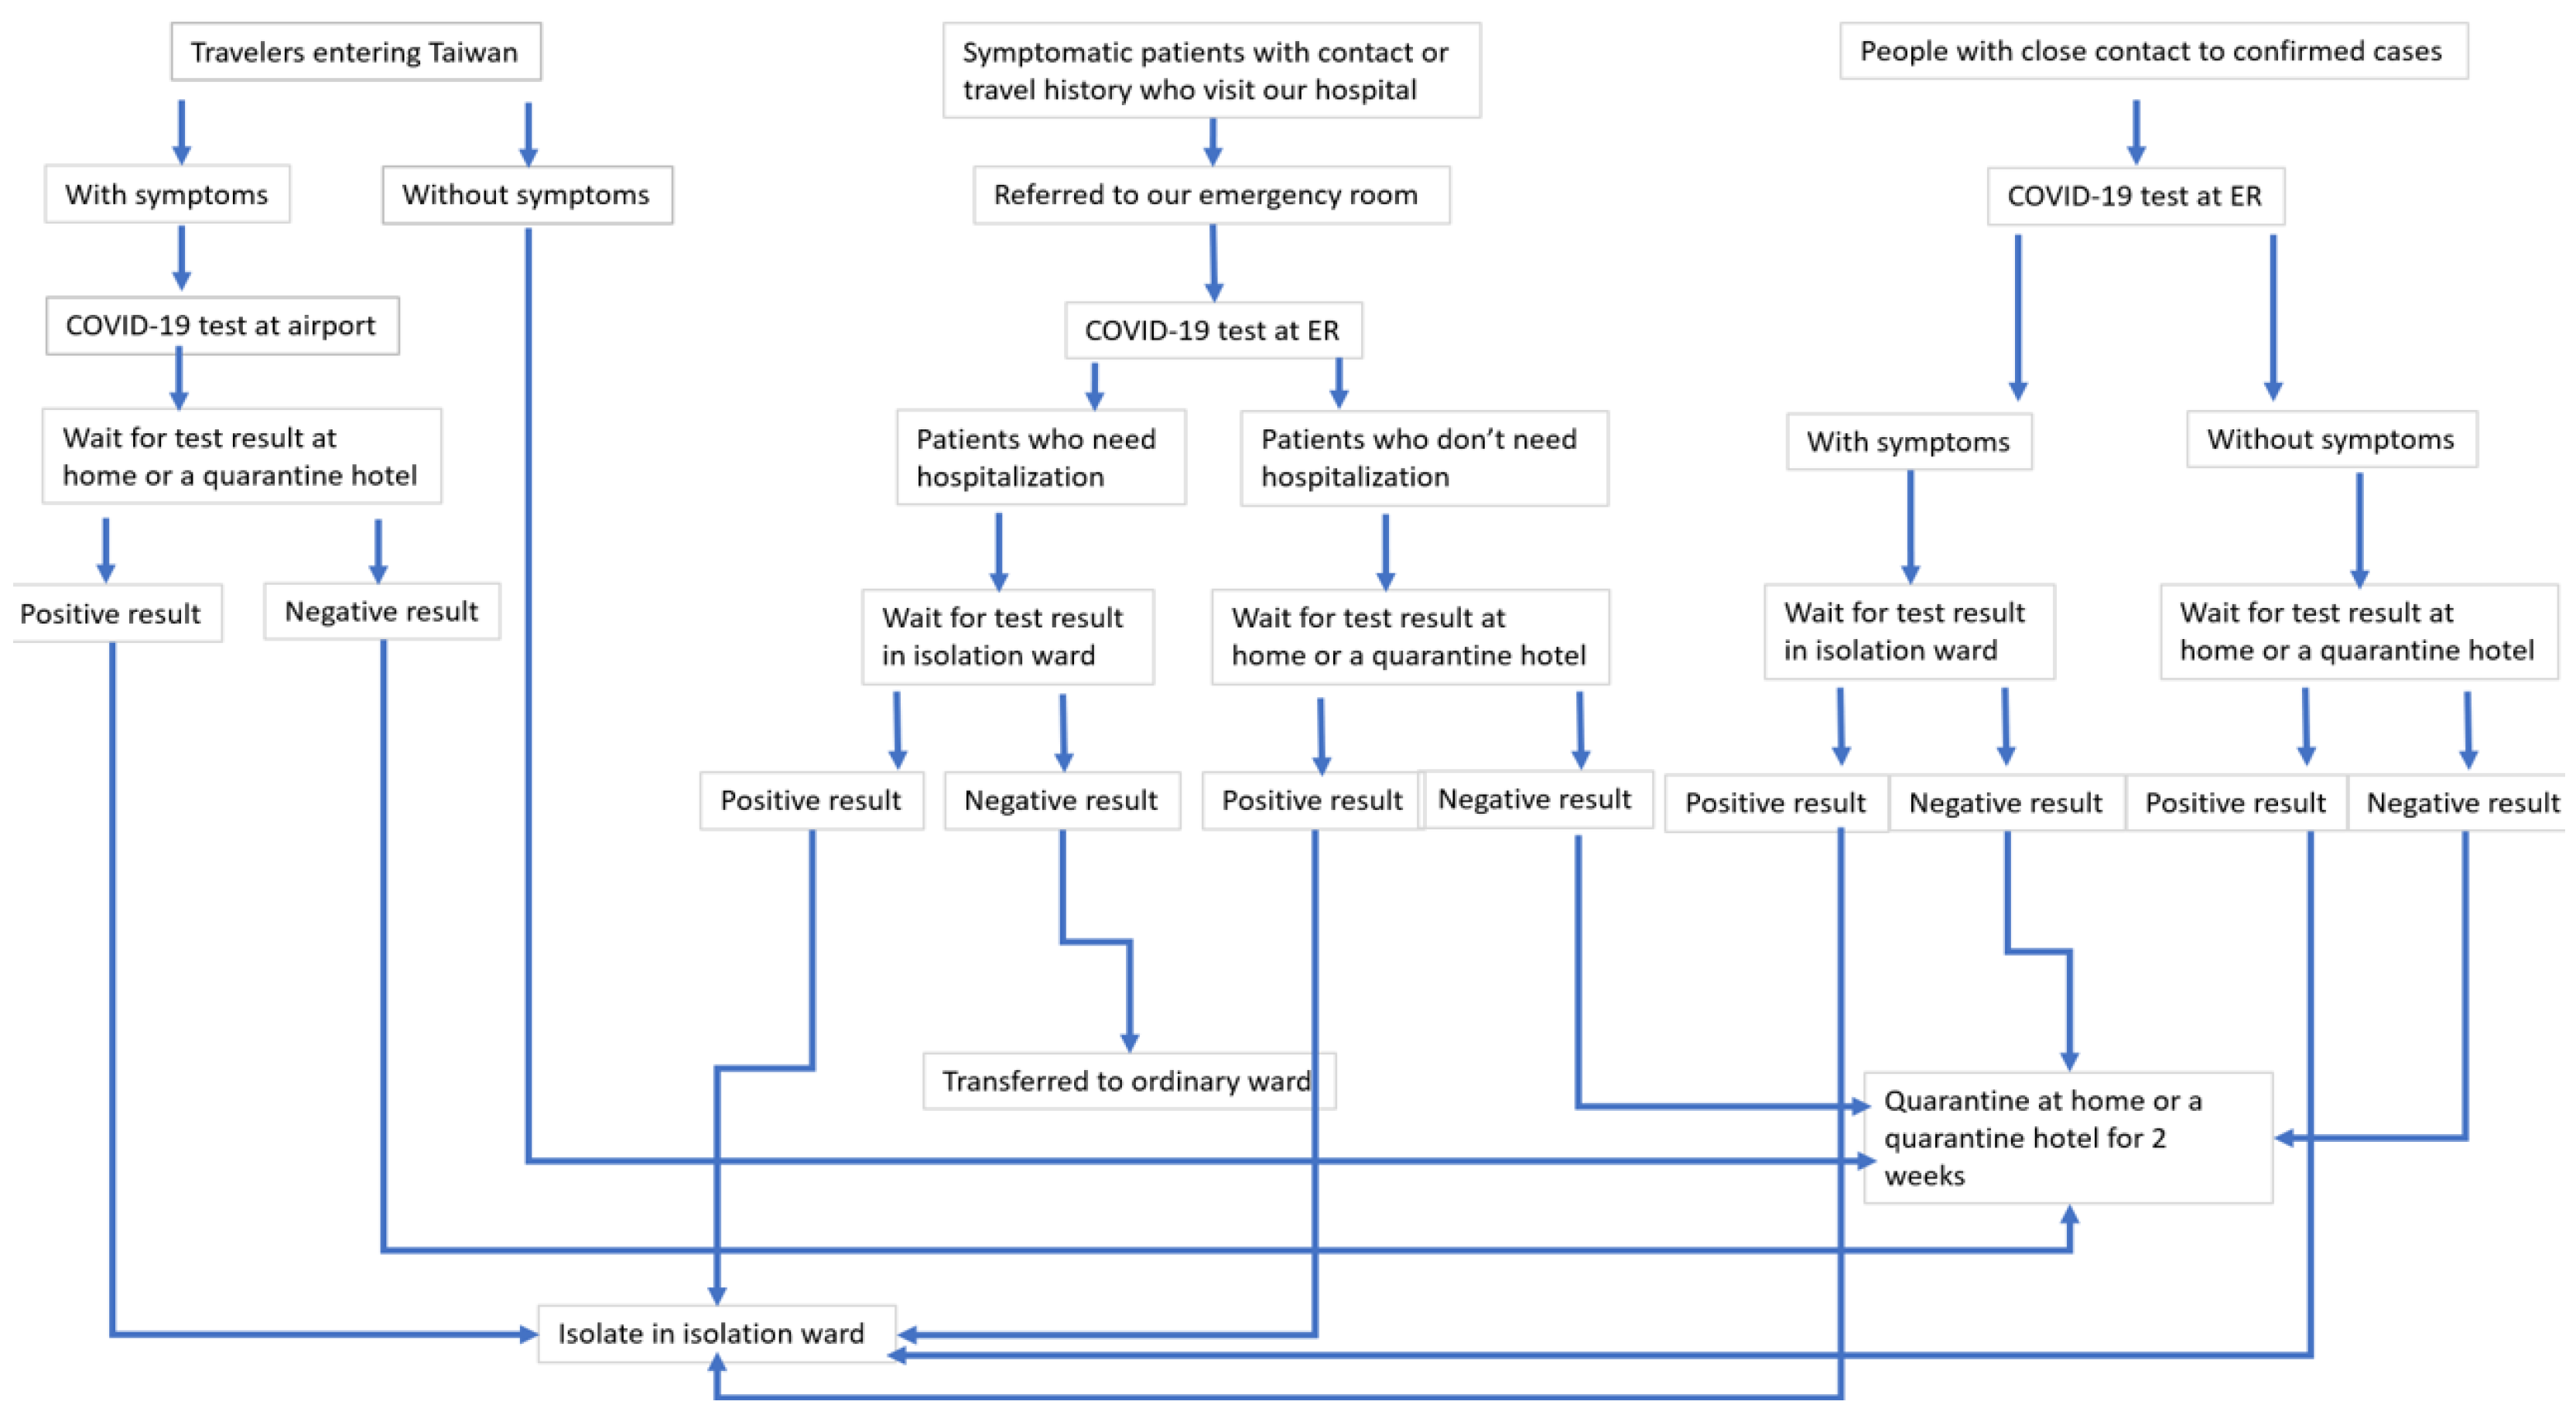
2.2. COVID-19 Screening, Hospitalization, and Home Quarantine
2.3. Obtaining the Demographic Data, Clinical Symptoms, and Laboratory Data
2.4. Statistical Analysis
2.5. Applying the Clinical Characteristics and Routine Laboratory Data to Train AI Models
2.5.1. Support Vector Machines
2.5.2. Random Forest
2.5.3. Decision Tree
2.5.4. Artificial Neural Network
- The architecture indicating the number of layers and the number of nodes in each layer.
- The learning mechanism applied for updating the weights of the connections.
- The activation functions used in various layers.We used the MXNet version 0.8.0 package [43] to implement the above architecture. The settings used for the training model were as follows: (1) the network architecture was 4 × 3 × 1, i.e., the input layer had 4 nodes, the hidden layer had 3 nodes, and the output layer had 1 node; (2) minibatch gradient descent with batch size of 20 for optimization; (3) learning rate = 0.013; (4) momentum coefficient = 0.9; (4) L2 regularization coefficient = 0.
3. Results
3.1. Demographic Data and Underlying Diseases of Confirmed COVID-19 Patients and COVID-19-Negative Patients
3.2. Symptoms of Confirmed COVID-19 and COVID-19-Negative Patients
3.3. Laboratory and Radiological Findings of Confirmed COVID-19 Patients and COVID-19-Negative Cases
3.4. Accuracy, Sensitivity, and Specificity of Support Vector Machine (SVM), Decision Tree, Random Forest, and Artificial Neural Network for COVID-19 Detection and Diagnosis
4. Discussion
5. Conclusions
Author Contributions
Funding
Institutional Review Board Statement
Informed Consent Statement
Data Availability Statement
Conflicts of Interest
References
- Bai, H.X.; Wang, R.; Xiong, Z.; Hsieh, B.; Chang, K.; Halsey, K.; Tran, T.M.L.; Choi, J.W.; Wang, D.C.; Shi, L.B.; et al. Artificial intelligence augmentation of radiologist performance in distinguishing COVID-19 from pneumonia of other origin at chest CT. Radiology 2020, 296, E156–E165. [Google Scholar] [CrossRef] [PubMed]
- Abbasian Ardakani, A.; Acharya, U.R.; Habibollahi, S.; Mohammadi, A. COVIDiag: A clinical CAD system to diagnose COVID-19 pneumonia based on CT findings. Eur. Radiol. 2020, 31, 121–130. [Google Scholar] [CrossRef] [PubMed]
- Ardakani, A.A.; Kanafi, A.R.; Acharya, U.R.; Khadem, N.; Mohammadi, A. Application of deep learning technique to manage COVID-19 in routine clinical practice using CT images: Results of 10 convolutional neural networks. Comput. Biol. Med. 2020, 121, 103795. [Google Scholar] [CrossRef]
- Ko, H.; Chung, H.; Kang, W.S.; Kim, K.W.; Shin, Y.; Kang, S.J.; Lee, J.H.; Kim, Y.J.; Kim, N.Y.; Jung, H.; et al. COVID-19 pneumonia diagnosis using a simple 2d deep learning framework with a single chest CT image: Model development and validation. J. Med. Internet Res. 2020, 22, e19569. [Google Scholar] [CrossRef] [PubMed]
- Li, L.; Qin, L.; Xu, Z.; Yin, Y.; Wang, X.; Kong, B.; Bai, J.; Lu, Y.; Fang, Z.; Song, Q.; et al. Using artificial intelligence to detect COVID-19 and community-acquired pneumonia based on pulmonary CT: Evaluation of the diagnostic accuracy. Radiology 2020, 296, E65–E71. [Google Scholar] [CrossRef]
- Mei, X.; Lee, H.C.; Diao, K.Y.; Huang, M.; Lin, B.; Liu, C.; Xie, Z.; Ma, Y.; Robson, P.M.; Chung, M.C.; et al. Artificial intelligence–enabled rapid diagnosis of patients with COVID-19. Nat. Med. 2020, 26, 1224–1228. [Google Scholar] [CrossRef]
- Mishra, A.K.; Das, S.K.; Roy, P.; Bandyopadhyay, S. Identifying COVID19 from chest CT images: A deep convolutional neural networks based approach. J. Healthc. Eng. 2020, 2020, 8843664. [Google Scholar] [CrossRef]
- Ouyang, X.; Huo, J.; Xia, L.; Shan, F.; Liu, J.; Mo, Z.; Yan, F.; Ding, Z.; Yang, Q.; Song, B.; et al. Dual-Sampling attention network for diagnosis of COVID-19 from community acquired pneumonia. IEEE Trans. Med. Imaging 2020, 39, 2595–2605. [Google Scholar] [CrossRef]
- Sharma, S. Drawing insights from COVID-19-infected patients using CT scan images and machine learning techniques: A study on 200 patients. Environ. Sci. Pollut. Res. Int. 2020, 27, 37155–37163. [Google Scholar] [CrossRef]
- Wang, J.; Bao, Y.; Wen, Y.; Lu, H.; Luo, H.; Xiang, Y.; Li, X.; Liu, C.; Qian, D. Prior-Attention residual learning for more discriminative COVID-19 screening in CT images. IEEE Trans. Med. Imaging 2020, 39, 2572–2583. [Google Scholar] [CrossRef]
- Wang, S.; Zha, Y.; Li, W.; Wu, Q.; Li, X.; Niu, M.; Wang, M.; Qiu, X.; Li, H.; Yu, H.; et al. A fully automatic deep learning system for COVID-19 diagnostic and prognostic analysis. Eur. Respir. J. 2020, 56, 2000775. [Google Scholar] [CrossRef] [PubMed]
- Wu, X.; Hui, H.; Niu, M.; Li, L.; Wang, L.; He, B.; Yang, X.; Li, L.; Li, H.; Tian, J.; et al. Deep learning-based multi-view fusion model for screening 2019 novel coronavirus pneumonia: A multicentre study. Eur. J. Radiol. 2020, 128, 109041. [Google Scholar] [CrossRef] [PubMed]
- Yan, T.; Wong, P.K.; Ren, H.; Wang, H.; Wang, J.; Li, Y. Automatic distinction between COVID-19 and common pneumonia using multi-scale convolutional neural network on chest CT scans. Chaos Solitons Fractals 2020, 140, 110153. [Google Scholar] [CrossRef] [PubMed]
- Zhang, K.; Liu, X.; Shen, J.; Li, Z.; Sang, Y.; Wu, X.; Zha, Y.; Liang, W.; Wang, C.; Wang, K.; et al. Clinically applicable AI system for accurate diagnosis, quantitative measurements, and prognosis of COVID-19 pneumonia using computed tomography. Cell 2020, 181, 1423–1433.e11. [Google Scholar] [CrossRef] [PubMed]
- Harmon, S.A.; Sanford, T.H.; Xu, S.; Turkbey, E.B.; Roth, H.; Xu, Z.; Yang, D.; Myronenko, A.; Anderson, V.; Amalou, A.; et al. Artificial intelligence for the detection of COVID-19 pneumonia on chest CT using multinational datasets. Nat. Commun. 2020, 11, 4080. [Google Scholar] [CrossRef] [PubMed]
- Jaiswal, A.; Gianchandani, N.; Singh, D.; Kumar, V.; Kaur, M. Classification of the COVID-19 infected patients using DenseNet201 based deep transfer learning. J. Biomol. Struct. Dyn. 2020, 39, 5682–5689. [Google Scholar] [CrossRef] [PubMed]
- Xu, X.; Jiang, X.; Ma, C.; Du, P.; Li, X.; Lv, S.; Yu, L.; Ni, Q.; Chen, Y.; Su, J. A deep learning system to screen novel coronavirus disease 2019 pneumonia. Engineering 2020, 6, 1122–1129. [Google Scholar] [CrossRef]
- Yang, S.; Jiang, L.; Cao, Z.; Wang, L.; Cao, J.; Feng, R.; Zhang, Z.; Xue, X.; Shi, Y.; Shan, F. Deep learning for detecting corona virus disease 2019 (COVID-19) on high-resolution computed tomography: A pilot study. Ann. Transl. Med. 2020, 8, 450. [Google Scholar] [CrossRef]
- Li, Z.; Zhong, Z.; Li, Y.; Zhang, T.; Gao, L.; Jin, D.; Sun, Y.; Ye, X.; Yu, L.; Hu, Z.; et al. From community-acquired pneumonia to COVID-19: A deep learning–based method for quantitative analysis of COVID-19 on thick-section CT scans. Eur. Radiol. 2020, 30, 6828–6837. [Google Scholar] [CrossRef]
- Yu, Z.; Li, X.; Sun, H.; Wang, J.; Zhao, T.; Chen, H.; Ma, Y.; Zhu, S.; Xie, Z. Rapid identification of COVID-19 severity in CT scans through classification of deep features. Biomed. Eng. Online 2020, 19, 63. [Google Scholar] [CrossRef]
- Fu, L.; Li, Y.; Cheng, A.; Pang, P.; Shu, Z. A novel machine learning-derived radiomic signature of the whole lung differentiates stable from progressive COVID-19 infection: A retrospective cohort study. J. Thorac. Imaging 2020, 35, 361–368. [Google Scholar] [CrossRef] [PubMed]
- Xiao, L.S.; Li, P.; Sun, F.; Zhang, Y.; Xu, C.; Zhu, H.; Cai, F.Q.; He, Y.L.; Zhang, W.F.; Ma, S.C.; et al. Development and validation of a deep learning-based model using computed tomography imaging for predicting disease severity of coronavirus disease 2019. Front. Bioeng. Biotechnol. 2020, 8, 898. [Google Scholar] [CrossRef] [PubMed]
- Alsayed, A.; Sadir, H.; Kamil, R.; Sari, H. Prediction of epidemic peak and infected cases for COVID-19 disease in Malaysia, 2020. Int. J. Environ. Res. Public Health 2020, 17, 4076. [Google Scholar] [CrossRef] [PubMed]
- Ayyoubzadeh, S.M.; Ayyoubzadeh, S.M.; Zahedi, H.; Ahmadi, M.; Kalhori, S.R.N. Predicting COVID-19 incidence through analysis of google trends data in iran: Data mining and deep learning pilot study. JMIR Public Health Surveill. 2020, 6, e18828. [Google Scholar] [CrossRef]
- Mollalo, A.; Rivera, K.M.; Vahedi, B. Artificial neural network modeling of novel coronavirus (COVID-19) incidence rates across the continental United States. Int. J. Environ. Res. Public Health 2020, 17, 4204. [Google Scholar] [CrossRef]
- Shahid, F.; Zameer, A.; Muneeb, M. Predictions for COVID-19 with deep learning models of LSTM, GRU and Bi-LSTM. Chaos Solitons Fractals 2020, 140, 110212. [Google Scholar] [CrossRef]
- Zheng, N.; Du, S.; Wang, J.; Zhang, H.; Cui, W.; Kang, Z.; Yang, T.; Lou, B.; Chi, Y.; Long, H.; et al. Predicting COVID-19 in China using hybrid AI model. IEEE Trans. Cybern. 2020, 50, 2891–2904. [Google Scholar] [CrossRef]
- Arora, P.; Kumar, H.; Panigrahi, B.K. Prediction and analysis of COVID-19 positive cases using deep learning models: A descriptive case study of India. Chaos Solitons Fractals 2020, 139, 110017. [Google Scholar] [CrossRef]
- Chimmula, V.K.R.; Zhang, L. Time series forecasting of COVID-19 transmission in Canada using LSTM networks. Chaos Solitons Fractals 2020, 135, 109864. [Google Scholar] [CrossRef]
- Ribeiro, M.; da Silva, R.G.; Mariani, V.C.; Coelho, L.D.S. Short-term forecasting COVID-19 cumulative confirmed cases: Perspectives for Brazil. Chaos Solitons Fractals 2020, 135, 109853. [Google Scholar] [CrossRef]
- Shastri, S.; Singh, K.; Kumar, S.; Kour, P.; Mansotra, V. Time series forecasting of Covid-19 using deep learning models: India-USA comparative case study. Chaos Solitons Fractals 2020, 140, 110227. [Google Scholar] [CrossRef] [PubMed]
- Gardner, L. Update January 31: Modeling the Spreading Risk of 2019-nCoV. Available online: https://systems.jhu.edu/research/public-health/ncov-model-2/ (accessed on 31 January 2020).
- Cheng, S.C.; Chang, Y.C.; Fan Chiang, Y.L.; Chien, Y.C.; Cheng, M.; Yang, C.H.; Huang, C.H.; Hsu, Y.N. First case of Coronavirus Disease 2019 (COVID-19) pneumonia in Taiwan. J. Formos. Med. Assoc. 2020, 119, 747–751. [Google Scholar] [CrossRef] [PubMed]
- Wunderink, R.G.; Waterer, G.W. Clinical practice. Community-acquired pneumonia. N. Engl. J. Med. 2014, 370, 543–551. [Google Scholar] [CrossRef] [PubMed]
- Postma, D.F.; van Werkhoven, C.H.; van Elden, L.J.; Thijsen, S.F.; Hoepelman, A.I.; Kluytmans, J.A.; Boersma, W.G.; Compaijen, C.J.; van der Wall, E.; Prins, J.M.; et al. Antibiotic treatment strategies for community-acquired pneumonia in adults. N. Engl. J. Med. 2015, 372, 1312–1323. [Google Scholar] [CrossRef] [PubMed] [Green Version]
- Butt, L.; Zuccon, G.; Nguyen, A.; Bergheim, A.; Grayson, N. Classification of cancer-related death certificates using machine learning. Australas. Med. J. 2013, 6, 292–299. [Google Scholar] [CrossRef]
- Meyer, D.; Dimitriadou, E.; Hornik, K.; Weingessel, A.; Leisch, F. Misc Functions of the Department of Statistics, Probability Theory Group (Formerly: E1071), R package version 1.7-0; Vienna University of Technology (TU Wien): Vienna, Austria, 2018. [Google Scholar]
- Mohammed Ali Al-garadi, K.D.V.; Ravana, S.D. Cybercrime detection in online communications: The experimental case of cyberbullying detection in the Twitter network. Comput. Hum. Behav. 2016, 63, 433–443. [Google Scholar] [CrossRef]
- Liaw, A.; Wiener, M. Classification and regression based on a forest of trees using random inputs, based on Breiman (2001). R Doc. Package Randomforest 2018, 4, 14. [Google Scholar]
- Geurts, P.; Irrthum, A.; Wehenkel, L. Supervised learning with decision tree-based methods in computational and systems biology. Mol. Biosyst. 2009, 5, 1593–1605. [Google Scholar] [CrossRef]
- Speybroeck, N.; Berkvens, D.; Mfoukou-Ntsakala, A.; Aerts, M.; Hens, N.; van Huylenbroeck, G.; Thysa, E. Classification trees versus multinomial models in the analysis of urban farming systems in Central Africa. Agric. Syst. 2004, 80, 133–149. [Google Scholar] [CrossRef]
- Hothorn, T.; Hornik, K.; Zeileis, A. Unbiased Recursive Partitioning: A Conditional Inference Framework. J. Comput. Graph. Stat. 2006, 15, 651–674. [Google Scholar] [CrossRef] [Green Version]
- Chen, T.; Li, M.; Li, Y.; Lin, M.; Wang, N.; Wang, M.; Xiao, T.; Xu, B.; Zhang, C.; Zhang, Z. Mxnet: A flexible and efficient machine learning library for heterogeneous distributed systems. arXiv 2015, arXiv:preprint/1512.01274. [Google Scholar]
- Yuan, J.; Li, M.; Lv, G.; Lu, Z.K. Monitoring transmissibility and mortality of COVID-19 in Europe. Int. J. Infect. Dis. 2020, 95, 311–315. [Google Scholar] [CrossRef]
- Saldanha, A.L.R.; Chacra, A.P.M.; Rabelo, L.M.; Filho, R.D.S.; Margeotto, A.P.P.; Gasparoto, A.L.V.; Martinez, T.L.D.R. COVID 19 comorbidity interplayers diabetes and atherogenic dyslipidemia. Curr. Trends Intern. Med. 2020, 4, 138. [Google Scholar]
- Wang, D.; Hu, B.; Hu, C.; Zhu, F.; Liu, X.; Zhang, J.; Wang, B.; Xiang, H.; Cheng, Z.; Xiong, Y.; et al. Clinical Characteristics of 138 Hospitalized Patients With 2019 Novel Coronavirus-Infected Pneumonia in Wuhan, China. JAMA 2020, 323, 1061–1069. [Google Scholar] [CrossRef] [PubMed]
- Chen, N.; Zhou, M.; Dong, X.; Qu, J.; Gong, F.; Han, Y.; Qiu, Y.; Wang, J.; Liu, Y.; Wei, Y.; et al. Epidemiological and clinical characteristics of 99 cases of 2019 novel coronavirus pneumonia in Wuhan, China: A descriptive study. Lancet 2020, 395, 507–513. [Google Scholar] [CrossRef] [Green Version]
- Huang, C.; Wang, Y.; Li, X.; Ren, L.; Zhao, J.; Hu, Y.; Zhang, L.; Fan, G.; Xu, J.; Gu, X.; et al. Clinical features of patients infected with 2019 novel coronavirus in Wuhan, China. Lancet 2020, 395, 497–506. [Google Scholar] [CrossRef] [Green Version]
- Lai, C.C.; Shih, T.P.; Ko, W.C.; Tang, H.J.; Hsueh, P.R. Severe acute respiratory syndrome coronavirus 2 (SARS-CoV-2) and coronavirus disease-2019 (COVID-19): The epidemic and the challenges. Int. J. Antimicrob. Agents 2020, 55, 105924. [Google Scholar] [CrossRef]
- Hu, Z.; Song, C.; Xu, C.; Jin, G.; Chen, Y.; Xu, X.; Ma, H.; Chen, W.; Lin, Y.; Zheng, Y.; et al. Clinical characteristics of 24 asymptomatic infections with COVID-19 screened among close contacts in Nanjing, China. Sci. China Life Sci. 2020, 63, 706–711. [Google Scholar] [CrossRef] [Green Version]
- Wei, W.E.; Li, Z.; Chiew, C.J.; Yong, S.E.; Toh, M.P.; Lee, V.J. Presymptomatic Transmission of SARS-CoV-2—Singapore, January 23–March 16, 2020. Morb. Mortal. Wkly. Rep. 2020, 69, 411–415. [Google Scholar] [CrossRef] [Green Version]
- Tong, Z.D.; Tang, A.; Li, K.F.; Li, P.; Wang, H.L.; Yi, J.P.; Zhang, Y.L.; Yan, J.B. Potential Presymptomatic Transmission of SARS-CoV-2, Zhejiang Province, China, 2020. Emerg. Infect. Dis 2020, 26, 1052–1054. [Google Scholar] [CrossRef] [Green Version]
- Qian, G.; Yang, N.; Ma, A.H.Y.; Wang, L.; Li, G.; Chen, X.; Chen, X. COVID-19 Transmission Within a Family Cluster by Presymptomatic Carriers in China. Clin. Infect. Dis. 2020, 71, 861–862. [Google Scholar] [CrossRef]
- Pan, X.; Chen, D.; Xia, Y.; Wu, X.; Li, T.; Ou, X.; Zhou, L.; Liu, J. Asymptomatic cases in a family cluster with SARS-CoV-2 infection. Lancet Infect. Dis. 2020, 20, 410–411. [Google Scholar] [CrossRef]
- Bai, Y.; Yao, L.; Wei, T.; Tian, F.; Jin, D.Y.; Chen, L.; Wang, M. Presumed Asymptomatic Carrier Transmission of COVID-19. JAMA 2020, 323, 1406–1407. [Google Scholar] [CrossRef] [PubMed] [Green Version]
- Rothe, C.; Schunk, M.; Sothmann, P.; Bretzel, G.; Froeschl, G.; Wallrauch, C.; Zimmer, T.; Thiel, V.; Janke, C.; Guggemos, W.; et al. Transmission of 2019-nCoV Infection from an Asymptomatic Contact in Germany. N. Engl. J. Med. 2020, 382, 970–971. [Google Scholar] [CrossRef] [PubMed] [Green Version]
- Hopkins, C.; Surda, P.; Whitehead, E.; Kumar, B.N. Early recovery following new onset anosmia during the COVID-19 pandemic—An observational cohort study. J. Otolaryngol.–Head Neck Surg. 2020, 49, 26. [Google Scholar] [CrossRef]
- Lee, Y.; Min, P.; Lee, S.; Kim, S.W. Prevalence and Duration of Acute Loss of Smell or Taste in COVID-19 Patients. J. Korean Med. Sci. 2020, 35, e174. [Google Scholar] [CrossRef]
- Brann, D.H.; Tsukahara, T.; Weinreb, C.; Lipovsek, M.; Van den Berge, K.; Gong, B.; Chance, R.; Macaulay, I.C.; Chou, H.J.; Fletcher, R.B.; et al. Non-neuronal expression of SARS-CoV-2 entry genes in the olfactory system suggests mechanisms underlying COVID-19-associated anosmia. Sci. Adv. 2020, 6, 31, eabc5801. [Google Scholar] [CrossRef]
- Menni, C.; Valdes, A.M.; Freidin, M.B.; Sudre, C.H.; Nguyen, L.H.; Drew, D.A.; Ganesh, S.; Varsavsky, T.; Cardoso, M.J.; Moustafa, J.S.E.; et al. Real-time tracking of self-reported symptoms to predict potential COVID-19. Nat. Med. 2020, 26, 1037–1040. [Google Scholar] [CrossRef]
- Guan, W.J.; Ni, Z.Y.; Hu, Y.; Liang, W.H.; Ou, C.Q.; He, J.X.; Liu, L.; Shan, H.; Lei, C.L.; Hui, D.S.C.; et al. Clinical Characteristics of Coronavirus Disease 2019 in China. N. Engl. J. Med. 2020, 382, 1708–1720. [Google Scholar] [CrossRef]
- Terpos, E.; Ntanasis-Stathopoulos, I.; Elalamy, I.; Kastritis, E.; Sergentanis, T.N.; Politou, M.; Psaltopoulou, T.; Gerotziafas, G.; Dimopoulos, M.A. Hematological findings and complications of COVID-19. Am. J. Hematol. 2020, 95, 834–847. [Google Scholar] [CrossRef] [Green Version]
- Xu, H.; Zhong, L.; Deng, J.; Peng, J.; Dan, H.; Zeng, X.; Li, T.; Chen, Q. High expression of ACE2 receptor of 2019-nCoV on the epithelial cells of oral mucosa. Int. J. Oral. Sci. 2020, 12, 8. [Google Scholar] [CrossRef] [PubMed]
- Liao, Y.C.; Liang, W.G.; Chen, F.W.; Hsu, J.H.; Yang, J.J.; Chang, M.S. IL-19 induces production of IL-6 and TNF-alpha and results in cell apoptosis through TNF-alpha. J. Immunol. 2002, 169, 4288–4297. [Google Scholar] [CrossRef] [PubMed] [Green Version]
- Aggarwal, S.; Gollapudi, S.; Gupta, S. Increased TNF-alpha-induced apoptosis in lymphocytes from aged humans: Changes in TNF-alpha receptor expression and activation of caspases. J. Immunol. 1999, 162, 2154–2161. [Google Scholar] [PubMed]
- Chan, J.F.; Zhang, A.J.; Yuan, S.; Poon, V.K.; Chan, C.C.; Lee, A.C.; Chan, W.M.; Fan, Z.; Tsoi, H.W.; Wen, L.; et al. Simulation of the Clinical and Pathological Manifestations of Coronavirus Disease 2019 (COVID-19) in a Golden Syrian Hamster Model: Implications for Disease Pathogenesis and Transmissibility. Clin. Infect. Dis. 2020, 71, 2428–2446. [Google Scholar] [CrossRef] [PubMed]
- Tan, L.; Wang, Q.; Zhang, D.; Ding, J.; Huang, Q.; Tang, Y.Q.; Wang, Q.; Miao, H. Lymphopenia predicts disease severity of COVID-19: A descriptive and predictive study. Signal Transduct. Target. Ther. 2020, 5, 33. [Google Scholar] [CrossRef] [PubMed]
- Zhao, Q.; Meng, M.; Kumar, R.; Wu, Y.; Huang, J.; Deng, Y.; Weng, Z.; Yang, L. Lymphopenia is associated with severe coronavirus disease 2019 (COVID-19) infections: A systemic review and meta-analysis. Int. J. Infect. Dis. 2020, 96, 131–135. [Google Scholar] [CrossRef]
- Laurie, K.L.; Rockman, S. Which influenza viruses will emerge following the SARS-CoV-2 pandemic? Influenza Other Respir. Viruses 2021, 15, 573–576. [Google Scholar] [CrossRef]
- Huang, Q.S.; Wood, T.; Jelley, L.; Jennings, T.; Jefferies, S.; Daniells, K.; Nesdale, A.; Dowell, T.; Turner, N.; Campbell-Stokes, P.; et al. Impact of the COVID-19 nonpharmaceutical interventions on influenza and other respiratory viral infections in New Zealand. Nat. Commun. 2021, 12, 1001. [Google Scholar] [CrossRef]


| Confirmed Patients | Negative Patients | |||
|---|---|---|---|---|
| Sex | male | 14 (51.9%) | 93 (48.9%) | p = 0.778 |
| female | 13 (48.1%) | 97 (51.1%) | ||
| Age (years) | 41.7 ± 18.5 | 40.7 ± 20.4 | p = 0.801 | |
| Underlying diseases | ||||
| HTN | yes | 3 (11.1%) | 32 (16.8%) | p = 0.449 |
| no | 24 (88.9%) | 158 (83.2%) | ||
| DM | yes | 1 (3.7%) | 15 (7.9%) | p = 0.436 |
| no | 26 (96.3%) | 175 (92.1%) | ||
| Hyperlipidemia | yes | 5 (18.5%) | 5 (2.6%) | p < 0.001 |
| no | 22 (81.5%) | 185 (97.4%) | ||
| Hyperuricemia | yes | 1 (3.7%) | 2 (1.1%) | p = 0.27 |
| no | 26 (96.3%) | 188 (98.9%) | ||
| CKD | yes | 0 | 2 (1.1%) | p = 0.592 |
| no | 27(100%) | 188 (98.9%) | ||
| CVA | yes | 1 (3.7%) | 2 (1.1%) | p = 0.27 |
| no | 26 (96.3%) | 188 (98.9%) | ||
| CAD | yes | 0 | 7(3.7%) | p = 0.311 |
| no | 27 (100%) | 183 (96.3%) | ||
| Cardiac arrhythmia | yes | 0 | 3 (1.6%) | p = 0.511 |
| no | 27 (100%) | 187 (98.4%) | ||
| VHD | yes | 0 | 4(2.1%) | p = 0.447 |
| no | 27 (100%) | 186 (97.9%) | ||
| CHF | yes | 0 | 8 (4.2%) | p = 0.447 |
| no | 27 (100%) | 182 (95.8%) | ||
| Bronchial asthma | yes | 0 | 7 (3.7%) | p = 0.311 |
| no | 27 (100%) | 183 (96.3%) | ||
| COPD | yes | 0 | 2 (1.1%) | p = 0.592 |
| no | 27 (100%) | 188 (98.9%) | ||
| Solid organ cancer | yes | 1 (3.7%) | 5 (2.6%) | p = 0.751 |
| no | 26 (96.3%) | 185 (97.4%) | ||
| Hematogenic disorder | yes | 0 | 2 (1.1%) | p = 0.592 |
| no | 27 (100%) | 188 (98.9%) | ||
| HIV infection | yes | 0 | 2 (1.1%) | p = 0.592 |
| no | 27 (100%) | 188 (98.9%) | ||
| Chronic hepatitis | yes | 2 (7.4%) | 5 (2.6%) | p = 0.189 |
| no | 25 (92.6%) | 185 (97.4%) | ||
| Autoimmune disease | yes | 0 | 5 (2.6%) | p = 0.394 |
| no | 27 (100%) | 185 (97.4%) | ||
| Chronic urticaria | yes | 0 | 3 (1.6%) | p = 0.511 |
| no | 27 (100%) | 187 (98.4%) | ||
| Allergic rhinitis | yes | 1 (3.7%) | 2 (1.1%) | p = 0.27 |
| no | 26 (96.3%) | 188 (98.9%) | ||
| Symptoms | Confirmed Patients | Negative Patients | ||
|---|---|---|---|---|
| Fever | yes | 17 (63%) | 83 (43.7%) | p = 0.06 |
| no | 10 (37%) | 107 (56.3%) | ||
| Cough | yes | 22 (81.5%) | 99 (52.1%) | p = 0.004 |
| no | 5 (18.5%) | 91 (47.9%) | ||
| Headache | yes | 4 (14.8%) | 19 (10%) | p = 0.447 |
| no | 23 (85.2%) | 171 (90%) | ||
| Muscle ache | yes | 5 (18.5%) | 15 (7.9%) | p = 0.074 |
| no | 22 (81.5%) | 175 (92.1%) | ||
| Distorted sense of taste | yes | 7 (25.9%) | 0 | p < 0.001 |
| no | 20 (74.1%) | 190 (100%) | ||
| Distorted sense of smell | yes | 10 (37%) | 1 (0.5%) | p < 0.001 |
| no | 17 (63%) | 189 (99.5%) | ||
| Rhinorrhea | yes | 12 (44.4%) | 27 (14.2%) | p < 0.001 |
| no | 15 (55.6%) | 163 (85.8%) | ||
| Sore throat | yes | 8 (29.6%) | 32 (16.8%) | p = 0.109 |
| no | 19 (70.4%) | 158 (83.2%) | ||
| Chest tightness | yes | 5 (18.5%) | 12 (6.3%) | p = 0.027 |
| no | 22 (81.5%) | 178 (93.7%) | ||
| Dyspnea | yes | 10 (37%) | 24 (12.6%) | p = 0.001 |
| no | 17 (63%) | 166 (87.4%) | ||
| Diarrhea | yes | 9 (33.3%) | 10 (5.3%) | p < 0.001 |
| no | 18 (66.7%) | 180 (94.7%) | ||
| Eye illness | yes | 1 (3.7%) | 1 (0.5%) | p = 0.106 |
| no | 26 (96.3%) | 189 (99.5%) | ||
| Nausea and vomiting | yes | 3 (11.1%) | 4 (2.1%) | p = 0.013 |
| no | 24 (88.9%) | 186 (97.9%) | ||
| Confirmed Patients | Negative Patients | |||
|---|---|---|---|---|
| Lab | WBC (/μΛ) | 5239 ± 1498 | 9907 ± 13,371 | p = 0.072 |
| Neutrophil (%) | 65.4 ± 11.4 | 68.6 ± 14.3 | p = 0.27 | |
| ANC (/μL) | 3436.7 ± 1151.8 | 7011.1 ± 8888.9 | p = 0.038 | |
| Lymphocyte (%) | 25.5 ± 11.1 | 23 ± 12.7 | p = 0.332 | |
| ALC (/μL) | 1334.4 ± 645.5 | 1912.4 ± 1357.8 | p = 0.031 | |
| CRP (mg/dL) | 1.8 ± 3.1 | 3.1 ± 6.1 | p = 0.117 | |
| PCT (ng/mL) | 0.08 ± 0.11 | 0.55 ± 0.84 | p = 0.071 | |
| D-dimer (mg/L) | 0.85 ± 1.8 | 4.1 ± 8.1 | p = 0.089 | |
| AST (U/L) | 21.1 ± 7.5 | 26.8 ± 31.8 | p = 0.353 | |
| ALT (U/L) | 18.6 ± 8.6 | 27.4 ± 37.3 | p = 0.242 | |
| Total bilirubin (mg/dL) | 0.53 ± 0.24 | 1.01 ± 1.50 | p = 0.2 | |
| BUN (mg/dL) | 13.2 ± 8.1 | 13.6 ± 9.0 | p = 0.84 | |
| Cr (mg/dL) | 0.82 ± 0.3 | 0.96 ± 1.26 | p = 0.57 | |
| Pneumonia | yes | 17 (63%) | 84 (44.2%) | |
| no | 10 (37%) | 106 (55.8%) | p = 0.068 |
| Model | Accuracy | Area under the Curve (AUC) | Sensitivity | Specificity | Positive Prediction Value (PPV) | Negative Predictive Value (NPV) |
|---|---|---|---|---|---|---|
| Support Vector Machine (SVM) | 88.89% | 64.29% | 100.00% | 88.37% | 28.57% | 100% |
| Decision tree | 91.11% | 71.43% | 42.86% | 100.00% | 100% | 90.48% |
| Random Forest | 88.88% | 64.29% | 28.57% | 100.00% | 100% | 88.37% |
| Artificial Neural Network | 91.11% | 83.83% | 71.43% | 94.74% | 71.43% | 94.74% |
Publisher’s Note: MDPI stays neutral with regard to jurisdictional claims in published maps and institutional affiliations. |
© 2022 by the authors. Licensee MDPI, Basel, Switzerland. This article is an open access article distributed under the terms and conditions of the Creative Commons Attribution (CC BY) license (https://creativecommons.org/licenses/by/4.0/).
Share and Cite
Wang, Y.-C.; Tsai, D.-J.; Yen, L.-C.; Yao, Y.-H.; Chiang, T.-T.; Chiu, C.-H.; Lin, T.-Y.; Yeh, K.-M.; Chang, F.-Y. Clinical Characteristics of COVID-19 Patients and Application to an Artificial Intelligence System for Disease Surveillance. J. Clin. Med. 2022, 11, 1437. https://doi.org/10.3390/jcm11051437
Wang Y-C, Tsai D-J, Yen L-C, Yao Y-H, Chiang T-T, Chiu C-H, Lin T-Y, Yeh K-M, Chang F-Y. Clinical Characteristics of COVID-19 Patients and Application to an Artificial Intelligence System for Disease Surveillance. Journal of Clinical Medicine. 2022; 11(5):1437. https://doi.org/10.3390/jcm11051437
Chicago/Turabian StyleWang, Ying-Chuan, Dung-Jang Tsai, Li-Chen Yen, Ya-Hsin Yao, Tsung-Ta Chiang, Chun-Hsiang Chiu, Te-Yu Lin, Kuo-Ming Yeh, and Feng-Yee Chang. 2022. "Clinical Characteristics of COVID-19 Patients and Application to an Artificial Intelligence System for Disease Surveillance" Journal of Clinical Medicine 11, no. 5: 1437. https://doi.org/10.3390/jcm11051437