
Spatial and Temporal Trends of SARS-CoV-2 RNA from Wastewater Treatment Plants over 6 Weeks in Cape Town, South Africa

 , , , , and
Abstract
:1. Introduction
2. Materials and Methods
2.1. Wastewater Sampling
2.2. Sample Concentration and RNA Extraction
2.3. Quantitative Real-Time Polymerase Chain Reaction Analysis
2.4. Statistical Analysis
2.5. Spatial Data
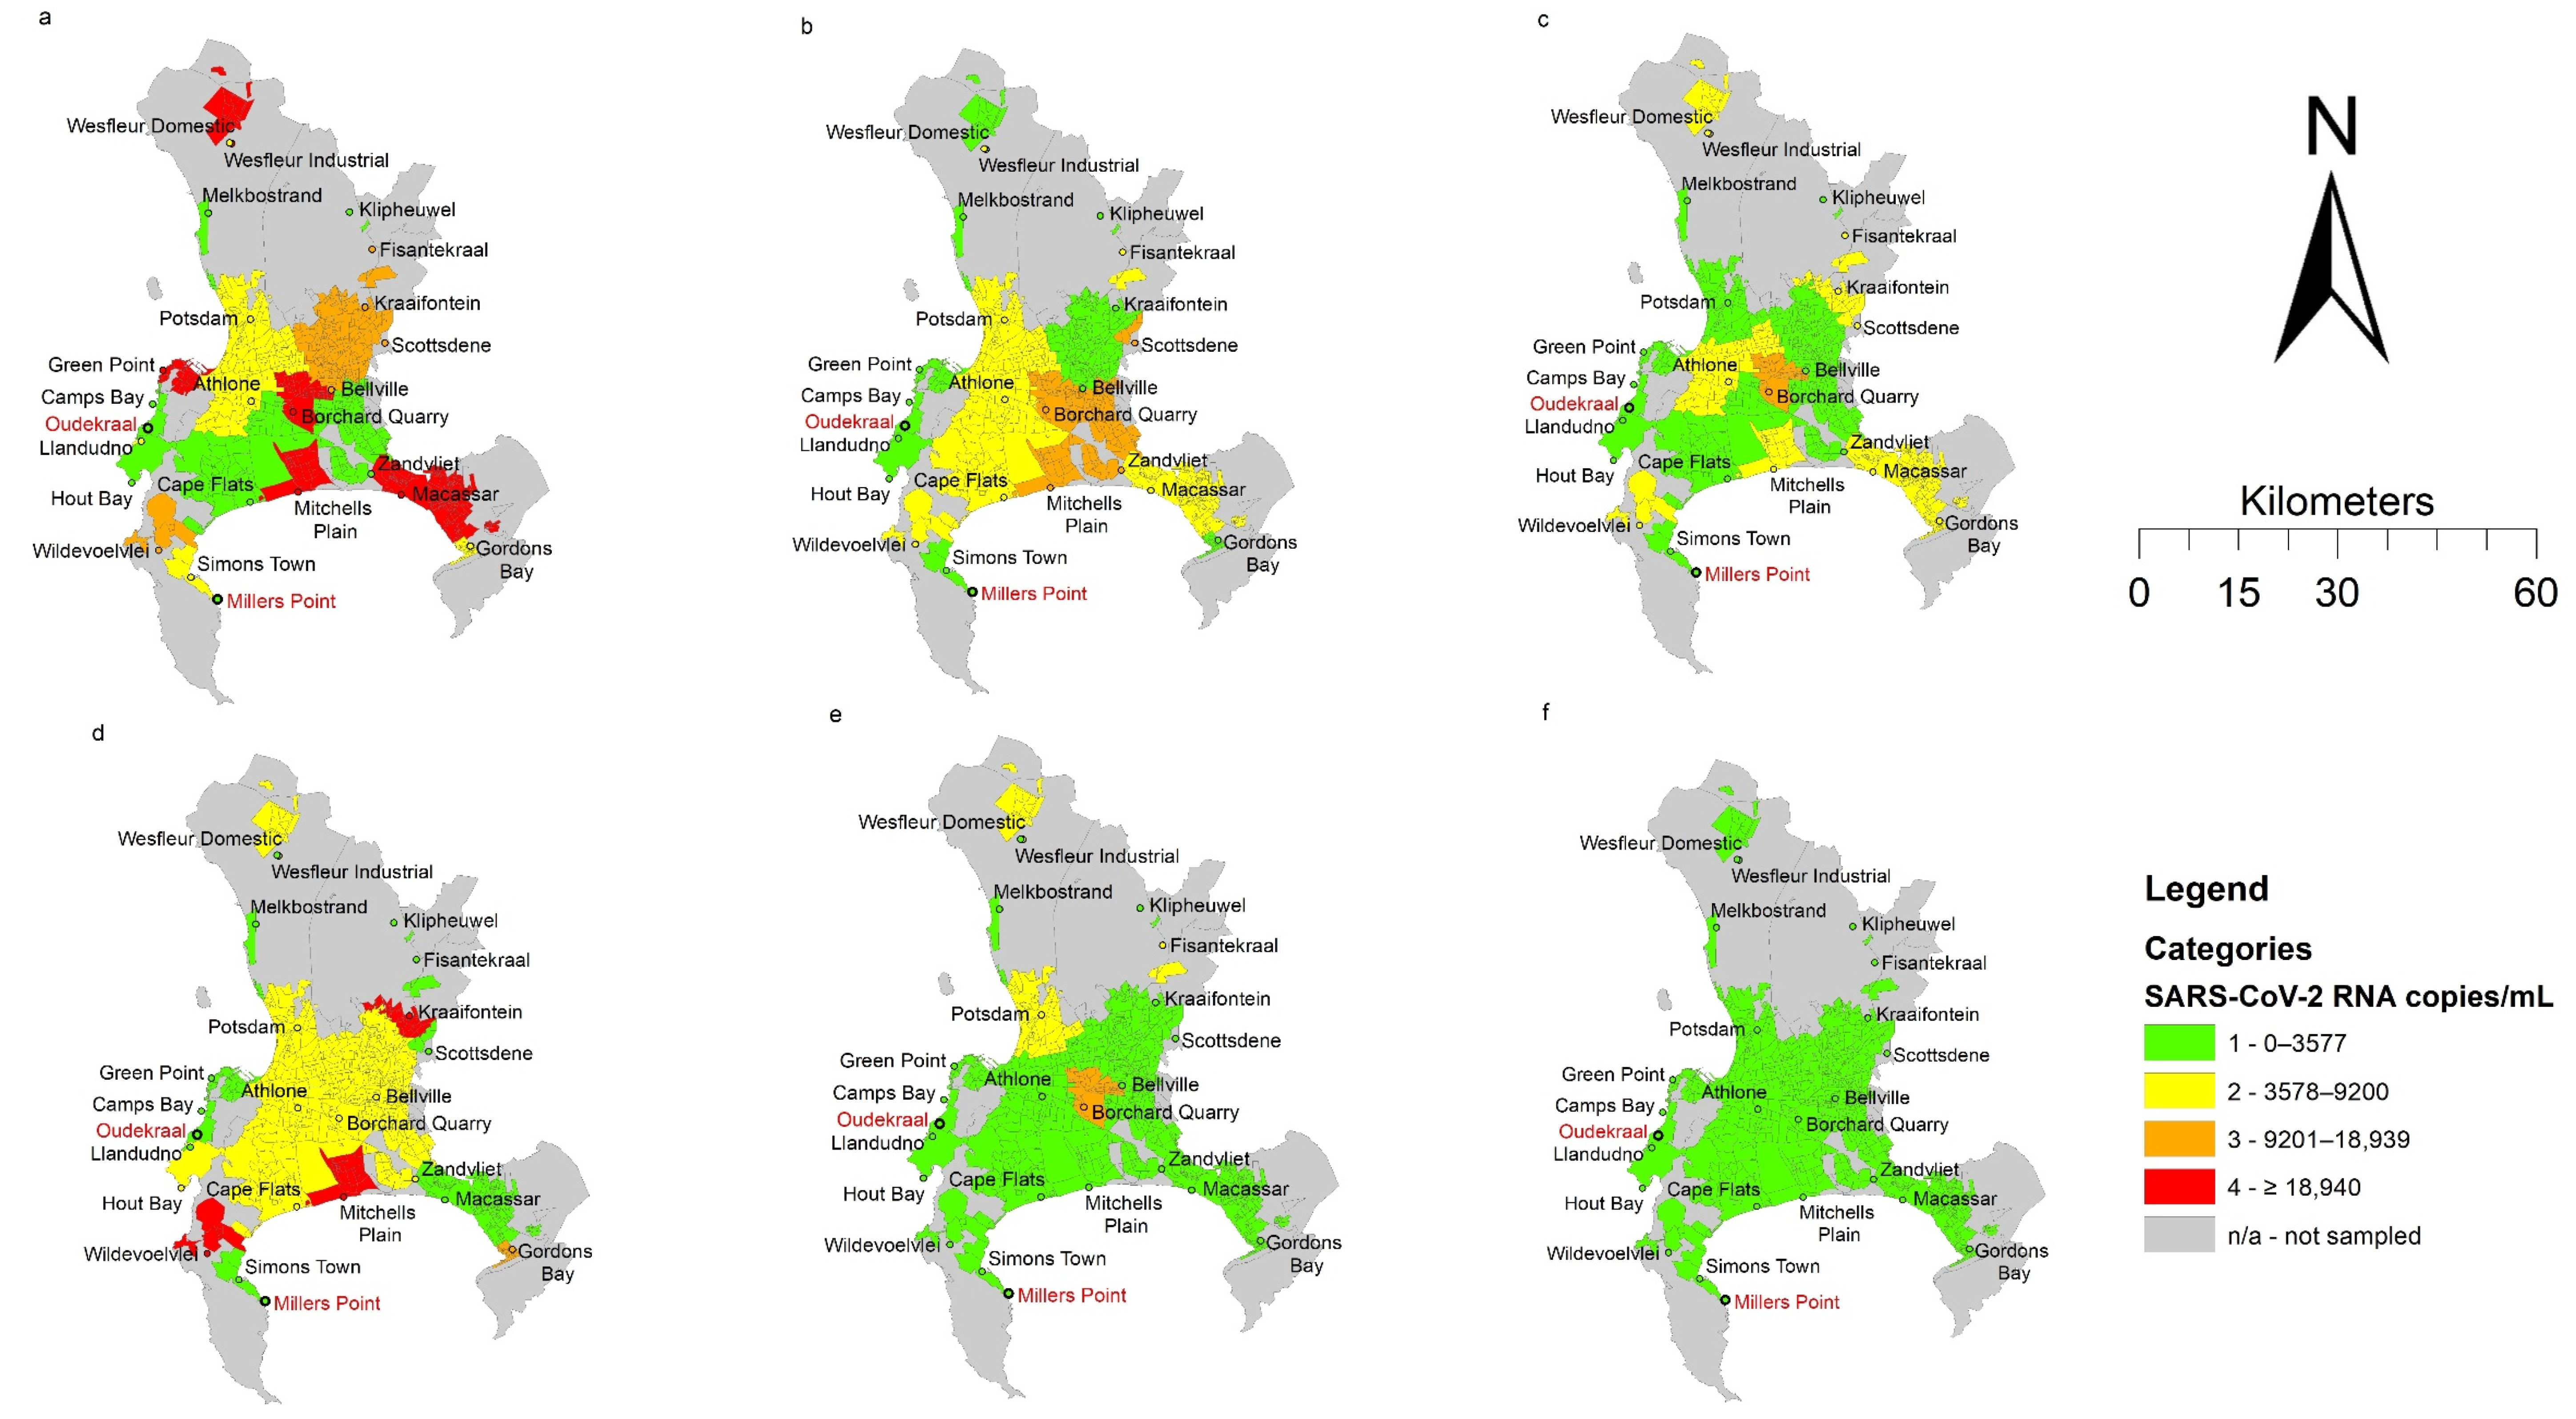
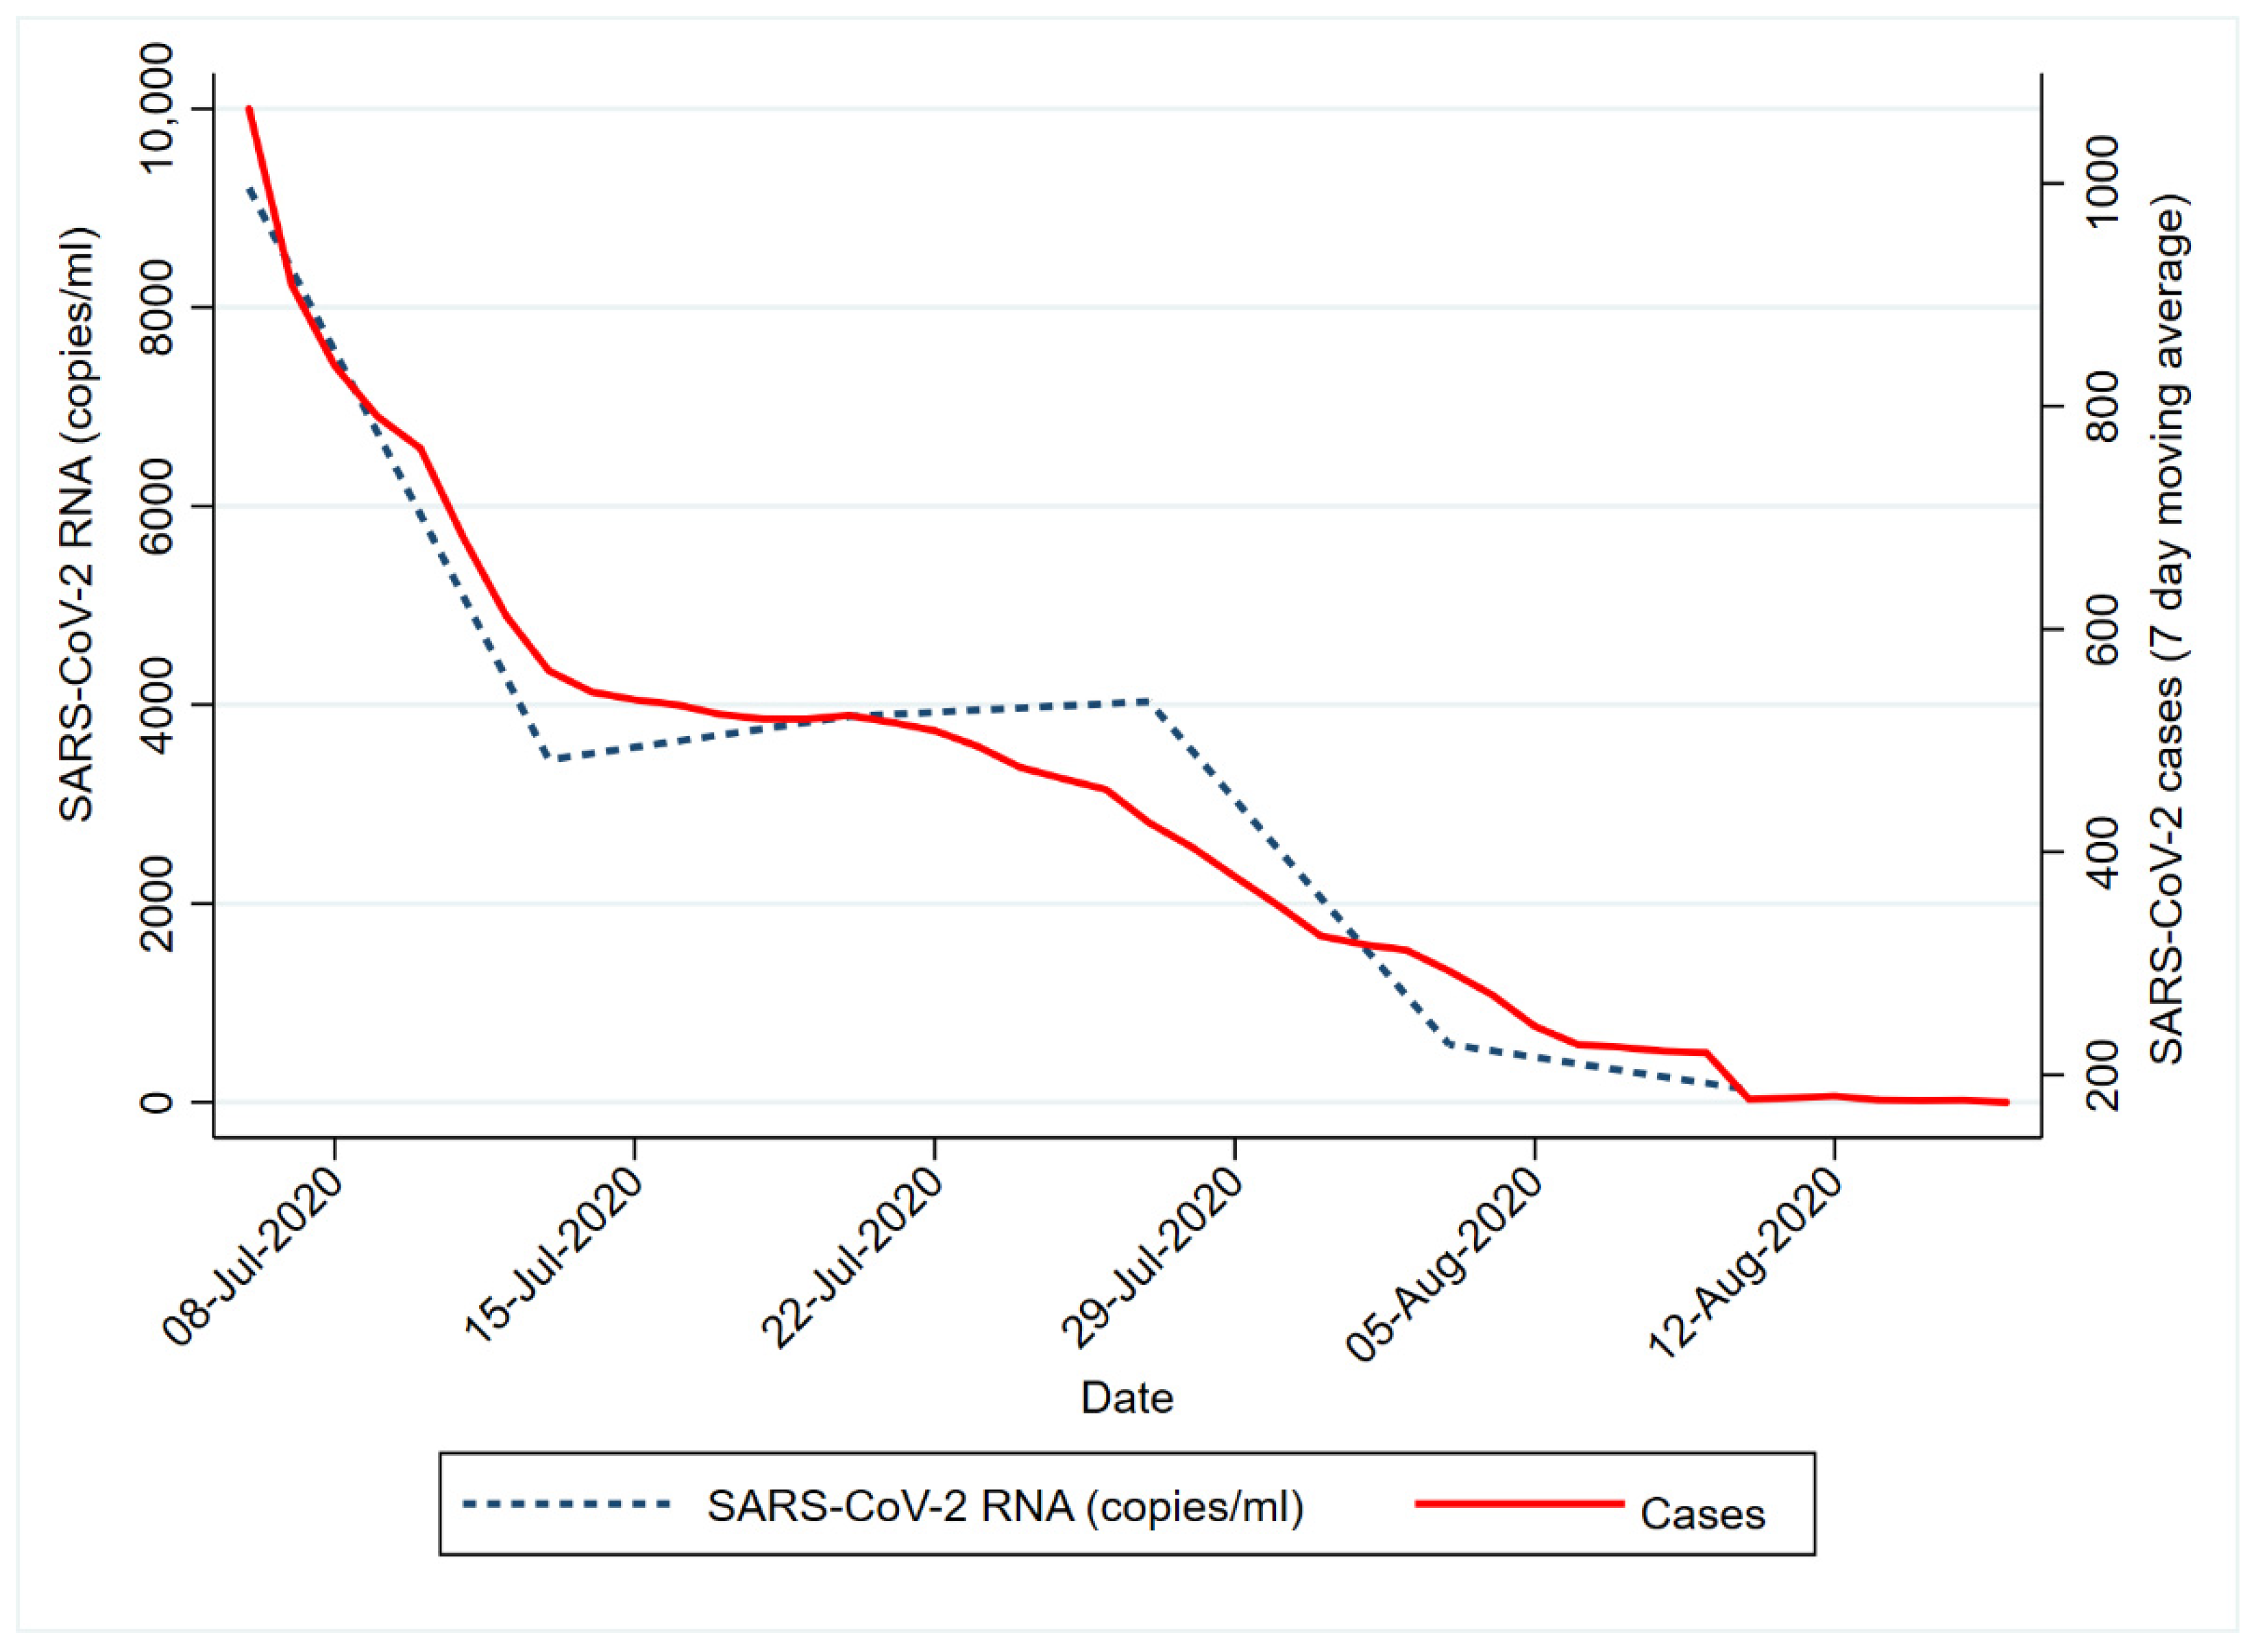
3. Results
4. Discussion
5. Conclusions
Supplementary Materials
Author Contributions
Funding
Institutional Review Board Statement
Informed Consent Statement
Data Availability Statement
Acknowledgments
Conflicts of Interest
References
- Hovi, T.; Shulman, L.; Van Der Avoort, H.; Deshpande, J.; Roivainen, M.; De Gourville, E. Role of environmental poliovirus surveillance in global polio eradication and beyond. Epidemiol. Infect. 2012, 140, 1–13. [Google Scholar] [CrossRef] [PubMed] [Green Version]
- Jiang, F.; Deng, L.; Zhang, L.; Cai, Y.; Cheung, C.W.; Xia, Z. Review of the clinical characteristics of coronavirus disease 2019 (COVID-19). J. Gen. Intern. Med. 2020, 35, 1545–1549. [Google Scholar] [CrossRef] [Green Version]
- Ahmed, W.; Angel, N.; Edson, J.; Bibby, K.; Bivins, A.; O’Brien, J.W.; Choi, P.M.; Kitajima, M.; Simpson, S.L.; Li, J.; et al. First confirmed detection of SARS-CoV-2 in untreated wastewater in Australia: A proof of concept for the wastewater surveillance of COVID-19 in the community. Sci. Total Environ. 2020, 728, 138764. [Google Scholar] [CrossRef]
- Medema, G.; Heijnen, L.; Elsinga, G.; Italiaander, R.; Brouwer, A. Presence of SARS-Coronavirus-2 RNA in sewage and correlation with reported COVID-19 prevalence in the early stage of the epidemic in the Netherlands. Environ. Sci. Technol. Lett. 2020, 7, 511–556. [Google Scholar] [CrossRef]
- WHO. Rapid expert consultation on environmental surveillance of SARS-CoV-2 in wastewater: Summary report: Virtual meeting. 23 July 2020. [Google Scholar]
- Government WC. COVID-19 Dashboard. Available online: https://coronavirus.westerncape.gov.za/covid-19-dashboard (accessed on 7 August 2021).
- NICD. Latest Confirmed Cases of Covid-19 in South Africa (6 July 2020). 2020. Available online: https://www.nicd.ac.za/latest-confirmed-cases-of-covid-19-in-south-africa-6-july-2020/ (accessed on 30 September 2021).
- Peccia, J.; Zulli, A.; Brackney, D.E.; Grubaugh, N.D.; Kaplan, E.H.; Casanovas-Massana, A.; Ko, A.I.; Malik, A.A.; Wang, D.; Wang, M.; et al. Measurement of SARS-CoV-2 RNA in wastewater tracks community infection dynamics. Nat. Biotechnol. 2020, 38, 1164–1167. [Google Scholar] [CrossRef] [PubMed]
- Johnson, R.; Muller, C.J.F.; Ghoor, S.; Louw, J.; Archer, E.; Surujlal-Naicker, S.; Berkowitz, N.; Volschenk, M.; Bröcker, L.H.L.; Wolfaardt, G.; et al. Qualitative and quantitative detection of SARS-CoV-2 RNA in untreated wastewater in Western Cape Province, South Africa. S. Afr. Med. J. 2021, 111, 5. [Google Scholar] [CrossRef]
- (CDC) CfDCaP. 2019-Novel Coronavirus (2019-nCoV) Real-time rRT-PCR Panel Primers and Probes; Department of Health and Human Services: Atlanta, Georgia. Available online: https://www.cdc.gov/coronavirus/2019-ncov/downloads/rt-pcr-panel-primer-probes.pdf (accessed on 6 October 2021).
- Randazzo, W.; Cuevas-Ferrando, E.; Sanjuan, R.; Domingo-Calap, P.; Sanchez, G. Metropolitan wastewater analysis for COVID-19 epidemiological surveillance. Int. J. Hyg. Environ. Health 2020, 230, 113621. [Google Scholar] [CrossRef]
- Randazzo, W.; Truchado, P.; Cuevas-Ferrando, E.; Simon, P.; Allende, A.; Sanchez, G. SARS-CoV-2 RNA in wastewater anticipated COVID-19 occurrence in a low prevalence area. Water Res. 2020, 181, 115942. [Google Scholar] [CrossRef] [PubMed]
- La Rosa, G.; Mancini, P.; Ferraro, G.B.; Veneri, C.; Iaconelli, M.; Bonadonna, L.; Lucentini, L.; Suffredini, E. SARS-CoV-2 has been circulating in northern Italy since December 2019: Evidence from environmental monitoring. Sci. Total Environ. 2021, 750, 141711. [Google Scholar] [CrossRef]
- Madhi, S.; Gray, E.G.; Ismail, N.; Izu, A.; Mendelson, M.; Cassim, N.; Stevens, W.; Venter, F. COVID-19 lockdowns in low-and middle-income countries: Success against COVID-19 at the price of greater costs. SAMJ S. Afr. Med. J. 2020, 110, 724–726. [Google Scholar] [CrossRef]
- Arora, S.; Nag, A.; Sethi, J.; Rajvanshi, J.; Saxena, S.; Shrivastava, S.K.; Gupta, A.B. Sewage surveillance for the presence of SARS-CoV-2 genome as a useful wastewater based epidemiology (WBE) tracking tool in India. Water Sci. Technol. 2020, 82, 2823–2836. [Google Scholar] [CrossRef]
- Claro, I.C.; Cabral, A.; Augusto, M.; Duran, A.; Graciosa, M.C.; Fonseca, F.L.; Speranca, M.A.; Bueno, R. Long term monitoring of SARA-CoV-2 RNA in wastewater in Brazil: A more responsive and economical approach. Water Res. 2021, 203, 117534. [Google Scholar] [CrossRef]
- Jawed, Z.; Krantzberg, G.; Voinson, S. Identifying Local Realities and Anticipating Challenges in Building Capacity of Ontario Municipal Wastewater Systems in Tracking for SARS-CoV-2. Int. J. World Policy Dev. Stud. 2021, 7, 13. [Google Scholar]
- Kumblathan, T.; Liu, Y.; Uppal, G.K.; Hrudey, S.E.; Li, X.F. Wastewater-Based Epidemiology for Community Monitoring of SARS-CoV-2: Progress and Challenges. ACS Environ. 2021. [Google Scholar] [CrossRef]
- Gonzalez, R.; Curtis, K.; Bivins, A.; Bibby, K.; Weir, M.H.; Yetka, K.; Tompson, H.; Keeling, D.; Mitchell, J.; Gonzalez, D. COVID-19 surveillance in Southeastern Virginia using wastewater-based epidemiology. Water Res. 2020, 186, 116296. [Google Scholar] [CrossRef] [PubMed]
- Evans, J. Only 7 Active Covid-19 Cases Left after 113 Infections Linked to Cape Town ‘Superspreader’ Event. News24 2020. Available online: https://www.news24.com/news24/southafrica/news/only-7-active-covid-19-cases-left-after-113-infections-linked-to-cape-town-superspreader-event-20201030 (accessed on 6 October 2021).
- Meningitis CfRDa. An Update on COVID-19 Outbreak in South Africa The First and the Second Wave of COVID-19 Cases in South Africa. NICD-NHLS. Available online: https://www.nicd.ac.za/wp-content/uploads/2021/01/An-update-on-COVID-19-outbreak-in-South-Africa_The-first-and-second-wave.pdf (accessed on 18 January 2021).
- Richardson, H. How Waste Water is Helping South Africa Fight COVID-19. Nature 2021, 593, 616–617. Available online: https://www.nature.com/articles/d41586-021-01399-9 (accessed on 30 September 2021). [CrossRef] [PubMed]
- Commission Recommendations (EU) on a common approach to establish a systematic surveillance of SARS-CoV-2 and its variant in wastewater in the EU. Off. J. Eur. Union 2021, 472. Available online: https://eur-lex.europa.eu/legal-content/EN/ALL/?uri=uriserv:OJ.L_.2021.098.01.0003.01.ENG (accessed on 6 October 2021).
- Welfare FIfHa. Coronavirus Wastewater Monitoring. Available online: https://thl.fi/en/web/thlfi-en/research-and-development/research-and-projects/sars-cov-2-at-wastewater-treatment-plants/coronavirus-wastewater-monitoring (accessed on 30 September 2021).
- Rjiksoverheid. Coronavirus Dashboard. 2021. Available online: https://coronadashboard.government.nl/landelijk/rioolwater (accessed on 30 September 2021).
- (CDC) CfDCaP. National Wastewater Surveillance System. 2021. Available online: https://www.cdc.gov/healthywater/surveillance/wastewater-surveillance/wastewater-surveillance.html (accessed on 30 September 2021).
- Barrios, M.E.D.S.; Torres, C.; Costamagna, D.M.; Fernández, M.D.B.; Mbayed, V.A. Dynamics of SARS-CoV-2 in wastewater in three districts of Buenos Aires metropolitan region, Argentina, throughout nine months of surveillance: A pilot study. Sci. Total Environ. 2021, 800, 149578. [Google Scholar] [CrossRef]
- Prado, T.; Fumian, T.M.; Mannarino, C.F.; Resende, P.C.; Motta, F.C.; Eppinghaus, A.L.F.; do Vale, V.H.C.; Braz, R.M.S.; da Silva Ribeiro de Andrade, J.; Maranhao, A.G. Wastewater-based epidemiology as a useful tool to track SARS-CoV-2 and support public health policies at municipal level in Brazil. Water Res. 2021, 191, 116810. [Google Scholar] [CrossRef]
- Kumar, M.; Patel, A.K.; Shah, A.V.; Raval, J.; Rajpara, N.; Joshi, M.; Joshi, C.G. First proof of the capability of wastewater surveillance for COVID-19 in India through detection of genetic material of SARS-CoV-2. Sci. Total Environ. 2020, 746, 141326. [Google Scholar] [CrossRef]
- Hou, C.; Chu, T.; Chen, M.; Hua, Z.; Xu, P.; Xu, H.; Wang, Y.; Liao, J.; Di, B. Application of multi-parameter population model based on endogenous population biomarkers and flow volume in wastewater epidemiology. Sci. Total Environ. 2021, 759, 143480. [Google Scholar] [CrossRef]
- Feng, S.; Roguet, A.; McClary-Gutierrez, J.S.; Newton, R.J.; Kloczko, N.; Meiman, J.G.; McLellan, S.L. Evaluation of sampling, analysis, and normalization methods for SARS-CoV-2 concentrations in wastewater to assess COVID-19 burdens in Wisconsin communities. Acs EsT Water. 2021, 1, 1955–1965. [Google Scholar] [CrossRef]
- Blumberg, L.; Jassat, W.; Mendelson, M.; Cohen, C. The COVID-19 crisis in South Africa: Protecting the vulnerable. S. Afr. Med. J. 2020, 110, 825–826. [Google Scholar] [CrossRef] [PubMed]
- Pearce, N.; Vandenbroucke, J.P.; VanderWeele, T.J.; Greenland, S. Accurate statistics on COVID-19 are essential for policy guidance and decisions. Am. Public Health Assoc. 2020, 110, 949–951. [Google Scholar] [CrossRef]
- Wu, S.L.; Mertens, A.N.; Crider, Y.S.; Nguyen, A.; Pokpongkiat, N.N.; Djajadi, S.; Seth, A.; Hsiang, M.S.; Colford, J.M.; Reingold, A.; et al. Substantial underestimation of SARS-CoV-2 infection in the United States. Nat. Commun. 2020, 11, 4507. [Google Scholar] [CrossRef] [PubMed]


| Organism | Target | Assay Name | Target | Part Number | Product Number | Cycling Parameters | References |
|---|---|---|---|---|---|---|---|
| SARS-CoV-2 | N protein | 2019-nCoV CDC | N1 primer/probe | RV202001 RV202015 | 10006606 | 50 °C–10 min 95 °C–3 min PCR: 40 Cycles 95 °C–15 s 60 °C–60 s | [8,10] |
| N2 primer/probe | RV202002 RV202016 | 10006606 |
Publisher’s Note: MDPI stays neutral with regard to jurisdictional claims in published maps and institutional affiliations. |
© 2021 by the authors. Licensee MDPI, Basel, Switzerland. This article is an open access article distributed under the terms and conditions of the Creative Commons Attribution (CC BY) license (https://creativecommons.org/licenses/by/4.0/).
Share and Cite
Street, R.; Mathee, A.; Mangwana, N.; Dias, S.; Sharma, J.R.; Ramharack, P.; Louw, J.; Reddy, T.; Brocker, L.; Surujlal-Naicker, S.; et al. Spatial and Temporal Trends of SARS-CoV-2 RNA from Wastewater Treatment Plants over 6 Weeks in Cape Town, South Africa. Int. J. Environ. Res. Public Health 2021, 18, 12085. https://doi.org/10.3390/ijerph182212085
Street R, Mathee A, Mangwana N, Dias S, Sharma JR, Ramharack P, Louw J, Reddy T, Brocker L, Surujlal-Naicker S, et al. Spatial and Temporal Trends of SARS-CoV-2 RNA from Wastewater Treatment Plants over 6 Weeks in Cape Town, South Africa. International Journal of Environmental Research and Public Health. 2021; 18(22):12085. https://doi.org/10.3390/ijerph182212085
Chicago/Turabian StyleStreet, Renée, Angela Mathee, Noluxabiso Mangwana, Stephanie Dias, Jyoti Rajan Sharma, Pritika Ramharack, Johan Louw, Tarylee Reddy, Ludwig Brocker, Swastika Surujlal-Naicker, and et al. 2021. "Spatial and Temporal Trends of SARS-CoV-2 RNA from Wastewater Treatment Plants over 6 Weeks in Cape Town, South Africa" International Journal of Environmental Research and Public Health 18, no. 22: 12085. https://doi.org/10.3390/ijerph182212085