

Research on the Priority of Service Quality Index for Online English Teaching during the COVID-19 Pandemic: Dual Perspective

1
School of Educational Science, Minnan Normal University, Zhengzhou 363000, China
2
Department of Interaction Design, Chang Jung Christian University, Tainan 71101, Taiwan
3
General Department, National and Kapodistrian University of Athens, GR-34400 Euripus Campus, 15772 Athens, Greece
4
Department of Visual Communication Design, Huzhou University, Huzhou 313000, China
*
Author to whom correspondence should be addressed.
Mathematics 2022, 10(19), 3642; https://doi.org/10.3390/math10193642
Submission received: 9 August 2022
/
Revised: 22 September 2022
/
Accepted: 29 September 2022
/
Published: 5 October 2022
(This article belongs to the Special Issue Selected Papers from the International Conference of Numerical Analysis and Applied Mathematics (ICNAAM))
Abstract
:Online English education has become a very common way of educating and learning during the coronavirus pandemic. However, the weight analysis index for the service quality survey of the online English education industry remains a research gap during this period. Thus, this research implemented the analytic network process (ANP) to analyse the index, weight and ranking of online English teaching based on the service quality (SERVQUAL) questionnaire and compare the differences between the dual perspectives of service providers and consumers. Interestingly, this research found that the dimension of responsiveness was considered the most important by service providers. However, consumers deemed the dimension of assurance to be the most significant. Meanwhile, this study discovered that consumers paid more attention to reassurance and safety when they faced problems and transaction procedures during the coronavirus pandemic. In addition, this research found that dimensions utilised to evaluate the quality of online education service are similar whether in the COVID-19 epidemic or prior to the coronavirus pandemic. Thus, it has a certain reference value for evaluating the service quality of online English teaching through the use of dimensions and index weights in the SERVQUAL scale during the coronavirus pandemic. Finally, the findings of this research revealed weights of dimensions and indicators, thereby providing suggestions for maintaining good service quality within online English teaching during the COVID-19 pandemic.
MSC:
68U351. Introduction
1.1. Motivation
The COVID-19 pandemic has presented new challenge for education institutions across the world. Students at almost all levels were affected [1]. Nowadays, many educational institutions have adapted numerous online teaching and learning methods in response to the pandemic. Therefore, more and more research studies about online learning and teaching during the COVID-19 pandemic have been published. For example, Dhawan [2] proposed a work for the analysis of e-learning modes in India during the COVID-19 pandemic, including strengths, weakness, opportunities and challenges. Agarwal et al. [3] in 2020 demonstrated that the majority of medical students considered the online sessions interesting and enjoyable. Meanwhile, participants responded that online sessions were a good utilisation of time [3]. Similarly, some research [4,5,6] revealed the perception of mechanical engineering and agriculture students on online learning. The results of these research [4,5,6] illustrated that the characteristics of online learning, including flexibility and convenience, make it an attractive option for students.
Hazaymeh [7] found that students had a positive attitude towards online distance learning. Hazaymeh [7] reported that 86.66% of students successfully acquire language proficiency via online distance learning in a flexible and suitable learning environment. Some studies [8,9,10] provided recommendations for the accessibility and friendliness of online education environments, applications and learning platforms. Moreover, some works [11,12] demonstrated that online learning was an effective method and students were satisfied with the online learning environment during the coronavirus pandemic.
Some studies [3,4,5,6,7,8,9,10,11,12] mentioned positive results and practical suggestions for online learning research. However, we still noticed that a few scholars [13,14,15] reported negative results of online education. For example, Mahyoob [13] found that most English language learners (EFL) in Saudi Arabia are not satisfied with online learning in language learning performance during the COVID-19 pandemic. Abbasi et al. [14] reported that students who study in Medical and Dental prefer more face-to-face teaching than e-teaching in Pakistan. Similarly, Adnan et al. [15] reported that online learning is not able to produce desired results in Pakistan. Even though the sample size of this study [15] was small and non-randomised, it is still significant for the relevant research on online learning in most underdeveloped countries.
Nonetheless, the perspective of students is still implemented by some researchers [16,17,18,19] for investigating the effect of e-learning. This explains that the perception of students towards online learning is still a vital factor for relevant studies in the COVID-19 crisis. Budur [16] investigated the perception of students via a questionnaire based on the Likert scale. Famularsih [17] conducted a case study in Indonesia and demonstrated that most of the students considered that learning English online is effective and efficient during the COVID-19 epidemic. Jin et al. [18] discussed the significant impact of push–pull–mooring theory for transferring from an offline to e-learning environment by investigating the perception of Chinese students in 2021. Likewise, Lin et al. [19] proposed a comprehensive research model and explored the impact of online learning during the COVID-19 pandemic on students’ attitude and behavioural intention.
In addition to the perception of learners, some researchers [20,21,22] provided advice on online teaching strategies and information technology tools for university teachers and early career educators during the COVID-19 pandemic. Zou et al. [23] investigated the perceptions of university teachers and students for measuring the effectiveness of English language online teaching and learning. They [23] found that teachers and students were satisfied with the experience of online teaching and learning. Meanwhile, the research findings [23] revealed that teachers could deliver more effective online teaching when teachers have more training, skills and confidence. Likewise, there are many research studies [24,25,26,27,28,29,30,31,32,33] that related to the perspective of teachers and instructors from many perspectives and have become significant references for relevant studies.
Interestingly, several studies [1,2,3,4,5,6,7,8,9,10,11,12,13,14,15,16,17,18,19,20,21,22,23,24,25,26,27,28,29,30,31,32,33,34,35,36,37,38,39] on online education from various perspectives have been established and published during the COVID-19 pandemic. Among them, some research [34,35,36,37,38,39] investigated online education service quality using various methods. Unfortunately, the research about service quality using the SERVQUAL scale for online English teaching is insufficient during the COVID-19 pandemic. Most service providers of online English teaching do not know whether their service can satisfy the consumer or not. Therefore, analysing the weight of service quality indicators for online English teaching is needed to solve this problem and fill the research gap.
1.2. Objectives
In the view of this, this research will establish a framework that is based on the service quality (SERVQUAL) scale to measure the service quality of online English teaching through expert interviews. Then, the expert perspectives from service providers and consumers will be collected by questionnaires. Finally, the method of analytic network process (ANP) will be utilised to calculate weights of dimensions and indicators to achieve the following research purposes:
- To analyse the weight of dimensions and indicators for online English teaching service quality from the expert perspectives of service providers during the COVID-19 pandemic.
- To analyse the weight of dimensions and indicators for online English teaching service quality from the expert perspective of consumers during the COVID-19 pandemic.
- To explore the differences between the weight of dimensions and indicators for online English teaching service quality from the dual expert perspectives of service providers and consumers during the COVID-19 epidemic.
- To fill in the research gap of online English teaching service quality during the COVID-19 pandemic, thereby providing relevant decision-making suggestions for online English teaching service providers.
2. Literature Review
Based on the objective of this study, we firstly reviewed and summarised the related works of service quality evaluation. Then, this research organised and compared the related research methods of weight analysis, thereby establishing the research framework and process of weights analysis for the dimensions and indicators of online English teaching service quality in the coronavirus outbreak.
2.1. Service Quality Measurement
From the 1970s, service quality has been gradually studied by scholars [40,41,42,43,44,45,46,47,48,49]. They considered that service quality mainly refers to the degree of difference between customers’ subjective expectations and actual service perceptions. To quantify the concept of service quality, Parasuraman et al. [40] proposed the equation of service quality calculation in 1895. The equation has been widely used by many scholars within these decades.
The equation of service quality measurement is:
means service quality, represents the service quality of customers’ perceptions, and is the service quality of customers’ expectations.
After the service quality measurement equation was announced, Parasuraman et al. [40] conducted many surveys. In 1988, Parasuraman et al. [41] proposed the SERVQUAL scale. Afterwards, the high reliability and validity of the SERVQUAL scale had been confirmed by researchers [42,43,44,45,46,47,48,49]. Asubonteng et al. [49] also reported that the SERVQUAL scale has become a very common tool for the service quality measurement in recent decades.
Moreover, Altuntas et al. [50] presented a case study of a multi-criteria decision-making (MCDM) approach based on the weighted SERVQUAL scale to measure the perceived degree of service quality in Turkish hospitals. The research results of Altuntas et al. [50] proved that the integrated research method of the SERVQUAL scale and MCDM methods has its feasibility for the measurement of service quality.
The SERVQUAL scale has contained the following five dimensions and twenty-two indicators [40,41,42,43,44,45,46,47,48,49,50].
- Tangibility: it represents that physical parts that consumers can see, including equipment, tools and personnel clothing.
- Reliability: it refers to ability to properly implement service commitments.
- Responsiveness: it refers to the willingness to help consumers and the ability to provide immediate service.
- Assurance: it means that service personnel possess the knowledge, skills, courtesy required to provide service and the ability to perform tasks satisfactorily.
- Empathy: it refers to the ability to pay special attention to consumers and provide customisable service.
In order to calculate the service quality score, this research combined the equation of service quality measurement and SERVQUAL scale to obtain the equation of service quality score calculation.
represents that the service quality score.
refers to the score of the indicator in terms of customer perception on the SERVQUAL scale ().
refers to the score of the indicator in terms of customer expectation on the SERVQUAL scale ().
According to the equation of service quality score calculation, a reasonable service quality score can be calculated by weighting, as long as the weight value of each industry indicator in the SERVQUAL scale is obtained.
2.2. Choice of Weight Research Method
As for the choice of weight research method, currently, widely used include technique for order preference by similarity to ideal solution (TOPSIS), analytic hierarchy process (AHP) and analytic network process (ANP). The TOPSIS method was proposed by Huang and Yoon [51] in 1981. Behzadian et al. [52] mentioned that the top 3 suitable application fields of the TOPSIS method were Supply Chain Management, Design, Engineering, Manufacturing Systems and Business by reviewing over 200 scientific papers from 103 journals since 2000. Similarly, Panda et al. [53] reported that the top 3 suitable research fields using TOPSIS methods were Supply Chain Management, Human Resources and Engineering Design System via summarising numerous research works and results in 2018.
Although the TOPSIS method has been widely used in many fields, some research [53,54,55] still reported that the following disadvantages were identified for the TOPSIS method.
- TOPSIS method will confuse the advantages between computing alternatives, largely because a decision maker will assign a random scalar value according to its preference for different alternatives and corresponding criteria for the normalised decision matrix operation.
- The TOPSIS method will not play a decisive role in the rank inversion problem when adding a new alternative.
- The standard form of the TOPSIS method is deterministic and does not consider the uncertainty of the weights
- The TOPSIS method will be able to provide unreliable results very easily.
Given that the TOPSIS method will not consider the uncertainty of the weights and be prone to produce unreliable results, these characteristics conflict with the research properties of this study that need to consider weight dependencies. Based on the above research results [53,54,55], we will not use the TOPSIS method as the weight analysis and research method of this research.
As for methods of AHP and ANP, they were proposed by Saaty in 1980 and 1996, respectively [56,57,58,59]. The ANP method was extended from the AHP method. The main purpose of these two research methods is to deal with MCDM issues, thereby providing decision-makers with the priority of various options to make the most suitable decision. Table 1 demonstrated the advantage and disadvantage of AHP and ANP methods.
According to research results of Saaty [56,57,58,59], we concluded the commonalities between AHP and ANP methods, which are the establishment of groups and sub-goals under the overall goal that gradually extends to the lowest level and finally form a hierarchical structure. Sub-goals contain assessment indicators, criteria or elements. Afterwards, the AHP and ANP methods can compare the evaluation scales in pairs and calculate the eigenvectors, thereby evaluating the weight difference between the indicators. Finally, through comprehensive weighting analysis, the multiple weights among the evaluation indicators are analysed to understand the priority of each indicator.
The differences between the AHP and ANP methods are that the AHP method assumes that the indicators and groups are independent of each other, while the ANP method considers the relationship between external dependencies, internal correlations, groups and feedback of each indicator. As for the analysis methods, the AHP method uses the pairwise comparison matrix formed by the pairwise comparison of the indicators to calculate the largest eigenvalue and eigenvector, thereby analysing the indicator weights. The ANP method presents the strength of the indicator dependency through a super matrix composed of multiple sub-matrices representing the relationship. Finally, the indicator weights of ANP methods are analysed via the limiting super matrix that has gradually converged by multiplying the weighted matrix by itself [56,57,58,59].
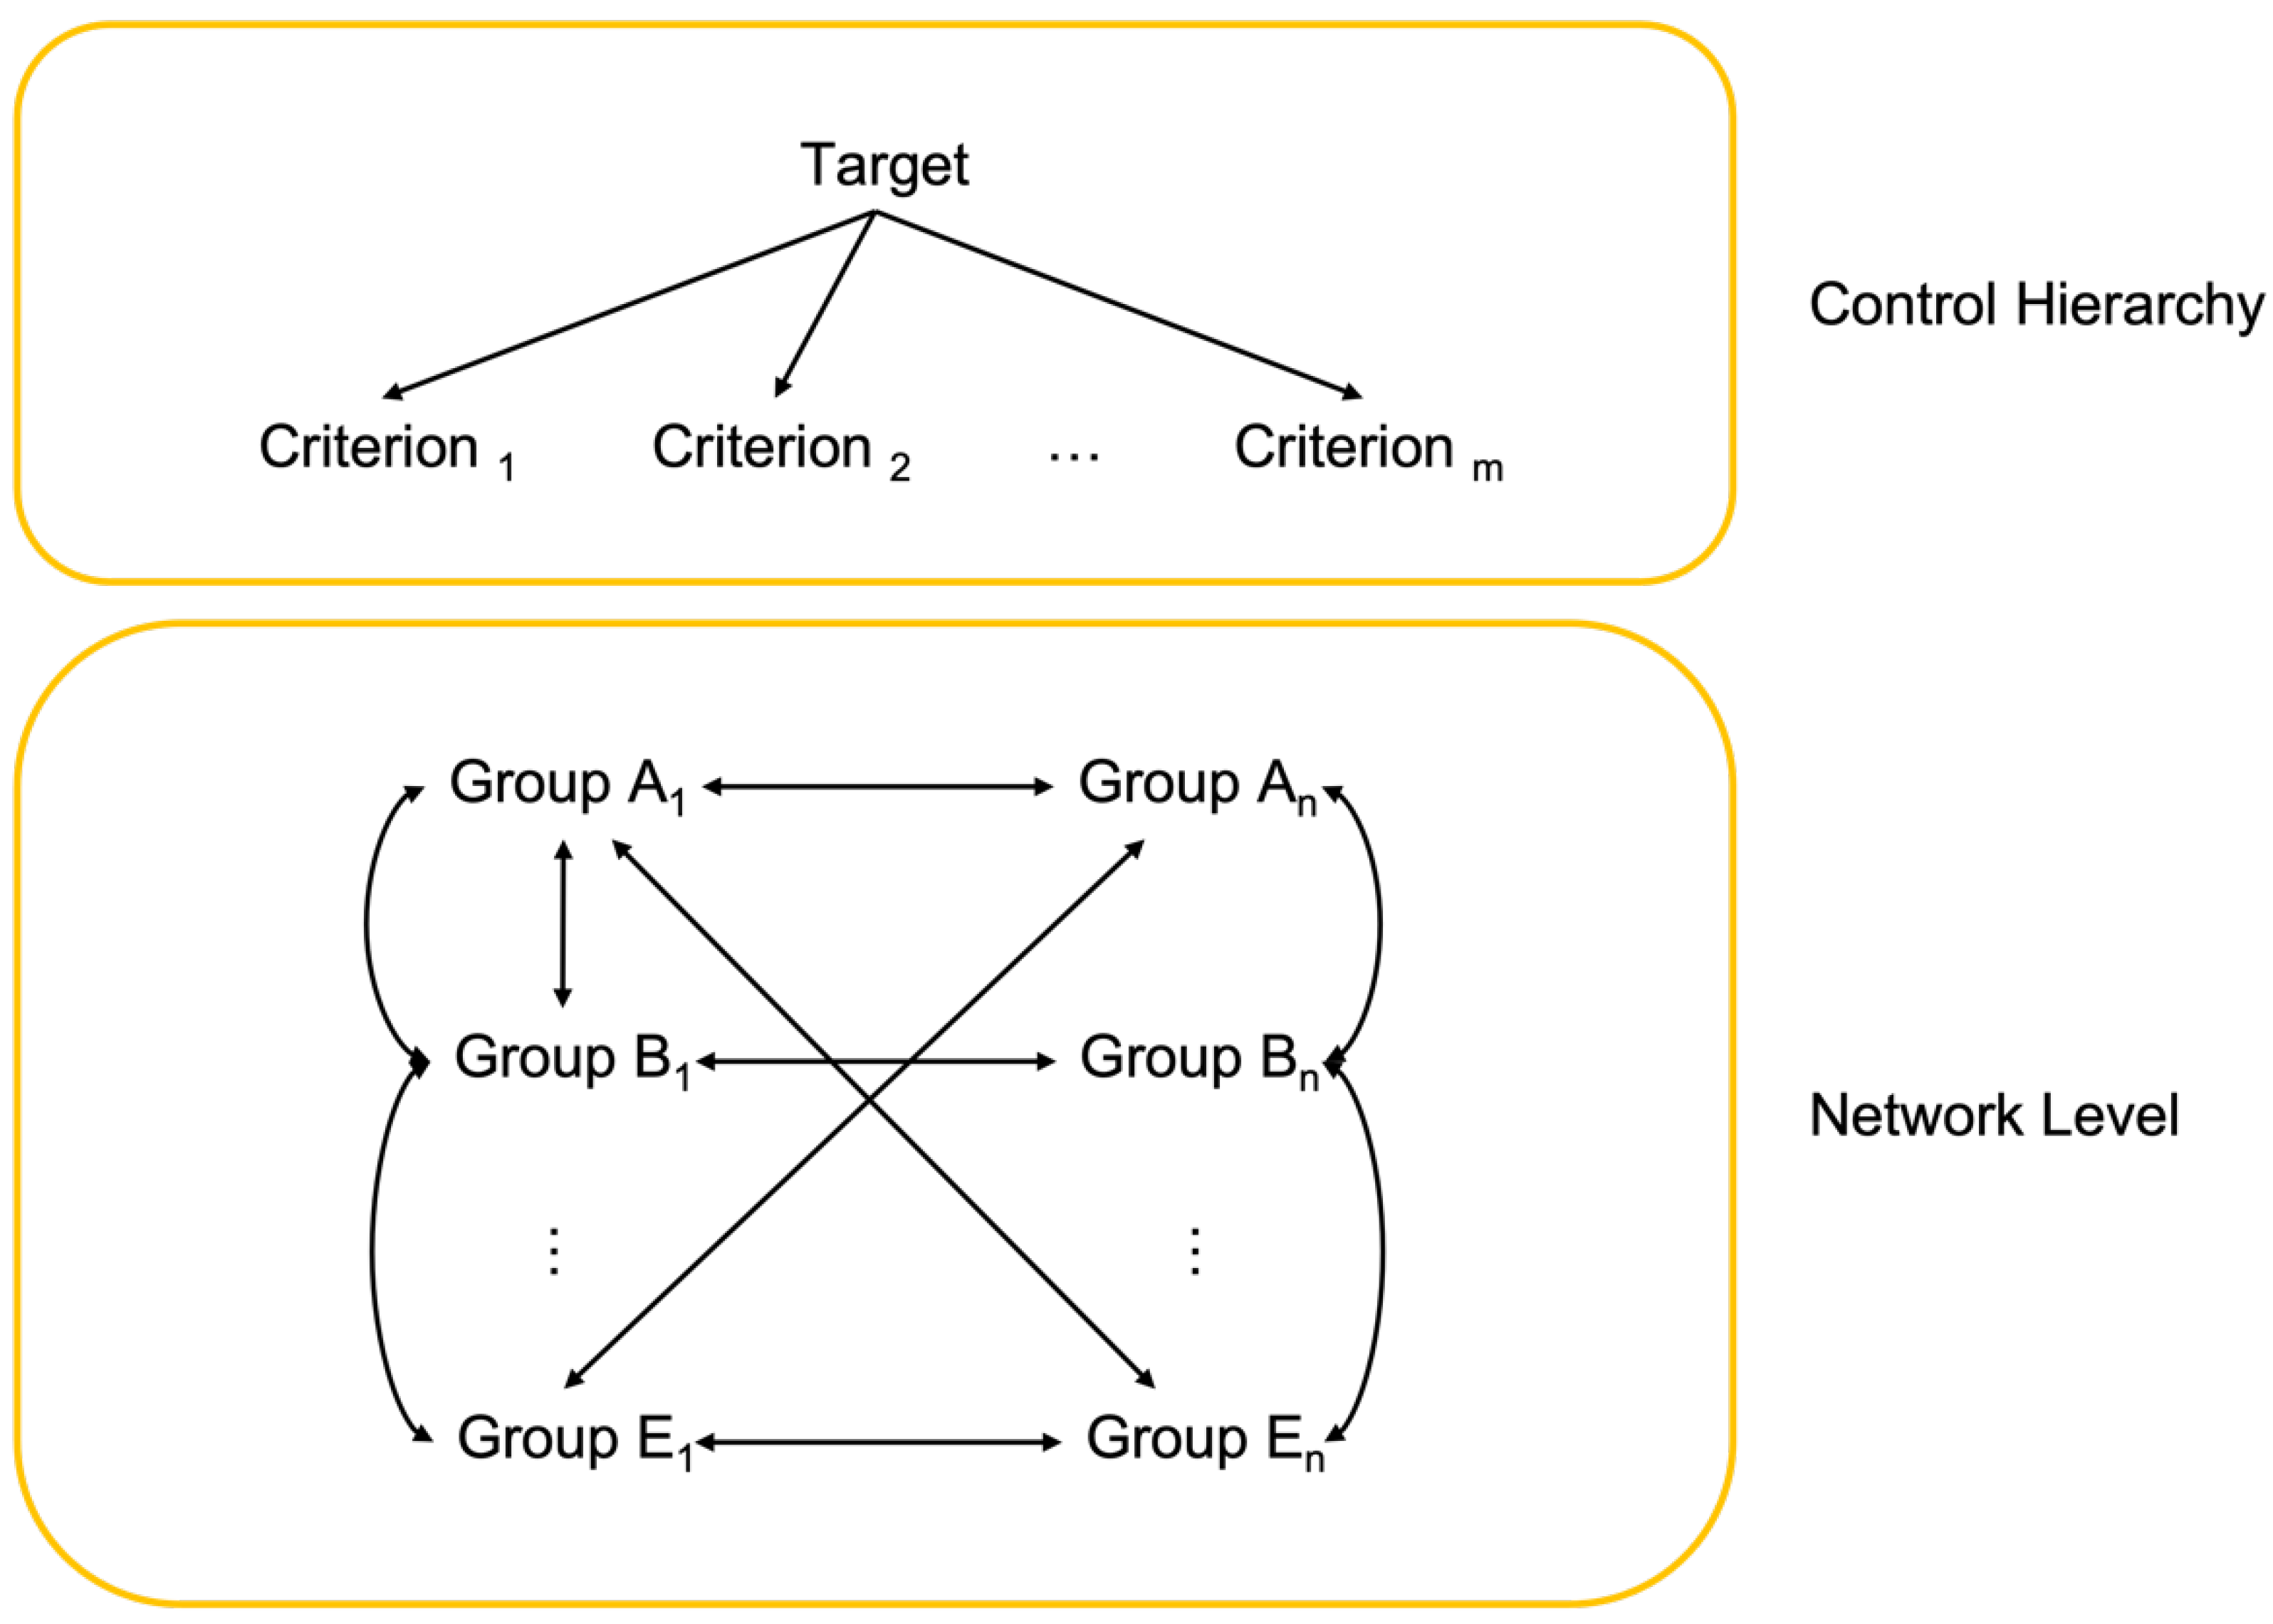
Meanwhile, scholars [60,61] mentioned that the AHP method only considers the dominance of upper-level elements over lower-level elements, while assuming that elements at each level are independent of each other. However, in many practical problems, the elements within each criterion hierarchy are often interdependent. Lower-level elements also have dominance over higher-level elements, which means there is a feedback relationship. The system structure currently is like the network structure. Wang [61] considered that the ANP method is a suitable option to solve these kinds of network system structure problems, mainly because the ANP method includes two parts, which are control hierarchy and network level, as shown in Figure 1.
The first part of the system is the control hierarchy, which refers to the hierarchical relationship between criteria and sub-criteria, including problem objectives, decision criteria and sub-criteria. All decision criteria are independent of each other and are governed only by the target element. In addition, there can be no decision criteria in the control factor, but at least one objective is required.
The second part of the system is the network level. It is composed of all clusters or components governed by the control hierarchy, and the groups form a network structure that affects each other.
Saaty et al. [62] reported that the ANP method is often applied to MCDM problems that cannot be represented in a hierarchical structure in contrast to the AHP method. The ANP method is based on the AHP method with a feedback mechanism to solve the multi-criteria dependence problems. Moreover, the greatest advantage of the ANP method is that it can be utilised to assess the external and internal dependencies of the criteria. This means that the ANP method pays more attention to the actual situation of the interaction between dimensions and indicators. Accordingly, compared with the AHP method, the ANP method can more clearly distinguish the pros and cons between dimensions and indicators, thereby providing decision-makers with a better decision-making basis.
In addition, some studies [63,64,65,66,67,68] mentioned that combining fuzzy logic techniques with AHP and ANP methods, called Fuzzy AHP (FAHP) and Fuzzy ANP (FANP), were widely used in recent decades. However, Saaty et al. [69,70] reported that validity was the goal in decision-making; the fuzzy logic technology will not provide its help for the validity improvement of AHP. Meanwhile, the research results of Zhu et al. [71] also proved that FAHP may not bring corresponding mathematical validity to the related research.
Also, Güngör et al. [72] reported that FANP uses several fuzzy arithmetic operations that assign weights to calculate performance scores. It may require multiple comparisons. However, many operations can lead to a loss of information and increase the loss of decision accuracy. In the meantime, a total of 40 expert questionnaires will be sent out for this study, which represents a possible increase in the chance of information loss during fuzzy operations. Accordingly, these methods of FAHP and FANP may not be suitable for our research.
Furthermore, grey rational analysis (GRA) is also a widely used method to solve the MCDM problem, which was proposed by Prof. Deng [73] in 1989. Interestingly, Wu [74] mentioned that the GRA and TOPSIS methods have very similar prioritisation results for specific problems. Meanwhile, Chen et al. [75] reported that the GRA method has the following disadvantages.
- The choice of the resolution factor is more subjective.
- Comparing sequence curves with different spatial positions.
- Factor weights are normalised to affect correlation.
- Taking the average to find the correlation affects the accuracy of the evaluation.
Thus, the GRA method may not be a suitable method for our research.
Some research [76,77,78] mentioned that it is not easy to find a reasonable and reliable method for a given decision-making problem. However, many scholars [79,80,81,82,83,84,85,86] mentioned that the ANP method is very suitable for the weight analysis of the SERVQUAL scale. Among them, some scholars [82,83,84,85,86] reported that the reliability and validity are high by integrating the ANP method and SERVQUAL scale to decision making in recent years. For example, Chen and Lin [85] discussed factors of the key success for new products development with design flexibility by ANP. They recommended five vital factors to the company for the development phase of new products, including commonality design, product platform base, modular design, management support and the strategy of the new product for increasing the competitive advantage of the new product. Huang [86] applied the ANP method to know the purchase purpose of skincare products in consumers. These research findings [79,80,81,82,83,84,85,86] inspired and helped us to develop the research concepts and methods.
In the view of this, this research will be based on the service quality (SERVQUAL) scale to establish a framework for measuring the service quality of online English teaching through expert interviews. Then, the perspective from service providers and consumers will be collected by questionnaires. Finally, the method of ANP will be utilised to calculate weights of dimensions and indicators to achieve the research objectives.
3. Materials and Methods
The ANP method allows inner dependence within the cluster, while the outer dependence between groups is also a feature of the ANP method. Therefore, the ANP method provides a complete framework that includes connections between groups and elements. In addition, the ANP method allows the researchers to study the entire problem program in the way they desire. Accordingly, researchers can find out the degree of interaction between elements and groups from the problem, thereby deriving the priority scale of each solution.
Moreover, many studies [79,80,81,82,83,84,85,86] have also proved that it is feasible to use the ANP method to analyse the weight of dimensions and indicators in the SERVQUAL scale. Therefore, these research methods that combine the ANP method and the SERVQUAL scale can produce research results that can provide decision-makers with appropriate decision-making recommendations.
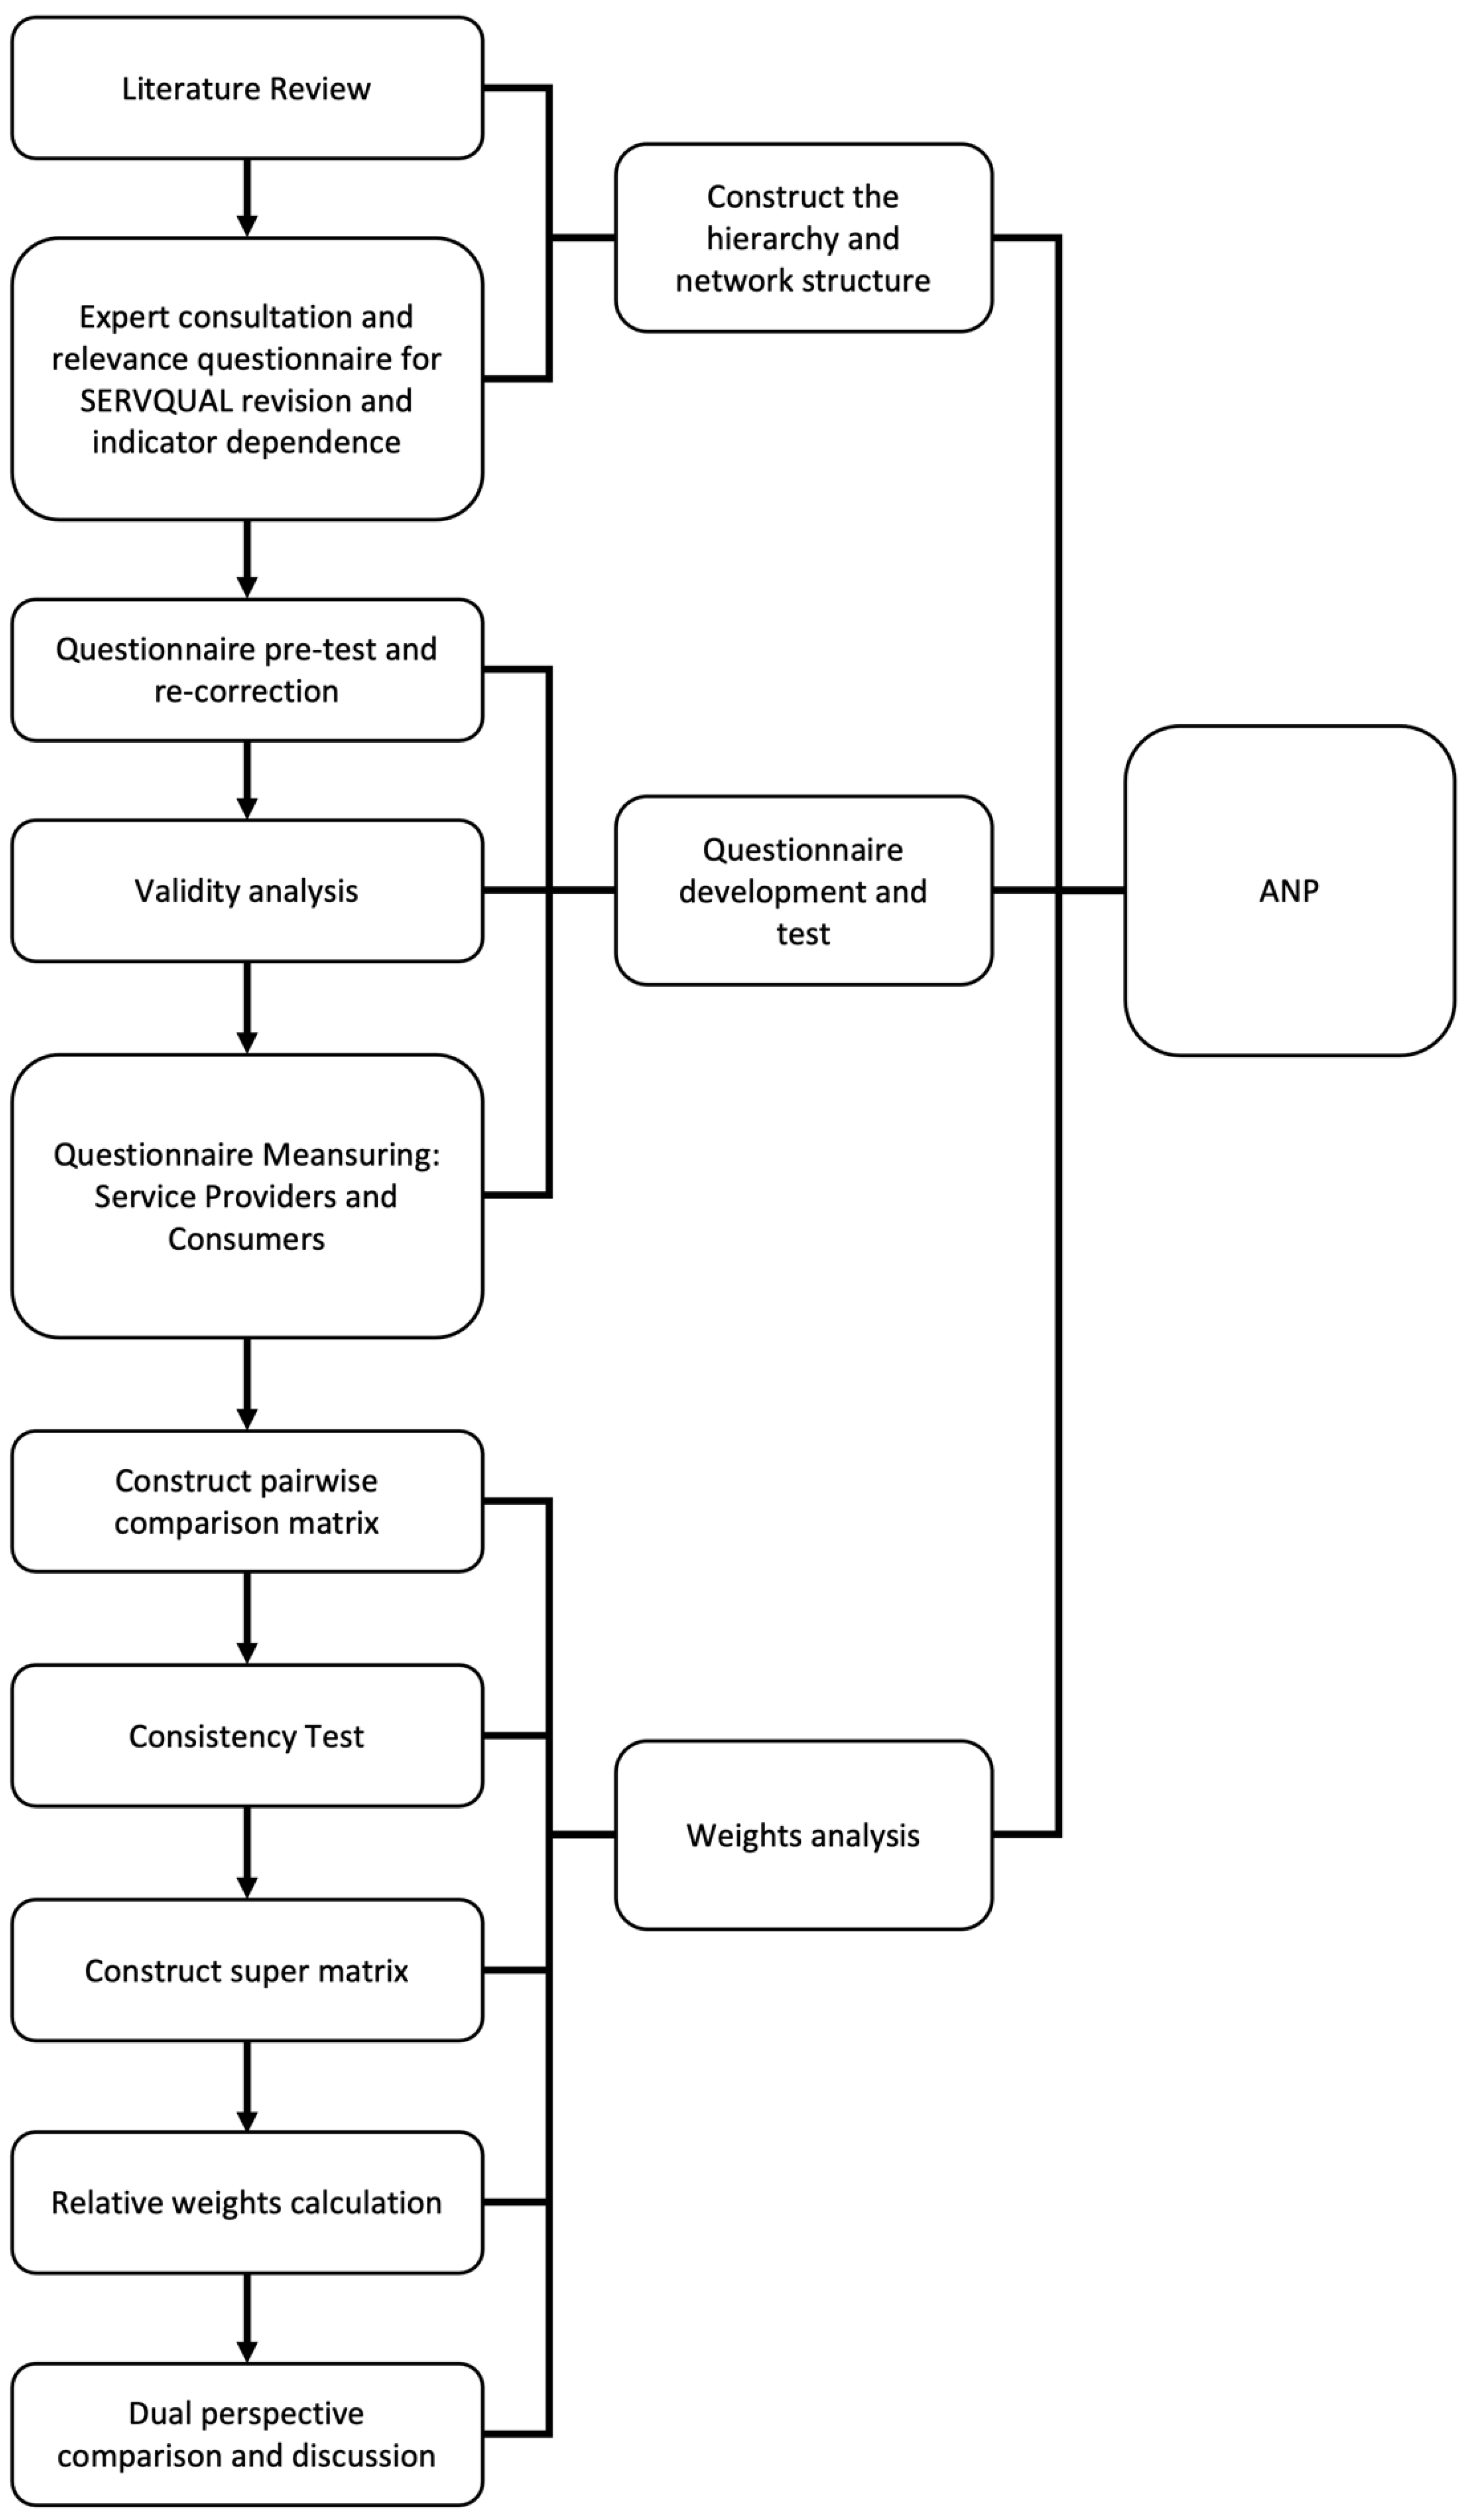
In the view of this, we will integrate the SERVQUAL scale and the ANP method to analyse the weights and the rankings from opinions of service providers and consumers, thereby evaluating the service quality of the online English education industry during the coronavirus pandemic. Meanwhile, this study will compare the differences between the opinion of service providers and consumers, thereby offering online English teaching service providers with appropriate decision-making advice during similar epidemics in the future. Finally, Figure 2 demonstrates the research process of this research.
3.1. Construct the Hierarchy and Network Structure
This research decomposed the problem into several evaluation indicators, according to the research method of ANP. Then, this study grouped indicators to establish a hierarchical structure, thereby finding out the relationship between them. Meanwhile, Tsai et al. [87] suggested that various indicators should be revised by means of expert discussion.
Therefore, this research rewrote the indicators based on the consultative result of expert questionnaires to make the statements of indicators meet the particularity of the online English teaching service during the COVID-19 pandemic. Finally, this research constructed the hierarchical structure according to the relevance questionnaire.
3.2. Development of Questionnaire
After constructing the hierarchy network based on the SERVQUAL scale, this research developed a pairwise comparison questionnaire according to the ANP method. Saaty [56,57,58,59] considered that numerical judgments are extremely meaningful in the interpretation of research results. Therefore, precise divisions are required to represent human perception when problems of similar nature are compared.
In addition, researchers usually use indicators of Root Mean Square (RMS) and Median Absolute Deviation (MAD) to interpret statistical data when statistical theory fails to provide good judgment data for the research content. Moreover, Saaty [56,57,58,59] experimented with 27 different scale values. He discovered that values of Root Mean Square (RMS) and Median Absolute Deviation (MAD) from a nine-point evaluation scale were the smallest, thereby providing better results for consistency testing. Accordingly, ANP utilises a nine-point evaluation scale to measure the importance of indicators [56,57,58,59].
Furthermore, it is necessary to consider the validity of the questionnaire before questionnaire measurement. Therefore, this research rewrote the statements by ten experts and kept the original representation of dimensions and indicators that were based on the SERVQUAL scale for retaining high content validity [88]. Then, this study conducted a pre-test. After that, we rewrote the statements based on the pre-test results to see whether the meaning of the questionnaire was clear.
3.3. Questionnaire Establishment
According to the method of ANP, this study used the expert questionnaire method to assess the importance of dimensions and indicators for online English teaching service quality in the COVID-19 pandemic. As for the number of questionnaires, F. J. Parenté and J. K. Anderson-Parenté [89] suggested that there should be at least ten or more experts. Interestingly, we discovered that some research [90,91,92,93,94,95,96,97,98,99,100] utilised a small sample size to obtain useful decision results. The sample size of these research [90,91,92,93,94,95,96,97,98,99,100] was from four to nine. Meanwhile, Darko et al. [100] reported that a large sample size may not be helpful due to “cold-called” experts could profoundly affect the result of consistency assessment. In the view of this, there were 40 survey subjects in this study, including 10 experts of the online English education industry (service providers) and 30 consumers, to achieve our main research objectives.
3.4. Construct Pairwise Comparison Matrix
The results of each questionnaire may be different after completing the questionnaire. Therefore, it is necessary to obtain a value that represents the answer of groups through the measure of central tendency. In the view of the central tendency measurement methods, the geometric mean is less affected by outliers’ values than the arithmetic mean. Saaty [56,57,58,59] considered that the geometric mean is more appropriate for integrating the research data under some reasonable assumptions. For example, the judgement value of a decision member is and judgment values of other decisions members is . Thus, the average judgement value of these members should be 1.
The geometric mean is only applicable to data with proportional or near-proportional relationships. This research utilises a nine-point evaluation scale to measure the importance of the two indicators, which is suitable for the application scenario of the geometric mean. Therefore, the average level of the characteristics of the group can be calculated using the geometric mean to aggregate the questionnaire answers [56,57,58,59].
3.5. Consistency Test
The main purpose of the consistency test is to detect whether logical errors have been made. If the result of the questionnaire showed that dimension A was more important than dimension B, but dimension B was more important than the dimension C, this means that the subject of the questionnaire believes that the importance of dimension A is the most significant. However, the result of this questionnaire is inconsistent if the questionnaire result demonstrated other dimensions were more important than dimension A. Another case is and . Meanwhile, and Therefore, should be . However, the evaluation scale is 9. It means that the result of the questionnaire in this case is inconsistent. In the view of this, a consistency check calculation must be performed to confirm that decision makers can achieve consistency when making pairwise comparisons. Therefore, the consistency index (C.I.) and the consistency ratio (C.R.) check whether the pairwise comparison matrix formed by the answers given by the decision maker is the main test of the consistency matrix.
As suggested by Saaty [56,57,58,59], when , it refers to the best acceptable error. When , it means that the consistency of the matrix is satisfactory. The consistency index generated by the positive reciprocal matrix at different orders is called a random index (). Table 2 shows values of random index.
3.6. Construct Super Matrix
The numerical arrangement of the super matrix is arranged according to the relationship between targets, groups and elements. In the super matrix, values in the first column and row are targets. Meanwhile, values in the second and third columns and rows represent groups and criteria, respectively.
, , and in the super matrix represent the vector of the feature, the vector of the criterion, the dependency of dimensions and the dependency of criteria. The vector of the feature is the weight that was obtained by comparing the dimensions with each other. The vector of the criterion is the weight that was obtained by comparing the criteria with each other.
In order to find the weight of indicators in the super matrix (), was first multiplied by to obtain the dimension weight matrix considering the degree of interdependence (). In the meantime, was multiplied by to obtain the indicator evaluation weight matrix considering the degree of interdependence (). Finally, the indicator weight under the entire super matrix architecture () was obtained by multiplying and .
3.7. Relative Weights Calculation
The convergence value presented by the limiting super matrix through the above steps is the priority weight value corresponding to each criterion.
3.8. Dual Perspective Comparison and Discussion
After filling and analysing the questionnaires of service providers and consumers with the ANP research method, the weights and rankings of various aspects and indicators of the quality of online English teaching services from a dual perspective are obtained. This study compares the findings of different viewpoints and further explores the differences.
4. Results
4.1. Construct Hierarchy and Network Structure
This research invited online English teaching experts to revise the dimensions and indicators. A total of 10 experts were invited for this study. Among them, four are senior business managers in online English teaching-related industries and six are senior online English teachers. Then, we issued 10 expert consultation questionnaires for modifying the statements of indicators of the SERVQUAL scale, and 10 valid questionnaires were collected. After that, this research developed the questionnaire of online English teaching service quality by rewriting the statement of indicators according to the responses of experts.
Although the questionnaire of online English teaching service quality has been established, this research still conducted a pre-test to understand the semantic clarity and the time requirement for answering the online English teaching service quality questionnaire.
The pre-test applied 30 questionnaires, and 28 questionnaires were collected. According to the results of the questionnaire survey, 10 experts revised the statements of indicators and rewrote the related questionnaire again. Moreover, these experts added an auxiliary description to the semantics of the questionnaires. Finally, the five dimensions and the 21 indicators after the pre-test were chosen, and an online English teaching service quality evaluation structure based on the SERVQUAL scale was established, as shown in Table 3.
In the meantime, each expert’s opinions on the dependencies of various indicators were aggregated through a correlation questionnaire in this research. The number of experts who agreed with the dependencies of each indicator was filled in the table of indicator dependency relationship score, as shown in Table 4.
The indicators with higher numbers in Table 4 represent more experts agreeing with their dependencies. Although this study can ensure indicator dependencies by selecting more expert-approved associations, it may ignore undetected indicator associations that interact with each other. This research can also use the relevant indicators that are less recognised by experts, but this will result in more indicator dependencies and thus increase the number of questions in the pairwise comparison questionnaire. For example, it would exceed 50 items in questionnaires if it has more than six experts in Table 4 to agree on the dependencies. It means that the number of questions in the questionnaire will greatly increase.
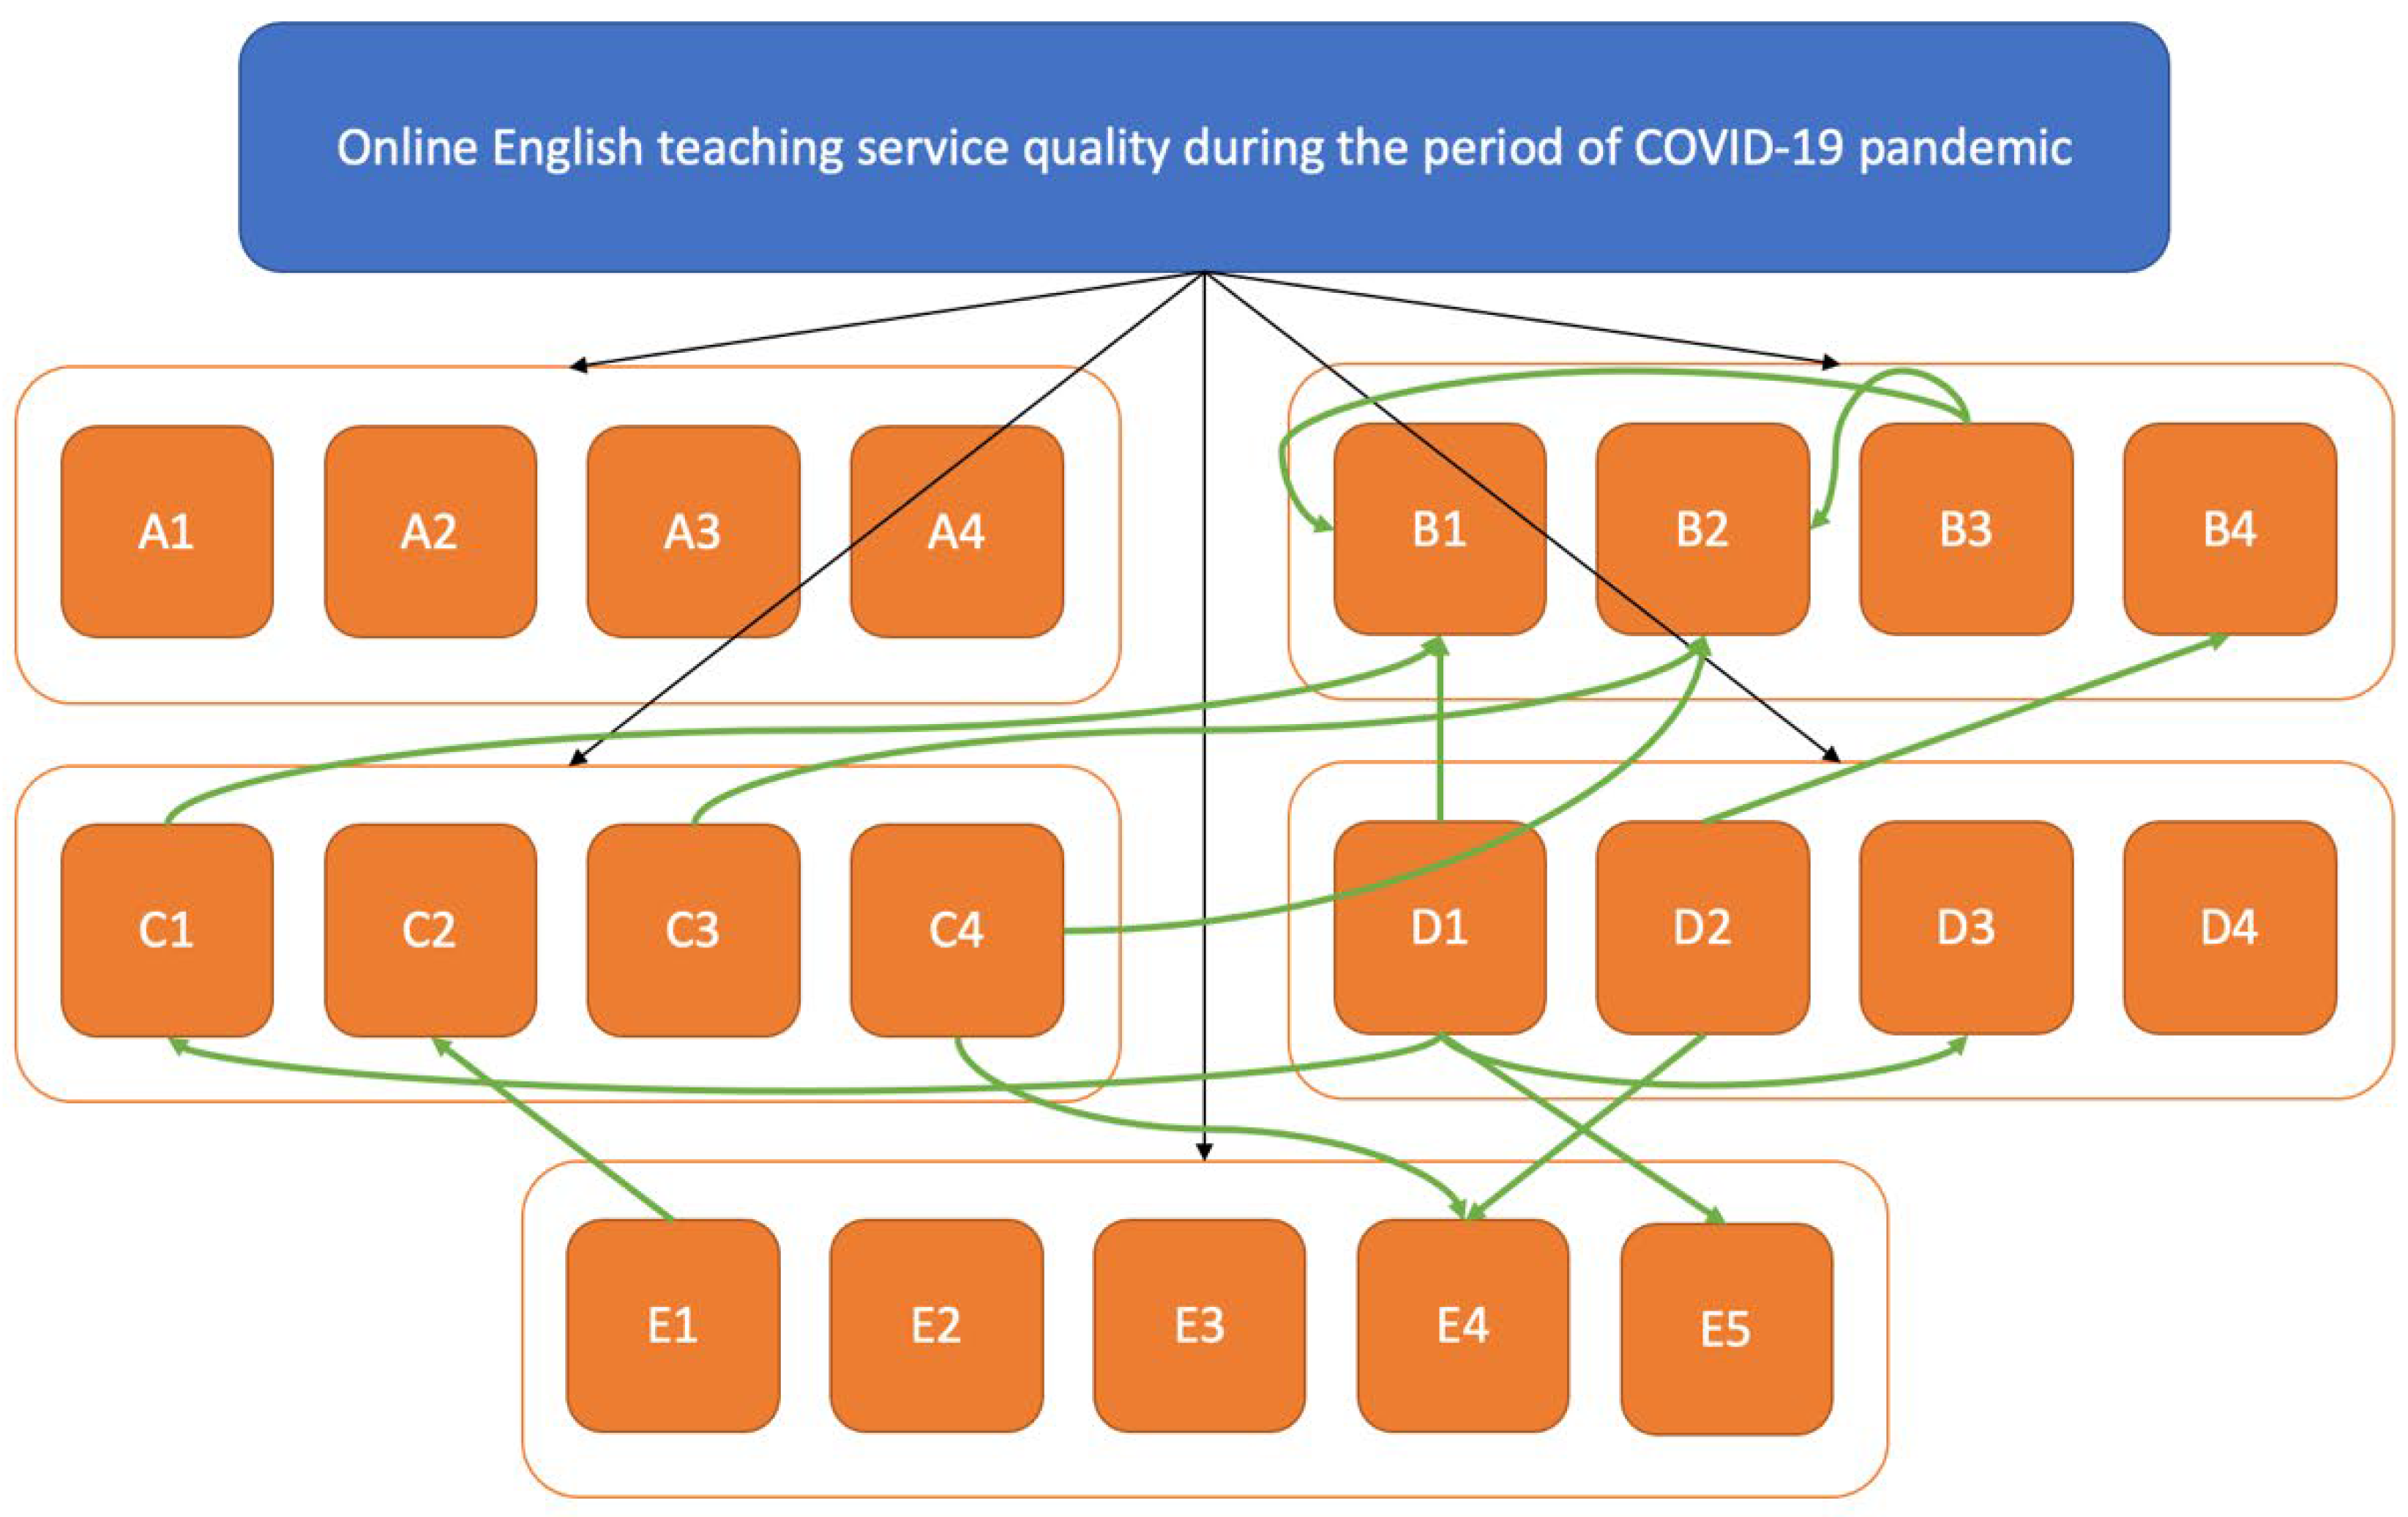
Thus, this study adopts the dependence of the approval of more than nine out of 10 experts in order to prevent too many questions being added to the questionnaire, and the network relationship of the indicators can be retained. Finally, this research summarises opinions of these experts into the service quality evaluation structure of online English teaching. The summarised indicators dependency chart is shown in Figure 3
4.2. Questionnaire and Analysis
This research utilises the research method of ANP to construct the structure according to the indicator dependency by Super Decisions software that was developed by the team of Professor Saaty [56,57,58,59]. Meanwhile, this study compared the importance of the two indicators and tested the consistency by using the expert questionnaire according to the ANP research method for extracting the common opinions of experts.
This research issued a total of 40 pairwise comparison questionnaires from 10 July 2021 to 23 August 2021. Meanwhile, the respondents to the questionnaire were divided into two groups: the service provider and the consumer group. Among them, the consumer group consisted of 30 consumers, and the service provider group consisted of 10 experts with rich online English teaching experience.
This study explained to the respondents one by one and emphasised the purpose and significance of this study due to the implementation of the expert questionnaire method. In the end, a total of 40 questionnaires were obtained with a recovery rate of 100%.
Then, this research calculated a geometric mean of each pairwise comparison question using the Excel software. After that, this study inputted the calculated geometric mean of each pairwise comparison question into the software of Super Decisions to examinate the consistency index (C.I.) and random index (R.I.) as shown in Table 5.
Finally, the consistency (C.I.) and random index (R.I.) are both less than 0.1, which means the result of the consistency tests is acceptable.
After passing the consistency test, the super matrixes are calculated by the method of ANP. The value of each column of the limit super matrix is the weight of each index. The super matrix of comprehensive service providers’ opinions is shown in Table 6, and the super matrix of comprehensive consumers’ opinions is shown in Table 7.
4.3. Research Results
As for the dimensions of online English teaching service quality, it was ordered by weight and analysed the comprehensive opinions of service providers regarding responsiveness (0.300), assurance (0.270), empathy (0.264), reliability (0.130) and tangibility (0.036).
Meanwhile, the dimension ordered by weight analysed from the comprehensive opinions of consumers factors related to assurance (0.378), responsiveness (0.288), reliability (0.185), empathy (0.113) and tangibility (0.036).
Table 8 revealed the weight and order of dimensions from the perspective of service providers and consumers.
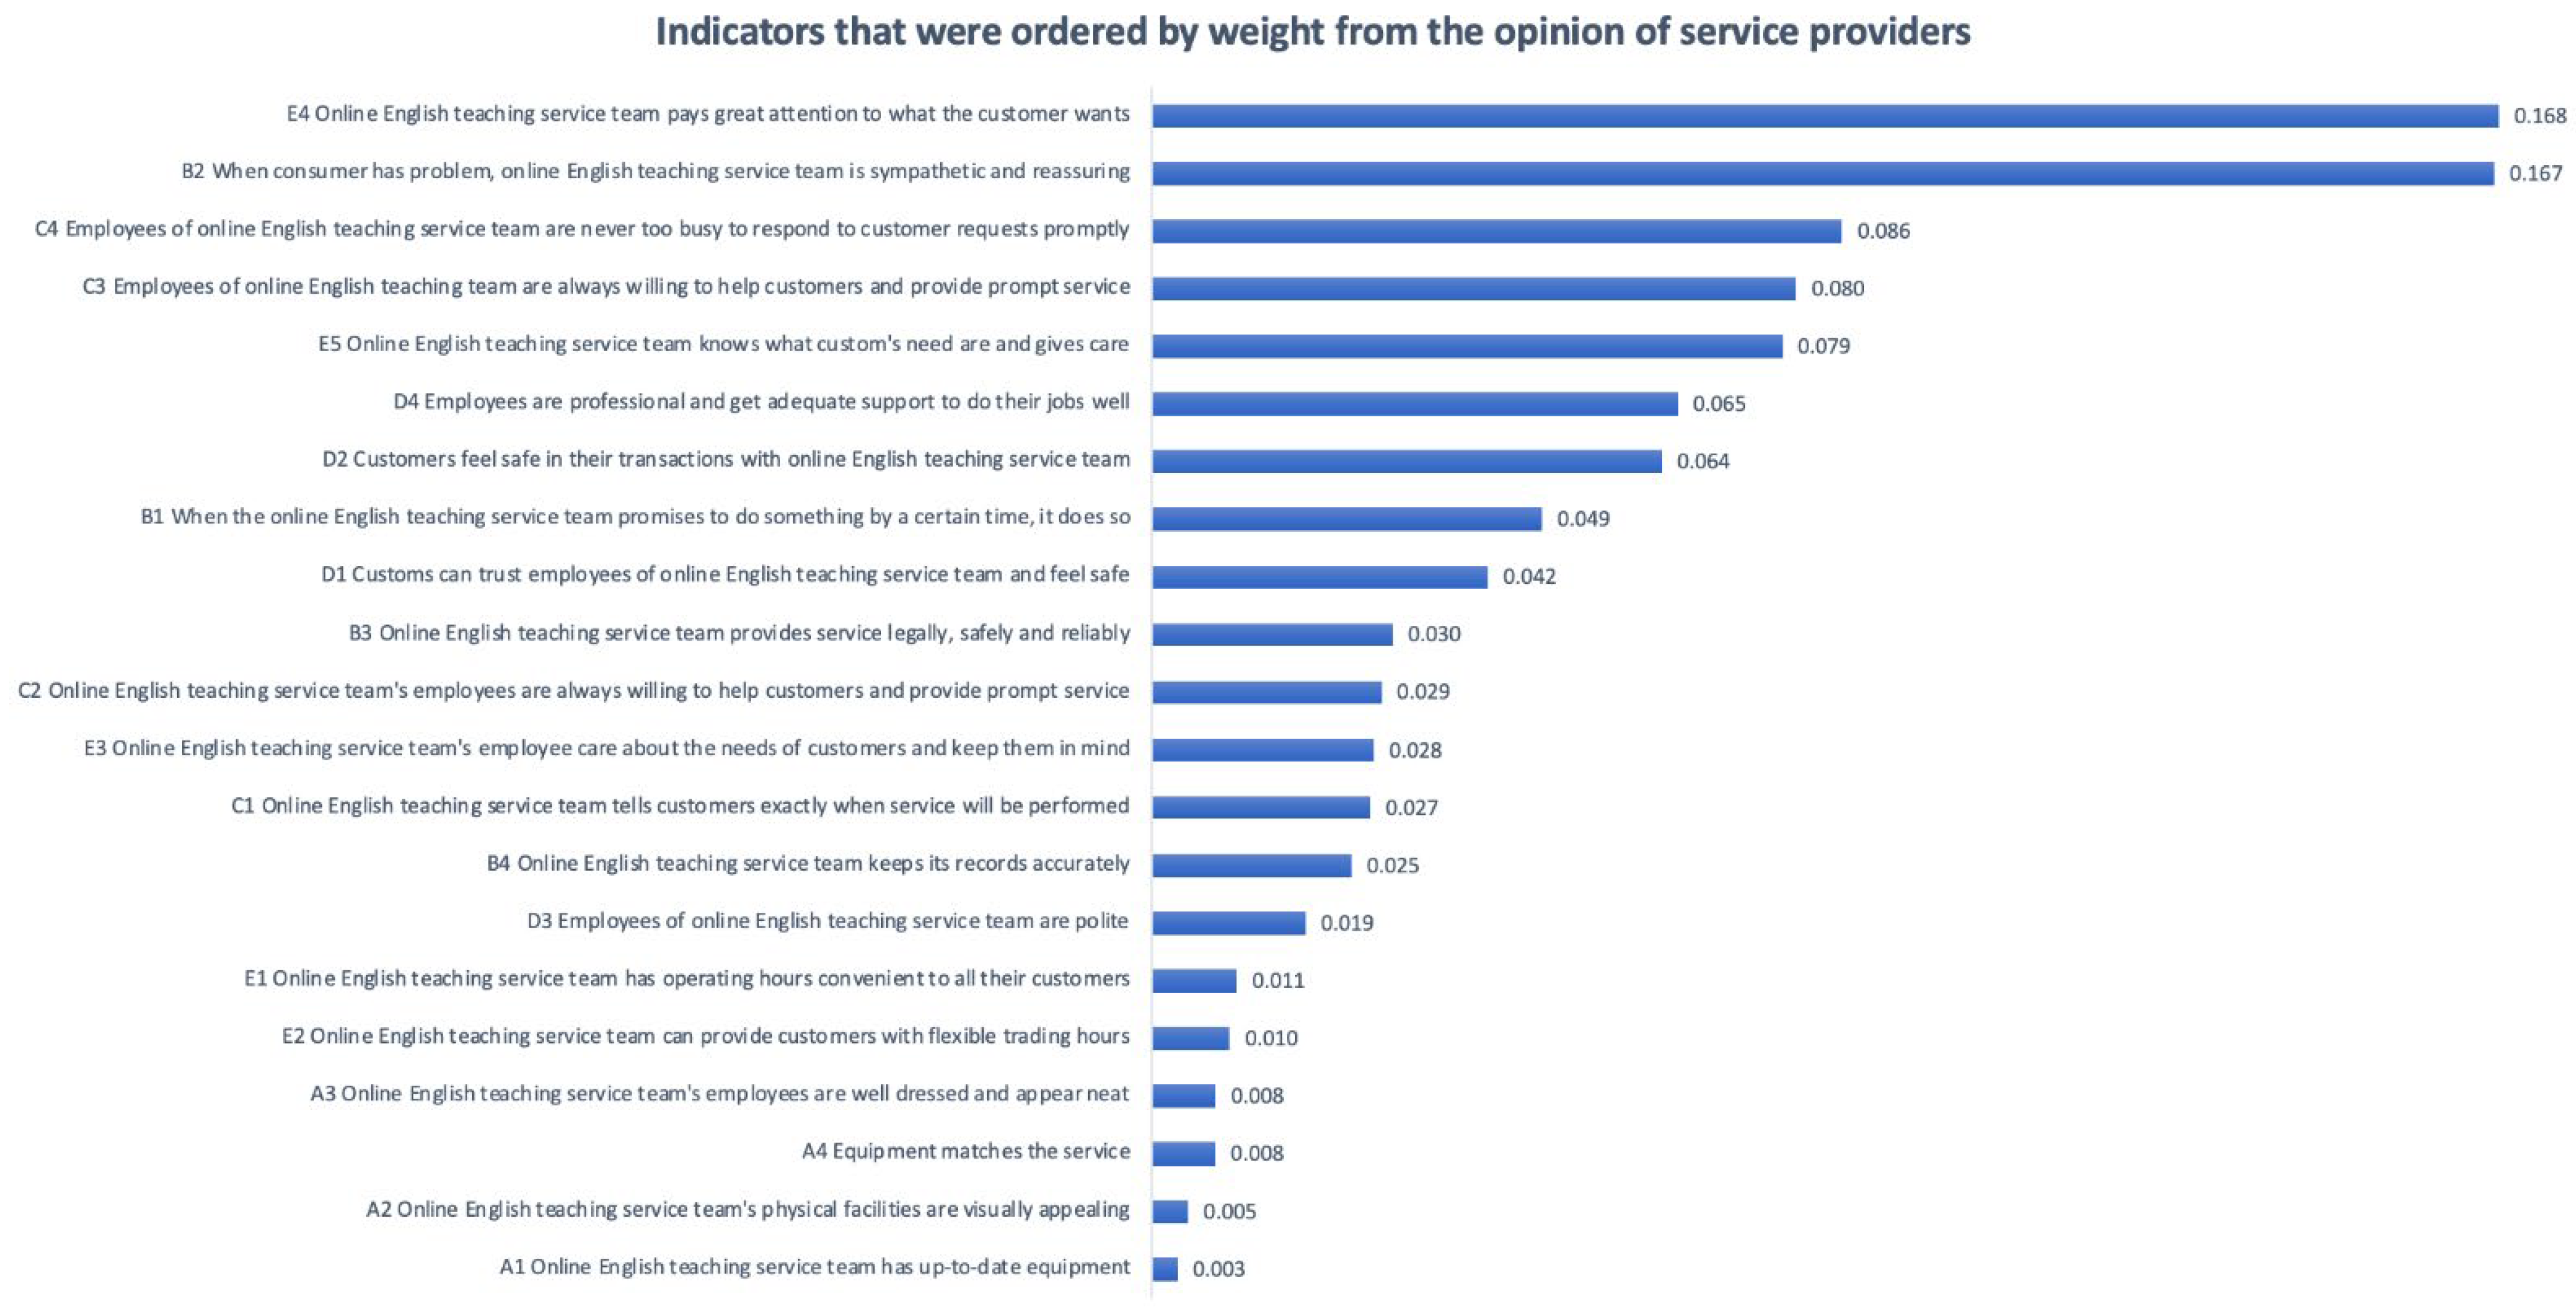
Meanwhile, the weight and order of indicators from the dual perspective of service providers and consumers are shown in Figure 4 and Figure 5.
As shown in Figure 4, the top two weights of indicators under the influence of interdependence among the indicators from comprehensive opinions of service providers are “The online English teaching service team pays great attention to what the customer wants” (0.168) and “When a consumer has a problem, the online English teaching service team is sympathetic and reassuring” (0.167).
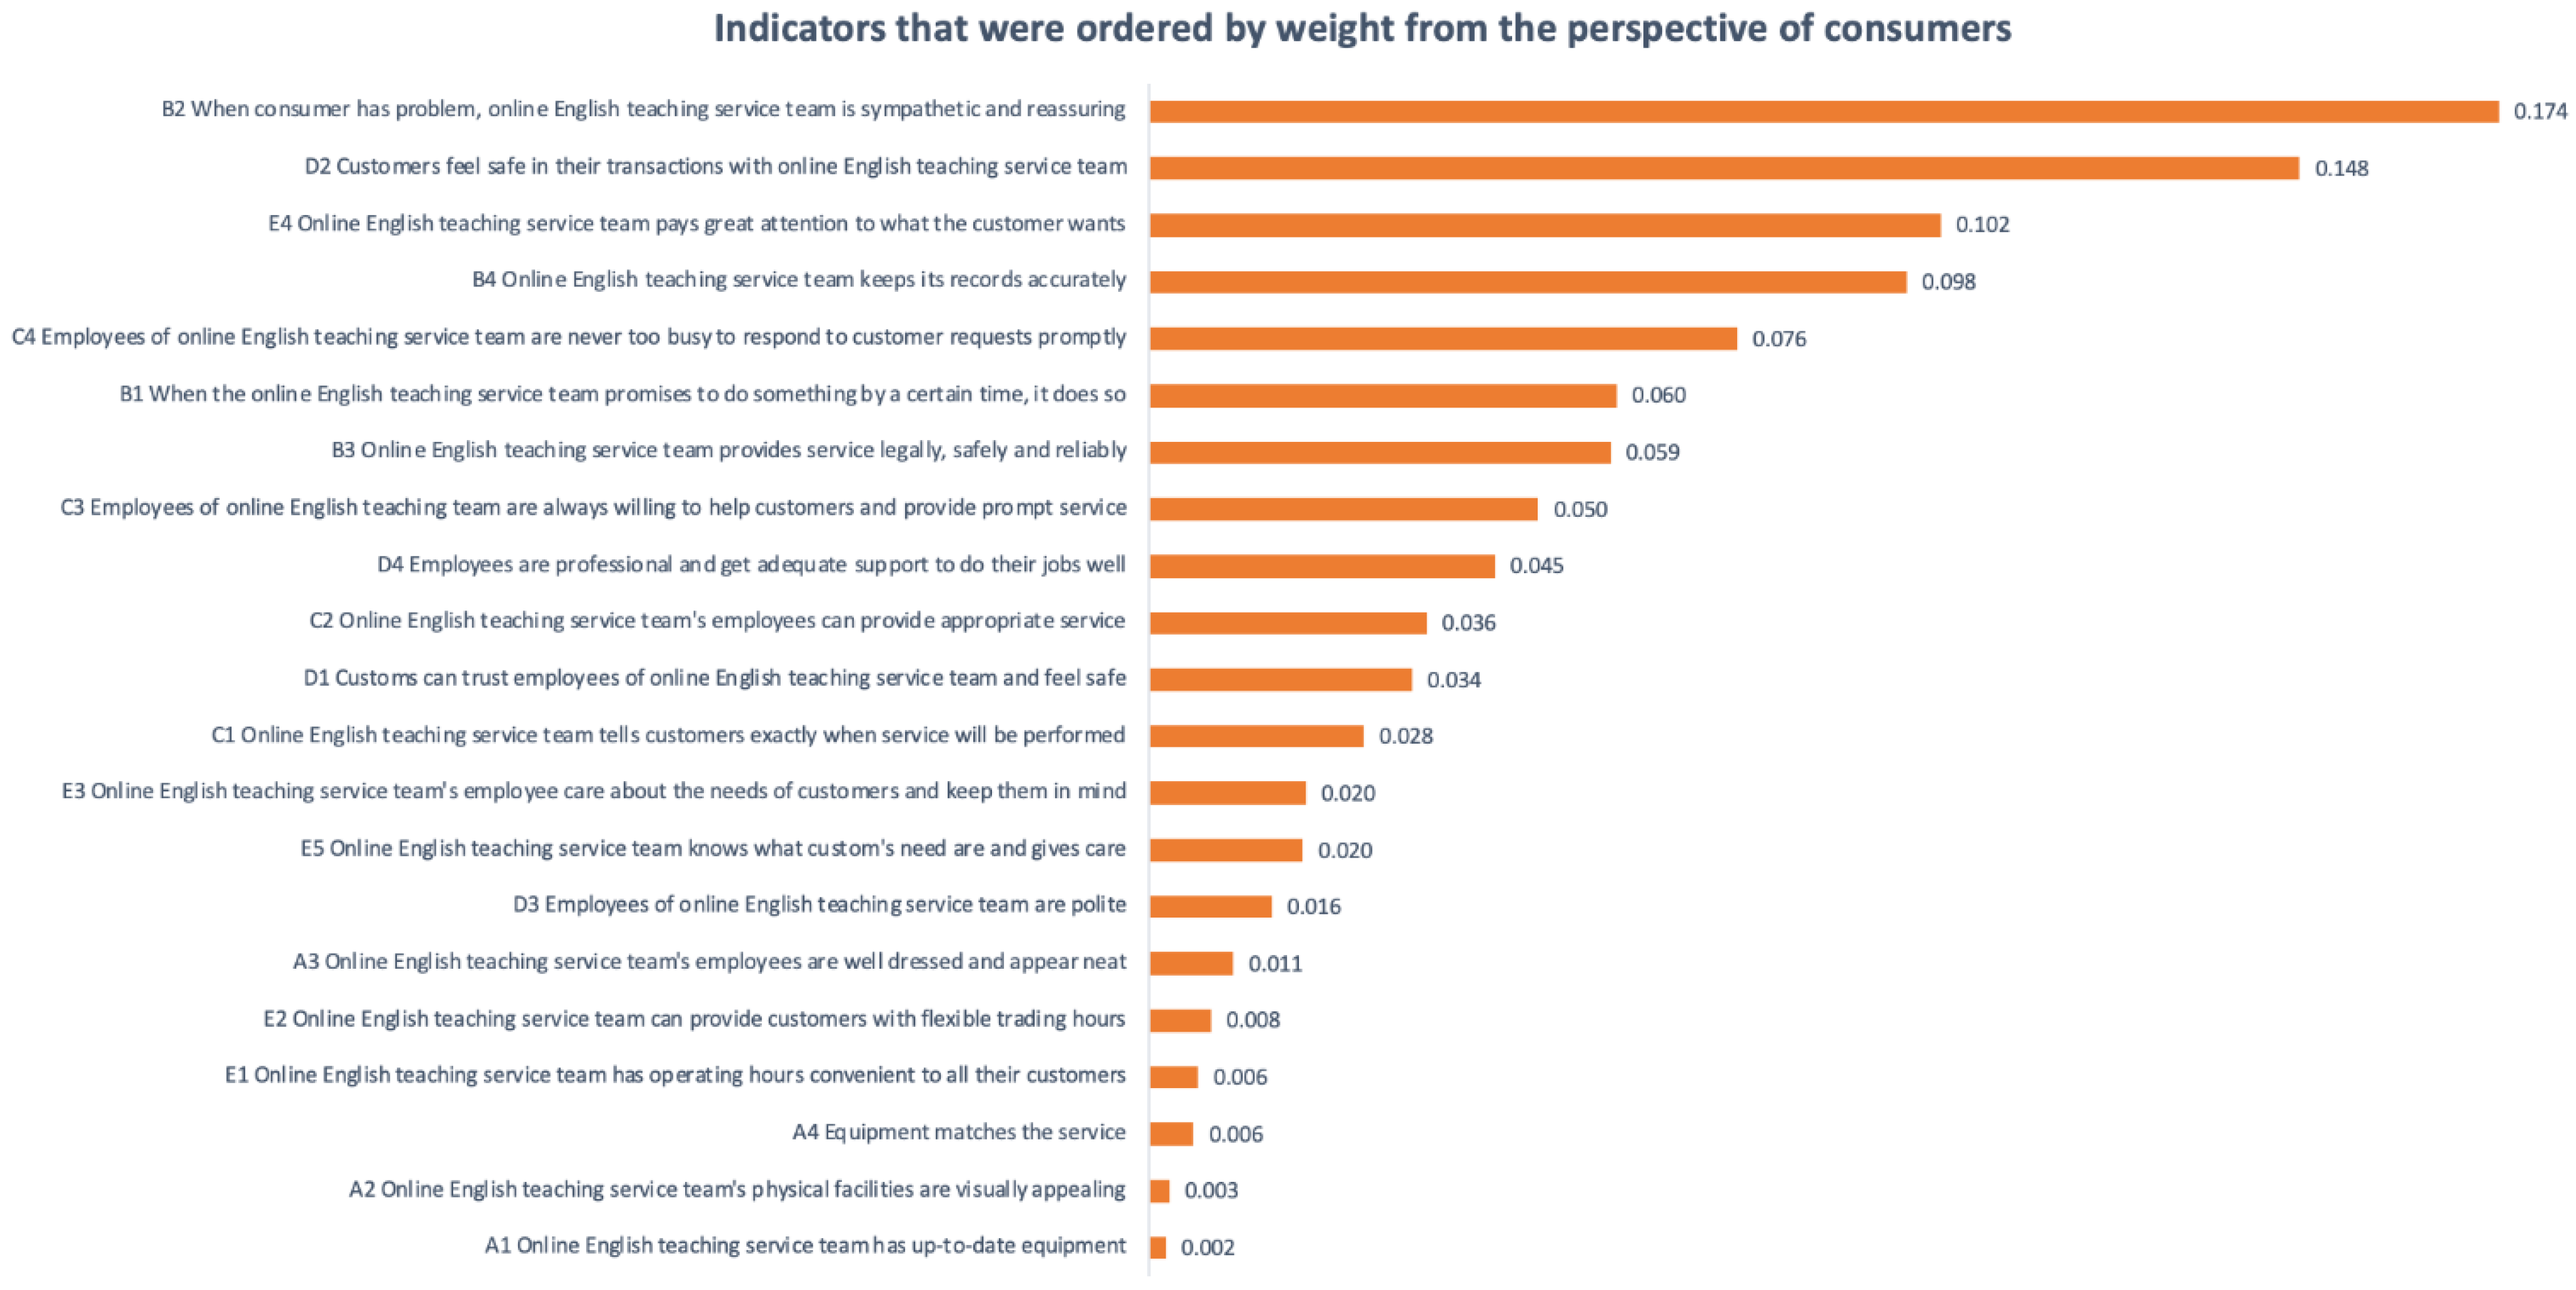
Nonetheless, as shown in Figure 5, the top two weights of indicators from the view of consumers are “When a consumer has a problem, the online English teaching service team is sympathetic and reassuring” (0.174) and “Customers feel safe in their transactions with the online English teaching service team” (0.148).
The third important indicator that was ordered by weight from the perspective of service providers is “Employees of the online English teaching service team are never too busy to respond to customer requests promptly” (0.086).
In contrast, the third important indicator that was ordered by weight from the opinion of consumers is “The online English teaching service team pays great attention to what the customer wants” (0.102).
The fourth and fifth important indicators that were ordered by weight from the aspect of service providers are “Employees of the online English teaching team are always willing to help customers and provide prompt service” (0.080) and “The online English teaching service team knows what the customer’s needs are and gives care” (0.079).
On the other hand, the sixth and seventh important indicators that were ordered by weight from consumers’ comprehensive opinions are “The online English teaching service team keeps its records accurately” (0.098) and “Employees of the online English teaching service team are never too busy to respond to customer requests promptly” (0.076).
5. Discussion, Suggestions and Research Limitations
5.1. Discussion and Suggestions
This research analysed the weight of dimensions and indicators for the service quality of online English teaching by discussing the dual perspective of service providers and consumers during the COVID-19 pandemic. As for the weight of the dimension, the most vital dimension of comprehensive service providers’ opinions is responsiveness. It means that the ability of customer service willingness, efficient service and problem solving is the highest priority for the service quality of the online English teaching industry.
In contrast to the opinion of service providers, consumers considered that assurance is the most significant dimension during the COVID-19 outbreak. This means that consumers pay more attention to the requirements of service performing, which are the abilities of professional knowledge, trust and courtesy. Therefore, this research suggests that service providers should make good preparations for the assurance of online English teaching service quality in the COVID-19 pandemic. For example, they can encourage employees to cultivate and enrich professional knowledge by holding regular training events. In the meantime, service providers should often remind their employees that they must be polite to consumers, thereby increasing the trust of consumers in employees during the COVID-19 outbreak.
The second important dimension of opinions from service providers is assurance. It reveals that service providers attached importance to the ability of professional knowledge, trust and courtesy. On the other hand, responsiveness is the second important dimension from the view of consumers. Interestingly, responsiveness is the first rank of the five dimensions from the opinions of service providers.
From the perspective of service providers and consumers, the least important dimension that was ordered by weight is tangibility. It means that the physical facilities and equipment of the online English teaching industry were valued the least by service providers and consumers during the COVID-19 pandemic.
As for the weight of the indicators under the influence of interdependence among the indicators, this study found that the indicator with the top weight from the comprehensive opinions of service providers is “The online English teaching service team pays great attention to what the customer wants”. However, the most vital indicator that was ordered by weight from the consumers’ opinions is “When a customer has a problem, the online English teaching service team is sympathetic and reassuring”. It means that the demonstration of empathy and reassurance by the English online teaching team was more valued by consumers when they faced issues during the coronavirus pandemic.
In addition, the second important indicator that was ordered by weight from the perspective of service providers is “When a consumer has a problem, the online English teaching service team is sympathetic and reassuring”. However, the second significant indicator that was ordered by weight from the comprehensive opinions of consumers is “Customers feel safe in their transactions with the online English teaching service team”. This means that consumers paid more attention to the safety of transaction procedures during the coronavirus epidemic.
Accordingly, this study suggests that online English teaching teams should be empathetic when customers have problems. In addition, the online English teaching team should pay attention to the establishment of a reliable transaction mechanism, thereby ensuring transaction security during the COVID-19 pandemic.
From the perspective of service providers, the third to fifth important indicators that were ordered by weight are “Employees of the online English teaching service team are never too busy to respond to customer requests promptly”, “Employees of the online English teaching team are always willing to help customers and provide prompt service” and “The online English teaching service team knows what a customer’s needs are and gives care”. This means that service providers paid more attention to the timeliness of responding to customer needs and willingness of customer assistance than to the individual needs of customers during the COVID-19 outbreak.
However, the third to fifth important indicators that were ordered by weight from the view of consumers are “The online English teaching service team pays great attention to what the customer wants”, “The online English teaching service team keeps its records accurately” and “Employees of the online English teaching service team are never too busy to respond to customer requests promptly”. Accordingly, consumers considered caring about customer needs and properly recording relevant information more important than responding to customer requests immediately during the coronavirus pandemic.
Matzler and Sauerwein [101] proposed factor structures of customer satisfaction in 2002, which are basic factor, performance factor and excitement factor. Meanwhile, they considered that the basic needs of customers must be recognised and met. In this study, it was recognised that the assurance is the top dimension by analysing the feedback of consumers’ questionnaires. In the meantime, indicators ordered by weight in the dimension of assurance are “Customers feel safe in their transactions with the online English teaching service team”, “Employees are professional and receive adequate support to do their jobs well” and “Customers can trust employees of the online English teaching service team and feel safe”. It means that the basic need of consumers includes the safety of the transaction environment, professional knowledge and trust.
This research also found that the top dimension from opinions of service providers is responsiveness, but it is the second most important dimension from the perspective of consumers. In view of this, the dimensions and indicators that service providers of online English teaching value most are different from the basic factors of customer satisfaction.
Moreover, Kim et al. [102] proposed a research work in 2018. They reported that dimensions of reliability, responsiveness, assurance and empathy have shown significant association with learners’ satisfaction; however, tangibility has not shown a significant association with learners’ satisfaction. In the meantime, Uppal et al. [103] reported that assurance and responsiveness have a positive correlation with the perception of e-learning quality.
In the view of this, dimensions of assurance and responsiveness have shown a positive correlation and significant association with the perception of e-learning quality and learners’ satisfaction prior to the coronavirus pandemic.
The results of the above research are very similar to the findings presented in this study. The dimension of assurance is the top weight from the view of consumers, and responsiveness is the most significant dimension that was ordered by weight from the perspective of service providers. Meanwhile, tangibility is the least important dimension that was ordered by weight from the perspective of service providers and consumers.
Interestingly, Sumi et al. [104] proposed that dimensions of the SERVQUAL model, reliability, assurance and empathy, have a significant impact on user satisfaction during the COVID-19 pandemic.
Accordingly, the dimensions used to evaluate the service quality of online education are similar whether in the COVID-19 epidemic or prior to the COVID-19 pandemic. Thus, the difference between service providers and consumers should be considered as a main point for service quality improvement. The focus of online English teaching service should also be aimed at the primary needs of consumers, which is the dimension of assurance, with the main purpose of establishing a secure transaction mechanism, cultivating professional knowledge and improving customer trust during the COVID-19 pandemic.
5.2. Research Limitations
As for research limitations, usually, the research conducted by ANP gathers data only from experts. This research, additionally, collected and analysed data from consumers to compare the difference of viewpoints. In order to gather the consumers’ data during the COVID-19 pandemic, 30 questionnaires for consumers were issued. For future research, a bigger sample of consumers will be recommended. Although the questionnaire is based on the SERVQUAL scale and revised by 10 experts, it is suggested that confirmatory factor analysis be carried out to test the quality indicators.
6. Conclusions
Online English education has become a very common way of educating and learning during the COVID-19 pandemic. Therefore, it is vital to understand the difference between the perspectives of service providers and the needs of consumers in order to provide effective advice for the industry of online English education.
In the view of this, this research discusses the significant differences in the dual perspective of comprehensive opinions between service providers and consumers to analyse the weight of dimensions and indicators via implementing the method of ANP based on the expert questionnaire of the SERVQUAL scale.
The research findings revealed that regarding the dimensions ordered by weight from the view of service providers during the coronavirus pandemic, the most significant dimension is responsiveness, followed by assurance and empathy. As for the view of consumers during the COVID-19 outbreak, the most important dimension that was ordered by weight is assurance, which is followed by responsiveness and reliability.
In addition, this research found that the top 5 most important indicators of service providers’ perspective are “The online English teaching service team pays great attention to what the customer wants”, “When a consumer has a problem, the online English teaching service team is sympathetic and reassuring”, “The online English teaching service team’s employees are never too busy to respond to customer requests promptly”, “Employees of the online English teaching team are always willing to help customers and provide prompt service” and “The online English teaching service team knows what a customer’s needs are and gives care”.
In contrast, the top 5 most important indicators of consumers’ opinions are “When a customer has problem, the online English teaching service team is sympathetic and reassuring”, “Customers feel safe in their transactions with the online English teaching service team”, “The online English teaching service team pays great attention to what the customer wants”, “The online English teaching service team keeps its records accurately” and “The online English teaching service team’s employees are never too busy to respond to customer requests promptly”.
Apparently, assurance is the most vital dimension from the view of consumers during the COVID-19 pandemic. Meanwhile, in contrast to service providers’ opinions, consumers placed more value on empathy, a safe transaction environment, attention to customer needs, accurate records of relevant information and immediate responses to customer requests.
Some research [102,103,104] revealed that dimensions in the SERVQUAL model have shown an association and correlation with online learning quality and learners’ satisfaction whether before the COVID-19 pandemic or in the coronavirus pandemic. Therefore, this research can offer a certain reference value for evaluating the service quality of online English teaching using dimensions and index weights in the SERVQUAL scale during the COVID-19 pandemic.
Meanwhile, the structure of indicator dependency and feedback that was constructed by this research can be the reference to related future studies via analysing weights of service quality dimensions and indicators from the view of service providers and consumers during the COVID-19 outbreak. In addition, the finding of this research can also be the reference to calculate the score of the SERVQUAL scale and demonstrate the important indicators of online English teaching service quality during the coronavirus pandemic.
Finally, this research revealed the weights of dimensions and indicators from comprehensive opinions of service providers and consumers, thereby providing recommendations to assist service providers with maintaining good service quality of online English teaching during the COVID-19 pandemic.
Author Contributions
Conceptualisation, investigation, Y.-Y.M.; formal analysis, writing and editing, C.-L.L.; methodology, J.-J.C.; validation, Y.-Y.M. and J.-J.C.; writing—original draft preparation, J.-J.C.; writing—review and editing, Y.-Y.M. All authors have read and agreed to the published version of the manuscript.
Funding
This research received no external funding.
Institutional Review Board Statement
Not applicable.
Informed Consent Statement
Not applicable.
Data Availability Statement
Not applicable.
Conflicts of Interest
The authors declare no conflict of interest.
References
- Policy Brief: Education during COVID- 19 and Beyond. Available online: https://www.un.org/development/desa/dspd/wpcontent/uploads/sites/22/2020/08/sg_policy_brief_covid-19_and_education_august_2020.pdf (accessed on 20 August 2020).
- Dhawan, S. Online Learning: A Panacea in the Time of COVID-19 Crisis. J. Educ. Technol. Syst. 2020, 49, 5–22. [Google Scholar] [CrossRef]
- Agarwal, S.; Kaushik, J. Student’s Perception of Online Learning during COVID Pandemic. Indian J. Pediatrics 2020, 87, 554. [Google Scholar] [CrossRef] [PubMed]
- Bączek, M.; Zagańczyk-Bączek, M.; Szpringer, M.; Jaroszyński, A.; Wożakowska-Kapłon, B. Students’ perception of online learning during the COVID-19 pandemic. Medicine 2021, 100, e24821. [Google Scholar] [CrossRef] [PubMed]
- Syauqi, K.; Munadi, S.; Triyono, M. Students’ Perceptions toward Vocational Education on Online Learning during the COVID-19 Pandemic. Int. J. Eval. Res. Educ. 2020, 9, 881–886. [Google Scholar] [CrossRef]
- Muthuprasad, T.; Aiswarya, S.; Aditya, K.S.; Jha, G.K. Students’ perception and preference for online education in India during COVID-19 pandemic. Soc. Sci. Humanit. Open 2021, 3, 100101. [Google Scholar] [CrossRef]
- Hazaymeh, W.A. EFL students’ perceptions of online distance learning for enhancing English language learning during COVID-19 Pandemic. Int. J. Instr. 2021, 14, 501–518. [Google Scholar] [CrossRef]
- Ibrahim, M.K.; Spitsyna, N.; Isaeva, A. Learning Foreign Languages in a Digital Environment: Learners’ Perception of the Sudden Transition to e-Learning During COVID-19 Lockdown. Electron. J. e-Learn. 2021, 19, 548–558. [Google Scholar] [CrossRef]
- Laili, R.N.; Nashir, M. Higher Education Students’ Perception on Online Learning during Covid-19 Pandemic. Edukatif J. Ilmu Pendidik. 2021, 3, 689–697. [Google Scholar] [CrossRef]
- Nur Agung, A.; Surtikanti, M.; Quinones, C.A. Students’ Perception of Online Learning during COVID-19 Pandemic: A Case Study on the English Students of STKIP Pamane Talino. Soshum J. Sos. Dan Hum. 2020, 10, 225–235. [Google Scholar]
- Rifiyanti, H. Learners’ Perceptions of Online English Learning during COVID-19 Pandemic. Scope J. Engl. Lang. Teach. 2020, 5, 3432. [Google Scholar] [CrossRef]
- Almusharraf, N.; Khahro, S. Students Satisfaction with Online Learning Experiences during the COVID-19 Pandemic. Int. J. Emerg. Technol. Learn. 2020, 15, 246–267. [Google Scholar] [CrossRef]
- Mahyoob, M. Challenges of e-Learning during the COVID-19 Pandemic Experienced by EFL Learners. Arab. World Engl. J. 2020, 11, 351–362. [Google Scholar] [CrossRef]
- Abbasi, S.; Ayoob, T.; Malik, A.; Memon, S.I. Perceptions of students regarding E-learning during Covid-19 at a private medical college. Pak. J. Med. Sci. 2020, 36, S57. [Google Scholar] [CrossRef] [PubMed]
- Adnan, M.; Anwar, K. Research Article Online learning amid the COVID-19 pandemic: Students’ perspectives. J. Pedagog. Sociol. Psychol. 2020, 2, 45–51. [Google Scholar] [CrossRef]
- Budur, T. The Role of Online Teaching Tools on the Perception of the Students during the Lockdown of Covid-19. Int. J. Soc. Sci. Educ. Stud. 2020, 7, 178–190. [Google Scholar]
- Famularsih, S. Students’ Experiences in Using Online Learning Applications Due to COVID-19 in English Classroom. Stud. Learn. Teach. 2020, 1, 112–121. [Google Scholar] [CrossRef]
- Jin, Y.Q.; Lin, C.L.; Zhao, Q.; Yu, S.W.; Su, Y.S. A Study on Traditional Teaching Method Transferring to E-Learning Under the Covid-19 Pandemic: From Chinese Students’ Perspectives. Front. Psychol. 2021, 12, 632787. [Google Scholar] [CrossRef]
- Lin, C.L.; Jin, Y.Q.; Zhao, Q.; Yu, S.W.; Su, Y.S. Factors Influence Students’ Switching Behavior to Online Learning under COVID-19 Pandemic: A Push–Pull–Mooring Model Perspective. Asia-Pac. Educ. Res. 2021, 30, 229–245. [Google Scholar] [CrossRef]
- Bao, W. COVID-19 and online teaching in higher education: A case study of Peking University. Hum. Behav. Emerg. Technol. 2020, 2, 113–115. [Google Scholar] [CrossRef] [Green Version]
- Mahmood, S. Instructional Strategies for Online Teaching in COVID-19 Pandemic. Hum. Behav. Emerg. Technol. 2021, 3, 199–203. [Google Scholar] [CrossRef]
- König, J.; Jäger-Biela, D.; Glutsch, N. Adapting to online teaching during COVID-19 school closure: Teacher education and teacher competence effects among early career teachers in Germany. Eur. J. Teach. Educ. 2020, 43, 608–622. [Google Scholar] [CrossRef]
- Zou, B.; Huang, L.; Ma, W.; Qiu, Y. Evaluation of the effectiveness of EFL online teaching during the COVID-19 pandemic. SAGE Open 2021, 11, 1–17. [Google Scholar] [CrossRef]
- Mou, T.Y.; Kao, C.P. Online academic learning beliefs and strategies: A comparison of preservice and in-service early childhood teachers. Online Inf. Rev. 2021, 45, 65–83. [Google Scholar] [CrossRef]
- Tsegay, S.M.; Ashraf, M.A.; Perveen, S.; Zegergish, M.Z. Online Teaching during COVID-19 Pandemic: Teachers’ Experiences from a Chinese University. Sustainability 2022, 14, 568. [Google Scholar] [CrossRef]
- Rasmitadila, R.; Aliyyah, R.R.; Rachmadtullah, R.; Samsudin, A.; Syaodih, E.; Nurtanto, M.; Tambunan, A.R.S. The Perceptions of Primary School Teachers of Online Learning during the COVID-19 Pandemic Period: A Case Study in Indonesia. J. Ethn. Cult. Stud. 2020, 7, 90–109. [Google Scholar] [CrossRef]
- Subekti, A.S. Covid-19-Triggered Online Learning Implementation: Pre-Service English Teachers’ Beliefs. Metathesis J. Engl. Lang. Lit. Teach. 2020, 4, 232–248. [Google Scholar] [CrossRef]
- Yandell, J. Learning under Lockdown: English teaching in the time of Covid-19. Chang. Engl. 2020, 27, 262–269. [Google Scholar] [CrossRef]
- Lie, A.; Tamah, S.M.; Gozali, I.; Triwidayati, K.R.; Utami, T.S.D.; Jemadi, F. Secondary school language teachers’ online learning engagement during the Covid-19 pandemic in Indonesia. J. Inf. Technol. Educ. Res. 2020, 19, 803–832. [Google Scholar]
- Fitria, T.N. Teaching English through Online Learning System during Covid-19 Pandemic. Pedagog. J. Engl. Lang. Teach. 2020, 8, 138–148. [Google Scholar] [CrossRef]
- Zou, C.; Li, P.; Jin, L. Online college English education in Wuhan against the COVID-19 pandemic: Student and teacher readiness, challenges and implications. PLoS ONE 2021, 16, e0258137. [Google Scholar] [CrossRef]
- Nashir, M.; Laili, R.N. English Teachers’ Perception toward the Switch from Offline to Online Teaching during lockdown in the Midst of Covid-19 Outbreak. Edukatif J. Ilmu Pendidik. 2021, 3, 689–697. [Google Scholar] [CrossRef]
- Sepulveda-Escobar, P.; Morrison, A. Online teaching placement during the COVID-19 pandemic in Chile: Challenges and opportunities. Eur. J. Teach. Educ. 2020, 43, 587–607. [Google Scholar] [CrossRef]
- Shahzad, A.; Hassan, R.; Aremu, A.Y.; Hussain, A.; Lodhi, R.N. Effects of COVID-19 in E-learning on higher education institution students: The group comparison between male and female. Qual. Quant. 2021, 55, 805–826. [Google Scholar] [CrossRef]
- Chen, T.; Peng, L.; Yin, X.; Rong, J.; Yang, J.; Cong, G. Analysis of User Satisfaction with Online Education Platforms in China during the COVID-19 Pandemic. Healthcare 2020, 8, 200. [Google Scholar] [CrossRef] [PubMed]
- Ramírez-Hurtado, J.M.; Hernández-Díaz, A.G.; López-Sánchez, A.D.; Pérez-León, V.E. Measuring Online Teaching Service Quality in Higher Education in the COVID-19 Environment. Int. J. Environ. Res. Public Health 2021, 18, 2403. [Google Scholar] [CrossRef]
- Camilleri, M.A. Evaluating service quality and performance of higher education institutions: A systematic review and a post-COVID-19 outlook. Int. J. Qual. Serv. Sci. 2021, 13, 268–281. [Google Scholar] [CrossRef]
- Udo, G.J.; Bagchi, K.K.; Kirs, P.J. Using SERVQUAL to assess the quality of e-learning experience. Comput. Hum. Behav. 2011, 27, 1272–1283. [Google Scholar] [CrossRef]
- Lam, S.S. SERVQUAL: A tool for measuring patients’ opinions of hospital service quality in Hong Kong. Total Qual. Manage. 1997, 8, 145–152. [Google Scholar] [CrossRef]
- Parasuraman, A.; Zeithaml, V.A.; Berry, L.L. A conceptual model of service quality and its implications for future research. J. Mark. 1985, 49, 41–50. [Google Scholar] [CrossRef]
- Parasuraman, A.; Zeithaml, V.A.; Berry, L.L. SERVQUAL: A multiple-item scale for measuring consumer perceptions of service quality. J. Retail. 1988, 64, 12–28. [Google Scholar]
- Wu, J.C.; Lin, G.H. An Application of Analytic Network Process for Measuring Service Quality of Online Banking—A Case Study of Fubon Financial. Master’s Thesis, National Kaohsiung University of Science and Technology, Kaohsiung, Taiwan, 2011. [Google Scholar]
- Liao, C.C.; Chiang, C.C. An Empirical Investigation of the Relationships among Web Service Quality, Customer Satisfaction, and Behavior Intention: A Study of Online Shopping Behaviors. J. Manag. Syst. 2005, 12, 23–47. [Google Scholar]
- Buttle, F. SERVQUAL: Review, critique, research agenda. Eur. J. Mark. 1996, 30, 8–32. [Google Scholar] [CrossRef]
- Lisa, J.M.C. Measuring service quality: A review and critique of research using SERVQUAL. Int. J. Mark. Res. 2004, 46, 479–497. [Google Scholar]
- Gilmore, A.; McMullan, R. Scales in services marketing research: A critique and way forward. Eur. J. Mark. 2009, 43, 640–651. [Google Scholar] [CrossRef]
- Ladhari, R. Alternative measures of service quality: A review. Manag. Serv. Qual. 2008, 18, 65–86. [Google Scholar] [CrossRef]
- Ladhari, R. A review of twenty years of SERVQUAL research. Int. J. Qual. Serv. Sci. 2009, 1, 172–198. [Google Scholar] [CrossRef]
- Asubonteng, P.; McCleary, K.J.; Swan, J.E. SERVQUAL revisited: A critical review of service quality. J. Serv. Mark. 1996, 10, 62–81. [Google Scholar] [CrossRef]
- Altuntas, S.; Dereli, T.; Yilmaz, M.K. Multi-criteria decision making methods based weighted SERVQUAL scales to measure perceived service quality in hospitals: A case study from Turkey. Total Qual. Manag. Bus. Excell. 2012, 23, 1379–1395. [Google Scholar] [CrossRef]
- Hwang, C.L.; Yoon, K. Multiple Attribute Decision Making: Methods and Applications; Springer: New York, NY, USA, 1981. [Google Scholar]
- Behzadian, M.; Otaghsara, S.K.; Yazdani, M.; Ignatiu, J. A state-of the-art survey of TOPSIS applications. Expert Syst. Appl. 2012, 39, 13051–13069. [Google Scholar] [CrossRef]
- Panda, M.; Jagadev, A.K. TOPSIS in Multi-Criteria Decision Making: A Survey. In Proceedings of the 2018 2nd International Conference on Data Science and Business Analytics (ICDSBA), Changsha, China, 21–23 September 2018. [Google Scholar] [CrossRef]
- Abdulgader, F.S.; Eid, R.; Rouyendegh, B.D. Development of Decision Support Model for Selecting a Maintenance Plan Using a Fuzzy MCDM Approach: A Theoretical Framework. Appl. Comput. Intell. Soft Comput. 2018, 2018, 9346945. [Google Scholar] [CrossRef]
- Samant, R.; Deshpande, S.; Jadhao, A. Survey on Multi Criteria Decision Making Methods. Int. J. Innov. Res. Sci. Eng. Technol. 2015, 4, 7175–7178. [Google Scholar]
- Saaty, T.L. The Analytic Hierarchy Process: Planning, Priority Setting, Resource Allocation; McGraw-Hill: New York, NY, USA, 1980. [Google Scholar]
- Saaty, T.L. Decision Making with Dependence and Feedback: The Analytic Network Process; RWS Publications: Pittsburgh, PA, USA, 1996. [Google Scholar]
- Saaty, T.L. How to make a decision: The analytic hierarchy process. Interfaces 1994, 24, 19–43. [Google Scholar] [CrossRef] [Green Version]
- Saaty, T.L. Rank from comparisons and from ratings in the analytic hierarchy/network processes. Eur. J. Oper. Res. 2006, 168, 557–570. [Google Scholar] [CrossRef]
- Pai, F.Y.; Yeh, T.M. Using Analytic Network Process to Determine the Key Success Factors for Containerized Drinking Industry. Manag. Sci. Res. 2012, 8, 27–45. [Google Scholar]
- Wang, L.F. The Theory and Algorithm of Analytic Network Process. Syst. Eng.–Theory Pract. 2001, 21, 44–50. [Google Scholar]
- Saaty, T.L.; Niemira, M.P. An Analytic Network Process Model for Financial-Crisis Forecasting. Int. J. Forecast. 2004, 20, 573–587. [Google Scholar]
- Chang, B.; Kuo, C.; Wu, C.H.; Tzeng, G.H. Using fuzzy analytic network process to assess the risks in enterprise resource planning system implementation. Appl. Soft Comput. 2015, 28, 196–207. [Google Scholar] [CrossRef]
- Parameshwaran, R.; Baskar, C.; Karthik, T. An integrated framework for mechatronics based product development in a fuzzy environment. Appl. Soft Comput. 2015, 27, 376–390. [Google Scholar] [CrossRef]
- Chang, S.C.; Tsai, P.H.; Chang, S.C. A hybrid fuzzy model for selecting and evaluating the e-book business model: A case study on Taiwan e-book firms. Appl. Soft Comput. 2015, 34, 194–204. [Google Scholar] [CrossRef]
- Yu, M.; Keng, I.; Chen, H. Measuring service quality via a fuzzy analytical approach. Int. J. Fuzzy Syst. 2015, 17, 292–302. [Google Scholar] [CrossRef]
- Lupo, T. A fuzzy framework to evaluate service quality in the healthcare industry: An empirical case of public hospital service evaluation in Sicily. Appl. Soft Comput. 2016, 40, 468–478. [Google Scholar] [CrossRef]
- Ozdemir, Y.; Basligil, H. Aircraft selection using Fuzzy ANP and the generalized Choquet Integral method: The Turkish Airlines case. J. Intell. Fuzzy Syst. 2016, 31, 589–600. [Google Scholar] [CrossRef]
- Saaty, T.L. There is no mathematical validity for using fuzzy number crunching in the analytic hierarchy process. J. Syst. Sci. Syst. Eng. 2006, 15, 457–464. [Google Scholar] [CrossRef]
- Saaty, T.L.; Tran, L.T. On the invalidity of fuzzifying numerical judgments in the Analytic Hierarchy Process. Math. Comput. Model. 2007, 46, 962–975. [Google Scholar] [CrossRef]
- Zhu, K.Y.; Yang, S.L. Research review on Saaty’s comments on fuzzy logic is not applicable to analytic hierarchy process. System Engineering Theory and Practice 2014, 34, 197–206. [Google Scholar]
- Güngör, Z.; Delice, E.K.; Kesen, S.E. New product design using FDMS and FANP under fuzzy environment. Appl. Soft Comput. 2011, 11, 3347–3356. [Google Scholar] [CrossRef]
- Deng, J.L. Introduction to Grey System. J. Grey Syst. 1989, 1, 1–24. [Google Scholar]
- Wu, H.H. A Comparative Study of Using Grey Relational Analysis in Multiple Attribute Decision Making Problems. Qual. Eng. 2002, 15, 209–217. [Google Scholar] [CrossRef]
- Chen, J.H.; Li, Y.G.; Cheng, F.S.; Tsai, H.D.; Cheng, C.C.; Gang, J.E. Application of grey relational method to analyze labor safety and health investment and benefit. J. Taiwan Hydraul. Eng. Assoc. 2012, 15, 140–143. [Google Scholar]
- Chan, L.K.; Wu, M.L. Prioritizing the Technical Measures in Quality Function Deployment. Qual. Eng. 1998, 10, 467–479. [Google Scholar] [CrossRef]
- Parkan, C. The Calculation of Operational Performance Ratings. Int. J. Product. Econ. 1991, 24, 165–173. [Google Scholar] [CrossRef]
- Parkan, C. Operational Competitiveness Ratings of Production Units. Manag. Decis. Econ. 1994, 15, 201–221. [Google Scholar] [CrossRef]
- Liu, C.C.; Chen, J.J. Analysis of the Weights of Service Quality Indicators for Drone Filming and Photography by the Fuzzy Analytic Network Process. Appl. Sci. 2019, 9, 1236. [Google Scholar] [CrossRef] [Green Version]
- Liu, C.C.; Chen, J.J. Research on Service Quality Index of UAV Film Production-Dual Perspective. J. Qual. 2021, 28, 231–251. [Google Scholar]
- Lin, Y.Y. A Service Quality Measurement Architecture for Hot Spring Hotels. Master’s Thesis, Chung Hua University, Hsinchu, Taiwan, 2006. [Google Scholar]
- Chen, S. A combined MCDM model based on DEMATEL and ANP for the selection of airline service quality improvement criteria: A research based on the Taiwan airline industry. J. Air. Transp. Manag. 2016, 57, 7–18. [Google Scholar] [CrossRef]
- Ashouri, F. Quality indicators in the mobile industry rankings based on indicators of customer satisfaction with the hybrid approach DEMATEL and ANP appropriate strategy based on gray system. Orig. Sci. Pap. 2016, 3, 62–72. [Google Scholar] [CrossRef] [Green Version]
- Jin, H.; Zhang, M.; Yuan, Y. Analytic Network Process-based Multi-Criteria decision approach and sensitivity analysis for temporary facility layout planning in construction projects. Appl. Sci. 2018, 8, 2434. [Google Scholar] [CrossRef] [Green Version]
- Chen, C.C.; Lin, Y.J. The Key Success Factors of Development of New Products with Design Flexibility by Analytic Network Process—A Case Study of A High-Tech Company. Manag. Inf. Comput. 2015, 201503, 150–161. [Google Scholar]
- Huang, C.W. ANP Empirical Study on Customer Value Increasing of Skincare Products. Master’s Thesis, Chinese Culture University, Taipei, Taiwan, 2013. [Google Scholar]
- Tsai, W.C.; Kung, P.T.; Weng, R.H.; Chang, Y.H.; Lee, S.Y. Applying the SERVQUAL Questionnaire to Establish Quality Indicators for Chinese Medicine. Taiwan J. Public Health 2008, 27, 309–319. [Google Scholar]
- Babakus, E.; Mangold, W.G. Adapting the SERVQUAL scale to hospital services: An empirical investigation. Health Serv. Res. 1992, 26, 767–786. [Google Scholar]
- Parenté, F.J.; Anderson-Parenté, J.K. Delphi Inquiry Systems. In Judgmental Forecasting; Wright, G., Ayton, P., Eds.; Wiley: Chichester, UK, 1987. [Google Scholar]
- Zhang, G.; Zou, P.X.W. Fuzzy analytical hierarchy process risk assessment approach for joint venture construction projects in China. J. Constr. Eng. Manag. 2007, 133, 771–779. [Google Scholar] [CrossRef]
- Hyun, C.; Cho, K.; Koo, K.; Hong, T.; Moon, H. Effect of delivery methods on design performance in multifamily housing projects. J. Constr. Eng. Manag. 2008, 134, 468–482. [Google Scholar] [CrossRef]
- Lam, K.C.; Lam, M.C.K.; Wang, D. MBNQA–oriented self-assessment quality management system for contractors: Fuzzy AHP approach. Constr. Manag. Econ. 2008, 26, 447–461. [Google Scholar] [CrossRef]
- Pan, N.F. Fuzzy AHP approach for selecting the suitable bridge construction method. Autom. Constr. 2008, 17, 958–965. [Google Scholar] [CrossRef]
- Dalal, J.; Mohapatra, P.K.; Chandra, M.G. Prioritization of rural roads: AHP in group decision. Eng. Constr. Archit. Manag. 2010, 17, 135–158. [Google Scholar] [CrossRef]
- Zou, P.X.W.; Li, J. Risk identification and assessment in subway projects: Case study of Nanjing Subway Line 2. Constr. Manag. Econ. 2010, 28, 1219–1238. [Google Scholar] [CrossRef]
- Li, J.; Zou, P.X.W. Fuzzy AHP-based risk assessment methodology for PPP projects. J. Constr. Eng. Manag. 2011, 137, 1205–1209. [Google Scholar] [CrossRef]
- Pan, W.; Dainty, A.R.J.; Gibb, A.G.F. Establishing and weighting decision criteria for building system selection in housing construction. J. Constr. Eng. Manag. 2012, 138, 1239–1250. [Google Scholar] [CrossRef] [Green Version]
- Akadiri, P.O.; Olomolaiye, P.O.; Chinyio, E.A. Multi-criteria evaluation model for the selection of sustainable materials for building projects. Automat. Constr. 2013, 30, 113–125. [Google Scholar] [CrossRef]
- Chou, J.S.; Pham, A.D.; Wang, H. Bidding strategy to support decision-making by integrating fuzzy AHP and regression-based simulation. Autom. Constr. 2013, 35, 517–527. [Google Scholar] [CrossRef]
- Darko, A.; Chan, A.P.C.; Ameyaw, E.E.; Owusu, E.K.; Pärn, E.; Edwards, D.J. Review of application of analytic hierarchy process (AHP) in construction. Int. J. Constr. Manag. 2018, 19, 436–452. [Google Scholar] [CrossRef]
- Matzler, K.; Sauerwein, E. The factor structure of customer satisfaction: An empirical test of the importance grid and the penalty-reward-contrast analysis. Int. J. Serv. Ind. Manag. 2006, 13, 314–332. [Google Scholar] [CrossRef]
- Kim, W.; Kang, G.; Kim, Y.C. The Determinants of Continuous Usage Intention for One-on-one Online English Education Program. J. Internet Electron. Commer. Res. 2019, 10, 113–126. [Google Scholar] [CrossRef]
- Uppal, M.A.; Ali, S.; Gulliver, S.R. Factors determining e-learning service quality. Br. J. Educ. Technol. 2018, 49, 412–426. [Google Scholar] [CrossRef]
- Sumi, R.S.; Kabir, G. Satisfaction of E-Learners with Electronic Learning Service Quality Using the SERVQUAL Model. J. Open Innov. Technol. Mark. Complex. 2021, 7, 227. [Google Scholar] [CrossRef]
Figure 1.
The system structure of the ANP method.

Figure 2.
Research process of this research.

Figure 3.
Dependency chart of indicators.

Figure 4.
Indicators that were ordered by weight from the opinion of service providers.

Figure 5.
Indicators that were ordered by weight from the perspective of consumers.


Table 1.
Advantages and disadvantages comparison table of AHP and ANP methods.
| Methods | Advantages | Disadvantages |
|---|---|---|
| AHP | Express dimensions and indicators in a hierarchical structure and incorporate consistency checks to make the results more representative. | The assumption that each dimension and indicator are independent of each other is less consistent with the actual situation. |
| ANP | In addition to the advantages of AHP, the dependence and feedback of indicators are allowed. | Complicated calculation process. |
Table 2.
Random indexes (R.I.).
| The Order of Matrix | 1 | 2 | 3 | 4 | 5 | 6 | 7 | 8 | 9 | 10 | 11 | 12 | 13 | 14 | 15 |
|---|---|---|---|---|---|---|---|---|---|---|---|---|---|---|---|
| R.I. | - | - | 0.58 | 0.90 | 1.12 | 1.24 | 1.32 | 1.41 | 1.45 | 1.49 | 1.51 | 1.53 | 1.56 | 1.57 | 1.59 |
Table 3.
Online English teaching service quality evaluation structure.
| Goal | Dimensions | Indicators | |
|---|---|---|---|
| Online English teaching service quality during the COVID-19 pandemic | A Tangibility | A1 | The online English teaching service team has up-to-date equipment. |
| A2 | The online English teaching service team’s physical facilities are visually appealing. | ||
| A3 | The online English teaching service team’s employees are well dressed and appear neat. | ||
| A4 | Equipment matches the service. | ||
| B Reliability | B1 | When the online English teaching service team promises to do something by a certain time, it does so. | |
| B2 | When a customer has a problem, the online English teaching service team is sympathetic and reassuring. | ||
| B3 | The online English teaching service team provides service legally, safely and reliably. | ||
| B4 | The online English teaching service team keeps its records accurately. | ||
| C Responsiveness | C1 | The online English teaching service team tells customers exactly when service will be performed. | |
| C2 | Online English teaching service team’s employees can provide appropriate service. | ||
| C3 | Employees of the online English teaching team are always willing to help customers and provide prompt service. | ||
| C4 | Employees of the online English teaching service team are never too busy to respond to customer requests promptly. | ||
| D Assurance | D1 | Customs can trust employees of the online English teaching service team and feel safe. | |
| D2 | Customers feel safe in their transactions with the online English teaching service team. | ||
| D3 | Employees of the online English teaching service team are polite. | ||
| D4 | Employees are professional and receive adequate support to do their jobs well. | ||
| E Empathy | E1 | The online English teaching service team has operating hours convenient to all their customers. | |
| E2 | The online English teaching service team can provide customers with flexible trading hours. | ||
| E3 | The online English teaching service team’s employee care about the needs of customers and keep them in mind. | ||
| E4 | The online English teaching service team pays great attention to what the customer wants. | ||
| E5 | The online English teaching service team knows what customers needs are and gives care. | ||
Table 4.
Indicator dependency relationship score.
| Dimensions | A Tangibility | B Reliability | C Responsiveness | D Assurance | E Empathy | |||||||||||||||||
|---|---|---|---|---|---|---|---|---|---|---|---|---|---|---|---|---|---|---|---|---|---|---|
| Indications | A1 | A2 | A3 | A4 | B1 | B2 | B3 | B4 | C1 | C2 | C3 | C4 | D1 | D2 | D3 | D4 | E1 | E2 | E3 | E4 | E5 | |
| A Tangibility | A1 | 3 | 1 | 0 | 0 | 0 | 0 | 0 | 0 | 0 | 0 | 0 | 0 | 0 | 0 | 0 | 0 | 1 | 0 | 0 | 0 | 0 |
| A2 | 2 | 0 | 0 | 0 | 0 | 0 | 0 | 0 | 0 | 0 | 0 | 0 | 0 | 0 | 0 | 0 | 0 | 0 | 0 | 0 | 0 | |
| A3 | 0 | 0 | 0 | 0 | 0 | 0 | 4 | 0 | 0 | 0 | 0 | 0 | 3 | 0 | 0 | 0 | 0 | 0 | 0 | 0 | 0 | |
| A4 | 2 | 0 | 0 | 0 | 1 | 0 | 0 | 0 | 0 | 4 | 0 | 0 | 0 | 0 | 0 | 0 | 4 | 0 | 0 | 0 | 0 | |
| B Reliability | B1 | 0 | 0 | 0 | 0 | 0 | 0 | 10 | 4 | 10 | 0 | 0 | 0 | 10 | 0 | 0 | 0 | 0 | 0 | 0 | 0 | 0 |
| B2 | 0 | 0 | 0 | 0 | 0 | 0 | 10 | 0 | 0 | 0 | 10 | 10 | 7 | 0 | 0 | 0 | 0 | 0 | 0 | 0 | 0 | |
| B3 | 0 | 0 | 0 | 0 | 0 | 0 | 0 | 0 | 4 | 5 | 4 | 5 | 6 | 6 | 0 | 4 | 0 | 0 | 0 | 3 | 3 | |
| B4 | 0 | 0 | 0 | 0 | 0 | 0 | 3 | 5 | 0 | 0 | 0 | 0 | 6 | 9 | 0 | 0 | 0 | 0 | 0 | 4 | 3 | |
| C Responsiveness | C1 | 0 | 0 | 0 | 0 | 0 | 0 | 0 | 0 | 0 | 0 | 0 | 0 | 10 | 0 | 0 | 0 | 1 | 0 | 0 | 0 | 0 |
| C2 | 0 | 0 | 0 | 0 | 0 | 0 | 0 | 0 | 0 | 0 | 0 | 0 | 0 | 0 | 0 | 0 | 9 | 0 | 0 | 0 | 0 | |
| C3 | 0 | 0 | 0 | 0 | 0 | 0 | 0 | 0 | 0 | 0 | 0 | 0 | 6 | 2 | 0 | 0 | 2 | 0 | 0 | 0 | 0 | |
| C4 | 0 | 0 | 0 | 0 | 0 | 0 | 0 | 0 | 0 | 0 | 0 | 0 | 2 | 1 | 0 | 0 | 6 | 0 | 0 | 0 | 0 | |
| D Assurance | D1 | 0 | 0 | 2 | 0 | 0 | 0 | 0 | 0 | 0 | 0 | 0 | 0 | 0 | 0 | 0 | 0 | 0 | 0 | 0 | 0 | 2 |
| D2 | 0 | 0 | 0 | 1 | 0 | 0 | 0 | 0 | 0 | 0 | 0 | 6 | 0 | 0 | 0 | 0 | 0 | 0 | 0 | 0 | 2 | |
| D3 | 0 | 0 | 0 | 0 | 0 | 0 | 0 | 0 | 0 | 0 | 0 | 0 | 0 | 0 | 0 | 0 | 1 | 0 | 0 | 0 | 0 | |
| D4 | 1 | 0 | 0 | 0 | 0 | 0 | 0 | 0 | 0 | 0 | 0 | 0 | 10 | 0 | 0 | 0 | 0 | 0 | 0 | 0 | 0 | |
| E Empathy | E1 | 0 | 0 | 0 | 0 | 0 | 0 | 0 | 0 | 0 | 0 | 0 | 0 | 0 | 0 | 0 | 0 | 0 | 0 | 0 | 0 | 0 |
| E2 | 0 | 0 | 0 | 0 | 0 | 0 | 0 | 0 | 0 | 0 | 0 | 0 | 0 | 0 | 0 | 0 | 5 | 0 | 0 | 0 | 0 | |
| E3 | 0 | 0 | 0 | 0 | 0 | 5 | 0 | 0 | 0 | 0 | 0 | 8 | 0 | 0 | 0 | 0 | 5 | 0 | 0 | 0 | 0 | |
| E4 | 0 | 1 | 0 | 0 | 0 | 5 | 0 | 0 | 0 | 0 | 6 | 10 | 6 | 10 | 0 | 0 | 0 | 0 | 0 | 0 | 0 | |
| E5 | 0 | 0 | 0 | 0 | 0 | 0 | 0 | 0 | 0 | 0 | 0 | 0 | 10 | 0 | 0 | 0 | 0 | 0 | 0 | 0 | 0 | |
Table 5.
C.I. and C.R.
| Compare Respect to | Group | Pairwise Compassion | Service Providers | Consumers | |||
|---|---|---|---|---|---|---|---|
| C.I. | C.R. | C.I. | C.R. | ||||
| Dimensions | Goal | A and B, A and C, A and D, A and E, B and C, B and D, B and E, C and D, C and E, D and E | 0.00919 | 0.01021 | 0.00603 | 0.00670 | |
| C | B and E | 0.00000 | 0.00000 | 0.00000 | 0.00000 | ||
| D | B and C, B and D, B and E, C and D, C and E, D and E | 0.00283 | 0.00488 | 0.00008 | 0.00014 | ||
| Indicator | Goal | A | A1 and A2, A1 and A3, A1 and A4, A2 and A3, A2 and A4, A3 and A4 | 0.00299 | 0.00516 | 0.00305 | 0.00526 |
| B | B1 and B2, B1 and B3, B1 and B4, B2 and B3, B2 and B4, B3 and B4 | 0.00051 | 0.00088 | 0.00310 | 0.00534 | ||
| C | C1 and C2, C1 and C3, C1 and C4, C2 and C3, C2 and C4, C3 and C4 | 0.01115 | 0.01922 | 0.00546 | 0.00941 | ||
| D | D1 and D2, D1 and D3, D1 and D4, D2 and D3, D2 and D4, D3 and D4 | 0.00024 | 0.00041 | 0.00723 | 0.01247 | ||
| E | E1 and E2, E1 and E3, E1 and E4, E1 and E5, E2 and E3, E2 and E4, E2 and E5, E3 and E4, E3 and E5, E4 and E5 | 0.01167 | 0.01297 | 0.00161 | 0.00179 | ||
| B3 | B | B1 and B2 | 0.00000 | 0.00000 | 0.00000 | 0.00000 | |
Table 6.
The super matrix of comprehensive service providers’ opinions.
| Dimensions | Tangibility | Reliability | Responsiveness | Assurance | Empathy | |||||||||||||||||
|---|---|---|---|---|---|---|---|---|---|---|---|---|---|---|---|---|---|---|---|---|---|---|
| Indications | A1 | A2 | A3 | A4 | B1 | B2 | B3 | B4 | C1 | C2 | C3 | C4 | D1 | D2 | D3 | D4 | E1 | E2 | E3 | E4 | E5 | |
| Tangibility | A1 | 0.003 | 0.003 | 0.003 | 0.003 | 0.003 | 0.003 | 0.003 | 0.003 | 0.003 | 0.003 | 0.003 | 0.003 | 0.003 | 0.003 | 0.003 | 0.003 | 0.003 | 0.003 | 0.003 | 0.003 | 0.003 |
| A2 | 0.005 | 0.005 | 0.005 | 0.005 | 0.005 | 0.005 | 0.005 | 0.005 | 0.005 | 0.005 | 0.005 | 0.005 | 0.005 | 0.005 | 0.005 | 0.005 | 0.005 | 0.005 | 0.005 | 0.005 | 0.005 | |
| A3 | 0.008 | 0.008 | 0.008 | 0.008 | 0.008 | 0.008 | 0.008 | 0.008 | 0.008 | 0.008 | 0.008 | 0.008 | 0.008 | 0.008 | 0.008 | 0.008 | 0.008 | 0.008 | 0.008 | 0.008 | 0.008 | |
| A4 | 0.008 | 0.008 | 0.008 | 0.008 | 0.008 | 0.008 | 0.008 | 0.008 | 0.008 | 0.008 | 0.008 | 0.008 | 0.008 | 0.008 | 0.008 | 0.008 | 0.008 | 0.008 | 0.008 | 0.008 | 0.008 | |
| Reliability | B1 | 0.049 | 0.049 | 0.049 | 0.049 | 0.049 | 0.049 | 0.049 | 0.049 | 0.049 | 0.049 | 0.049 | 0.049 | 0.049 | 0.049 | 0.049 | 0.049 | 0.049 | 0.049 | 0.049 | 0.049 | 0.049 |
| B2 | 0.167 | 0.167 | 0.167 | 0.167 | 0.167 | 0.167 | 0.167 | 0.167 | 0.167 | 0.167 | 0.167 | 0.167 | 0.167 | 0.167 | 0.167 | 0.167 | 0.167 | 0.167 | 0.167 | 0.167 | 0.167 | |
| B3 | 0.030 | 0.030 | 0.030 | 0.030 | 0.030 | 0.030 | 0.030 | 0.030 | 0.030 | 0.030 | 0.030 | 0.030 | 0.030 | 0.030 | 0.030 | 0.030 | 0.030 | 0.030 | 0.030 | 0.030 | 0.030 | |
| B4 | 0.025 | 0.025 | 0.025 | 0.025 | 0.025 | 0.025 | 0.025 | 0.025 | 0.025 | 0.025 | 0.025 | 0.025 | 0.025 | 0.025 | 0.025 | 0.025 | 0.025 | 0.025 | 0.025 | 0.025 | 0.025 | |
| Responsiveness | C1 | 0.027 | 0.027 | 0.027 | 0.027 | 0.027 | 0.027 | 0.027 | 0.027 | 0.027 | 0.027 | 0.027 | 0.027 | 0.027 | 0.027 | 0.027 | 0.027 | 0.027 | 0.027 | 0.027 | 0.027 | 0.027 |
| C2 | 0.029 | 0.029 | 0.029 | 0.029 | 0.029 | 0.029 | 0.029 | 0.029 | 0.029 | 0.029 | 0.029 | 0.029 | 0.029 | 0.029 | 0.029 | 0.029 | 0.029 | 0.029 | 0.029 | 0.029 | 0.029 | |
| C3 | 0.080 | 0.080 | 0.080 | 0.080 | 0.080 | 0.080 | 0.080 | 0.080 | 0.080 | 0.080 | 0.080 | 0.080 | 0.080 | 0.080 | 0.080 | 0.080 | 0.080 | 0.080 | 0.080 | 0.080 | 0.080 | |
| C4 | 0.086 | 0.086 | 0.086 | 0.086 | 0.086 | 0.086 | 0.086 | 0.086 | 0.086 | 0.086 | 0.086 | 0.086 | 0.086 | 0.086 | 0.086 | 0.086 | 0.086 | 0.086 | 0.086 | 0.086 | 0.086 | |
| Assurance | D1 | 0.042 | 0.042 | 0.042 | 0.042 | 0.042 | 0.042 | 0.042 | 0.042 | 0.042 | 0.042 | 0.042 | 0.042 | 0.042 | 0.042 | 0.042 | 0.042 | 0.042 | 0.042 | 0.042 | 0.042 | 0.042 |
| D2 | 0.064 | 0.064 | 0.064 | 0.064 | 0.064 | 0.064 | 0.064 | 0.064 | 0.064 | 0.064 | 0.064 | 0.064 | 0.064 | 0.064 | 0.064 | 0.064 | 0.064 | 0.064 | 0.064 | 0.064 | 0.064 | |
| D3 | 0.019 | 0.019 | 0.019 | 0.019 | 0.019 | 0.019 | 0.019 | 0.019 | 0.019 | 0.019 | 0.019 | 0.019 | 0.019 | 0.019 | 0.019 | 0.019 | 0.019 | 0.019 | 0.019 | 0.019 | 0.019 | |
| D4 | 0.065 | 0.065 | 0.065 | 0.065 | 0.065 | 0.065 | 0.065 | 0.065 | 0.065 | 0.065 | 0.065 | 0.065 | 0.065 | 0.065 | 0.065 | 0.065 | 0.065 | 0.065 | 0.065 | 0.065 | 0.065 | |
| Empathy | E1 | 0.011 | 0.011 | 0.011 | 0.011 | 0.011 | 0.011 | 0.011 | 0.011 | 0.011 | 0.011 | 0.011 | 0.011 | 0.011 | 0.011 | 0.011 | 0.011 | 0.011 | 0.011 | 0.011 | 0.011 | 0.011 |
| E2 | 0.010 | 0.010 | 0.010 | 0.010 | 0.010 | 0.010 | 0.010 | 0.010 | 0.010 | 0.010 | 0.010 | 0.010 | 0.010 | 0.010 | 0.010 | 0.010 | 0.010 | 0.010 | 0.010 | 0.010 | 0.010 | |
| E3 | 0.028 | 0.028 | 0.028 | 0.028 | 0.028 | 0.028 | 0.028 | 0.028 | 0.028 | 0.028 | 0.028 | 0.028 | 0.028 | 0.028 | 0.028 | 0.028 | 0.028 | 0.028 | 0.028 | 0.028 | 0.028 | |
| E4 | 0.168 | 0.168 | 0.168 | 0.168 | 0.168 | 0.168 | 0.168 | 0.168 | 0.168 | 0.168 | 0.168 | 0.168 | 0.168 | 0.168 | 0.168 | 0.168 | 0.168 | 0.168 | 0.168 | 0.168 | 0.168 | |
| E5 | 0.079 | 0.079 | 0.079 | 0.079 | 0.079 | 0.079 | 0.079 | 0.079 | 0.079 | 0.079 | 0.079 | 0.079 | 0.079 | 0.079 | 0.079 | 0.079 | 0.079 | 0.079 | 0.079 | 0.079 | 0.079 | |
Table 7.
The super matrix of comprehensive consumers’ opinions.
| Dimensions | Tangibility | Reliability | Responsiveness | Assurance | Empathy | |||||||||||||||||
|---|---|---|---|---|---|---|---|---|---|---|---|---|---|---|---|---|---|---|---|---|---|---|
| Indications | A1 | A2 | A3 | A4 | B1 | B2 | B3 | B4 | C1 | C2 | C3 | C4 | D1 | D2 | D3 | D4 | E1 | E2 | E3 | E4 | E5 | |
| Tangibility | A1 | 0.002 | 0.002 | 0.002 | 0.002 | 0.002 | 0.002 | 0.002 | 0.002 | 0.002 | 0.002 | 0.002 | 0.002 | 0.002 | 0.002 | 0.002 | 0.002 | 0.002 | 0.002 | 0.002 | 0.002 | 0.002 |
| A2 | 0.003 | 0.003 | 0.003 | 0.003 | 0.003 | 0.003 | 0.003 | 0.003 | 0.003 | 0.003 | 0.003 | 0.003 | 0.003 | 0.003 | 0.003 | 0.003 | 0.003 | 0.003 | 0.003 | 0.003 | 0.003 | |
| A3 | 0.011 | 0.011 | 0.011 | 0.011 | 0.011 | 0.011 | 0.011 | 0.011 | 0.011 | 0.011 | 0.011 | 0.011 | 0.011 | 0.011 | 0.011 | 0.011 | 0.011 | 0.011 | 0.011 | 0.011 | 0.011 | |
| A4 | 0.006 | 0.006 | 0.006 | 0.006 | 0.006 | 0.006 | 0.006 | 0.006 | 0.006 | 0.006 | 0.006 | 0.006 | 0.006 | 0.006 | 0.006 | 0.006 | 0.006 | 0.006 | 0.006 | 0.006 | 0.006 | |
| Reliability | B1 | 0.060 | 0.060 | 0.060 | 0.060 | 0.060 | 0.060 | 0.060 | 0.060 | 0.060 | 0.060 | 0.060 | 0.060 | 0.060 | 0.060 | 0.060 | 0.060 | 0.060 | 0.060 | 0.060 | 0.060 | 0.060 |
| B2 | 0.174 | 0.174 | 0.174 | 0.174 | 0.174 | 0.174 | 0.174 | 0.174 | 0.174 | 0.174 | 0.174 | 0.174 | 0.174 | 0.174 | 0.174 | 0.174 | 0.174 | 0.174 | 0.174 | 0.174 | 0.174 | |
| B3 | 0.059 | 0.059 | 0.059 | 0.059 | 0.059 | 0.059 | 0.059 | 0.059 | 0.059 | 0.059 | 0.059 | 0.059 | 0.059 | 0.059 | 0.059 | 0.059 | 0.059 | 0.059 | 0.059 | 0.059 | 0.059 | |
| B4 | 0.098 | 0.098 | 0.098 | 0.098 | 0.098 | 0.098 | 0.098 | 0.098 | 0.098 | 0.098 | 0.098 | 0.098 | 0.098 | 0.098 | 0.098 | 0.098 | 0.098 | 0.098 | 0.098 | 0.098 | 0.098 | |
| Responsiveness | C1 | 0.028 | 0.028 | 0.028 | 0.028 | 0.028 | 0.028 | 0.028 | 0.028 | 0.028 | 0.028 | 0.028 | 0.028 | 0.028 | 0.028 | 0.028 | 0.028 | 0.028 | 0.028 | 0.028 | 0.028 | 0.028 |
| C2 | 0.036 | 0.036 | 0.036 | 0.036 | 0.036 | 0.036 | 0.036 | 0.036 | 0.036 | 0.036 | 0.036 | 0.036 | 0.036 | 0.036 | 0.036 | 0.036 | 0.036 | 0.036 | 0.036 | 0.036 | 0.036 | |
| C3 | 0.050 | 0.050 | 0.050 | 0.050 | 0.050 | 0.050 | 0.050 | 0.050 | 0.050 | 0.050 | 0.050 | 0.050 | 0.050 | 0.050 | 0.050 | 0.050 | 0.050 | 0.050 | 0.050 | 0.050 | 0.050 | |
| C4 | 0.076 | 0.076 | 0.076 | 0.076 | 0.076 | 0.076 | 0.076 | 0.076 | 0.076 | 0.076 | 0.076 | 0.076 | 0.076 | 0.076 | 0.076 | 0.076 | 0.076 | 0.076 | 0.076 | 0.076 | 0.076 | |
| Assurance | D1 | 0.034 | 0.034 | 0.034 | 0.034 | 0.034 | 0.034 | 0.034 | 0.034 | 0.034 | 0.034 | 0.034 | 0.034 | 0.034 | 0.034 | 0.034 | 0.034 | 0.034 | 0.034 | 0.034 | 0.034 | 0.034 |
| D2 | 0.148 | 0.148 | 0.148 | 0.148 | 0.148 | 0.148 | 0.148 | 0.148 | 0.148 | 0.148 | 0.148 | 0.148 | 0.148 | 0.148 | 0.148 | 0.148 | 0.148 | 0.148 | 0.148 | 0.148 | 0.148 | |
| D3 | 0.016 | 0.016 | 0.016 | 0.016 | 0.016 | 0.016 | 0.016 | 0.016 | 0.016 | 0.016 | 0.016 | 0.016 | 0.016 | 0.016 | 0.016 | 0.016 | 0.016 | 0.016 | 0.016 | 0.016 | 0.016 | |
| D4 | 0.045 | 0.045 | 0.045 | 0.045 | 0.045 | 0.045 | 0.045 | 0.045 | 0.045 | 0.045 | 0.045 | 0.045 | 0.045 | 0.045 | 0.045 | 0.045 | 0.045 | 0.045 | 0.045 | 0.045 | 0.045 | |
| Empathy | E1 | 0.006 | 0.006 | 0.006 | 0.006 | 0.006 | 0.006 | 0.006 | 0.006 | 0.006 | 0.006 | 0.006 | 0.006 | 0.006 | 0.006 | 0.006 | 0.006 | 0.006 | 0.006 | 0.006 | 0.006 | 0.006 |
| E2 | 0.008 | 0.008 | 0.008 | 0.008 | 0.008 | 0.008 | 0.008 | 0.008 | 0.008 | 0.008 | 0.008 | 0.008 | 0.008 | 0.008 | 0.008 | 0.008 | 0.008 | 0.008 | 0.008 | 0.008 | 0.008 | |
| E3 | 0.020 | 0.020 | 0.020 | 0.020 | 0.020 | 0.020 | 0.020 | 0.020 | 0.020 | 0.020 | 0.020 | 0.020 | 0.020 | 0.020 | 0.020 | 0.020 | 0.020 | 0.020 | 0.020 | 0.020 | 0.020 | |
| E4 | 0.102 | 0.102 | 0.102 | 0.102 | 0.102 | 0.102 | 0.102 | 0.102 | 0.102 | 0.102 | 0.102 | 0.102 | 0.102 | 0.102 | 0.102 | 0.102 | 0.102 | 0.102 | 0.102 | 0.102 | 0.102 | |
| E5 | 0.020 | 0.020 | 0.020 | 0.020 | 0.020 | 0.020 | 0.020 | 0.020 | 0.020 | 0.020 | 0.020 | 0.020 | 0.020 | 0.020 | 0.020 | 0.020 | 0.020 | 0.020 | 0.020 | 0.020 | 0.020 | |
Table 8.
Weights and orders of dimensions.
| Service Providers | Consumers | |||
|---|---|---|---|---|
| Dimensions | Weight | Order | Weight | Order |
| Tangibility | 0.036 | 5 | 0.036 | 5 |
| Reliability | 0.130 | 4 | 0.185 | 3 |
| Responsiveness | 0.300 | 1 | 0.288 | 2 |
| Assurance | 0.270 | 2 | 0.378 | 1 |
| Empathy | 0.264 | 3 | 0.113 | 4 |
Publisher’s Note: MDPI stays neutral with regard to jurisdictional claims in published maps and institutional affiliations. |
© 2022 by the authors. Licensee MDPI, Basel, Switzerland. This article is an open access article distributed under the terms and conditions of the Creative Commons Attribution (CC BY) license (https://creativecommons.org/licenses/by/4.0/).
Share and Cite
MDPI and ACS Style
Ma, Y.-Y.; Chen, J.-J.; Lin, C.-L. Research on the Priority of Service Quality Index for Online English Teaching during the COVID-19 Pandemic: Dual Perspective. Mathematics 2022, 10, 3642. https://doi.org/10.3390/math10193642
AMA Style
Ma Y-Y, Chen J-J, Lin C-L. Research on the Priority of Service Quality Index for Online English Teaching during the COVID-19 Pandemic: Dual Perspective. Mathematics. 2022; 10(19):3642. https://doi.org/10.3390/math10193642
Chicago/Turabian StyleMa, Yu-Yu, Jwu-Jenq Chen, and Chia-Liang Lin. 2022. "Research on the Priority of Service Quality Index for Online English Teaching during the COVID-19 Pandemic: Dual Perspective" Mathematics 10, no. 19: 3642. https://doi.org/10.3390/math10193642
Note that from the first issue of 2016, this journal uses article numbers instead of page numbers. See further details here.