1. Introduction
At the close of 2019, COVID-19 swept the globe, causing more than 100 million infections and more than 2.5 million deaths to date. Fortunately, the spread of COVID-19 has been significantly curbed by the epidemic prevention and control measures implemented by national governments, with a significant drop in the number of new diagnoses per day and a cure rate of more than 70%. However, COVID-19 still has a great impact on the daily production and living activities of human society. The World Health Organization (WHO) stated the world could be very unrealistic to halt the epidemic by the end of this year on 1 March 2021, indicating that human society would be in a post-epidemic period for quite some time [
1]. Compared with epidemic prevention, control, isolation and curing in the early stages, more rapid testing of COVID-19 will be needed in the post-epidemic period. In the context of the rapidly increasing demand for COVID-19 testing in the post-epidemic period, the questions of how to fairly and reasonably distribute COVID-19 testing facilities are of great practical significance, and are an issue that has not yet been fully explored in academic circles. COVID-19 broke out at the end of 2019, and through timely response and strong management, it has already received effective control, with fewer than 3000 existing infections in China. Moreover, the average number of new cases has been less than 10 per day for a long time in China. In this way, it is befitting to take one city in China as a case study for the rationality of the current COVID-19 testing facility allocation research.
It is inaccurate to evaluate the rationality of testing facility allocation through the uniformity of spatial distribution due to the unevenly distributed populations in cities and countries. However, accessibility is an appropriate indicator for the measurement of the rationality of public facility allocation, which refers to the convenience of accessing service facilities. Spatial accessibility analysis based on geographic information systems is a practical tool to measure the rationality of testing facility allocation. Such an analysis can solve the problem of unequal and inefficient testing resources that results from inadequate urban planning [
2,
3,
4].
In 1959, Hansen formally proposed the concept of accessibility, and defined it as the opportunities for interaction between nodes in a traffic network [
4]. The notion of accessibility was later extended to fields such as traffic planning, urban development, and facility location analysis, and thus gave rise to multiple different concepts. For instance, Ingram believed that accessibility referred to the cost (such as travel time, financial expenses, etc.) that people paid to get to their destinations [
5]. Wachs and Kumagai deemed accessibility to be the number of activities (services, resources, etc.) available at a particular location [
6]. The variations in the understanding of accessibility among scholars from different academic backgrounds essentially derive from differences in measurement methods and the purpose of accessibility as viewed by various research fields. However, accessibility, in essence, refers to the ease of getting from one place to another [
7]. It characterizes the fundamental law of human activities to obtain as many resources and services as possible with the least amount of effort. There are three main influencing factors of accessibility: starting points, endpoints, and the connection between starting points and endpoints [
8]. The starting points of accessibility with respect to public facilities refer to people requiring a certain service, whose attributes include objective factors (gender, age, physical condition, payment ability, etc.) and subjective factors (personal perception, personal preference, value orientation, etc.). The endpoints are all of the available public facilities, the attributes of which include their location, type, and scale, etc. The connection forms are the traffic system, which is composed of traffic networks and travel modes. In addition, some external social factors (such as economic income, cultural differences, and racial discrimination) also influence the accessibility of public facilities.
In addition to accessibility, equity—one of the goals assiduously pursued by human society—is another aspect that can be used to evaluate the rationality of public facility allocation. Social equity refers to the equal access to resources and chances shared by people from different social statuses and classes [
9,
10]. The purpose of public facilities is to provide citizens with medical treatment, education, culture, leisure, transportation, and other public services, all of which are vital foundations for the realization of social equity. Thus, the allocation of public facilities naturally demands that people of different backgrounds enjoy the same quality of service insofar as possible. However, because of the broad implications of the equity concept, the equality of public facilities does not yet have a clear and authoritative definition. Since the 1960s, the understanding of the equity of public facilities in academic circles has been roughly divided into three aspects: (1) territorial justice and spatial equality, (2) locational equity and spatial equity, and (3) social equity. Among these categories, social equity deemed that the distribution of public services in many cities was racially polarized and unfair, and that such inequity tended to appear in the lower class [
11]. For example, green space tends to cluster toward high-income neighborhoods [
12,
13], homeowners [
14], mainstream ethnic groups [
15,
16,
17], and people of a high socioeconomic status [
18,
19]. In terms of solutions, Talen believed that the ultimate goal of public services should be to provide equal access to public facilities between minority groups and non-minority groups in the community, as well as an even higher level of accessibility to public facilities for low-income residents [
15]. Furthermore, Feyzan [
12] argued that public services should consider the demand of different social groups and their usage patterns with respect to public facilities. Through current research on the equity of public facilities, it can be concluded that questionnaire surveys and spatial analysis in geographic information systems are the most common evaluation methods. Although researchers may select different analysis methods and evaluation indicators due to different research purposes and the concrete study focus, the core ideas of research are consistent overall. Firstly, researchers evaluate the accessibility of public facilities by spatial analysis in the geographic information system. Then, the characteristics of the spatial distribution of residents with different socioeconomic attributes (age, gender, nationality, economic income level, and so on) and the results of the accessibility analysis are superposed in order to obtain a comprehensive analysis conclusion regarding the equity of public facilities [
20]. The equity of public facilities is therefore affected by two main factors: the accessibility of public facilities and the spatial differentiation of different demand groups [
21].
In summary, accessibility and equity can be regarded as excellent indicators of the rationality of the COVID-19 testing facility allocation. However, the current COVID-19 testing facilities mostly rely on a small number of comprehensive hospitals of which the distribution is concentrated, which increase the time spent by residents on COVID-19 testing, and add to the burden of medical resources in comprehensive hospitals. However, COVID-19 testing technology is easy to operate; it requires only a short training period, and consists of moderately priced equipment. This enables small and medium-sized hospitals to be qualified to carry out COVID-19 testing after sufficient capital investment and technical training. In light of this, this paper took the Haishu District, Ningbo City, as an example. We utilized the improved potential model to measure the spatial accessibility of the current and potential testing facilities, which was superposed with the population demand index reflecting the residents’ demand for testing, in order to measure the equity of current and potential testing facility allocation in Haishu District. The goal of this study is to provide a reference for local government departments to optimize COVID-19 testing. This paper focuses on the following questions: (1) What are the spatial characteristics and differences in accessibility and equity of current testing facilities in Haishu District? (2) Can the allocation of COVID-19 testing facilities be improved by making full use of existing medical facilities?
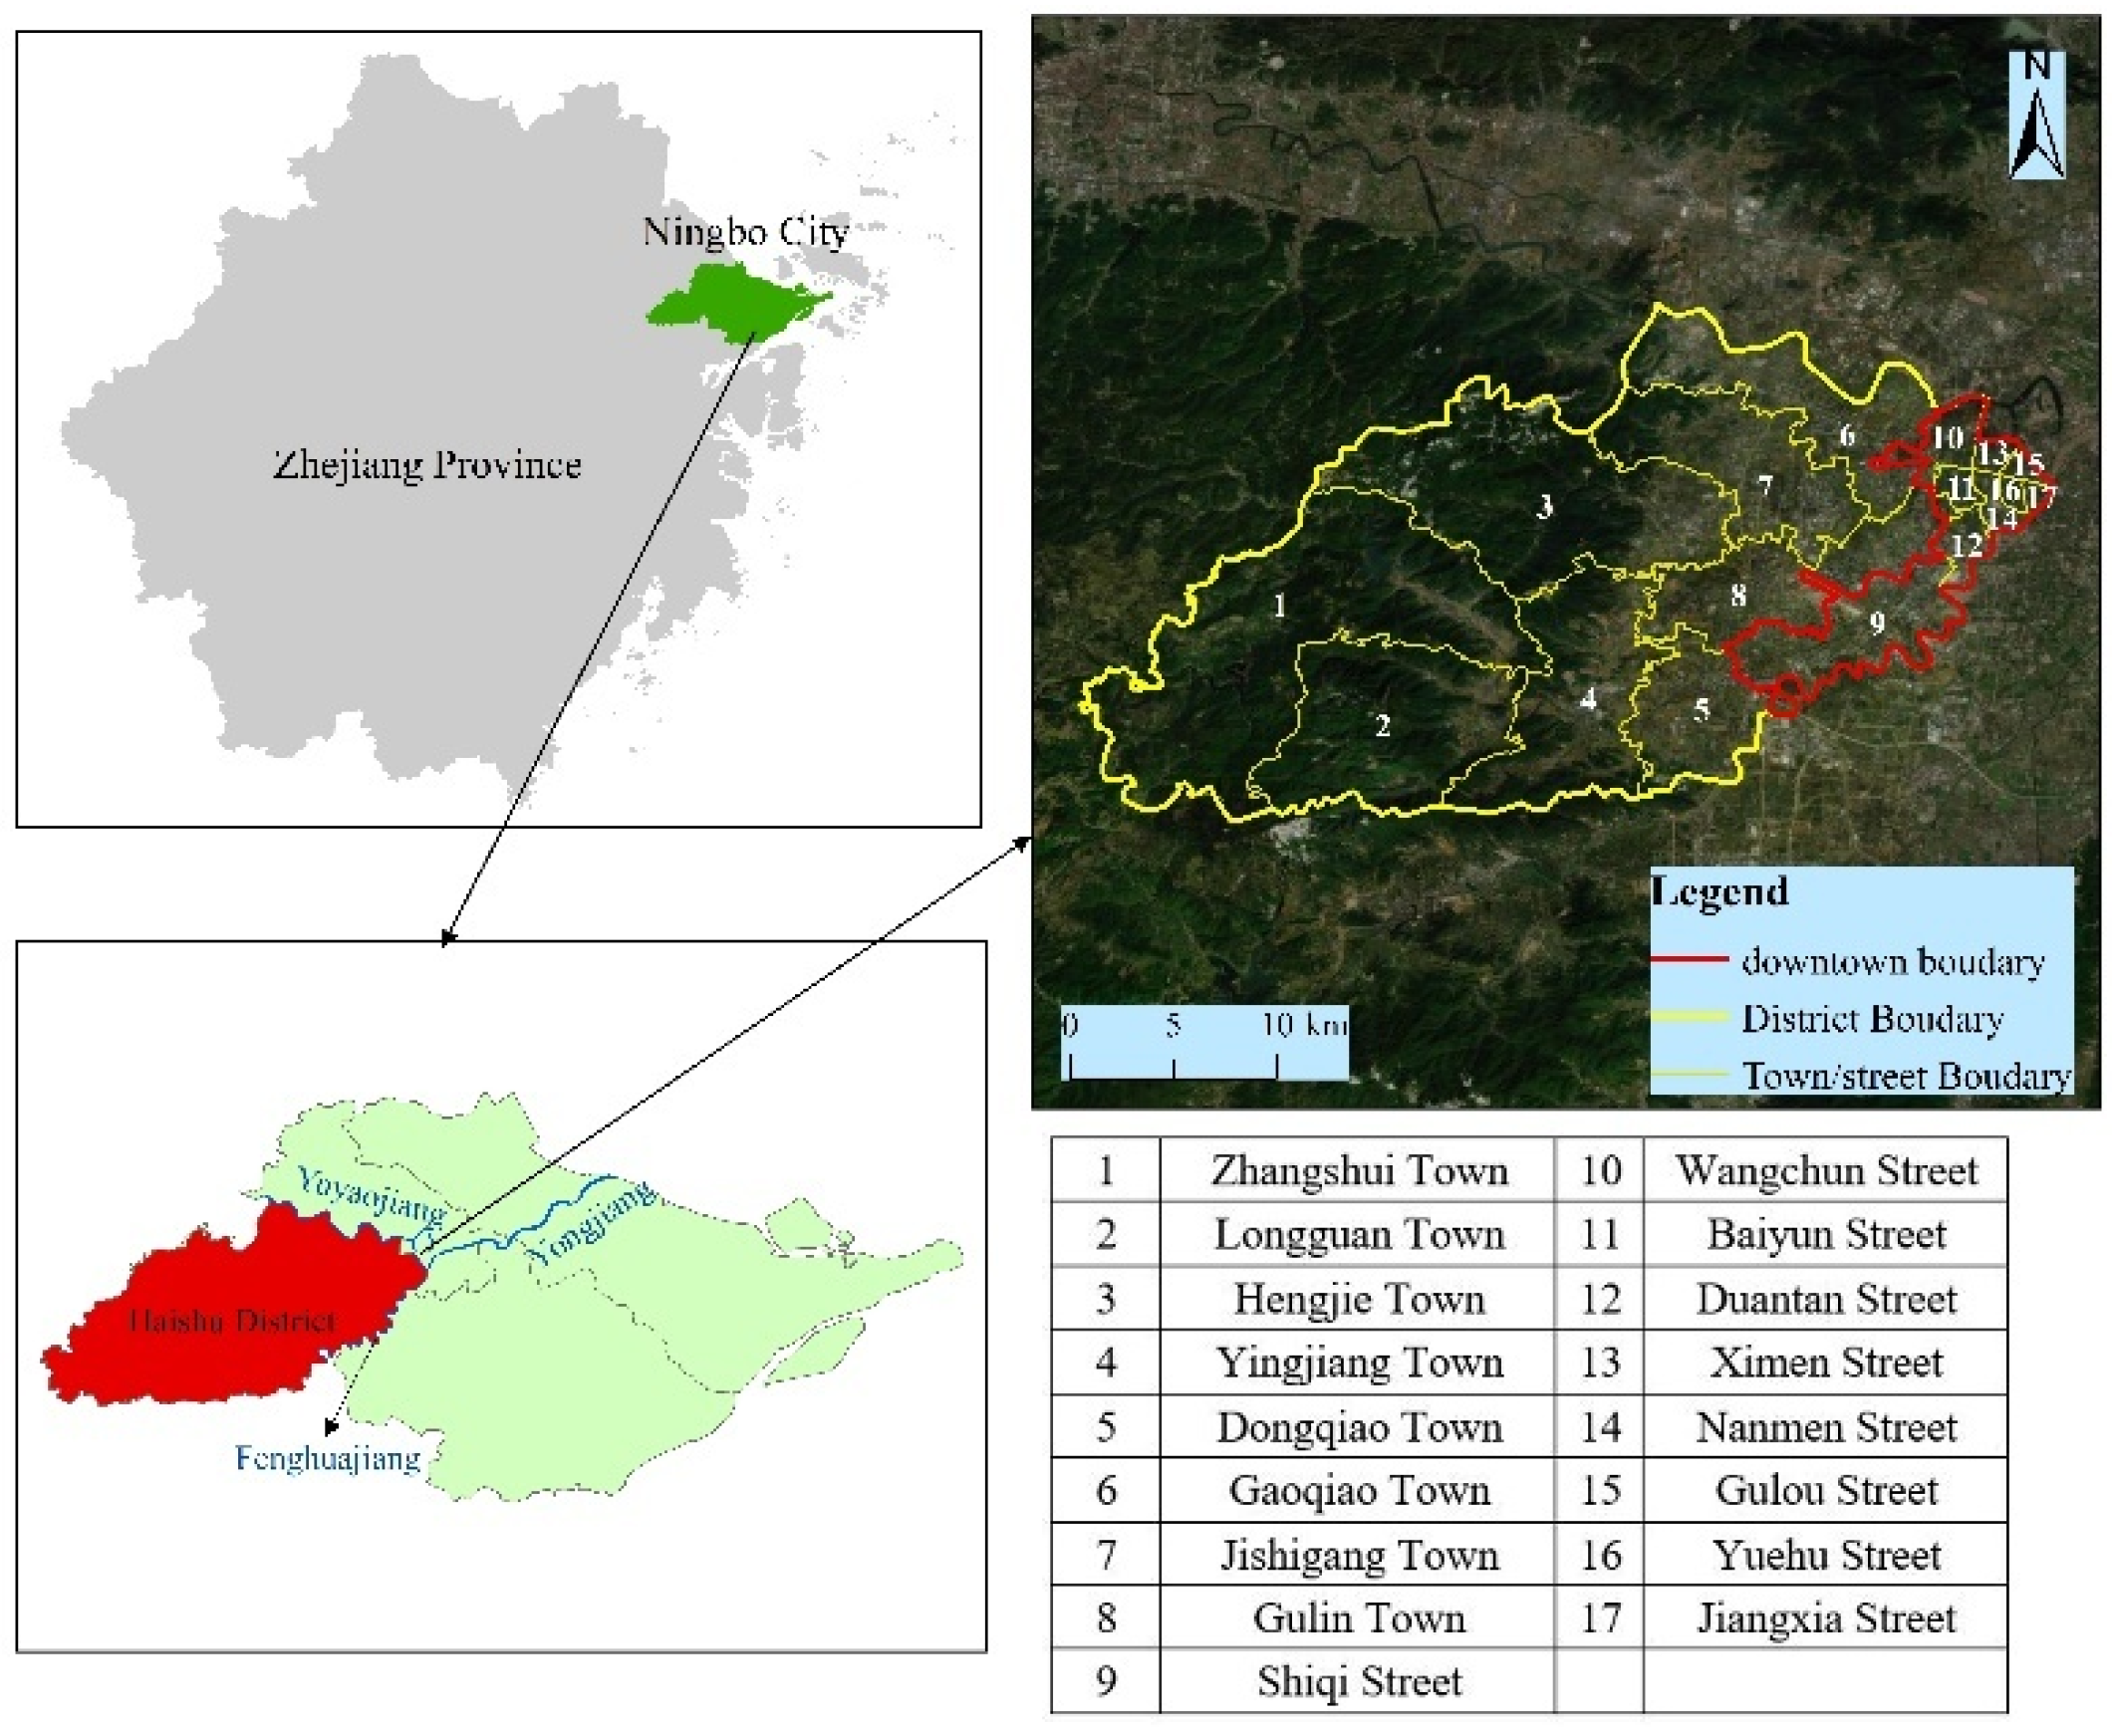
2. Research Area and Data
2.1. Research Area
The Haishu District is a critical part of the downtown area in Ningbo City, including the central urban area and the central urban green space system in the confluence area of the Yuyao River, Fenghua River and Yong River. It faces the Fenghua River in the south and the Yuyao River in the north, and borders the Yinzhou District in the southwest. Meanwhile, the eastern part of Haishu, located in the inner area of the Ningbo Urban Expressway, is surrounded by an elevated airport road, i.e., Tongtu Road, Century Avenue. The basic public service facilities in the inner area are relatively complete. On the contrary, the western part of Haishu District is located outside of the area, and the basic public facilities are relatively few. It is a typical urban–rural integration area in Ningbo. Moreover, Haishu District administers 17 towns/streets (
Figure 1). At the end of 2019, the regional GDP was 117.00 billion yuan, while the per capita GDP was 123,200 yuan. According to government statistics, there were 26 public medical facilities at or above the town level in the district, with 7868 health technicians in 2019. The average numbers of health technicians, professional doctors, and nurses per thousand people in the district were 21.0520, 6.9460, and 8.7440, respectively, at the end of 2019.
The first case of COVID-19 in Haishu District was on 25 January 2020. Thereafter, the cases showed an explosive growth. After the government intervened strongly and introduced effective quarantine measures, the spread of COVID-19 was contained, and was cleared on 2 March 2020. However, as a typical post-epidemic area, the residents in Haishu District are still threatened by imported cases and domestic epidemic outbreak areas. Therefore, health management measures such as “2 + 14” have been introduced. That is, people from counties (cities, districts) with high-risk areas who arrive at Haishu District need to verify a negative COVID-19 test certificate within 2 days (48 h), and have to conduct daily health monitoring for 14 days.
For post-epidemic areas, the primary epidemic prevention task should be to prevent repeated outbreaks from impacting people’s daily lives and the proper functioning of society. Therefore, it is necessary to establish COVID-19 testing facilities with efficient capabilities that cover as many areas as possible, in order to identify unknown infection cases caused by external sources of infection, and to obviate large-scale infection outbreaks.
2.2. Data Source and Processing
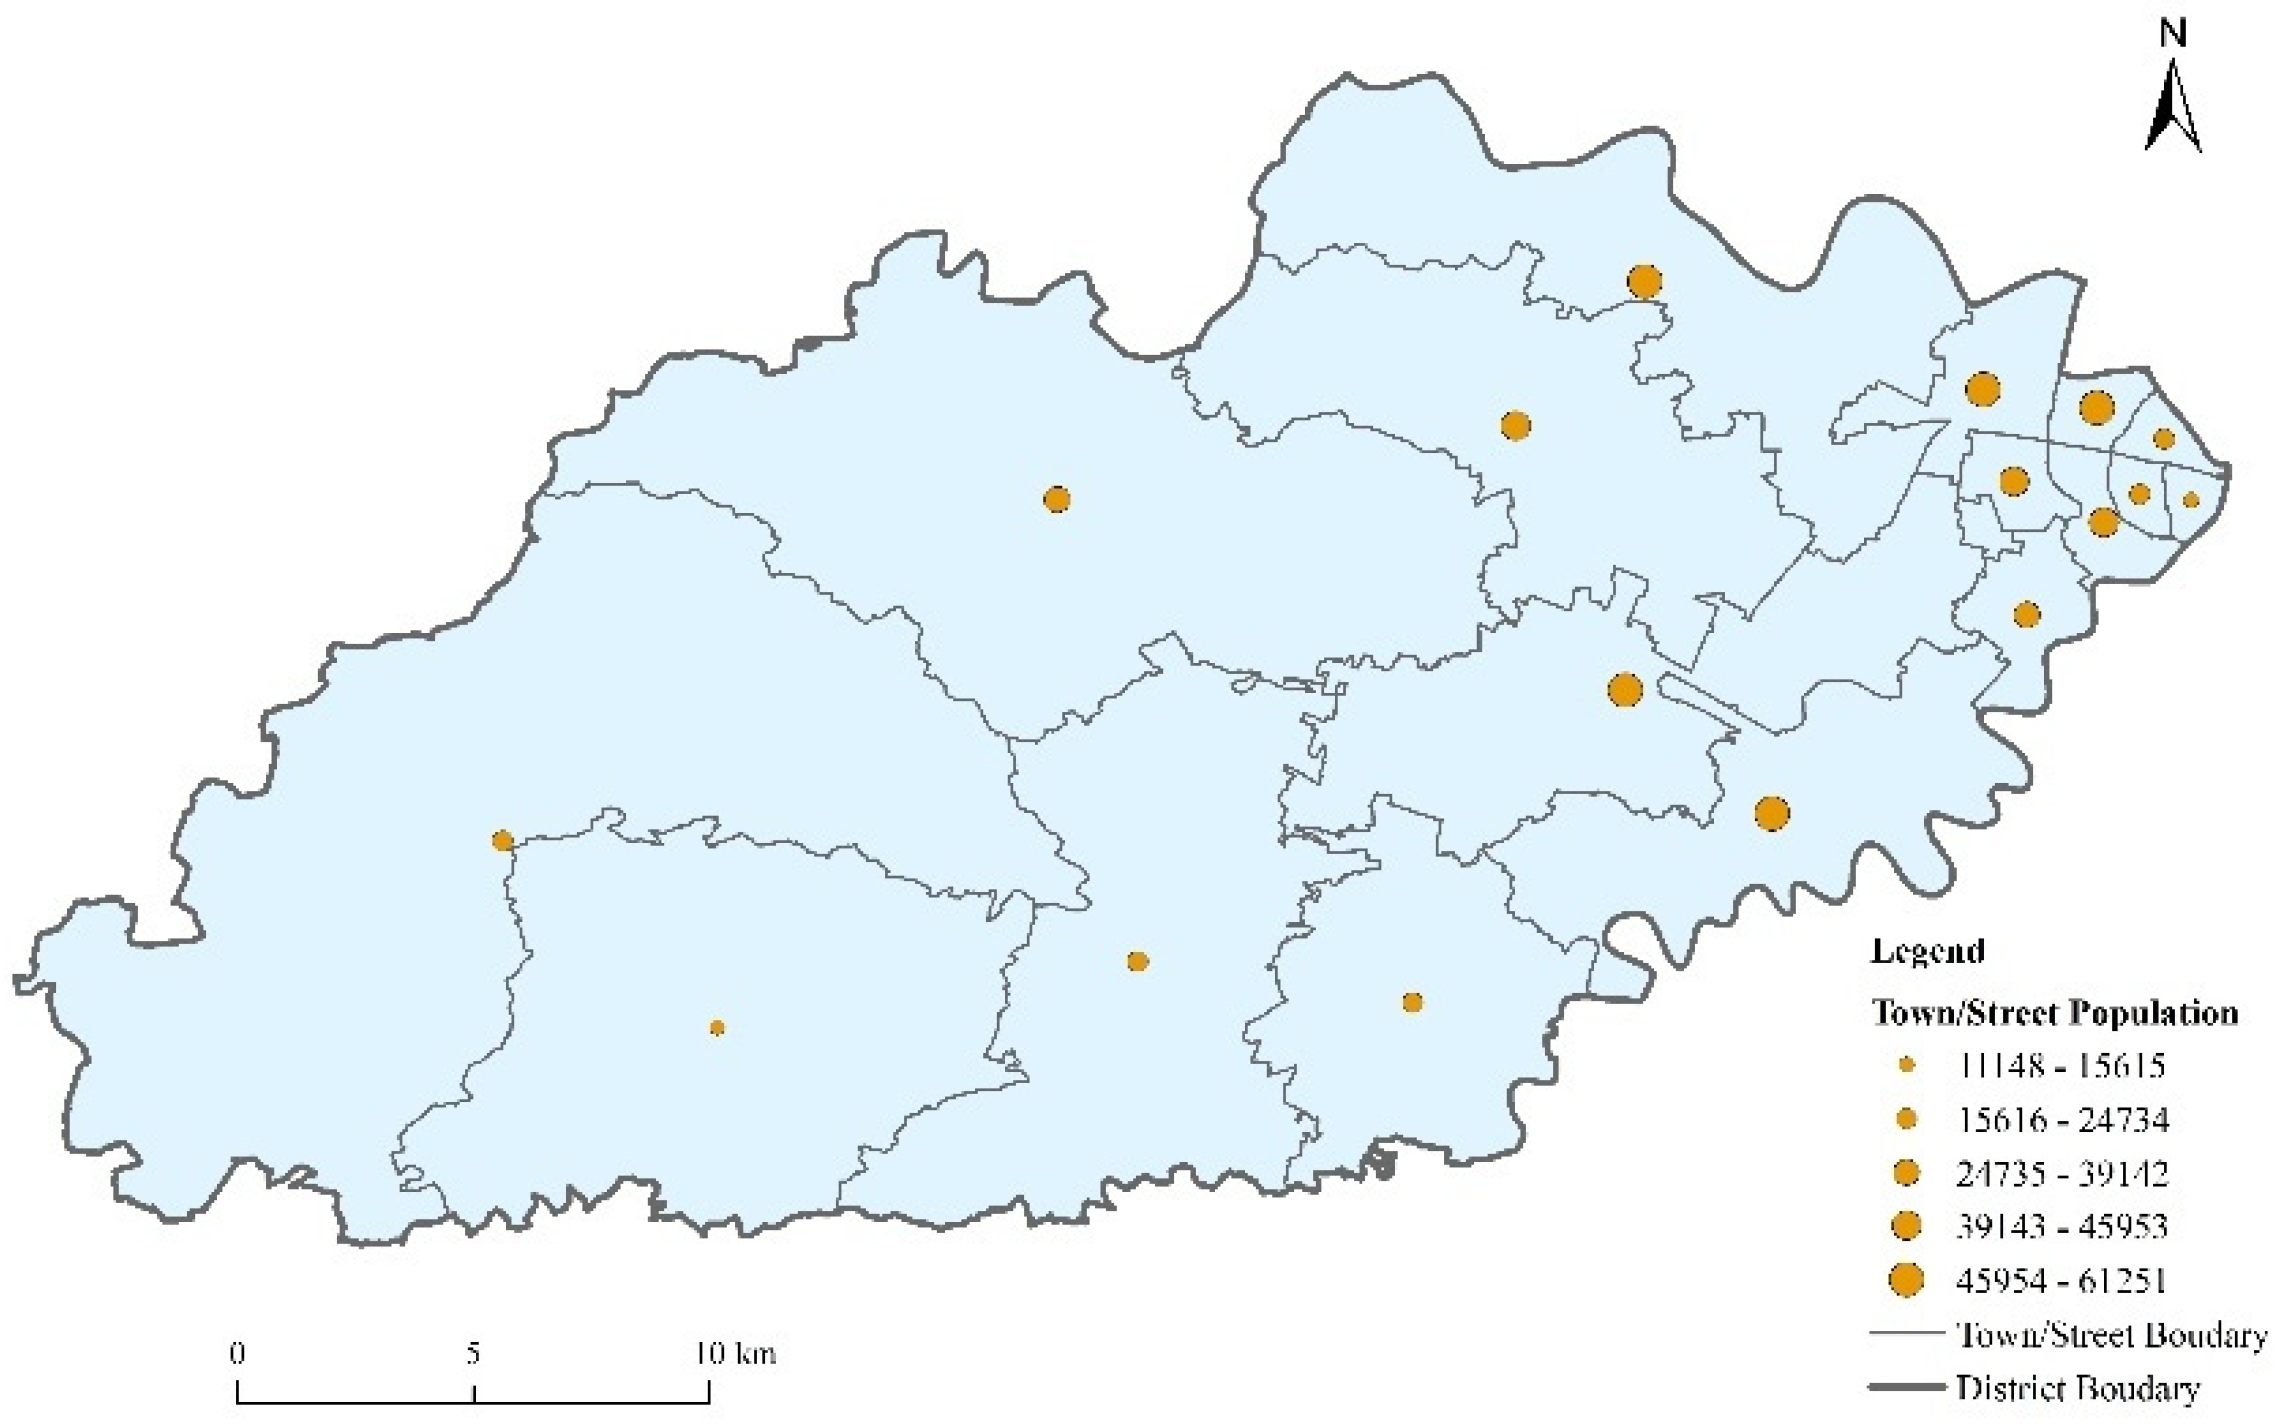
2.2.1. Demographic Data
The numbers and age structure of the town/street population were from
The Haishu District Statistical Yearbook. The locations of the 17 towns/streets were geocoded from the Baidu Map (
https://map.baidu.com/, (accessed on 26 January 2022). The spatial geometry centers of towns/streets were set as the starting points of residents’ test-seeking behavior. The attribute data, mainly including the name of each town/street, and the number and age structure of population were added to each town/street in ArcGIS10.2 (
Figure 2).
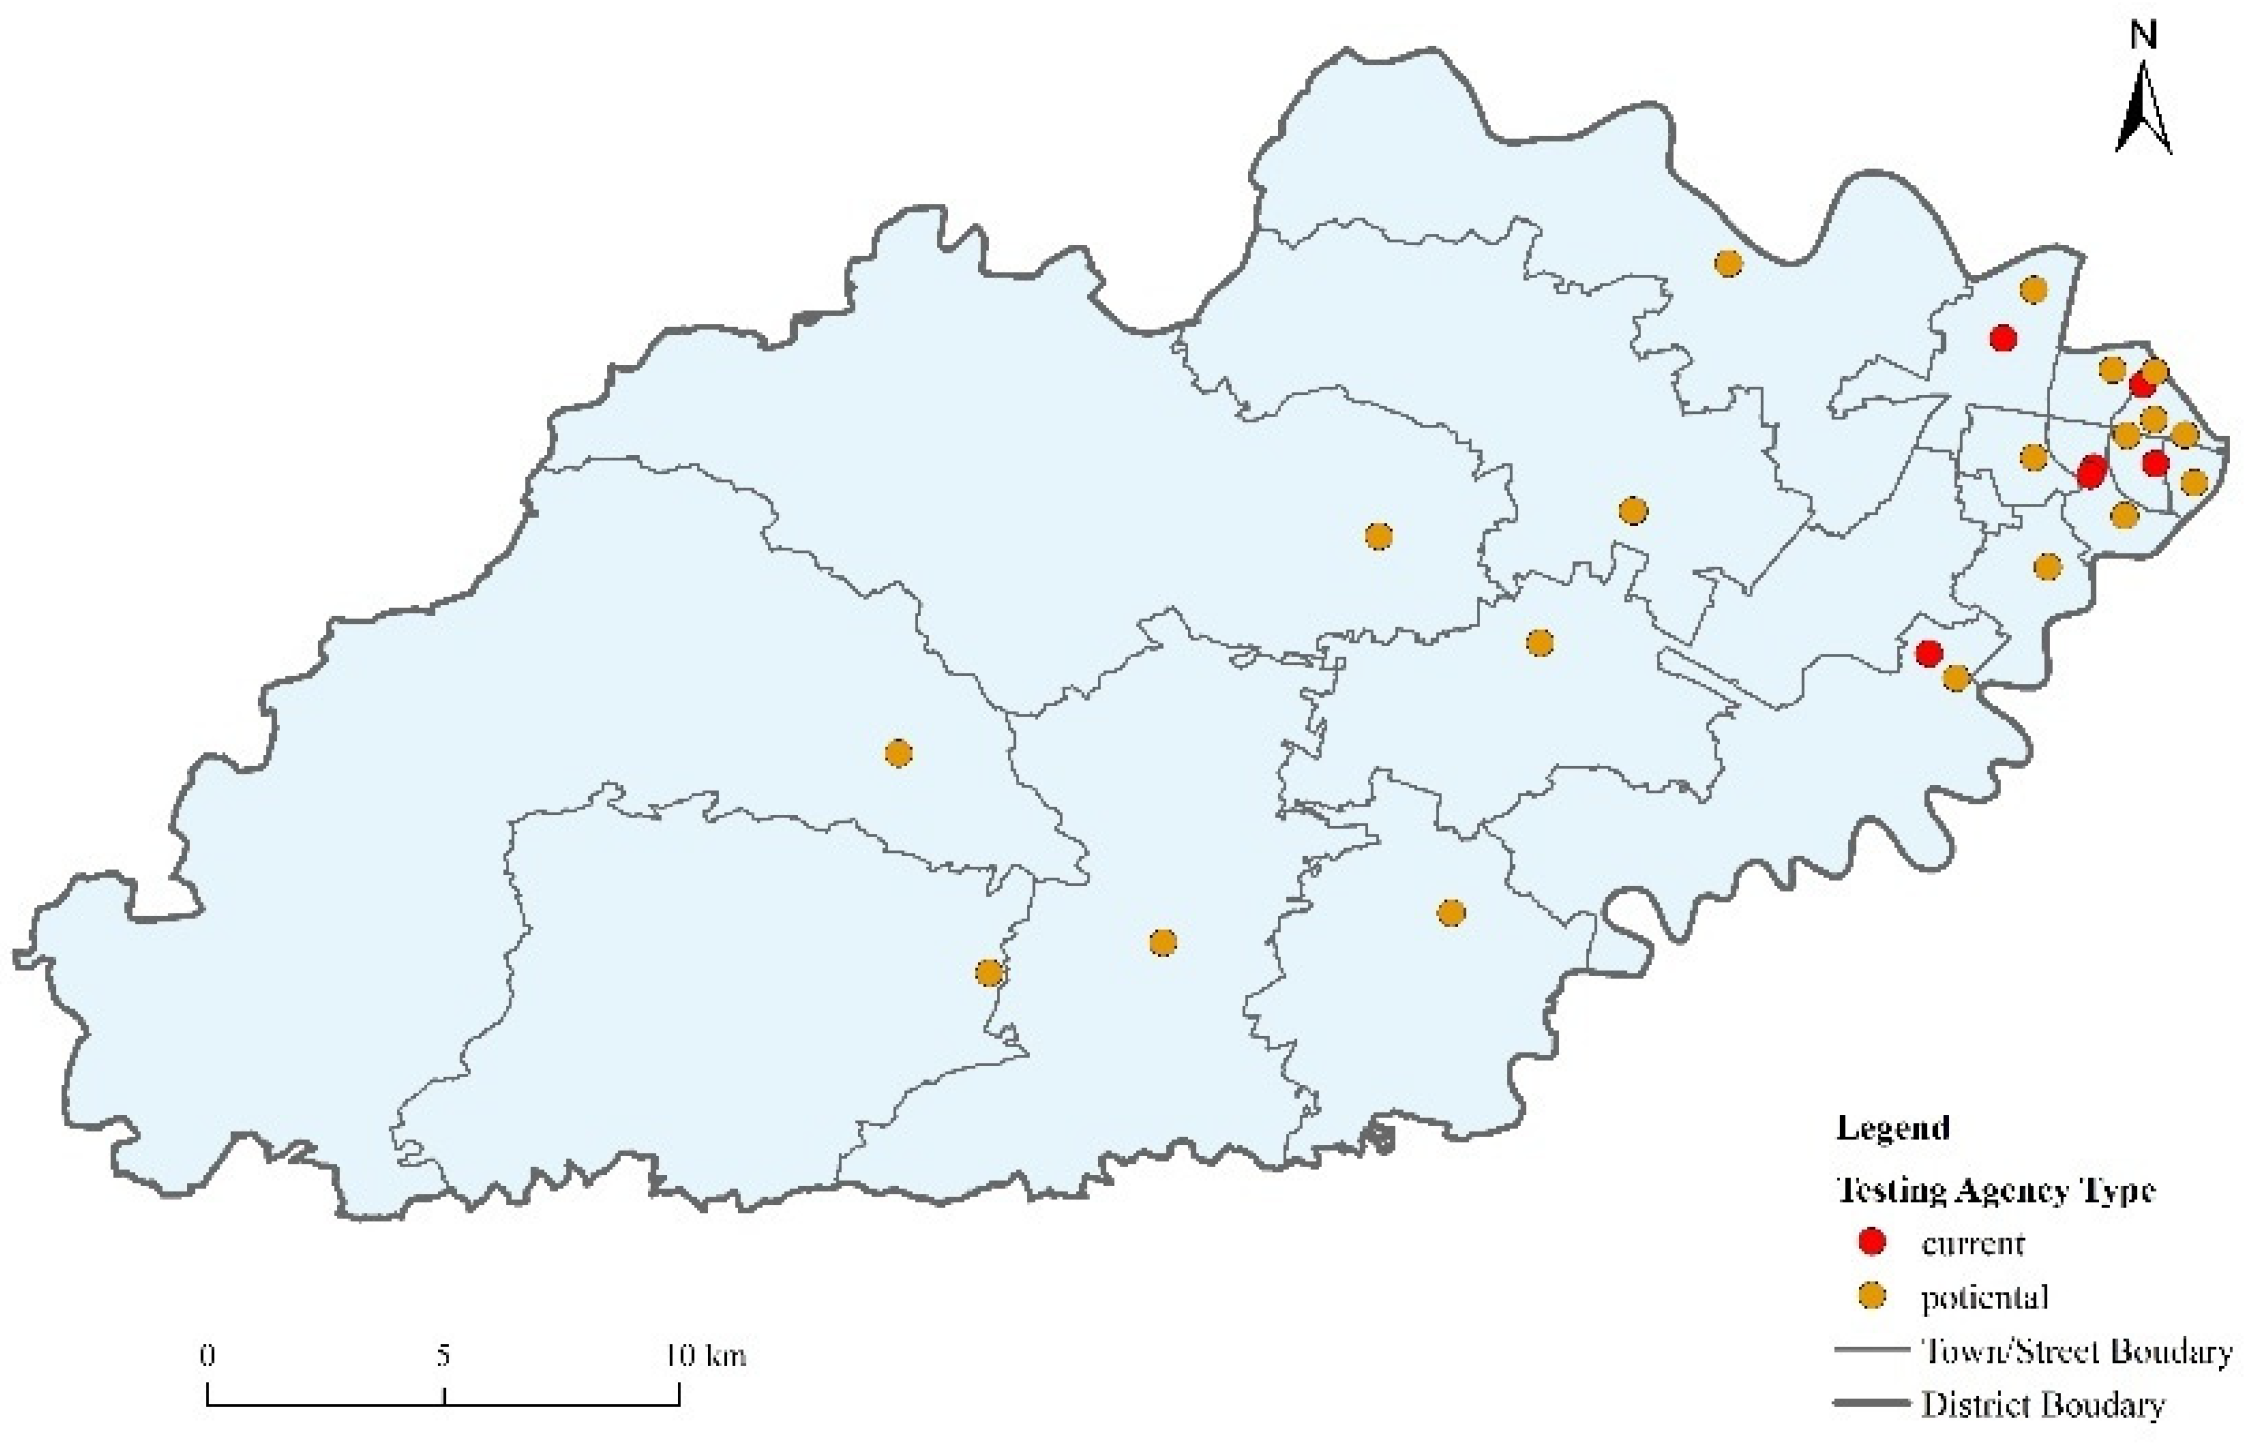
2.2.2. COVID-19 Testing Facilities Data
The list of current COVID-19 testing facilities and potential COVID-19 testing facilities (referring to medical facilities which are unable to provide COVID-19 testing at present) was taken from the
Haishu District Health Statistical Yearbook and related information published by their official websites (
Figure 3). The spatial locations of the testing facilities were from the Baidu Map. The current COVID-19 testing facilities in the Haishu District include the First Hospital of Ningbo City, the Second Hospital of Ningbo City, the Hospital of Traditional Chinese Medicine of Ningbo City, Ningbo Women’s and Children’s Hospital, the Second Hospital of Haishu District, and the Ningbo Port Hospital. The potential testing facilities mainly include town/street health service centers. The layer of the testing facilities was established, and their attributes (mainly their name, hospital type, and number of testing personnel) were added in ArcGIS10.2.
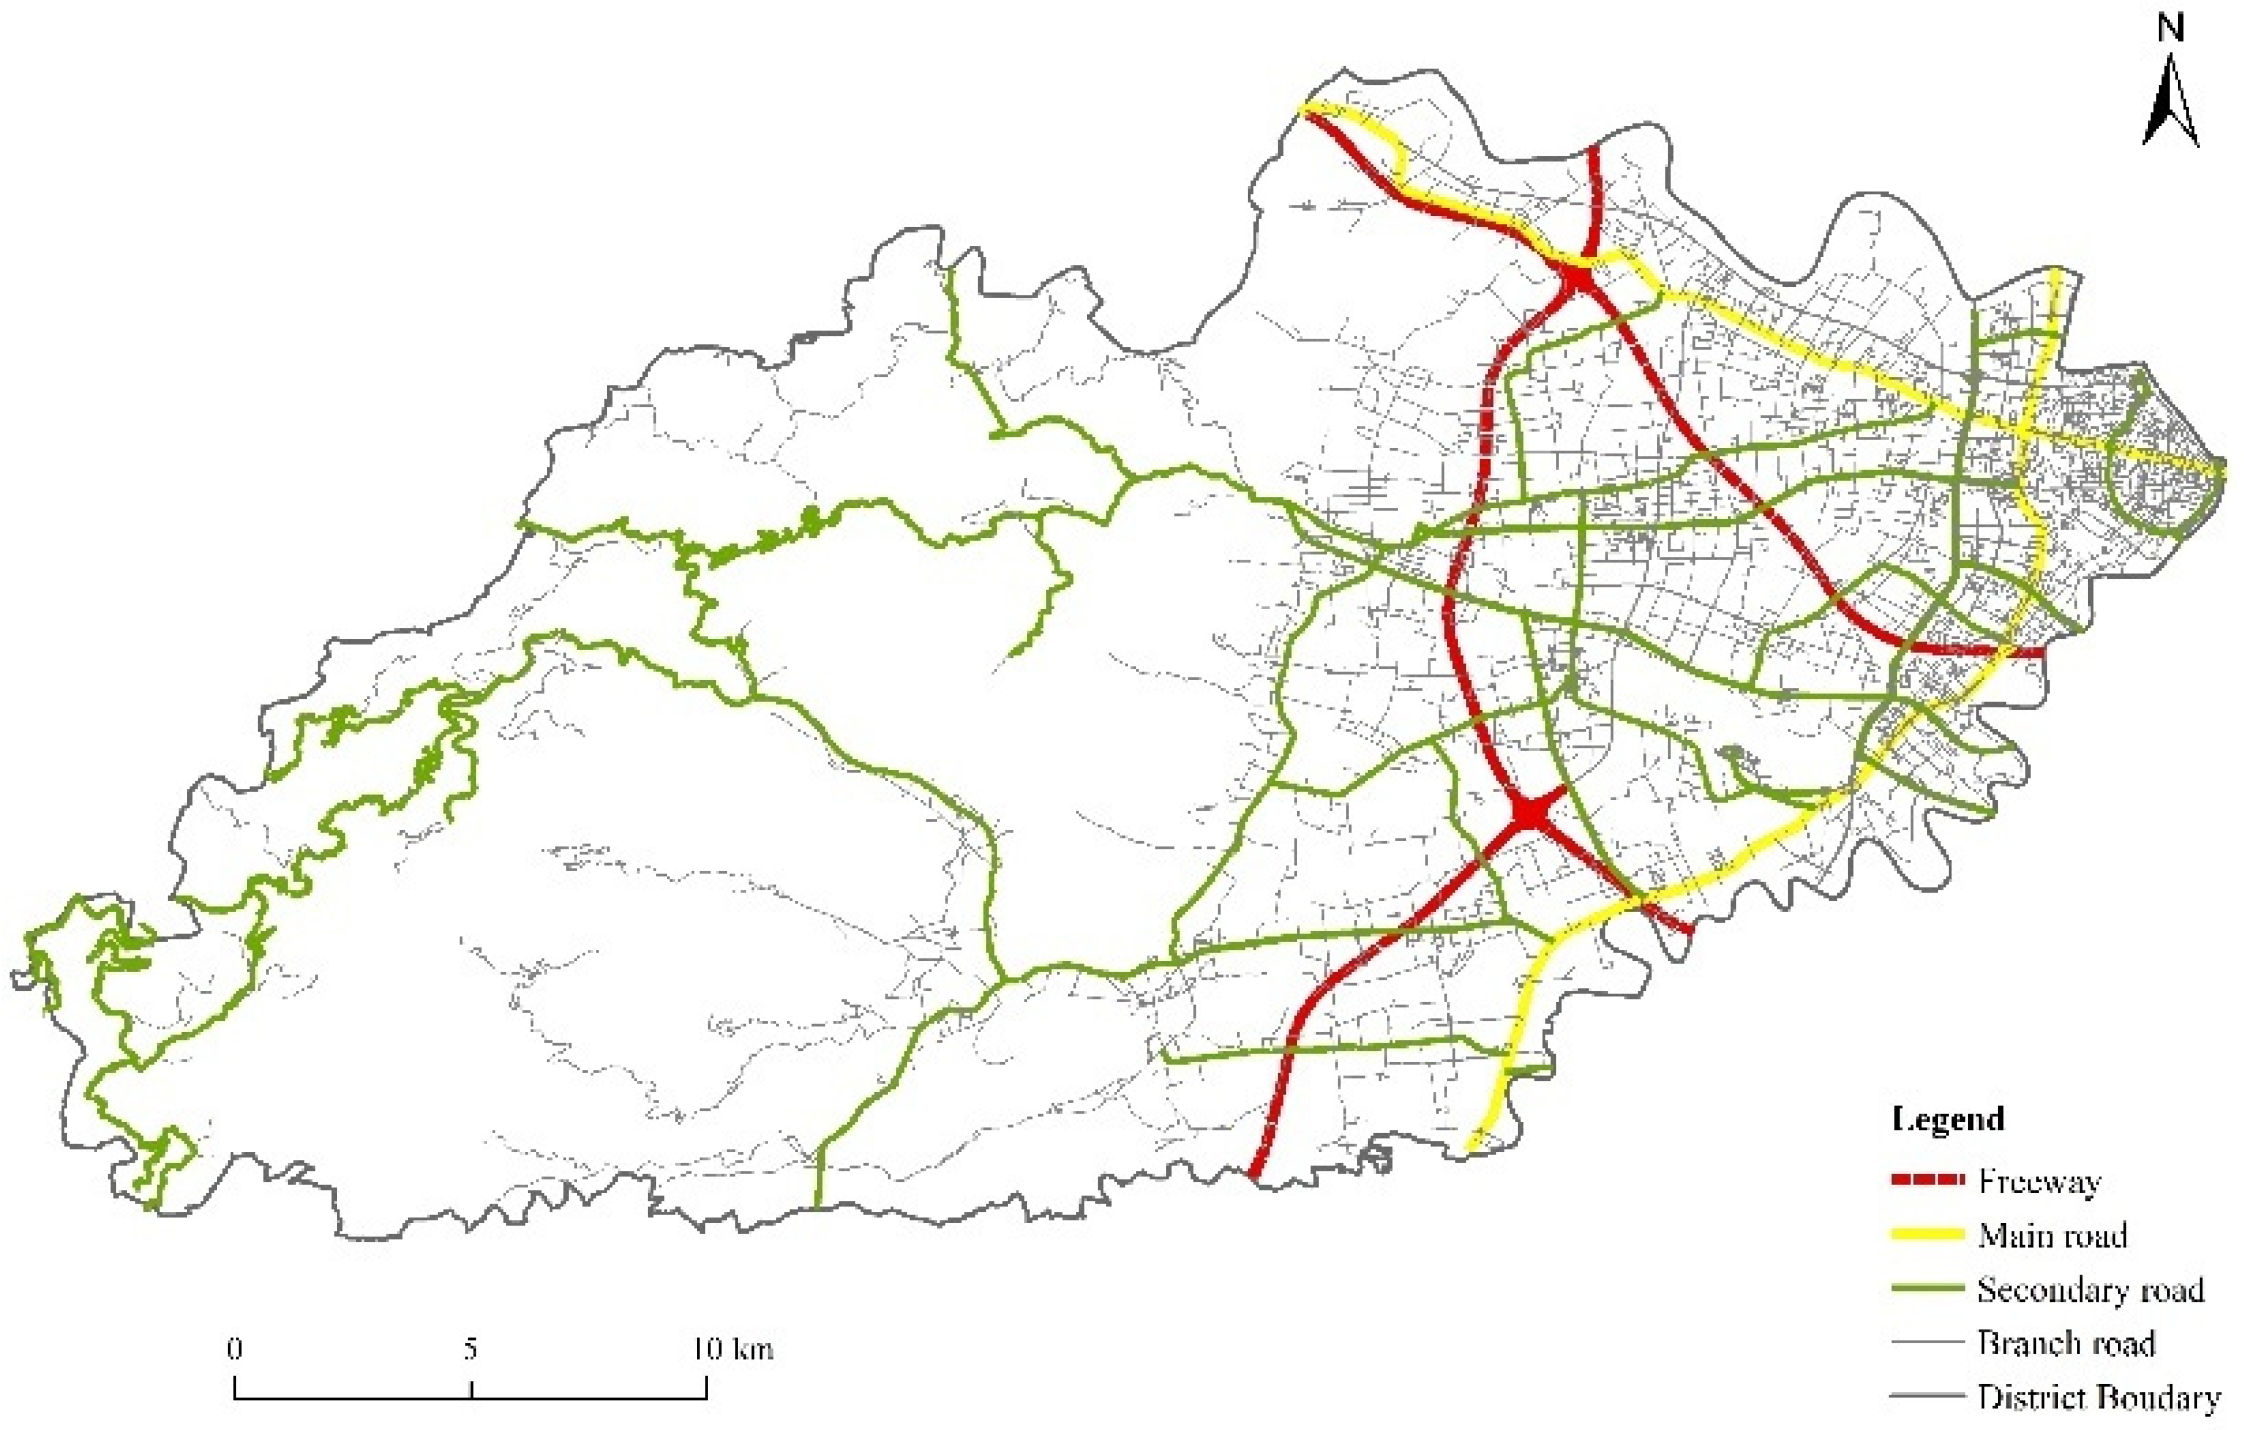
2.2.3. Road Network Data
The road network data were from
The 2019 Ningbo Transportation Network (
Figure 4). The travel impedance of residents should first be defined in order to measure the accessibility of testing facilities. We selected the travel time to testing facilities taken by residents as the travel impedance, which was mainly determined by the spatial distance and the average speed of residents seeking testing. We referred to the
Highway Engineering Technical Standard JIGB01-2014 and the road conditions in Haishu District to determine the speed of the roads at all of the levels in Haishu District (
Table 1).
3. Methodology
The academic circle has paid attention to the accessibility and equity of public facilities for a long time. The nature of accessibility can be referred to as the convenience certain facilities or services, the constraint elements of which not only include the spatial element—such as the path, distance, and traffic mode—but also include nonspatial elements, such as the capability of facility services, resident income, and social status. There are two main research methods to evaluate the accessibility of public facilities. The first is based on the traffic network. The accessibility of facilities is measured by calculating the time cost or economic cost of people getting to public facilities, such as the shortest time distance or the shortest path distance, the results of which are absolute values with three dimensions, and focus more on reflecting the accessibility of facilities under the traffic network, but cannot depict the supply–demand relationship between facilities and residents. The second method is taken from the first law of geography, which assumes that the spatial attraction between residents and facilities decays with distance, and the sum of possible impacts between residents and all other facilities is taken as the accessibility for residents to facilities, such as a potential model. The results consider not only the spatial barrier between the residents and facilities, but also the capability of facilities, which is more comprehensive than the first method [
22,
23]. The equity of facilities often takes into account the demands of different groups on the basis of accessibility, which generally emphasizes that accessibility should fit the demands of different groups, and prioritizes the needs of vulnerable groups (such as the elderly, women, and children) [
24,
25]. The COVID-19 testing facilities are usually attached to medical facilities, which can be taken as a kind of public facility; their distribution rationality can be discussed under the research framework of the accessibility and equity of public facilities.
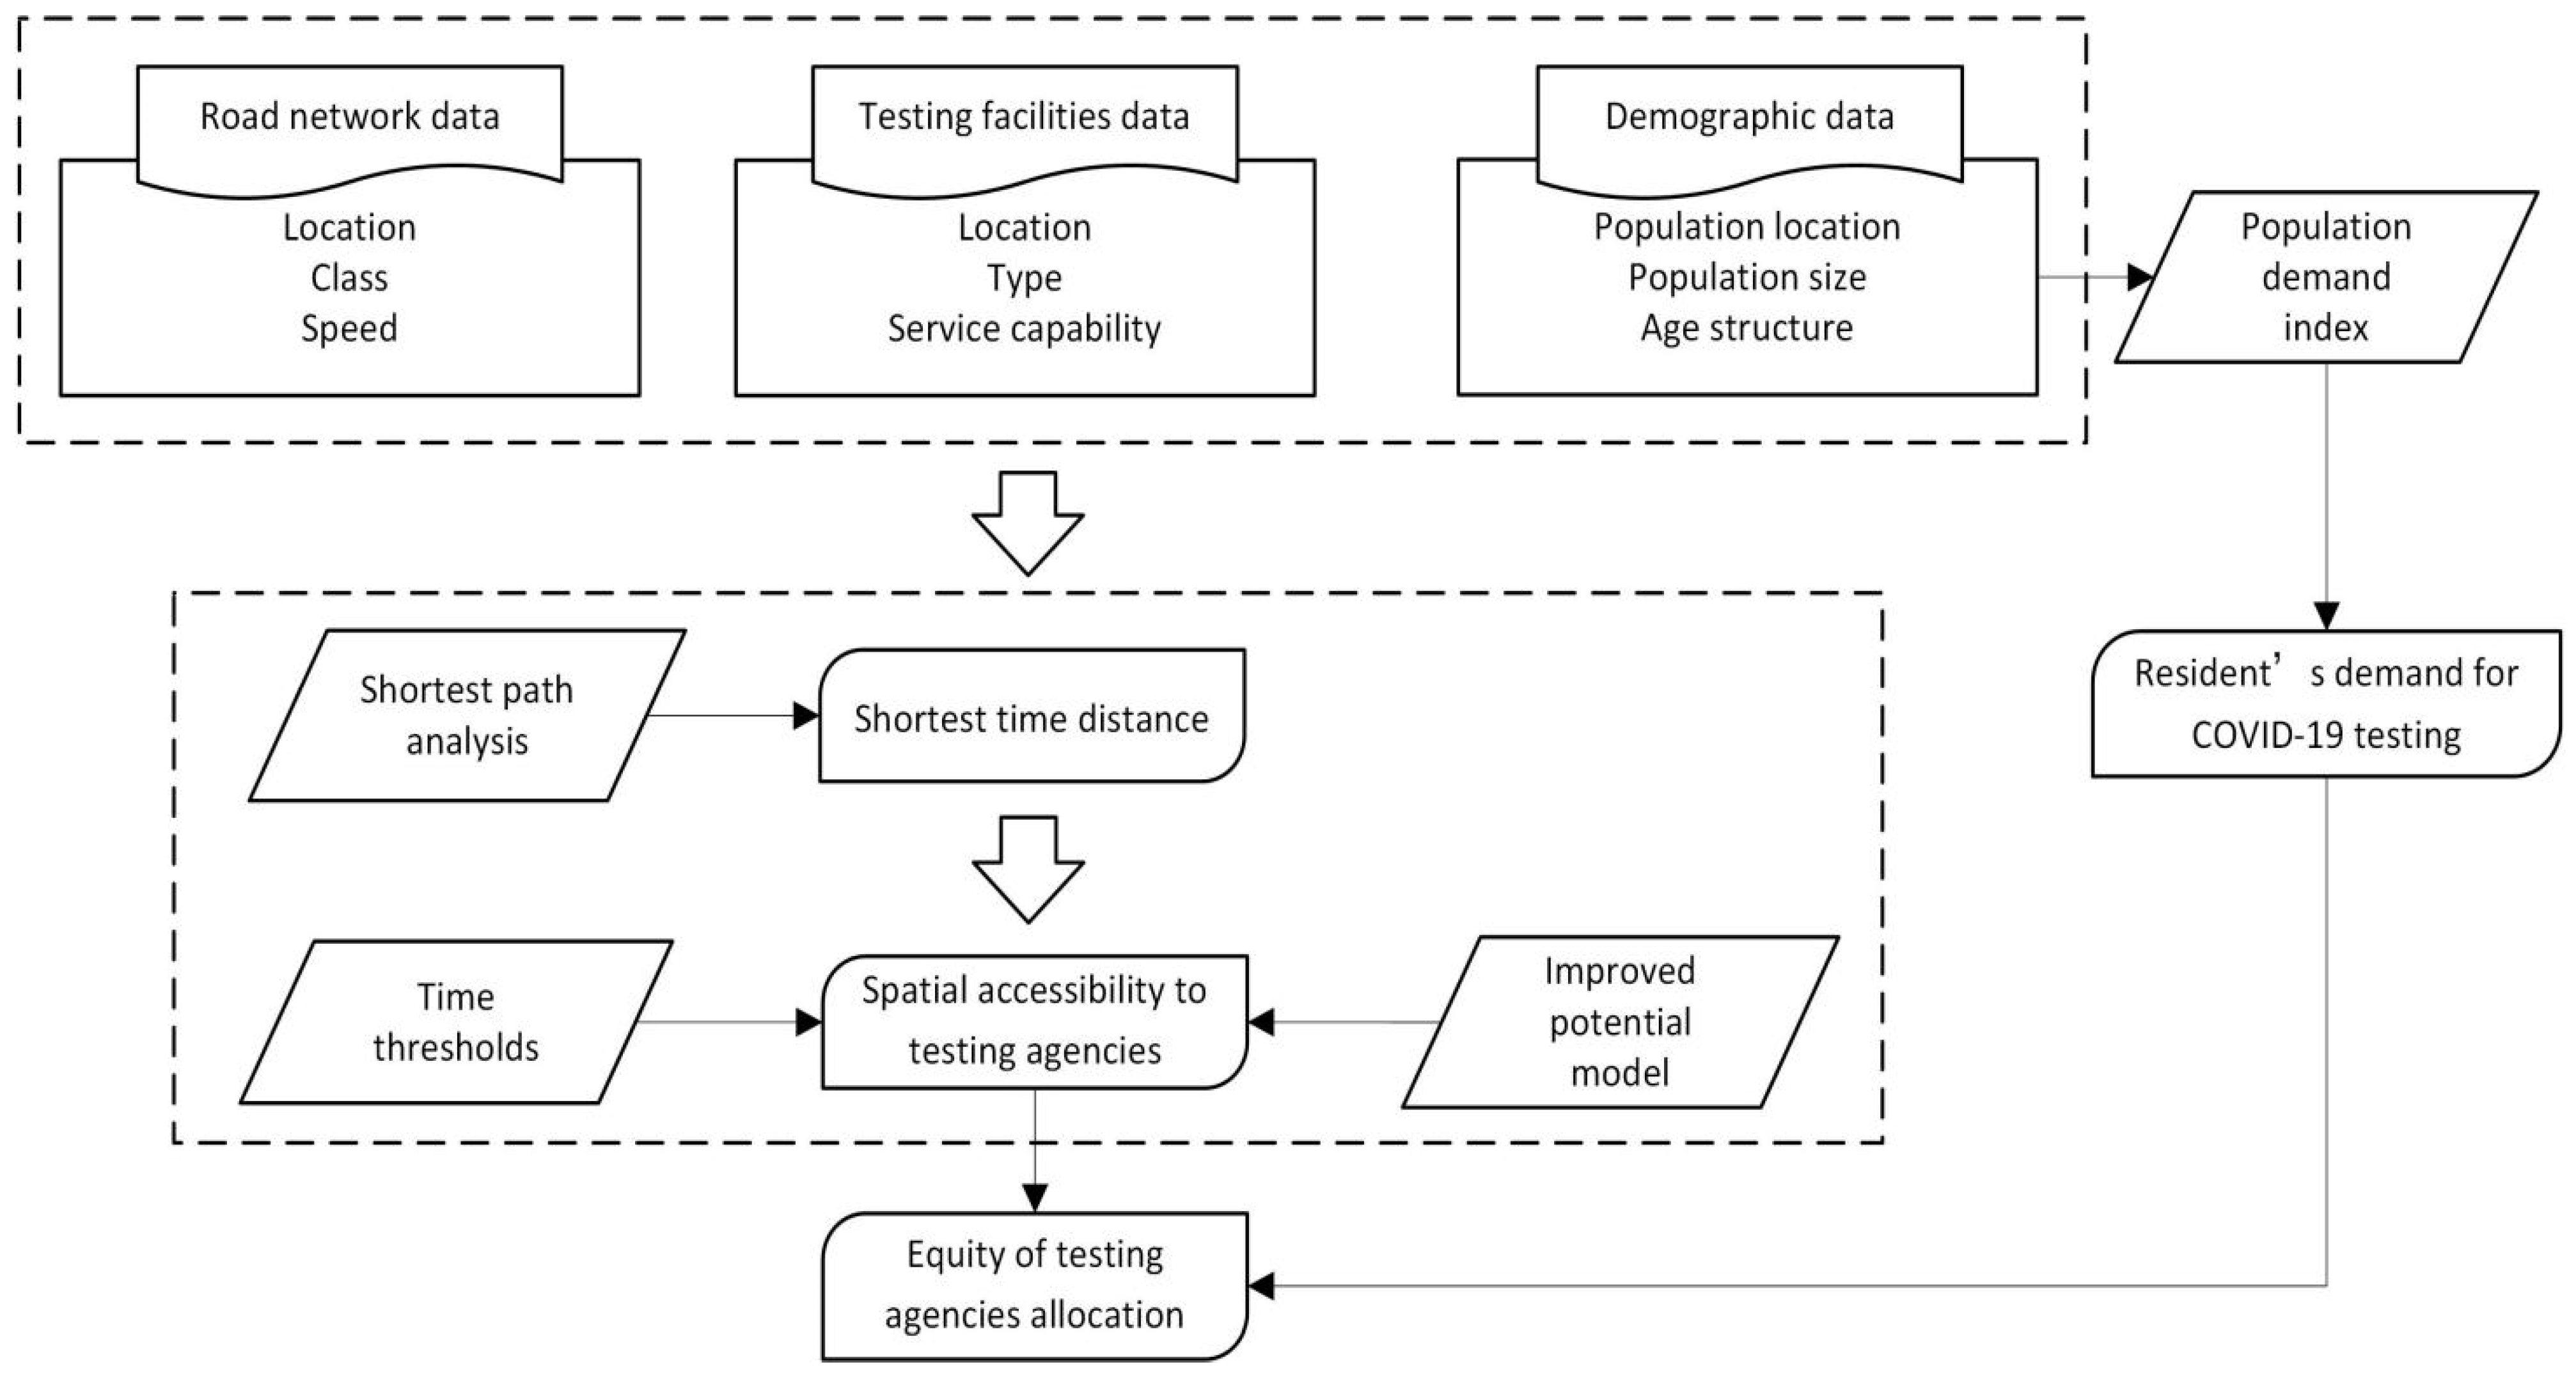
3.1. Study Design
Based on the improved potential model for accessibility analysis and evaluation, this research constructed a population demand index to analyze residents’ demand for testing facilities in order to comprehensively measure the equal accessibility to COVID-19testing facilities (
Figure 5). Firstly, according to the characteristics of the traffic, population and testing facilities in the Haishu District, the shortest-path analysis method was used to calculate the nearest current and potential COVID-19 testing facilities, which indicated whether individuals could have timely access to the nearest testing facilities. Moreover, according to the characteristics, grades, and categories of the testing facilities in Haishu District, the improved potential model calculated the accessibility to current and potential COVID-19 testing facilities in Haishu District, and analyzed their spatial patterns. Finally, combined results of the accessibility to current and potential COVID-19 testing facilities with the residents’ demand index, the equity of the current and potential COVID-19 testing facility allocation was explored in Haishu District.
3.2. Measuring the Shortest Time Cost to COVID-19 Testing Facilities
Based on the traffic network data of Haishu District, shortest-path analysis was used in ArcGIS10.2 to calculate the shortest time cost from each town/street to the nearest current and potential COVID-19 testing facilities. The key to the calculation of the shortest time cost was the setting of the connectivity cost. Referring to the
Highway Engineering Technical Standard JTG. B01-2014, the speed of the road was set at all of the levels in the study area, as shown in
Table 1.
3.3. Measuring the Comprehensive Accessibility of COVID-19 Testing Facilities Using an Improved Potential Model
The accessibility of testing facilities refers to the convenience for residents seeking testing through all means of transportation and roads, which can accurately reflect the actual circumstances of residents’ access to testing facilities. Therefore, accessibility is an appropriate indicator for the evaluation of the rationality of testing facility allocation. Accessibility is influenced by factors such as the supply of testing facilities and the status of the transportation networks in the study area. Our evaluation method, based on the improved potential model, thoroughly considers both the supply and demand of testing facilities and distance factors, which can be used to comprehensively evaluate the spatial accessibility of current and potential COVID-19 testing facilities. The proposed potential model is derived from Newton’s theory of gravitational force, which can calculate the cumulative value of the attraction between public facilities and residents by simulating the gravitational formula. Geographers introduced Newton’s formula into the field of geography and gradually developed it into the potential model, using it as a spatial accessibility measure for various public facilities.
The general formula of the potential model is
The general formula of the potential model considers the service capacity
Mj of the testing facility, and the spatial and temporal variable
Dij of the supply and demand, but ignores the competition behavior of different residents when they use the limited services of the same testing facility. In other words, if the service capacity of some testing facilities is the same, and the spatial and temporal variable
Dij is also the same, but the total number of residents served by these facilities is totally different, the results of the general potential model show that the accessibility of the testing facilities is the same, but in fact it is obviously different. Therefore, Wang Fahui [
26] improved the general formula of the potential model and added a population size influencing factor
Vj to it.
Pk is used to represent the population of settlement
K, and the improved formula is expressed as follows:
Although Formula (2) considers the competition of residents for limited medical resources, it ignores the influence of different grades and scales of testing facilities on residents’ testing choices. In reality, testing facilities of different grades and scales have different levels of attractiveness for residents. High-grade testing facilities may be of a large scale and have a strong technical capability, which can usually attract residents from a long distance. Low-grade testing facilities, on the other hand, are relatively small in scale and weak in technical strength.
It is believed that the impact of the scale of testing facilities on residents’ choices can be reflected by the limited travel distance or time. We use
Dj to reflect this limited travel time, which varies based on the scale, grade, and service capacities of testing facilities. The larger and higher the scale, grade, and service capacity of the testing facilities, the higher the
Dj value will be. Moreover, the smaller the differences between
Dij from the ith town/street to the jth testing facility and the limit of travel time
Dj are, the greater the impact of the attributes of testing facilities on residents’ choices. When
Dij exceeds
Dj, residents of the ith town/street will no longer seek testing services from the jth testing facility. Therefore, the formula of the potential model can be further improved as follows:
Among them,
Ai represents the accessibility index of a particular town/street;
Mj represents the service capacity of the jth testing facility, with the number of testing personnel in a hospital being used as its service capacity in this paper;
Dij represents the path distance between the ith town/street center and the jth facility;
Vj represents the potential service population index value around the jth testing facility, reflecting the competition for limited testing resources formed by people visiting the same facility; and
Sij represents the grade-scale influence coefficient of the jth testing facility on the ith town/street, reflecting the influence of testing facilities in different grades and scales on residents’ choices of medical treatment (
Vj and
Sij parameters are added to the improved potential model). If
Dij ≥
Dj, then
Sij ≤ 0, which means that the jth testing facility is not attractive to residents in the ith town/street, and all of the negative values of
Sij are set to 0 in the calculation.
Pk represents the population of the kth town/street;
β represents the impedance coefficient, which we set as 2 based on previous research [
27,
28]; and
Dj represents the maximal travel time of the jth testing facility; in order to ensure that residents in each town/street can at least get to a testing facility, we set the
Dj to 57 min (current COVID-19 testing facilities) and 29 min (potential COVID-19 testing facilities) according to the shortest-path analysis.
3.4. Equity Evaluation Methods of Testing Facilities
3.4.1. Population Demand Index
The equity of public facilities refers to the rationality of the spatial distribution of public facilities considering different populations’ demands, the main impact factors of which are accessibility. Previous studies on the equity of public facilities showed that the demand index is widely used in the equity of public service facility allocation, such as for parks and schools [
29,
30]. The spatial allocation of public facilities must take women, children, the elderly, the disabled, the impoverished, and other vulnerable groups into account, giving people of different classes access to services as equally as possible [
31]. Previous studies have shown that COVID-19 has a higher mortality rate in the elderly and people with pre-existing underlying diseases and conditions [
32,
33,
34]. Therefore, we chose the total population and the proportion of the population over 60 years old as two indicators to comprehensively assess residents’ demands for COVID-19 testing. The indicators were normalized by the range normalization method, and the normalized results with equal weights were then calculated in order to obtain the population demand index.
The population demand index is computed using the equation below:
In the formula, Si represents the population demand index of the ith town/street; Wj is the weight of the jth index, which was set as 0.5; Xij represents the value of the jth index of the ith town/street; and Xjmax represents the maximum value of the jth index.
3.4.2. Equity Evaluation
Spatial overlay analysis refers to the overlaying of two or more maps to generate a new layer with their overall attributes. In order to evaluate the equity of the testing facility distribution at the town/street level, the accessibility of current and potential COVID-19 testing facilities and testing demand were divided into two categories using the quantile method, and were overlapped to evaluate the equity of the spatial distribution of testing facilities. The unequal conditions of the current testing facility allocation include the following two circumstances: one is towns/streets with high accessibility to testing facilities but low testing demand, which can cause medical resources to idle and become waste, and the other is towns/streets with low accessibility to testing facilities but high testing demand, which makes it difficult for residents’ basic testing needs to be guaranteed.
4. Results
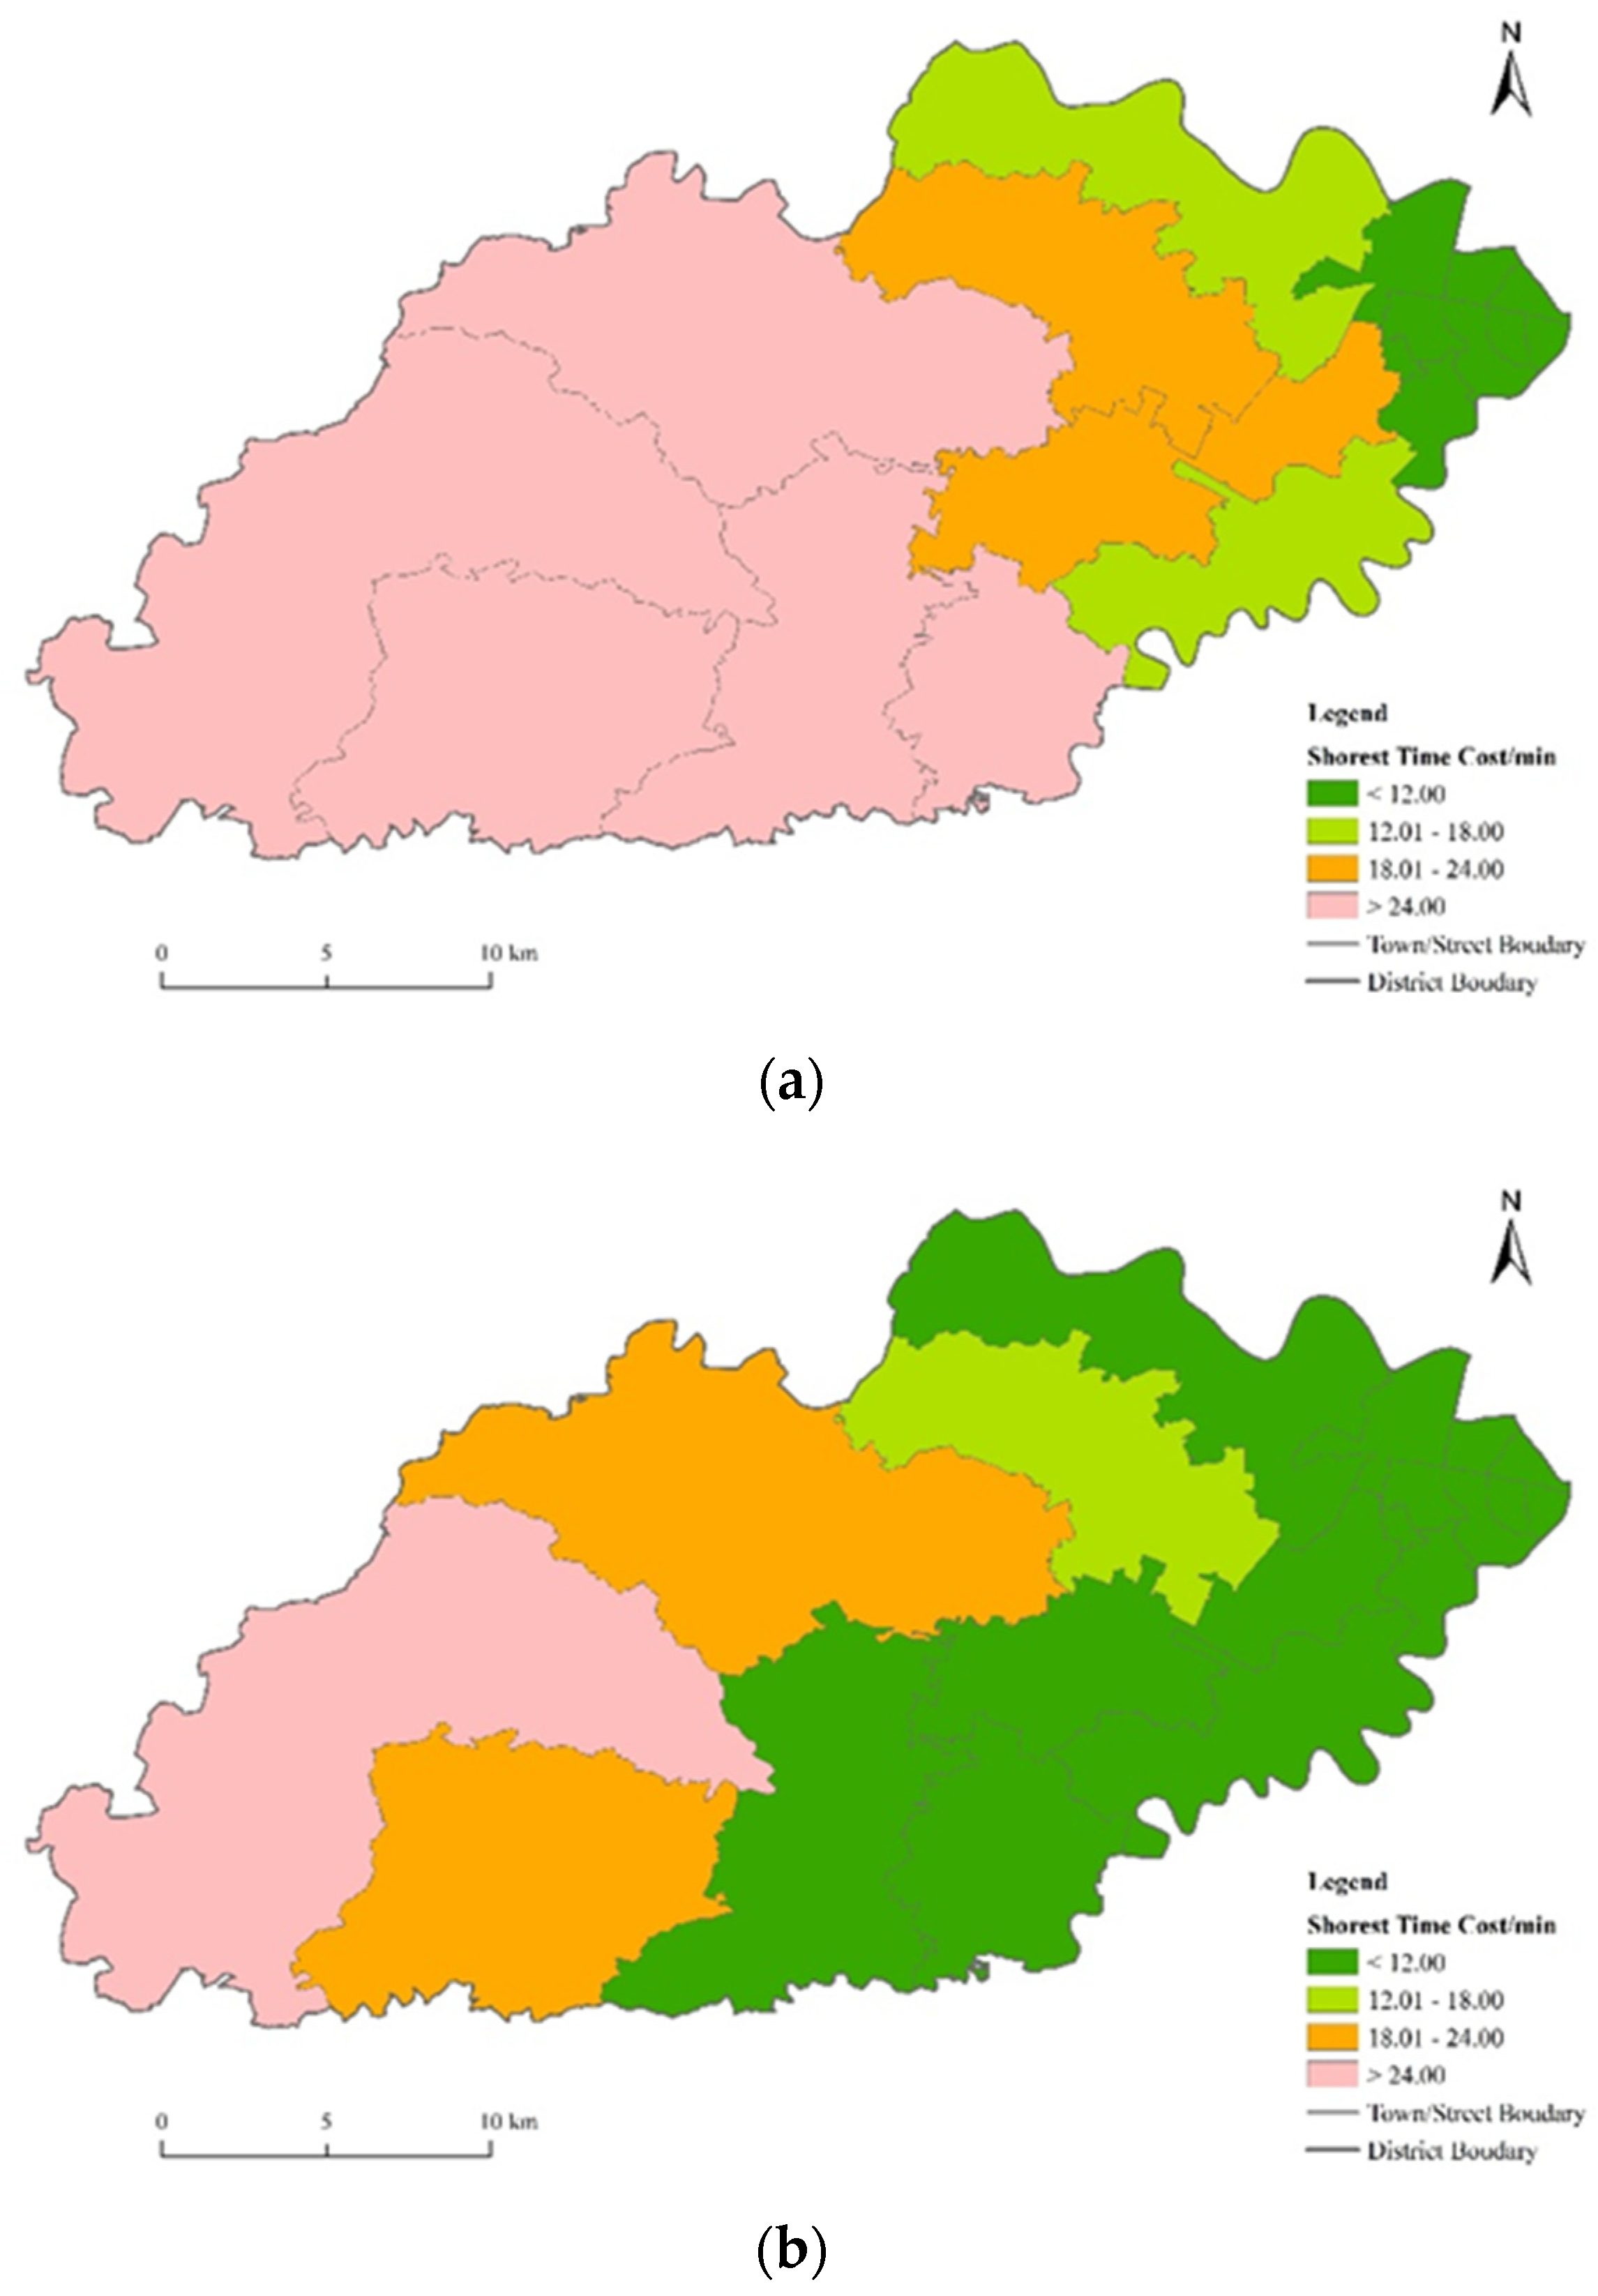
4.1. Shortest-Path Analysis
The shortest-path analysis was used in ArcGIS10.2 to measure the shortest time cost from each town/street to current COVID-19 testing facilities.
Figure 6 is a visual expression of the calculated results of the shortest-path analysis.
Figure 6a shows that the most convenient areas from which to get to current COVID-19 testing facilities are mainly distributed in the downtown area with the most developed infrastructure. Accessibility decreased from downtown areas to rural areas, and the average time for residents to reach the nearest current COVID-19 testing facilities was 18.75 min. Residents in Yuehu Street can reach the nearest current COVID-19 testing facilities in 6.64 min, and thus have the easiest access to current COVID-19 testing; conversely, residents in Zhangshui Town, where accesses to current COVID-19 testing facilities is the poorest, take 44.46 min to get to the nearest current COVID-19 testing facilities. The shortest travel time difference between the two towns/streets reached 37.82 min, which suggested a large difference in the temporal accessibility of testing facilities in Haishu District at the town/street level. In addition, the main traffic roads had a certain influence on the shortest travel time, and expressways and main roads gave the downtown area (Gulou, Ximen, Nanmen, and Yuehu streets) higher accessibility to testing facilities than other areas. However, after taking full advantage ofpotentialCOVID-19 testing facilities, the convenience for residents to obtain COVID-19 testing was significantly improved. The average time for residents to reach the nearest potential COVID-19 testing facility was 10.97 min, with a reduction of time of 41.49%, and the positive effect in towns/streets in the central research area was the greatest. Furthermore, the longest time taken to get to a COVID-19 testing facility was also reduced to 28.11 min.
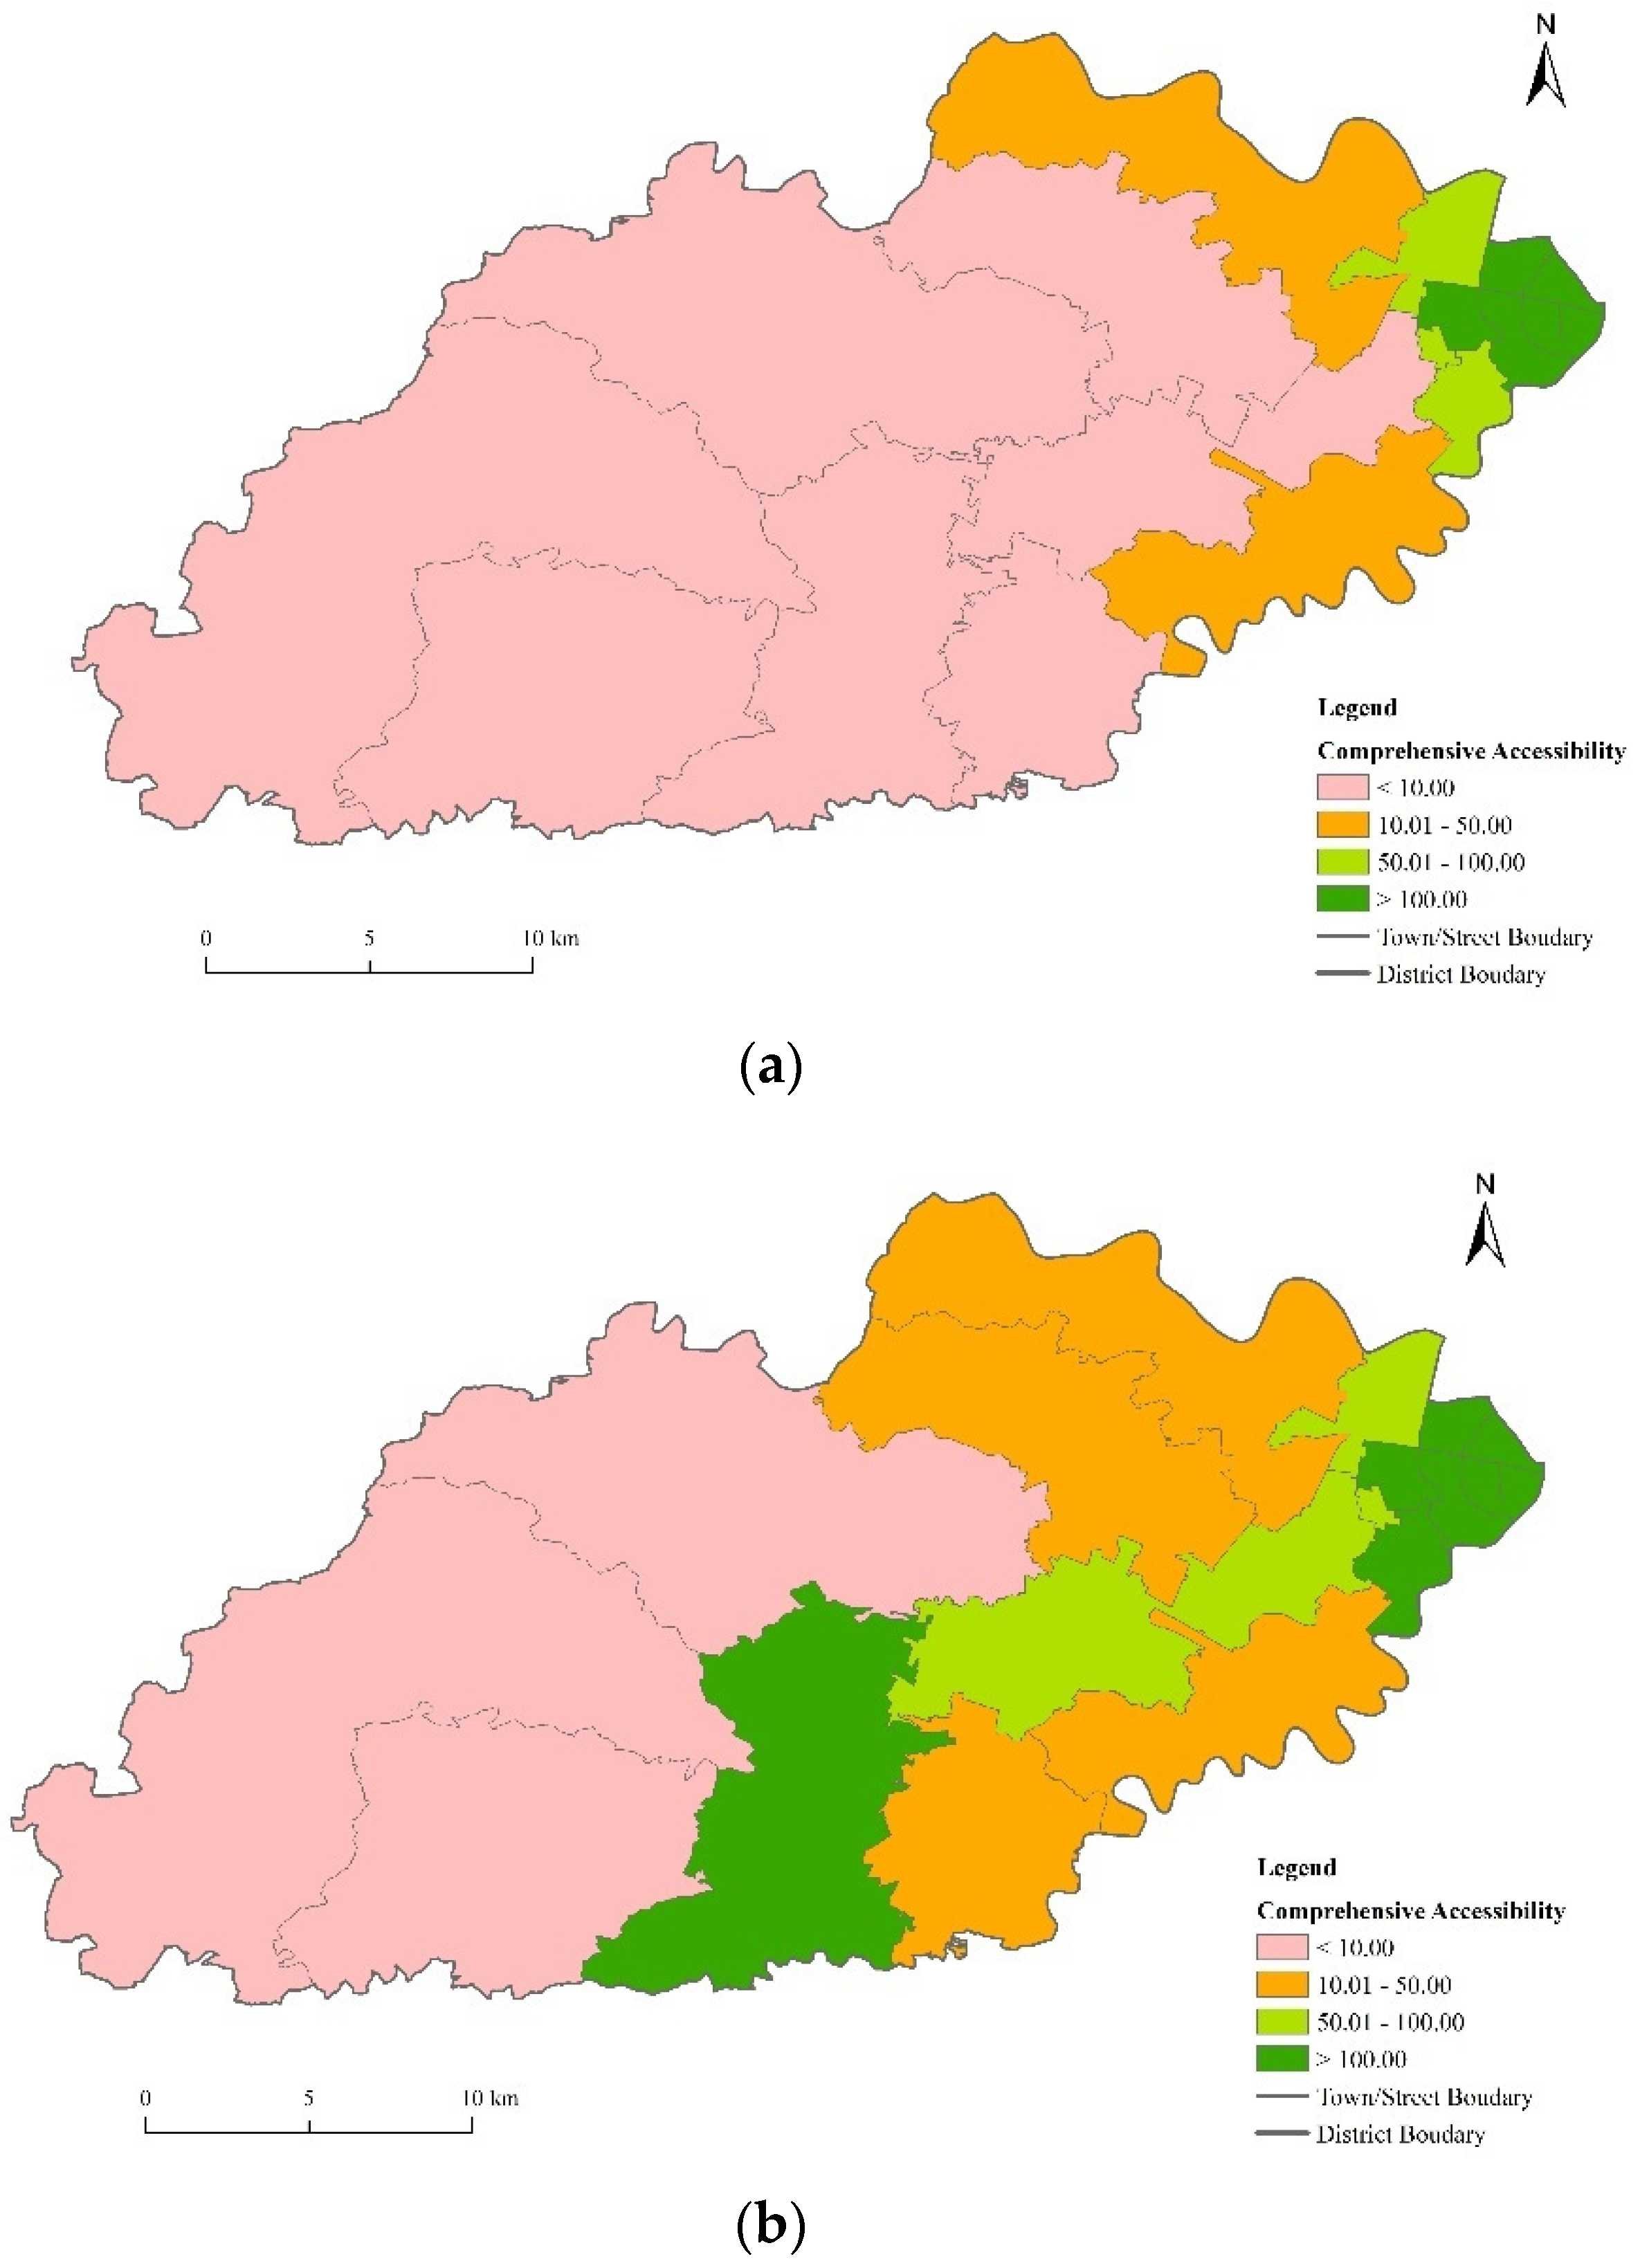
4.2. Comprehensive Accessibility of Testing Facilities
Summation and other functions in ArcGIS10.2 were used to calculate the comprehensive accessibility of each town/street to the testing facilities (
Figure 7).
Figure 7a shows that the comprehensive accessibility of current COVID-19 testing facilities is not evenly distributed in Haishu District. Towns/streets in the downtown area had easier access to current COVID-19 testing due to convenient transportation, while towns/streets in the rural towns/streets were hard to reach testing facilities due to their poorer public transportation and longer distance. Comprehensive access to current COVID-19 testing facilities gradually decreased from the east of Haishu District to the center, north, and south. The variable coefficient of comprehensive accessibility reached 1.25, which was much higher than the 0.73 of the shortest time. This showed that the current COVID-19 testing facilities in Haishu District are unevenly distributed not only in space but also in the distribution of COVID-19 testing staff. After taking full advantage of potential COVID-19 testing facilities, the average comprehensive accessibility increased from 117.75 to 152.97, which is an increase of 29.91%. Among 17 streets in the Haishu District, the accessibility to Yinjiang Town, Jiangxia Street, Gulou Street, and Duantang Street had the maximum increase. In addition, the variation coefficient of comprehensive accessibility was also significantly reduced from 1.57 to 1.25, indicating that this measure was conducive to the reduction of the spatial difference in the accessibility of COVID-19 testing facilities and the improvement of the rationality of their allocation.
4.3. Equity Analysis of the Testing Facilities
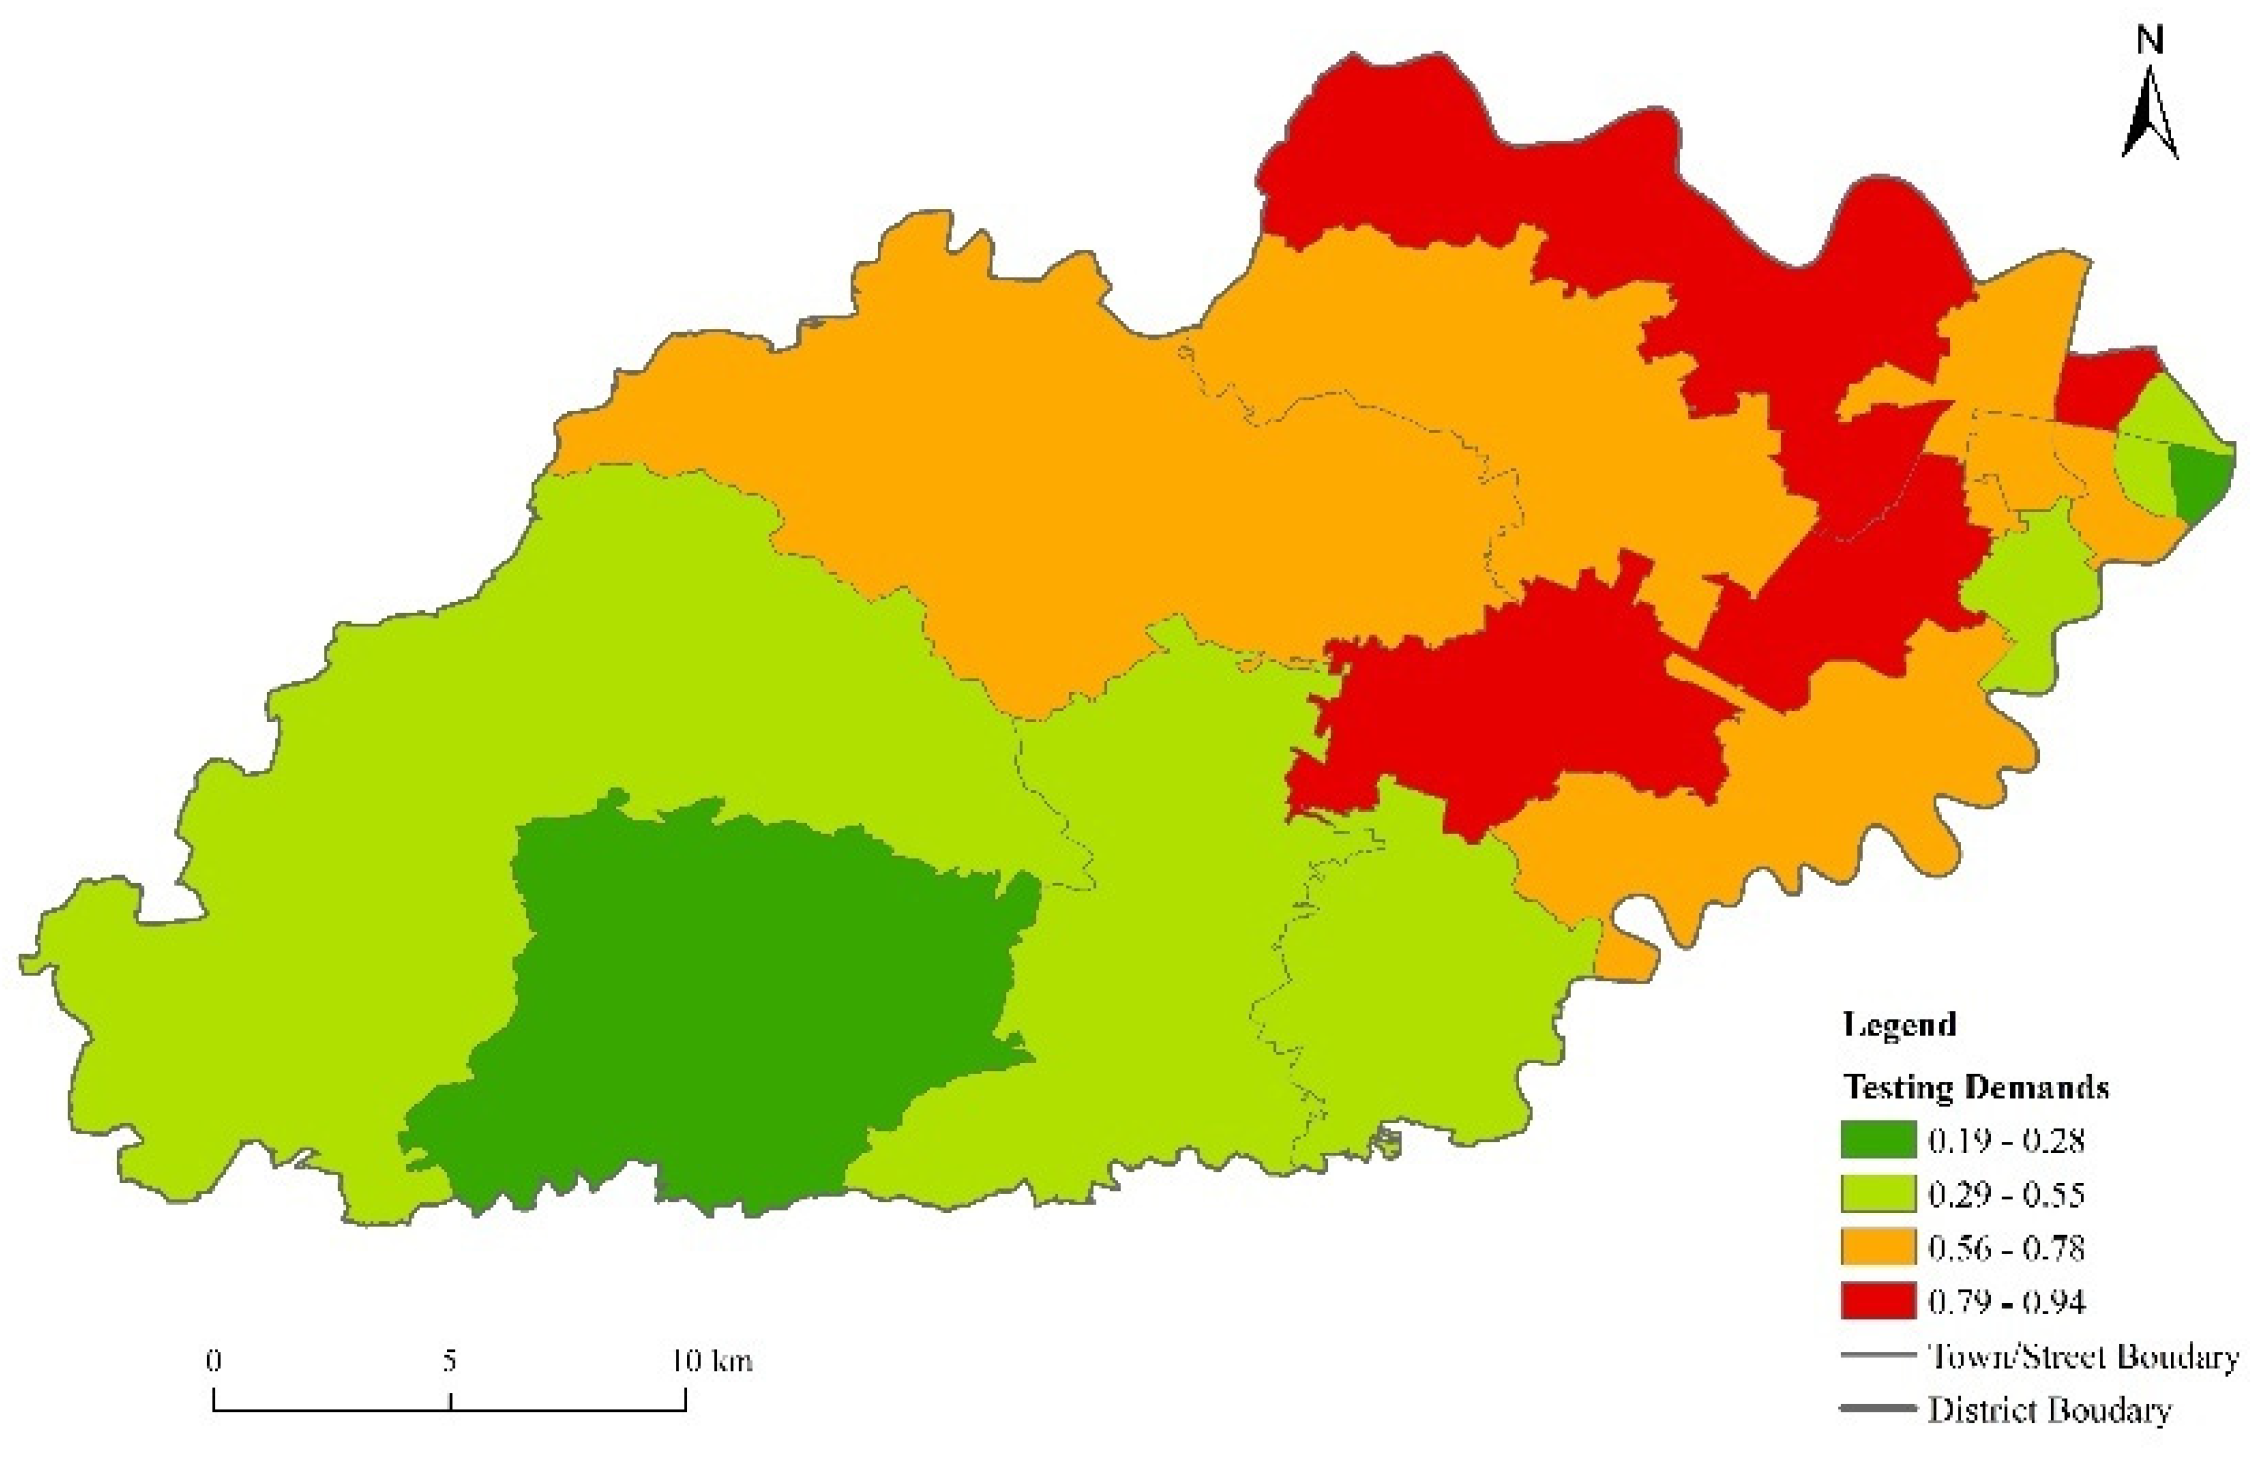
4.3.1. Testing Demand Analysis
The total population and the proportion of the population over 60 years old were selected as two indicators to calculate the demand index, which represents residents’ demand for COVID-19 testing in the study area. The calculation results are shown in
Figure 8. The towns/streets with high testing demand were mainly distributed in the central study area—such as Gulin, Gaoqiang Town and Ximen Street—which has a high level of commercial housing development, leading to a large number of residents, good public facilities, and beautiful environments, making them attractive to the elderly. The towns/streets with low testing demand were mainly located in the southwestern areas of the study area, such as Longguan, Zhangshui, Yingjiang and Dongqiao Town. The land in these areas was mostly used for farming and factories, and is less developed, resulting in sparser populations. In addition, the testing demand in Jiangxiang, Yuehu and Gulou Street was also low, mainly because theses streets were located in the urban commercial center, of which the size of the residential population is relatively small.
4.3.2. Equity Analysis of the Testing Facilities
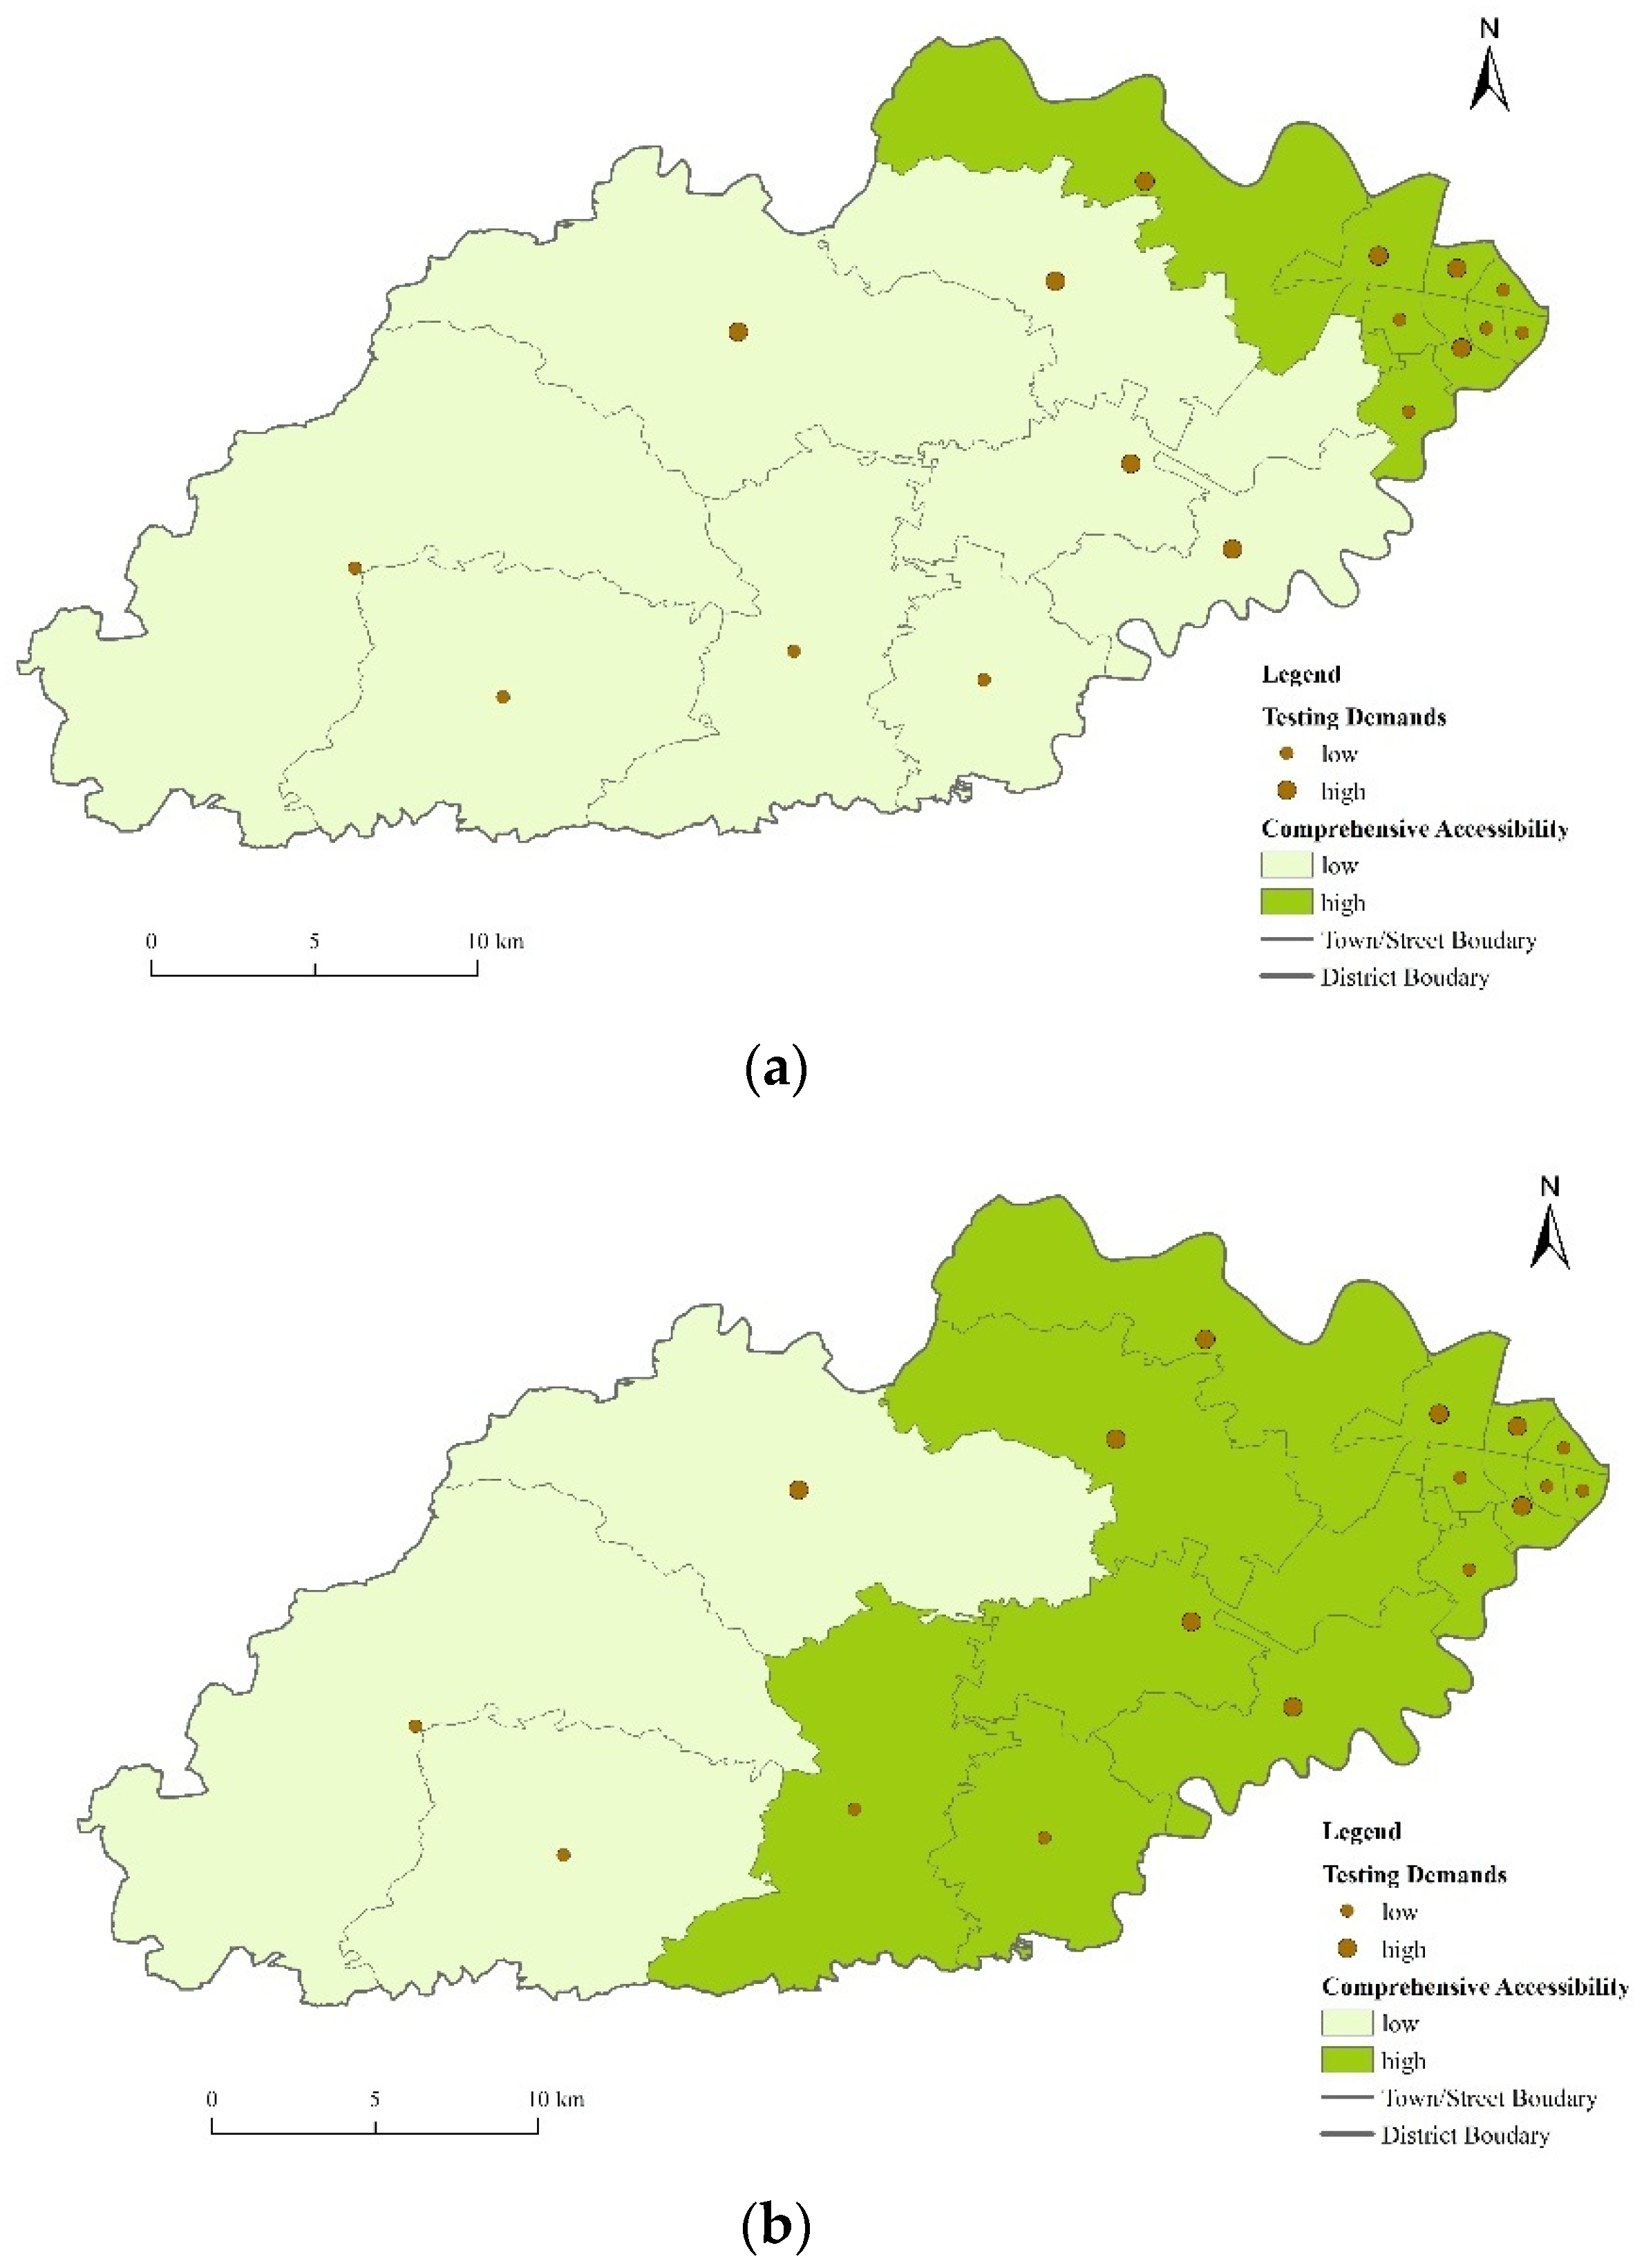
The fundamental purpose of the equity analysis is to reduce the inequity of the spatial distribution of COVID-19 testing facilities caused by class differentiation, and to take the testing demands of socially disadvantaged groups such as the aged into consideration insofar as is possible, such that people can have equal access to COVID-19 testing. The factors affecting the equity evaluation of COVID-19 testing facilities mainly included the accessibility of testing facilities and the spatial distribution of people with differentiated demands. The accessibility of current and potential COVID-19 testing facilities and residents’ demands for COVID-19 testing were overlapped at the town/street level in order to evaluate the equity, and the results are shown in
Figure 9.
It can be concluded from our study that 47.05% of towns/streets a level of access to testing facilities which was commensurate with their testing demand. However, the number of towns/streets with a high testing demand but a low accessibility of testing facilities reached four, accounting for 23.52% of all towns/streets; they were mainly distributed in the central part of the study area, namely, Hengjie, Jishigang, Gulin Town and Shiqi Street, which all lacked testing facilities, and had relatively low socioeconomic development. However, after making full use of potential COVID-19 testing facilities, the comprehensive accessibility of COVID-19 testing in this area was significantly improved, greatly enhancing the equity of the allocation of testing facilities in Haishu District. In total, 52.94% of towns/streets thereby obtained a level of access to testing facilities commensurate with their testing demand, with only one town remaining with high testing demand but low accessibility, which also reflects the necessity and significance of the use of current medical facilities to increase the number of COVID-19 testing facilities.
5. Discussion
The right to life and health is one of the basic rights possessed by human beings. Since COVID-19 first emerged in late 2019, it has infected more than 110 million people, and has killed 2.5 million people around the world. Fortunately, the spread of COVID-19 has been gradually restrained by active intervention and effective epidemic prevention from governments around the world. However, COVID-19 will still affect the production and life of society, and will change the original form of society for a long time. Predictably, in the post-epidemic world, residents will frequently undergo COVID-19 testing to show that they are not infected and can thus gain access to certain everyday activities (e.g., travel). Therefore, the ways in which to reasonably arrange testing facilities to provide COVID-19 testing services in a more equitable way has become an urgent problem for governments to solve all over the world. At present, COVID-19 testing facilities mainly rely on large hospitals in China. As a result, the number of institutions with COVID-19 testing qualifications is limited, and the allocation is often clustered in the city center, and a full account is not taken of the convenience of COVID-19 testing for rural residents. Therefore, this paper measured the accessibility of current and potential testing facilities in Haishu District based on the improved potential model, superimposing it with the testing demands of residents calculated by the population demand index, in order to comprehensively evaluate the equity of the spatial allocation of current and potential testing facilities in Haishu District. The results showed that the overall accessibility of the current testing facilities in Haishu District was high, and the average transportation time of residents to reach the nearest testing facilities was 18.75 min.
However, in the context of the high accessibility of testing facilities, the internal spatial differentiation was still considerable, and showed significant urban–rural duality. Compared with urban residents, villagers spend more than three times as much time travelling to access the nearest testing facility. Additionally, according to the testing facilities’ serviceability, service population, and residents’ medical care conduct, the gap among them has widened greatly, which suggests that testing facilities are not only unreasonably distributed spatially but also in terms of the allocation of testing resources (such as the number of testing personnel). The reason for this phenomenon is the great inequality of government investment in urban and rural facilities. Due to the excessive agglomeration of the population and economic elements in urban areas, medical facilities (e.g., expensive medical equipment, high-standard laboratories, and experienced medical staff) are often prioritized in urban areas, in order to meet the huge needs of high-density urban residents. In this context, the rural residents’ demand is difficult to be fully guarantee.
After fully exploiting the potential of testing facilities, the above condition was greatly improved. The average time for all towns/streets to reach the nearest point was 10.97 min (a reduction of 41.50%), and the average comprehensive accessibility increased from 117.75 to 152.96—an increase of 23.02%—which revealed that measures that make full use of medical facilities to establish new testing facilities can significantly improve the convenience for residents to use COVID-19 testing. What is more, the coefficient of variation of comprehensive accessibility was also significantly reduced, and the spatial dislocation of residents’ testing demand and the accessibility of testing facilities improved significantly, indicating that this measure was conducive to the alleviation of the spatial differences in the accessibility of testing institutions, and to the improvement of the equity of testing service supply.
In addition to the elimination of inequity caused by social status and economic income, it is also of great significance to increase COVID-19 testing facilities in rural areas for the rapid and accurate control of COVID-19 infection sources, because most of the spread of COVID-19 in post-epidemic areas is due to external sources living in rural areas where testing facilities are weak. If local governments could detect external sources’ infection status and get them treatment in isolation in a timely fashion, as well as carrying out a wide range of COVID-19 testing in combination with the travel tracking of the infection source at the same time, mass and regional infection outbreaks would be obviated. This requires the establishment of a large number of medical facilities in rural areas with efficient COVID-19 testing capabilities. For example, imported cases occurred in Wenzhou, Zhejiang province in June 2021, and the infection scale was controlled at an acceptable number of three under this premise. Besides this, for India, Vietnam, Thailand and other developing countries with an urban–rural dual opposition, we can also draw lessons from the research conclusion of this paper, and build more COVID-19 testing facilities in rural areas (if insufficient conditions can be changed to the COVID-19 testing sampling points) so as to quickly identify latent areas, gathering areas, and subsiding areas of COVID-19, with the efficient deployment of anti-epidemic measures tailored to local conditions.
However, this study required a large amount of detailed data, and it was difficult to obtain small-scale administrative division, population, and hospital data. We took the spatial geometrical center of towns/streets as the starting point for residents’ care conduct. In the future, the real starting point for residents could be determined according to new big data, such as mobile phone signaling data, which is one of the directions of our future research efforts. In addition, we concluded that the allocation of testing facilities in Haishu District was relatively unequal by analyzing the superposition results of the improved potential model and the population demand index from an objective level. Whether residents’ subjective perceptions were also strong, and whether different groups of people had the same feelings towards the inequity of the testing facilities should be focused on in future research.
6. Conclusions
This paper used the improved potential model to measure the spatial accessibility of current and potential testing facilities, integrated with the population demand index reflecting the demand for COVID-19 testing, so as to comprehensively evaluate the equity of the spatial allocation of current and potential testing facilities, with particular focus on Haishu District, Ningbo City, China. Generally, the supply of testing facilities in Haishu District has reached a high level. A total of 61.12% of residents reached the nearest testing facility within 20 min. However, after considering the serviceability and service population of testing facilities, and residents’ medical care conduct, the integral allocation of testing facilities in Haishu District was uneven. The accessibility of testing facilities in Haishu District gradually declined from the downtown area towards the rural areas. Moreover, roughly half of the rural population needing COVID-19 tests encountered hindrances due to poor access to testing agencies, while testing facilities in the downtown areas were saturated. However, after fully exploiting the potential of testing facilities, the comprehensive accessibility of testing facilities improved significantly, and the phenomenon of residents’ testing demands and accessibility space dislocation was also effectively alleviated, which significantly improved the equity and rationality of the allocation of testing facilities in Haishu District.
Based on the discussion and conclusion above, we propose the following policy suggestions for future testing facility planning. Governments should make full use of current medical facilities to establish testing facilities and promote the spread of testing services to vacant areas such as urban suburbs and rural areas in order to ease the service pressure of large urban hospitals, and to help residents in rural areas to take testing services. The capacity for large-scale and efficient COVID-19 testing facilities should be established in rural areas in order to avoid cluster and regional outbreaks caused by a few foreign sources of infection.
Furthermore, this research has potential room for the improvement, and there is an urgent need for further research. Theoretically, equal accessibility to testing services should be proposed in the next step, which includes the shortest spatial distance and more practical situations, combing more detailed demographical and spatial data, and detailed COVID-19 testing situation data, by which we can identify the social problem of unequal accessibility more accurately. Equal accessibility to testing services can further solve equal medical service distribution, which results from incomes, age structures, education levels and complicated testing situations, and can lead to social injustice. In future research, questionnaires and social medical surveys should be carried out urgently, in order to reveal injustice in the accessibility of testing services. Methodologically, the previous research was limited by demographical and spatial data, and the data of different situations, which would be improved in the future research. Especially, the time taken to reach testing services can be influenced by different situations, such as the average wait time in the different testing agencies. Therefore, the next research will incorporate more complicated situation data into the model in order to gain more accurate results, and thereby could more effectively reflect the accessibility of testing services.


 ,
, 


