


Application of C5.0 Algorithm for the Assessment of Perceived Stress in Healthcare Professionals Attending COVID-19
 , ,
, ,  , , , and
Abstract
:
1. Introduction
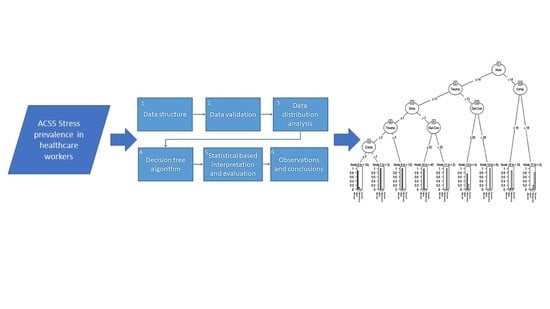
2. Materials and Methods
2.1. Descriptive Statistical Analysis
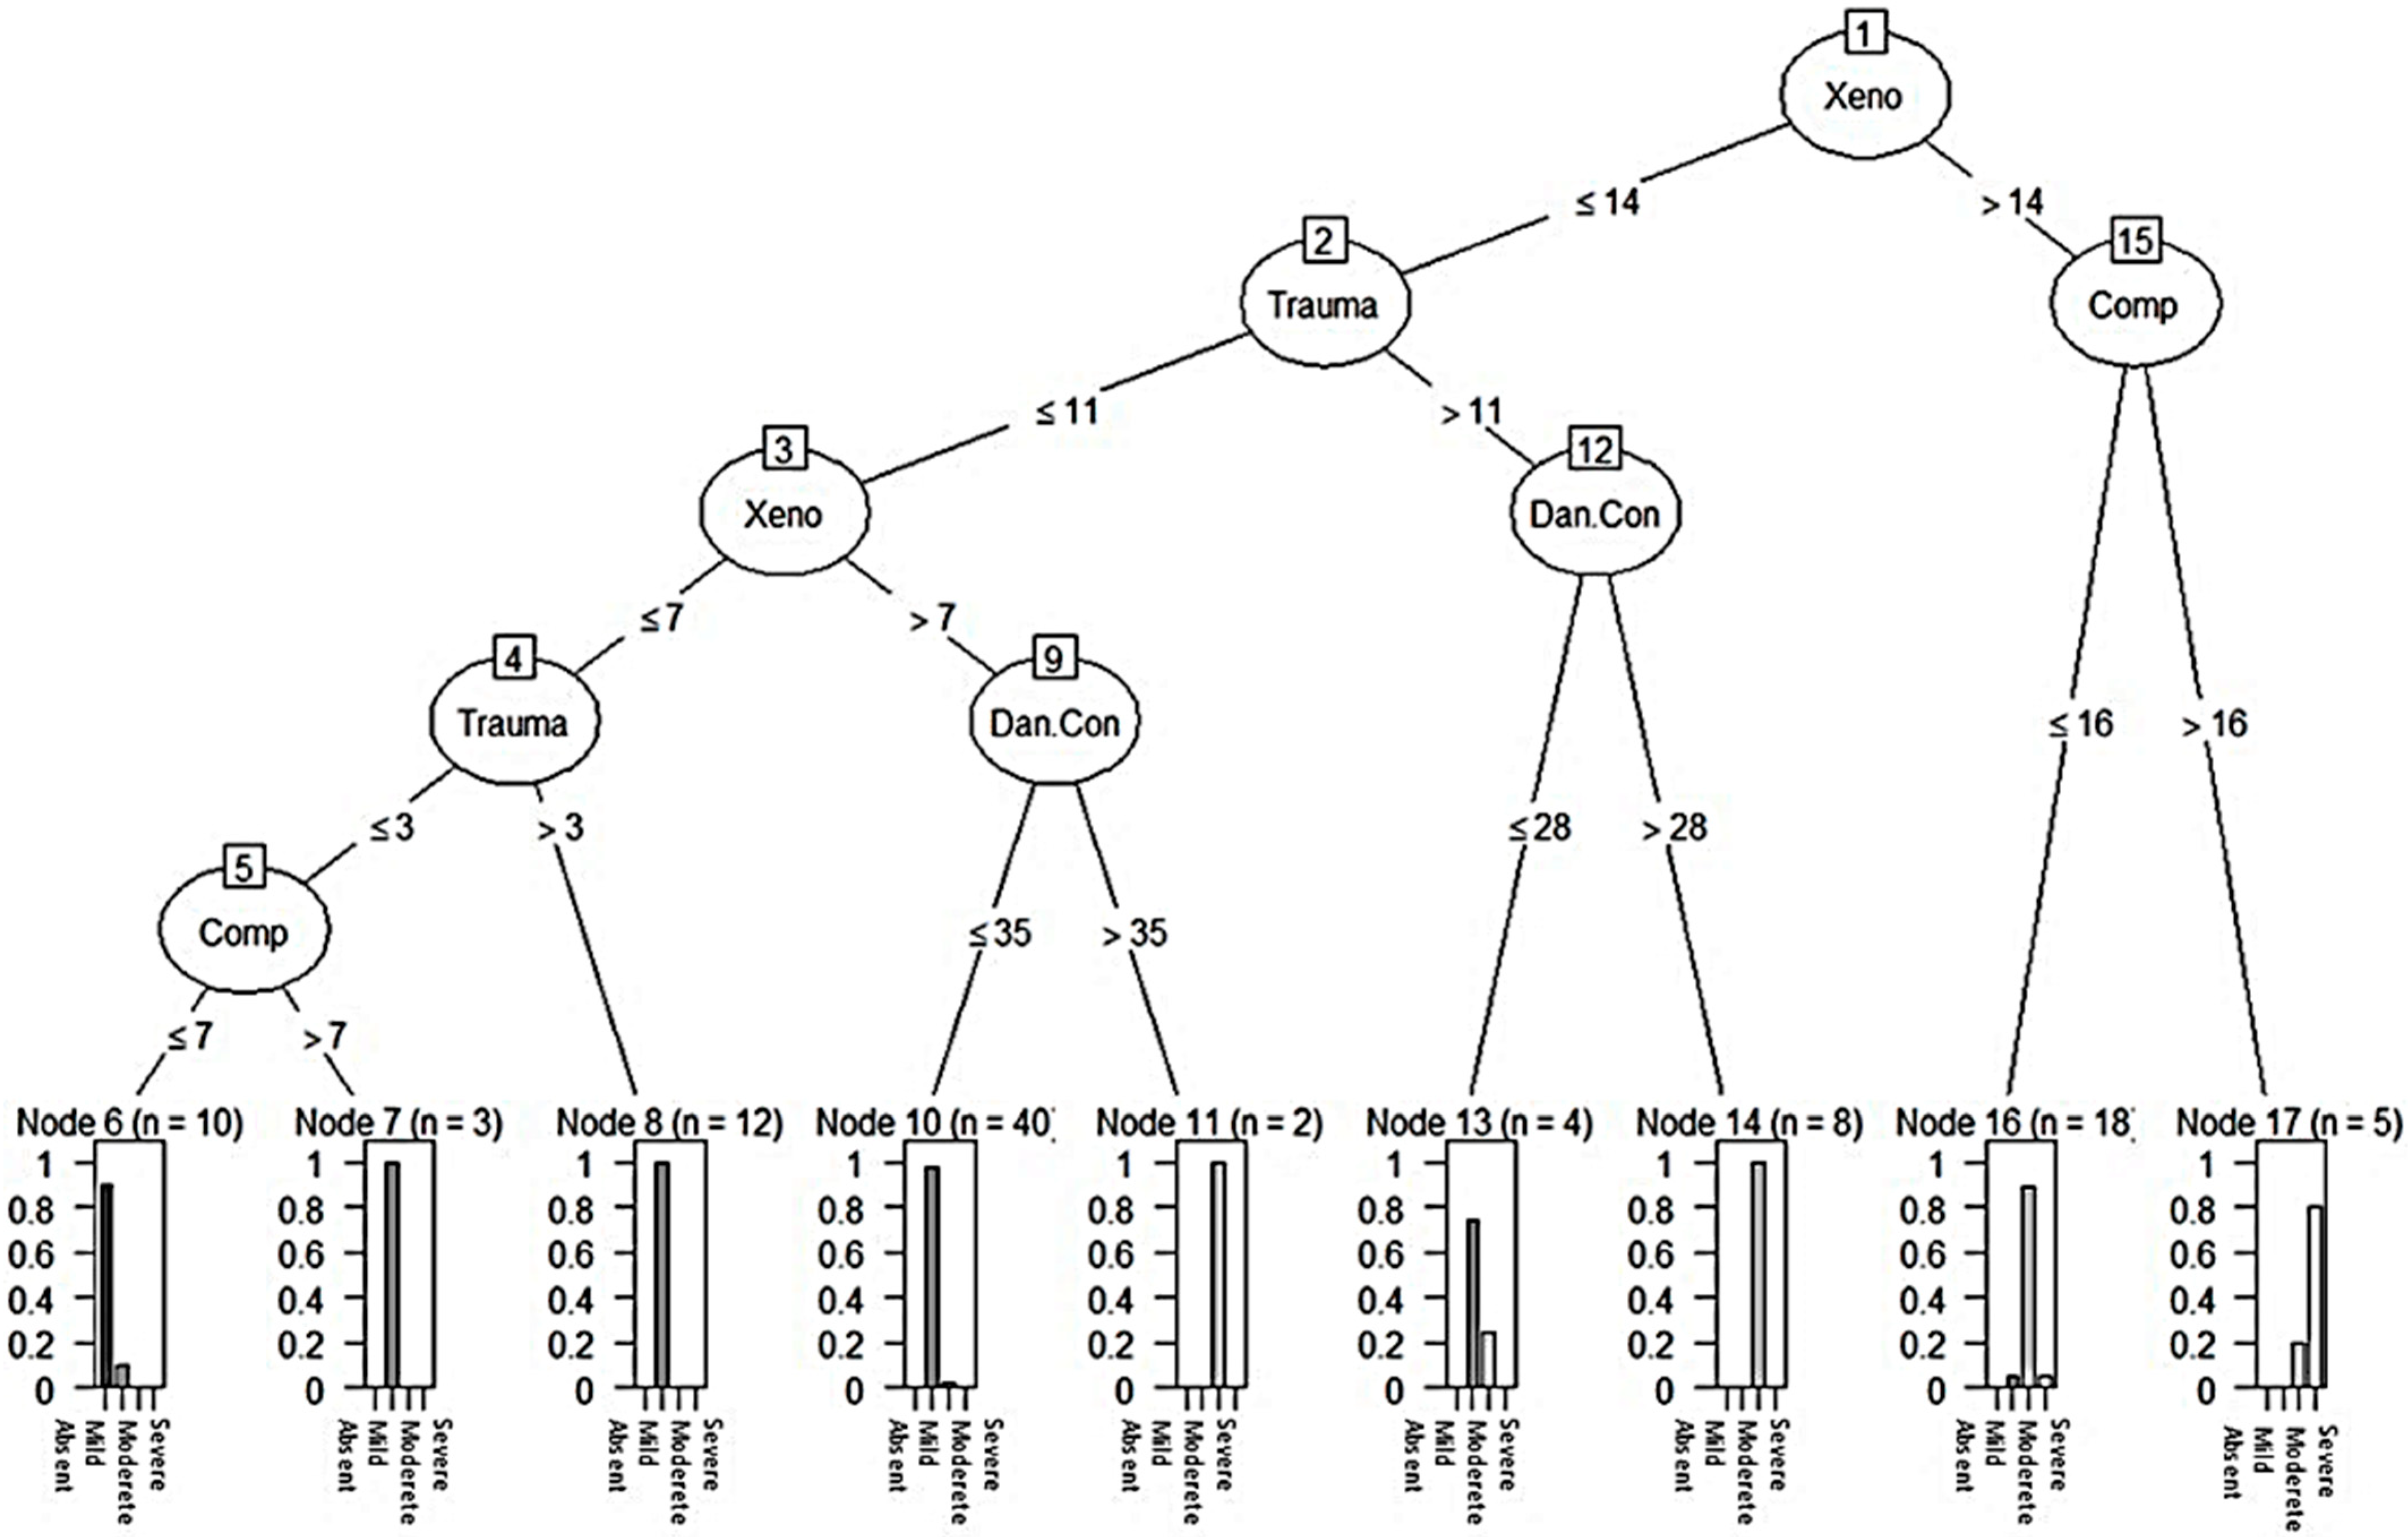
2.2. Application of C5.0 Algorithm
2.3. Dataset
3. Results
4. Discussion
5. Conclusions
6. Limitation
Supplementary Materials
Author Contributions
Funding
Institutional Review Board Statement
Data Availability Statement
Conflicts of Interest
References
- Delgado-Gallegos, J.L.; de Montemayor-Garza, R.J.; Padilla-Rivas, G.R.; Franco-Villareal, H.; Islas, J.F. Prevalence of stress in healthcare professionals during the COVID-19 pandemic in Northeast Mexico: A remote, fast survey evaluation, using an adapted covid-19 stress scales. Int. J. Environ. Res. Public Health 2020, 17, 7624. [Google Scholar] [CrossRef]
- Shah, K.; Chaudhari, G.; Kamrai, D.; Lail, A.; Patel, R.S. How essential is to focus on physician’s health and burnout in coronavirus (COVID-19) pandemic? Cureus 2020, 12, e7538. [Google Scholar] [CrossRef] [Green Version]
- Petzold, M.B.; Plag, J.; Ströhle, A. Dealing with psychological distress by healthcare professionals during the COVID-19 pandemia. Nervenarzt 2020, 91, 417–421. [Google Scholar] [CrossRef] [Green Version]
- Morales, G.; COVID-19 Death Toll in MEXICO. El Universal 2020. Available online: https://www.eluniversal.com.mx/english/live-updates-covid-19-death-toll-mexico (accessed on 19 January 2021).
- Bello-Chavolla, O.Y.; Bahena-López, J.P.; Antonio-Villa, N.E.; Vargas-Vázquez, A.; González-Díaz, A.; Márquez-Salinas, A.; Fermín-Martínez, C.A.; Naveja, J.J.; Aguilar-Salinas, C.A. Predicting mortality due to SARS-CoV-2: A mechanistic score relating obesity and diabetes to COVID-19 outcomes in Mexico. J. Clin. Endocrinol. Metab. 2020, 105, 2752–2761. [Google Scholar] [CrossRef]
- Burki, T. COVID-19 in latin america. Lancet Infect. Dis. 2020, 20, 547–548. [Google Scholar] [CrossRef] [PubMed]
- Shah, K.; Kamrai, D.; Mekala, H.; Mann, B.; Desai, K.; Patel, R.S. Focus on mental health during the coronavirus (COVID-19) pandemic: Applying learnings from the past outbreaks. Cureus 2020, 12, e7405. [Google Scholar] [CrossRef] [PubMed] [Green Version]
- Agren, D. Understanding Mexican health worker COVID-19 deaths. Lancet 2020, 396, 807. [Google Scholar] [CrossRef] [PubMed]
- CONACYT COVID-19 Mexico. Gob. de Mexico. 2020. Available online: https://coronavirus.gob.mx/datos/ (accessed on 19 January 2021).
- de Salud, S. Personal de Salud 03 de Noviembre de 2020. Gob. de Mexico. 2020. Available online: https://www.gob.mx/cms/uploads/attachment/file/590340/COVID-19_Personal_de_Salud_2020.11.03.pdf (accessed on 19 January 2021).
- PAHO Epidemiological Alert: COVID-19 among Health Workers—31 August 2020—PAHO/WHO|Pan American Health Organization. 2020. Available online: https://www.paho.org/en/documents/epidemiological-alert-covid-19-among-health-workers-31-august-2020 (accessed on 8 July 2021).
- de Salud, S. Datos Abiertos Dirección General de Epidemiología|Secretaría de Salud|Gobierno|gob.mx. Available online: https://www.gob.mx/salud/documentos/datos-abiertos-152127 (accessed on 8 July 2021).
- Hamama, L.; Hamama-Raz, Y.; Stokar, Y.N.; Pat-Horenczyk, R.; Brom, D.; Bron-Harlev, E. Burnout and perceived social support: The mediating role of secondary traumatization in nurses vs. physicians. J. Adv. Nurs. 2019, 75, 2742–2752. [Google Scholar] [CrossRef]
- Lai, J.; Ma, S.; Wang, Y.; Cai, Z.; Hu, J.; Wei, N.; Wu, J.; Du, H.; Chen, T.; Li, R. Factors associated with mental health outcomes among health care workers exposed to coronavirus disease 2019. JAMA Netw. open 2020, 3, e203976. [Google Scholar] [CrossRef]
- Labrague, L.J.; De los Santos, J.A.A. COVID-19 anxiety among front-line nurses: Predictive role of organisational support, personal resilience and social support. J. Nurs. Manag. 2020, 28, 1653–1661. [Google Scholar] [CrossRef]
- Reddy, U.S.; Thota, A.V.; Dharun, A. Machine learning techniques for stress prediction in working employees. In Proceedings of the 2018 IEEE International Conference on Computational Intelligence and Computing Research (ICCIC), Madurai, India, 13–15 December 2018; pp. 1–4. [Google Scholar]
- Galatzer-Levy, I.R.; Ma, S.; Statnikov, A.; Yehuda, R.; Shalev, A.Y. Utilization of machine learning for prediction of post-traumatic stress: A re-examination of cortisol in the prediction and pathways to non-remitting PTSD. Transl. Psychiatry 2017, 7, e1070. [Google Scholar] [CrossRef] [PubMed]
- Hasanin, T.; Kshirsagar, P.R.; Manoharan, H.; Sengar, S.S.; Selvarajan, S.; Satapathy, S.C. Exploration of Despair Eccentricities Based on Scale Metrics with Feature Sampling Using a Deep Learning Algorithm. Diagnostics 2022, 12, 2844. [Google Scholar] [CrossRef] [PubMed]
- Holzinger, A.; Langs, G.; Denk, H.; Zatloukal, K.; Müller, H. Causability and explainability of artificial intelligence in medicine. Wiley Interdiscip. Rev. Data Min. Knowl. Discov. 2019, 9, e1312. [Google Scholar] [CrossRef] [PubMed] [Green Version]
- Montague, P.R.; Dolan, R.J.; Friston, K.J.; Dayan, P. Computational psychiatry. Trends Cogn. Sci. 2012, 16, 72–80. [Google Scholar] [CrossRef] [Green Version]
- Mujica-Parodi, L.R.; Strey, H.H. Making Sense of Computational Psychiatry. Int. J. Neuropsychopharmacol. 2020, 23, 339–347. [Google Scholar] [CrossRef] [PubMed] [Green Version]
- Schulz, E.; Dayan, P. Computational Psychiatry for Computers. Iscience 2020, 23, 101772. [Google Scholar] [CrossRef] [PubMed]
- Davenport, T.; Kalakota, R. The potential for artificial intelligence in healthcare. Future Healthc. J. 2019, 6, 94–98. [Google Scholar] [CrossRef] [Green Version]
- Cutillo, C.M.; Sharma, K.R.; Foschini, L.; Kundu, S.; Mackintosh, M.; Mandl, K.D.; MI in Healthcare Workshop Working Group. Machine intelligence in healthcare—Perspectives on trustworthiness, explainability, usability, and transparency. NPJ Digit. Med. 2020, 3, 47. [Google Scholar] [CrossRef] [Green Version]
- Bhavsar, K.A.; Abugabah, A.; Singla, J.; AlZubi, A.A.; Bashir, A.K. A comprehensive review on medical diagnosis using machine learning. Comput. Mater. Contin. 2021, 67, 1997. [Google Scholar] [CrossRef]
- London, A.J. Artificial intelligence and black-box medical decisions: Accuracy versus explainability. Hastings Cent. Rep. 2019, 49, 15–21. [Google Scholar] [CrossRef]
- Kelleher, J.D.; Mac Namee, B.; D’Arcy, A. Fundamentals of machine learning for predictive data analytics: Algorithms. In Worked Examples, and Case Studies; MIT Press: Cambridge, MA, USA, 2015. [Google Scholar]
- Song, Y.-Y.; Ying, L.U. Decision tree methods: Applications for classification and prediction. Shanghai Arch. Psychiatry 2015, 27, 130. [Google Scholar]
- Zhu, T.; Ning, Y.; Li, A.; Xu, X. Using decision tree to predict mental health status based on web behavior. In Proceedings of the 2011 3rd Symposium on Web Society, Chicago, IL, USA, 23–25 May 2011; pp. 27–31. [Google Scholar]
- Sharma, N.; Gedeon, T. Objective measures, sensors and computational techniques for stress recognition and classification: A survey. Comput. Methods Programs Biomed. 2012, 108, 1287–1301. [Google Scholar] [CrossRef]
- Li, C.; Glüer, C.-C.; Eastell, R.; Felsenberg, D.; Reid, D.M.; Roux, C.; Lu, Y. Tree-structured subgroup analysis of receiver operating characteristic curves for diagnostic tests. Acad. Radiol. 2012, 19, 1529–1536. [Google Scholar] [CrossRef]
- Magyary, D.; Brandt, P. A decision tree and clinical paths for the assessment and management of children with ADHD. Issues Ment. Health Nurs. 2002, 23, 553–566. [Google Scholar] [CrossRef] [PubMed]
- Nath, R.K.; Thapliyal, H.; Caban-Holt, A.; Mohanty, S.P. Machine learning based solutions for real-time stress monitoring. IEEE Consum. Electron. Mag. 2020, 9, 34–41. [Google Scholar] [CrossRef]
- Subhani, A.R.; Mumtaz, W.; Saad, M.N.B.M.; Kamel, N.; Malik, A.S. Machine learning framework for the detection of mental stress at multiple levels. IEEE Access 2017, 5, 13545–13556. [Google Scholar] [CrossRef]
- Kumar, P.; Garg, S.; Garg, A. Assessment of anxiety, depression and stress using machine learning models. Procedia Comput. Sci. 2020, 171, 1989–1998. [Google Scholar] [CrossRef]
- Flesia, L.; Monaro, M.; Mazza, C.; Fietta, V.; Colicino, E.; Segatto, B.; Roma, P. Predicting perceived stress related to the Covid-19 outbreak through stable psychological traits and machine learning models. J. Clin. Med. 2020, 9, 3350. [Google Scholar] [CrossRef]
- Li, H.; Zheng, E.; Zhong, Z.; Xu, C.; Roma, N.; Lamkin, S.; Von Visger, T.T.; Chang, Y.-P.; Xu, W. Stress prediction using micro-EMA and machine learning during COVID-19 social isolation. Smart Health 2021, 23, 100242. [Google Scholar] [CrossRef] [PubMed]
- Padilla-Rivas, G.R.; Delgado-Gallegos, J.L.; Montemayor-Garza, R.D.J.; Franco-Villareal, H.; Coiser-León, M.D.L.Á.; Avilés-Rodriguez, G.; Zuñiga-Violante, E.; Romo-Cardenas, G.S.; Islas, J.F. Dataset of the adapted COVID STRESS SCALES for Healthcare professionals of the Northeast region of Mexico. Data Br. 2021, 34, 106733. [Google Scholar] [CrossRef]
- Stewart, R.W.; Tuerk, P.W.; Metzger, I.W.; Davidson, T.M.; Young, J. A decision-tree approach to the assessment of posttraumatic stress disorder: Engineering empirically rigorous and ecologically valid assessment measures. Psychol. Serv. 2016, 13, 1–9. [Google Scholar] [CrossRef] [PubMed]
- Wirth, R.; Hipp, J. CRISP-DM: Towards a standard process model for data mining. In Proceedings of the 4th International Conference on the Practical Applications of Knowledge Discovery and Data Mining, Crowne Plaza Midland Hotel, Manchester, UK, 11–13 April 2000; Springer: London, UK, 2000; Volume 1. [Google Scholar]
- Rafe, V.; Farhoud, S.H.; Rasoolzadeh, S. Breast cancer prediction by using C5. 0 Algorithm and BOOSTING Method. J. Med. Imaging Health Inform. 2014, 4, 600–604. [Google Scholar] [CrossRef]
- Ahmadi, E.; Weckman, G.R.; Masel, D.T. Decision making model to predict presence of coronary artery disease using neural network and C5. 0 decision tree. J. Ambient Intell. Humaniz. Comput. 2018, 9, 999–1011. [Google Scholar] [CrossRef]
- Pashaei, E.; Ozen, M.; Aydin, N. Improving medical diagnosis reliability using Boosted C5. 0 decision tree empowered by Particle Swarm Optimization. In Proceedings of the 2015 37th Annual International Conference of the IEEE Engineering in Medicine and Biology Society (EMBC), Milan, Italy, 25–29 August 2015; pp. 7230–7233. [Google Scholar]
- Ruiz-Fernández, M.D.; Ramos-Pichardo, J.D.; Ibáñez-Masero, O.; Cabrera-Troya, J.; Carmona-Rega, M.I.; Ortega-Galán, Á.M. Compassion fatigue, burnout, compassion satisfaction and perceived stress in healthcare professionals during the COVID-19 health crisis in Spain. J. Clin. Nurs. 2020, 29, 4321–4330. [Google Scholar] [CrossRef]
- Bareeqa, S.B.; Ahmed, S.I.; Samar, S.S.; Yasin, W.; Zehra, S.; Monese, G.M.; Gouthro, R.V. Prevalence of depression, anxiety and stress in china during COVID-19 pandemic: A systematic review with meta-analysis. Int. J. Psychiatry Med. 2021, 56, 210–227. [Google Scholar] [CrossRef]
- Moret, L.; Mesbah, M.; Chwalow, J.; Lellouch, J. Internal validation of a measurement scale: Relation between principal component analysis, Cronbach’s alpha coefficient and intra-class correlation coefficient. Rev. Epidemiol. Sante Publique 1993, 41, 179–186. [Google Scholar] [PubMed]
- Tavakol, M.; Dennick, R. Making sense of Cronbach’s alpha. Int. J. Med. Educ. 2011, 2, 53. [Google Scholar] [CrossRef]
- Sharpe, D. Chi-square test is statistically significant: Now what? Pract. Assess. Res. Eval. 2015, 20, 8. [Google Scholar]
- Yao, Z.; Liu, P.; Lei, L.; Yin, J. R-C4. 5 Decision tree model and its applications to health care dataset. In Proceedings of the ICSSSM’05. 2005 International Conference on Services Systems and Services Management, Chongqing, China, 13–15 June 2005; Volume 2, pp. 1099–1103. [Google Scholar]
- van der Ploeg, T.; Austin, P.C.; Steyerberg, E.W. Modern modelling techniques are data hungry: A simulation study for predicting dichotomous endpoints. BMC Med. Res. Methodol. 2014, 14, 137. [Google Scholar] [CrossRef] [Green Version]
- Zhu, W.; Zeng, N.; Wang, N. Sensitivity, specificity, accuracy, associated confidence interval and ROC analysis with practical SAS implementations. NESUG Proc. Health Care Life Sci. Baltim. Md. 2010, 19, 67. [Google Scholar]
- Priyam, A.; Abhijeeta, G.R.; Rathee, A.; Srivastava, S. Comparative analysis of decision tree classification algorithms. Int. J. Curr. Eng. Technol. 2013, 3, 334–337. [Google Scholar]
- Ramyachitra, D.; Manikandan, P. Imbalanced dataset classification and solutions: A review. Int. J. Comput. Bus. Res. 2014, 5, 1–29. [Google Scholar]
- Taylor, S.; Landry, C.A.; Paluszek, M.M.; Fergus, T.A.; McKay, D.; Asmundson, G.J.G. Development and initial validation of the COVID Stress Scales. J. Anxiety Disord. 2020, 72, 102232. [Google Scholar] [CrossRef]
- Wang, C.; Pan, R.; Wan, X.; Tan, Y.; Xu, L.; Ho, C.S.; Ho, R.C. Immediate psychological responses and associated factors during the initial stage of the 2019 coronavirus disease (COVID-19) epidemic among the general population in China. Int. J. Environ. Res. Public Health 2020, 17, 1729. [Google Scholar] [CrossRef] [Green Version]
- Huys, Q.J.M.; Maia, T.V.; Frank, M.J. Computational psychiatry as a bridge from neuroscience to clinical applications. Nat. Neurosci. 2016, 19, 404–413. [Google Scholar] [CrossRef] [Green Version]
- Yu, C.-S.; Lin, Y.-J.; Lin, C.-H.; Wang, S.-T.; Lin, S.-Y.; Lin, S.H.; Wu, J.L.; Chang, S.-S. Predicting metabolic syndrome with machine learning models using a decision tree algorithm: Retrospective cohort study. JMIR Med. Inform. 2020, 8, e17110. [Google Scholar] [CrossRef]
- Peng, J.; Chen, C.; Zhou, M.; Xie, X.; Zhou, Y.; Luo, C.-H. A machine-learning approach to forecast aggravation risk in patients with acute exacerbation of chronic obstructive pulmonary disease with clinical indicators. Sci. Rep. 2020, 10, 3118. [Google Scholar] [CrossRef] [PubMed] [Green Version]
- Gopinath, M.P.; Satyam, S.C.; Jenil, S.M.; Shashank, P. Predictive Analysis of COVID-19 Pandemic in India Based on SIR-F Model. Res. Sq. 2021. [Google Scholar]
- Krystal, J.H. Responding to the hidden pandemic for healthcare workers: Stress. Nat. Med. 2020, 26, 639. [Google Scholar] [CrossRef] [PubMed]


| Participant Profession | Counts | Participant Work Area | Counts |
|---|---|---|---|
| Medical Student | 2 | Front line health professional | 29 |
| Nursing Staff | 10 | Others | 34 |
| Physician | 69 | COVID-19 designated area | 11 |
| Physician in community service * | 4 | Surgical | 11 |
| Resident | 15 | ER | 9 |
| Technician | 2 | Internal medicine | 8 |
| Stress Scale Feature | Min | 1st Quartile | Median | Mean | 3rd Quartile | Max |
|---|---|---|---|---|---|---|
| Danger + fear of contamination | 5 | 23 | 25 | 25.2 | 33.75 | 48 |
| Socioeconomical | 4 | 14 | 17 | 16.27 | 19 | 24 |
| Xenophobia | 1 | 7 | 10.5 | 10.9 | 14 | 24 |
| Traumatic stress | 0 | 2 | 6 | 7.37 | 12 | 22 |
| Compulsive checking | 0 | 5 | 8 | 9.38 | 13.75 | 24 |
| COVID Areas | Absent | Mild | Moderate | Severe | Xi2 | Sig |
|---|---|---|---|---|---|---|
| Danger + fear of contamination | 3 | 23 | 58 | 17 | 64.98 | <0.001 |
| Socioeconomical | 30 | 35 | 24 | 12 | 11.673 | <0.009 |
| Xenophobia | 15 | 45 | 29 | 12 | 27.119 | <0.001 |
| Traumatic stress | 47 | 25 | 21 | 8 | 31.238 | <0.001 |
| Compulsive checking | 26 | 43 | 22 | 10 | 22.129 | <0.001 |
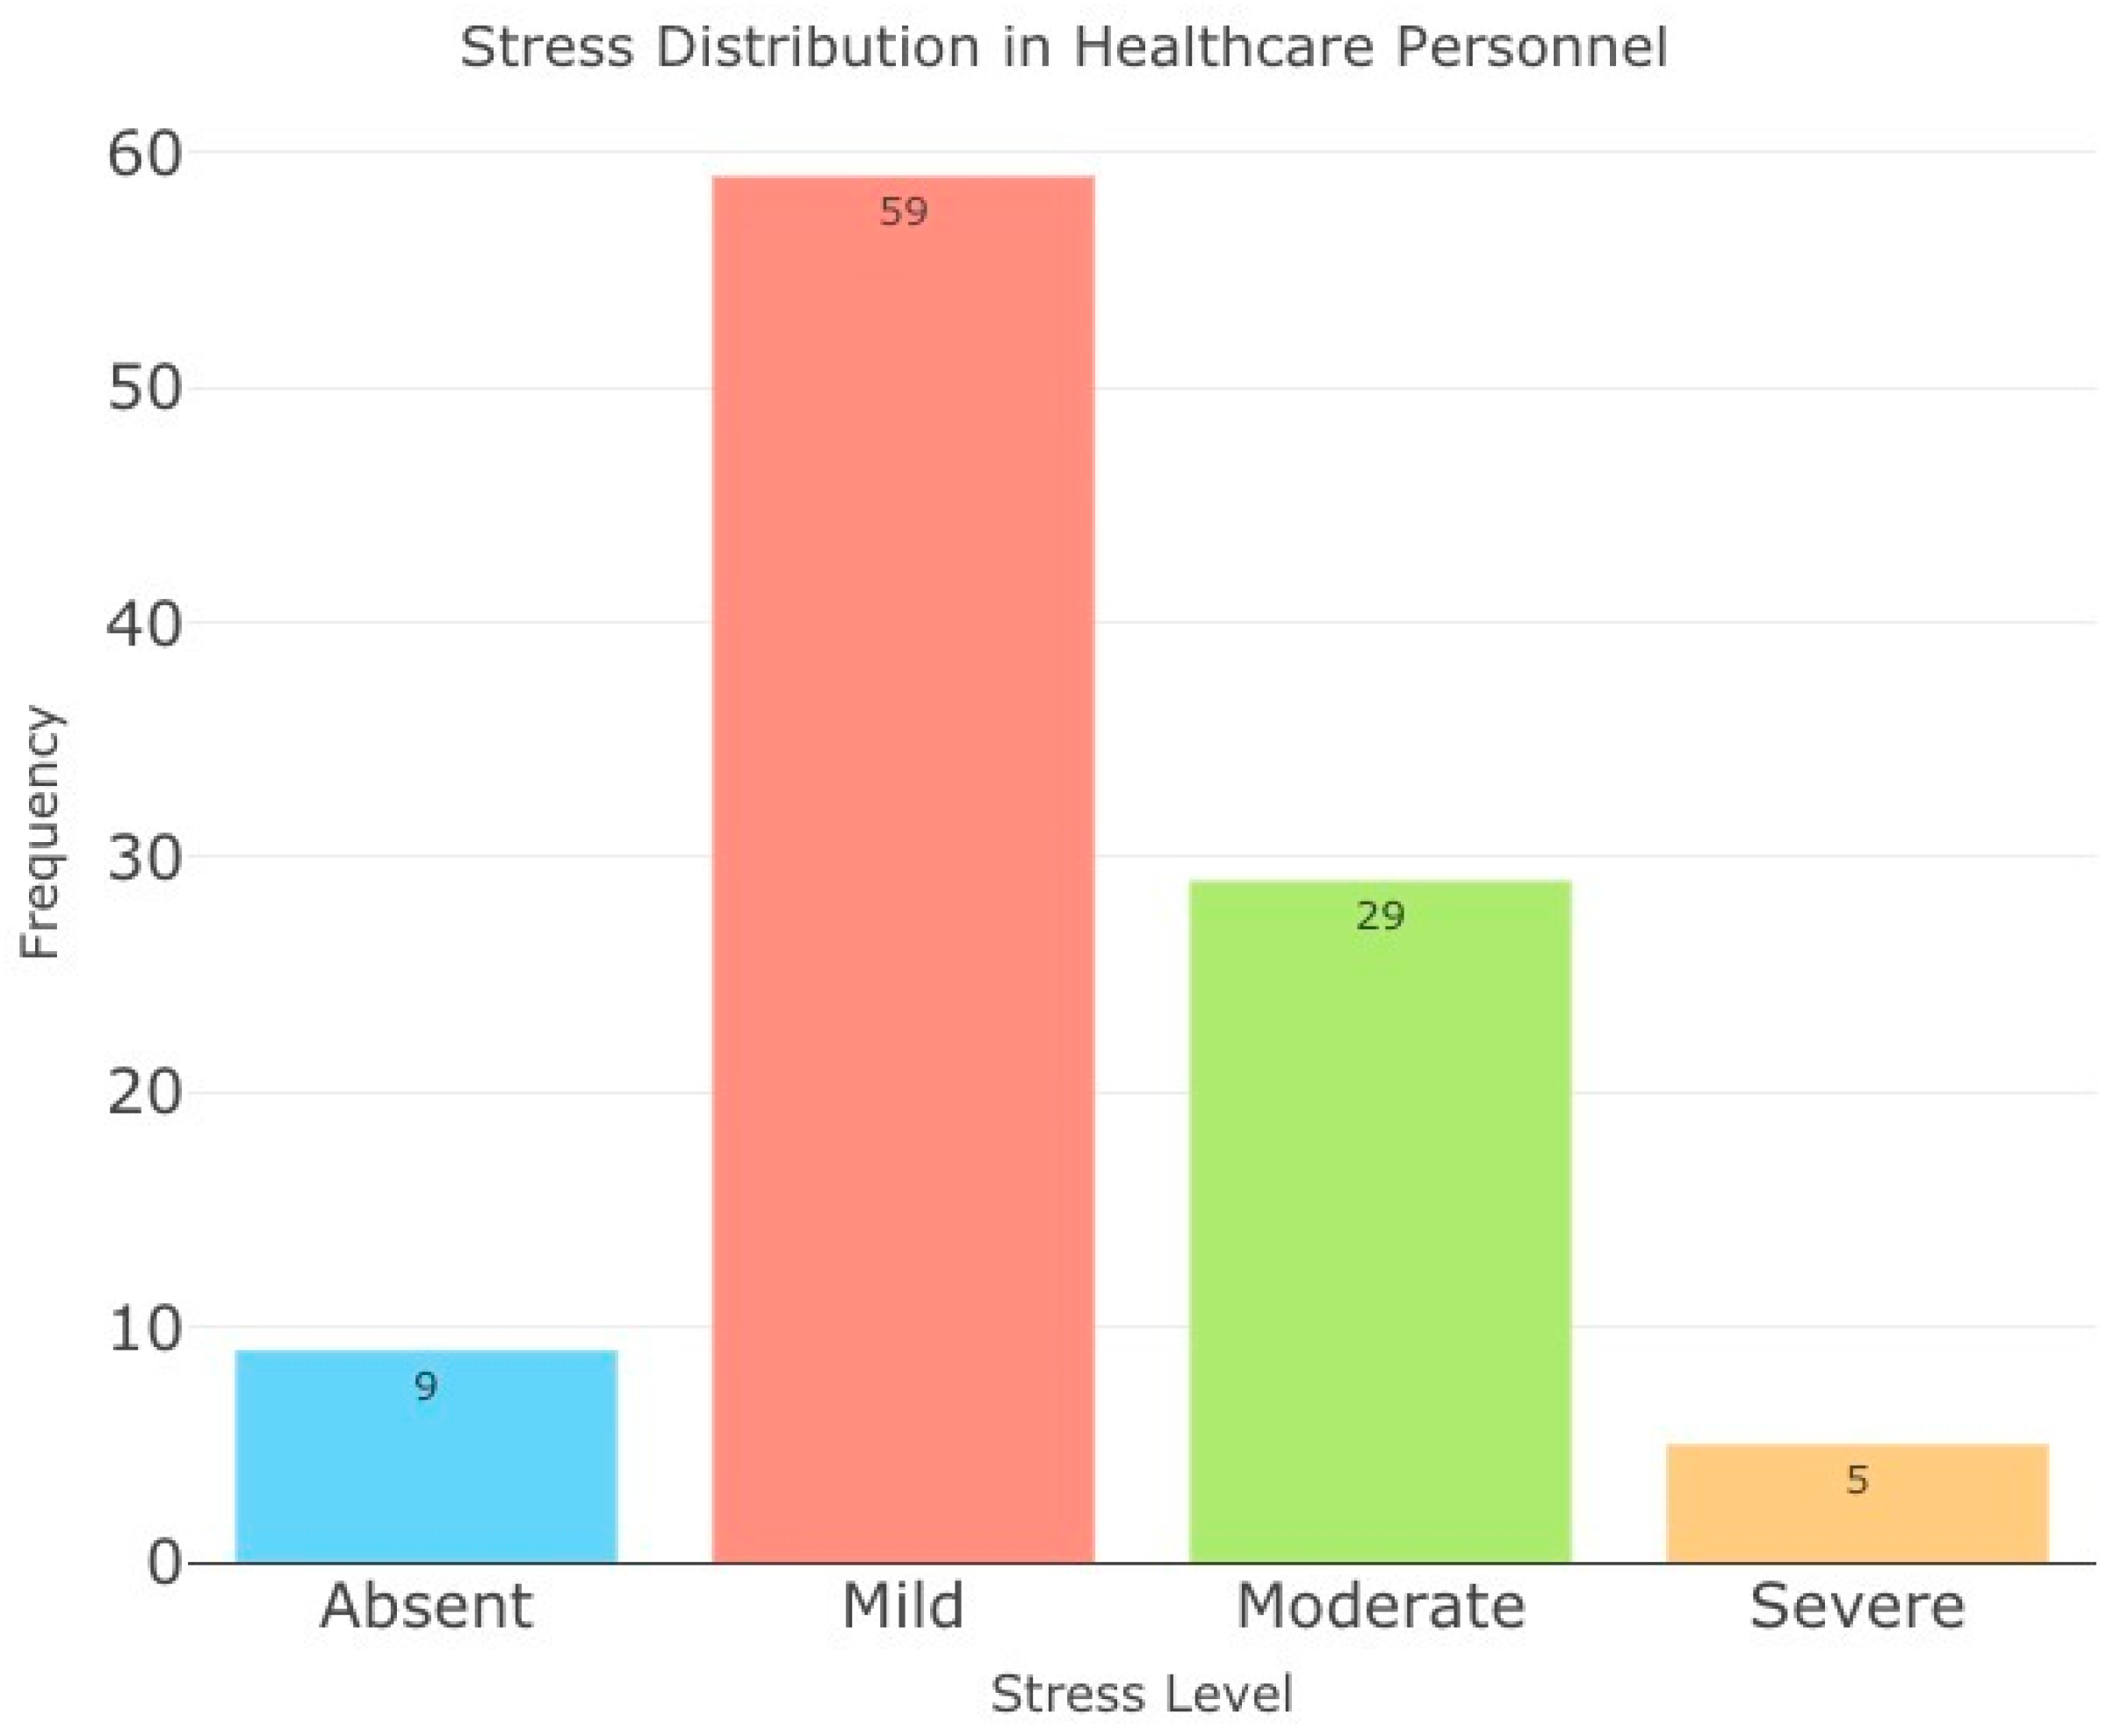
| CSS general score | 9 | 59 | 28 | 5 | 72.109 | <0.001 |
| Xi2 = chi-square test | ||||||
| Classified as | ||||
|---|---|---|---|---|
| (a) | (b) | (c) | (d) | Actual Class |
| 9 |
| |||
| 1 | 57 | 1 |
| |
| 2 | 26 | 1 |
| |
| 1 | 4 |
| ||
| Healthy: Absent + Mild + Moderate Disease: Severe | Healthy: Absent + Mild Disease: Moderate + Severe | Healthy: Absent Disease: Mild + Moderate + Severe | |
|---|---|---|---|
| Sensitivity | 0.8 | 0.91 | 0.989 |
| Specificity | 0.989 | 0.98 | 0.9 |
Disclaimer/Publisher’s Note: The statements, opinions and data contained in all publications are solely those of the individual author(s) and contributor(s) and not of MDPI and/or the editor(s). MDPI and/or the editor(s) disclaim responsibility for any injury to people or property resulting from any ideas, methods, instructions or products referred to in the content. |
© 2023 by the authors. Licensee MDPI, Basel, Switzerland. This article is an open access article distributed under the terms and conditions of the Creative Commons Attribution (CC BY) license (https://creativecommons.org/licenses/by/4.0/).
Share and Cite
Delgado-Gallegos, J.L.; Avilés-Rodriguez, G.; Padilla-Rivas, G.R.; De los Ángeles Cosío-León, M.; Franco-Villareal, H.; Nieto-Hipólito, J.I.; de Dios Sánchez López, J.; Zuñiga-Violante, E.; Islas, J.F.; Romo-Cardenas, G.S. Application of C5.0 Algorithm for the Assessment of Perceived Stress in Healthcare Professionals Attending COVID-19. Brain Sci. 2023, 13, 513. https://doi.org/10.3390/brainsci13030513
Delgado-Gallegos JL, Avilés-Rodriguez G, Padilla-Rivas GR, De los Ángeles Cosío-León M, Franco-Villareal H, Nieto-Hipólito JI, de Dios Sánchez López J, Zuñiga-Violante E, Islas JF, Romo-Cardenas GS. Application of C5.0 Algorithm for the Assessment of Perceived Stress in Healthcare Professionals Attending COVID-19. Brain Sciences. 2023; 13(3):513. https://doi.org/10.3390/brainsci13030513
Chicago/Turabian StyleDelgado-Gallegos, Juan Luis, Gener Avilés-Rodriguez, Gerardo R. Padilla-Rivas, María De los Ángeles Cosío-León, Héctor Franco-Villareal, Juan Iván Nieto-Hipólito, Juan de Dios Sánchez López, Erika Zuñiga-Violante, Jose Francisco Islas, and Gerardo Salvador Romo-Cardenas. 2023. "Application of C5.0 Algorithm for the Assessment of Perceived Stress in Healthcare Professionals Attending COVID-19" Brain Sciences 13, no. 3: 513. https://doi.org/10.3390/brainsci13030513