
A Network Analysis of the Fear of COVID-19 Scale (FCV-19S): A Large-Scale Cross-Cultural Study in Iran, Bangladesh, and Norway

 ,
,  ,
,  , ,
, ,
Abstract
:1. Introduction
2. Materials and Methods
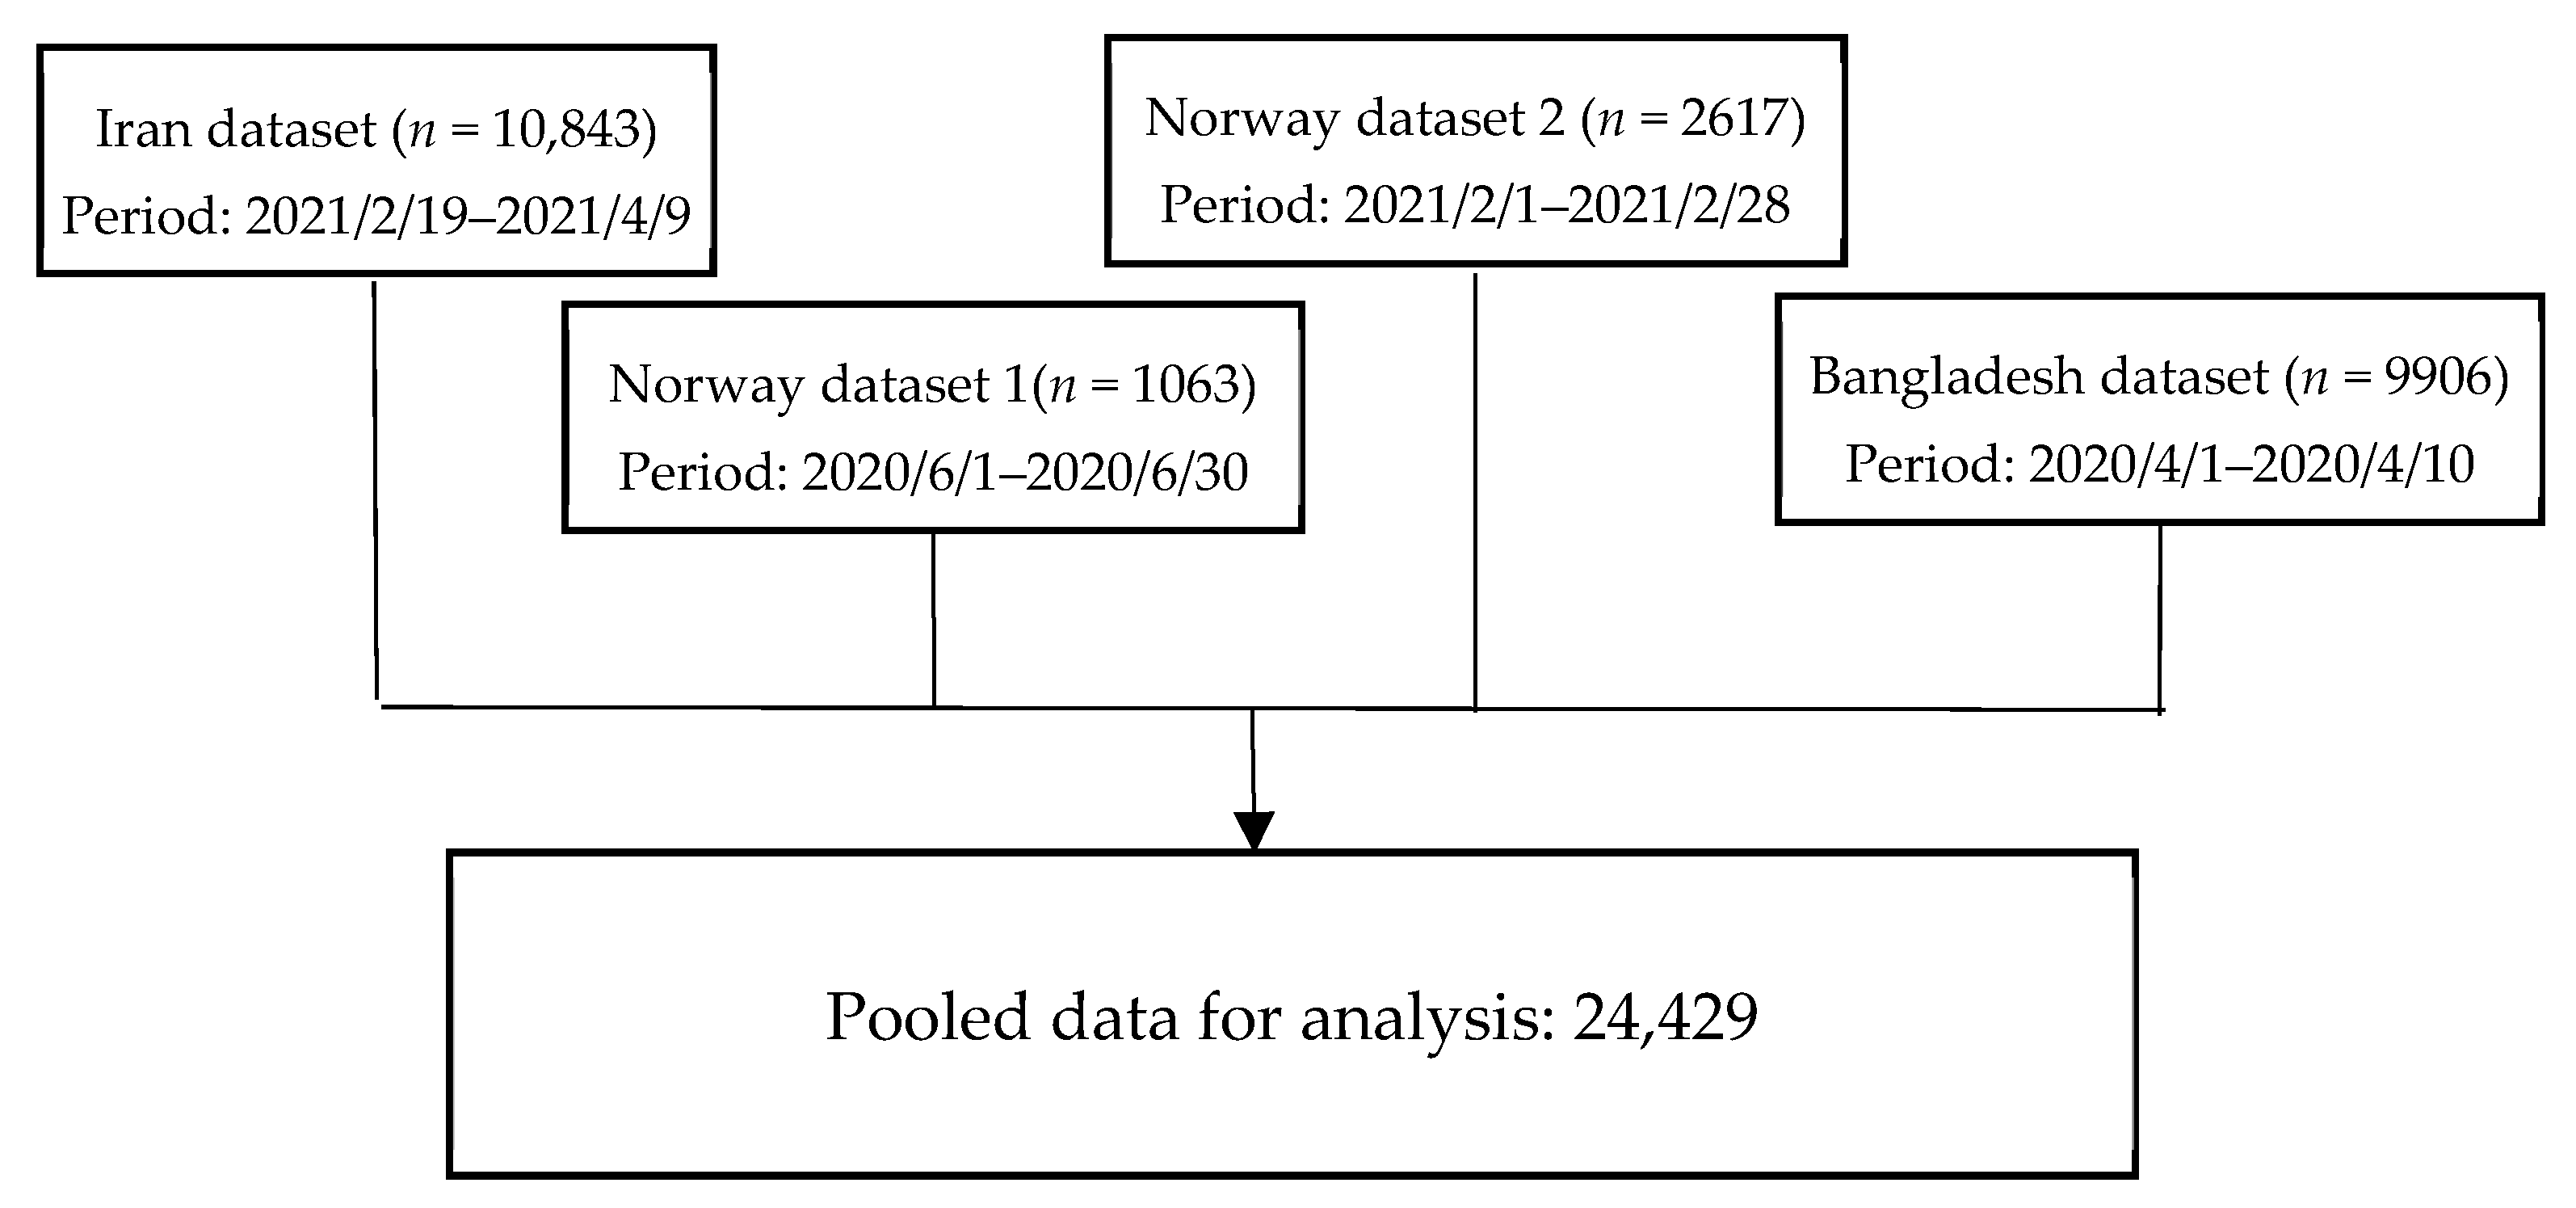
2.1. Participants and Study Procedure
2.1.1. Iran
2.1.2. Bangladesh
2.1.3. Norway
2.2. Measure: Fear of COVID-19 Scale (FCV-19S)
2.3. Data Analyses
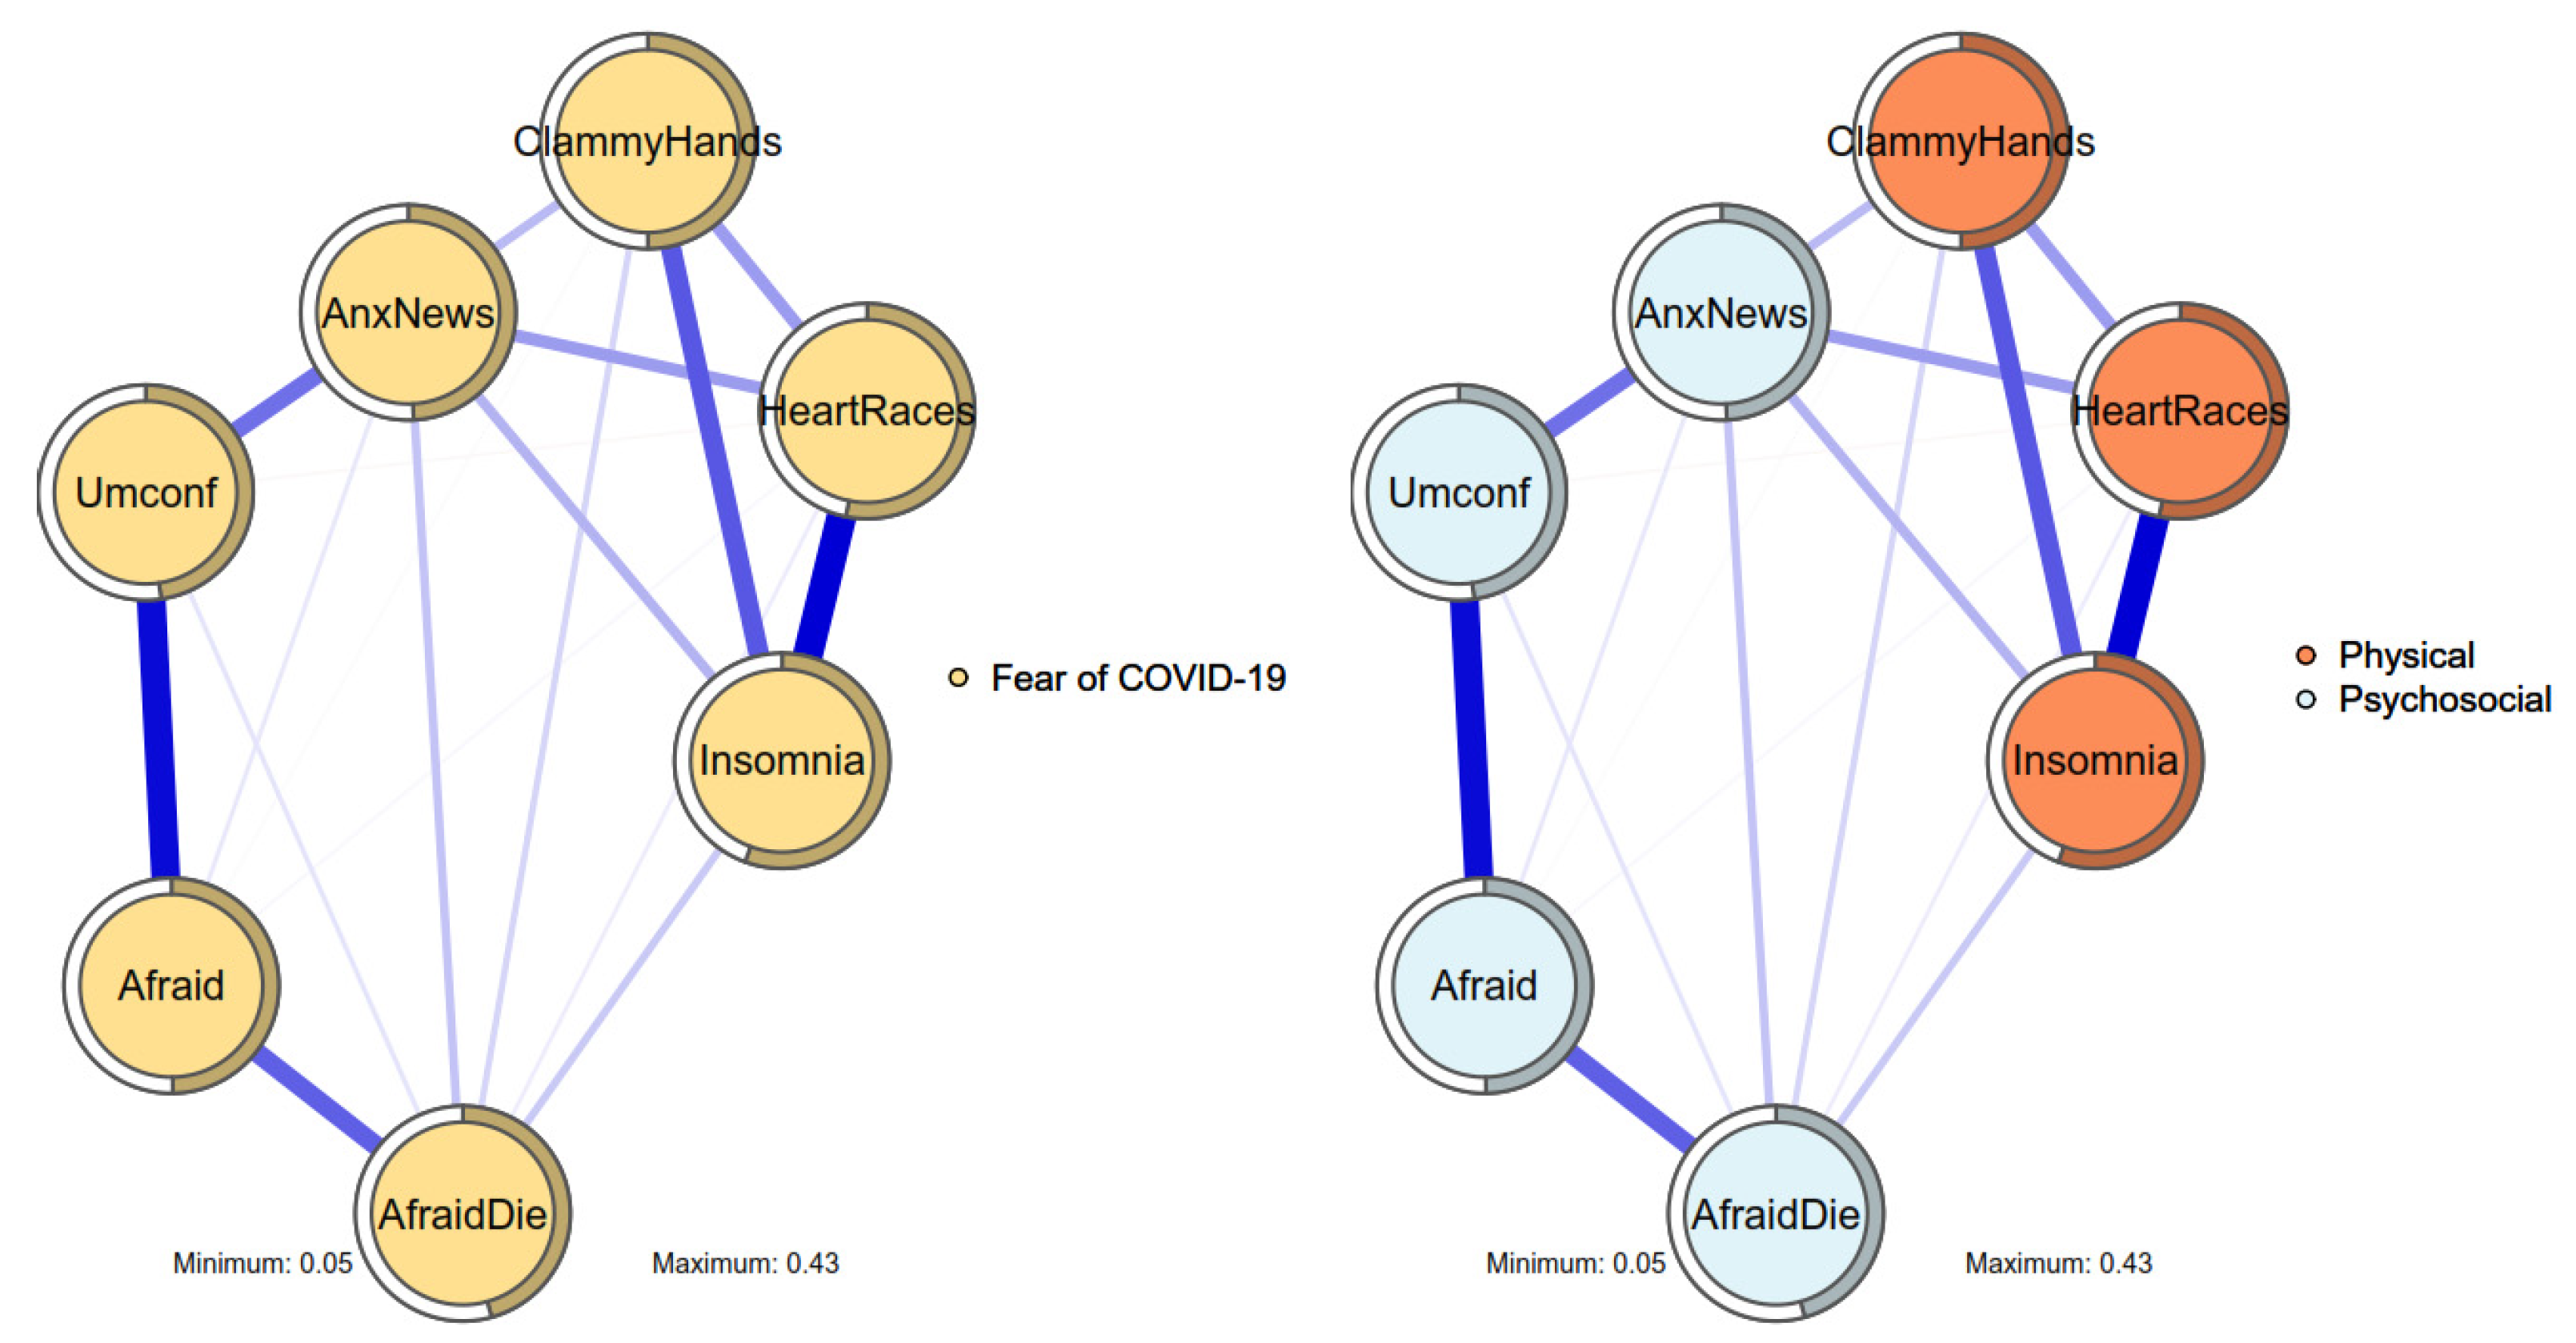
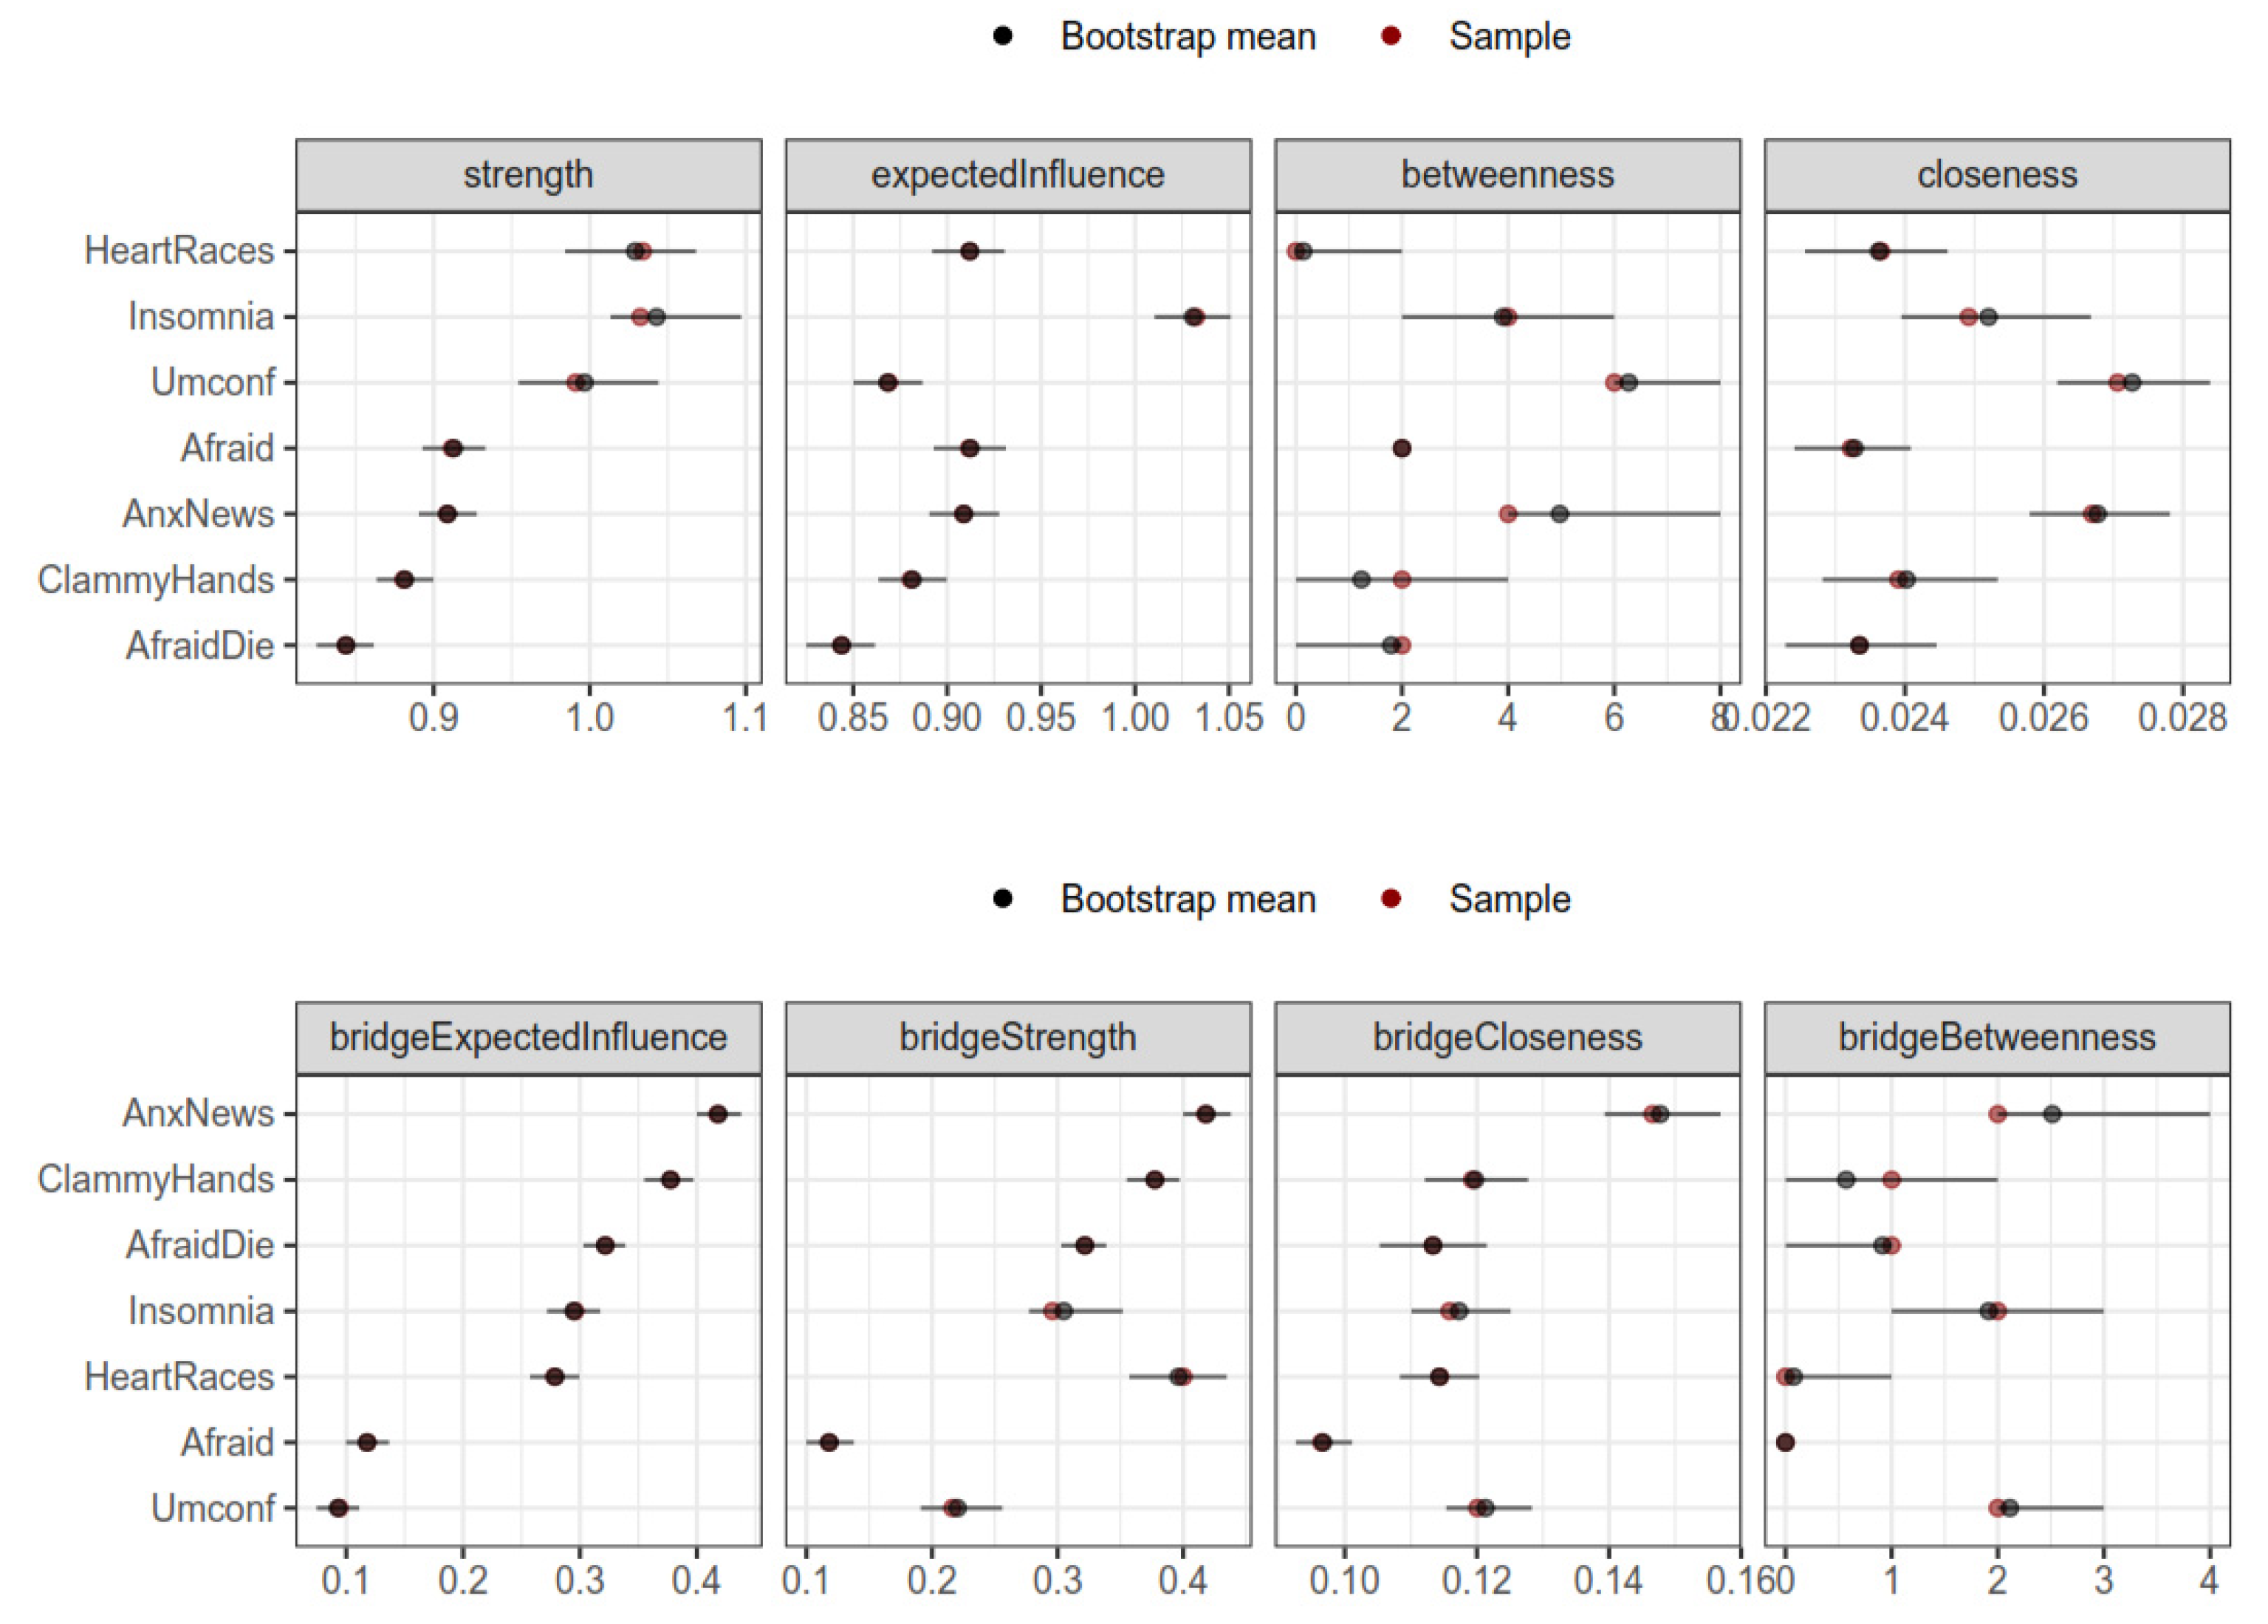
3. Results
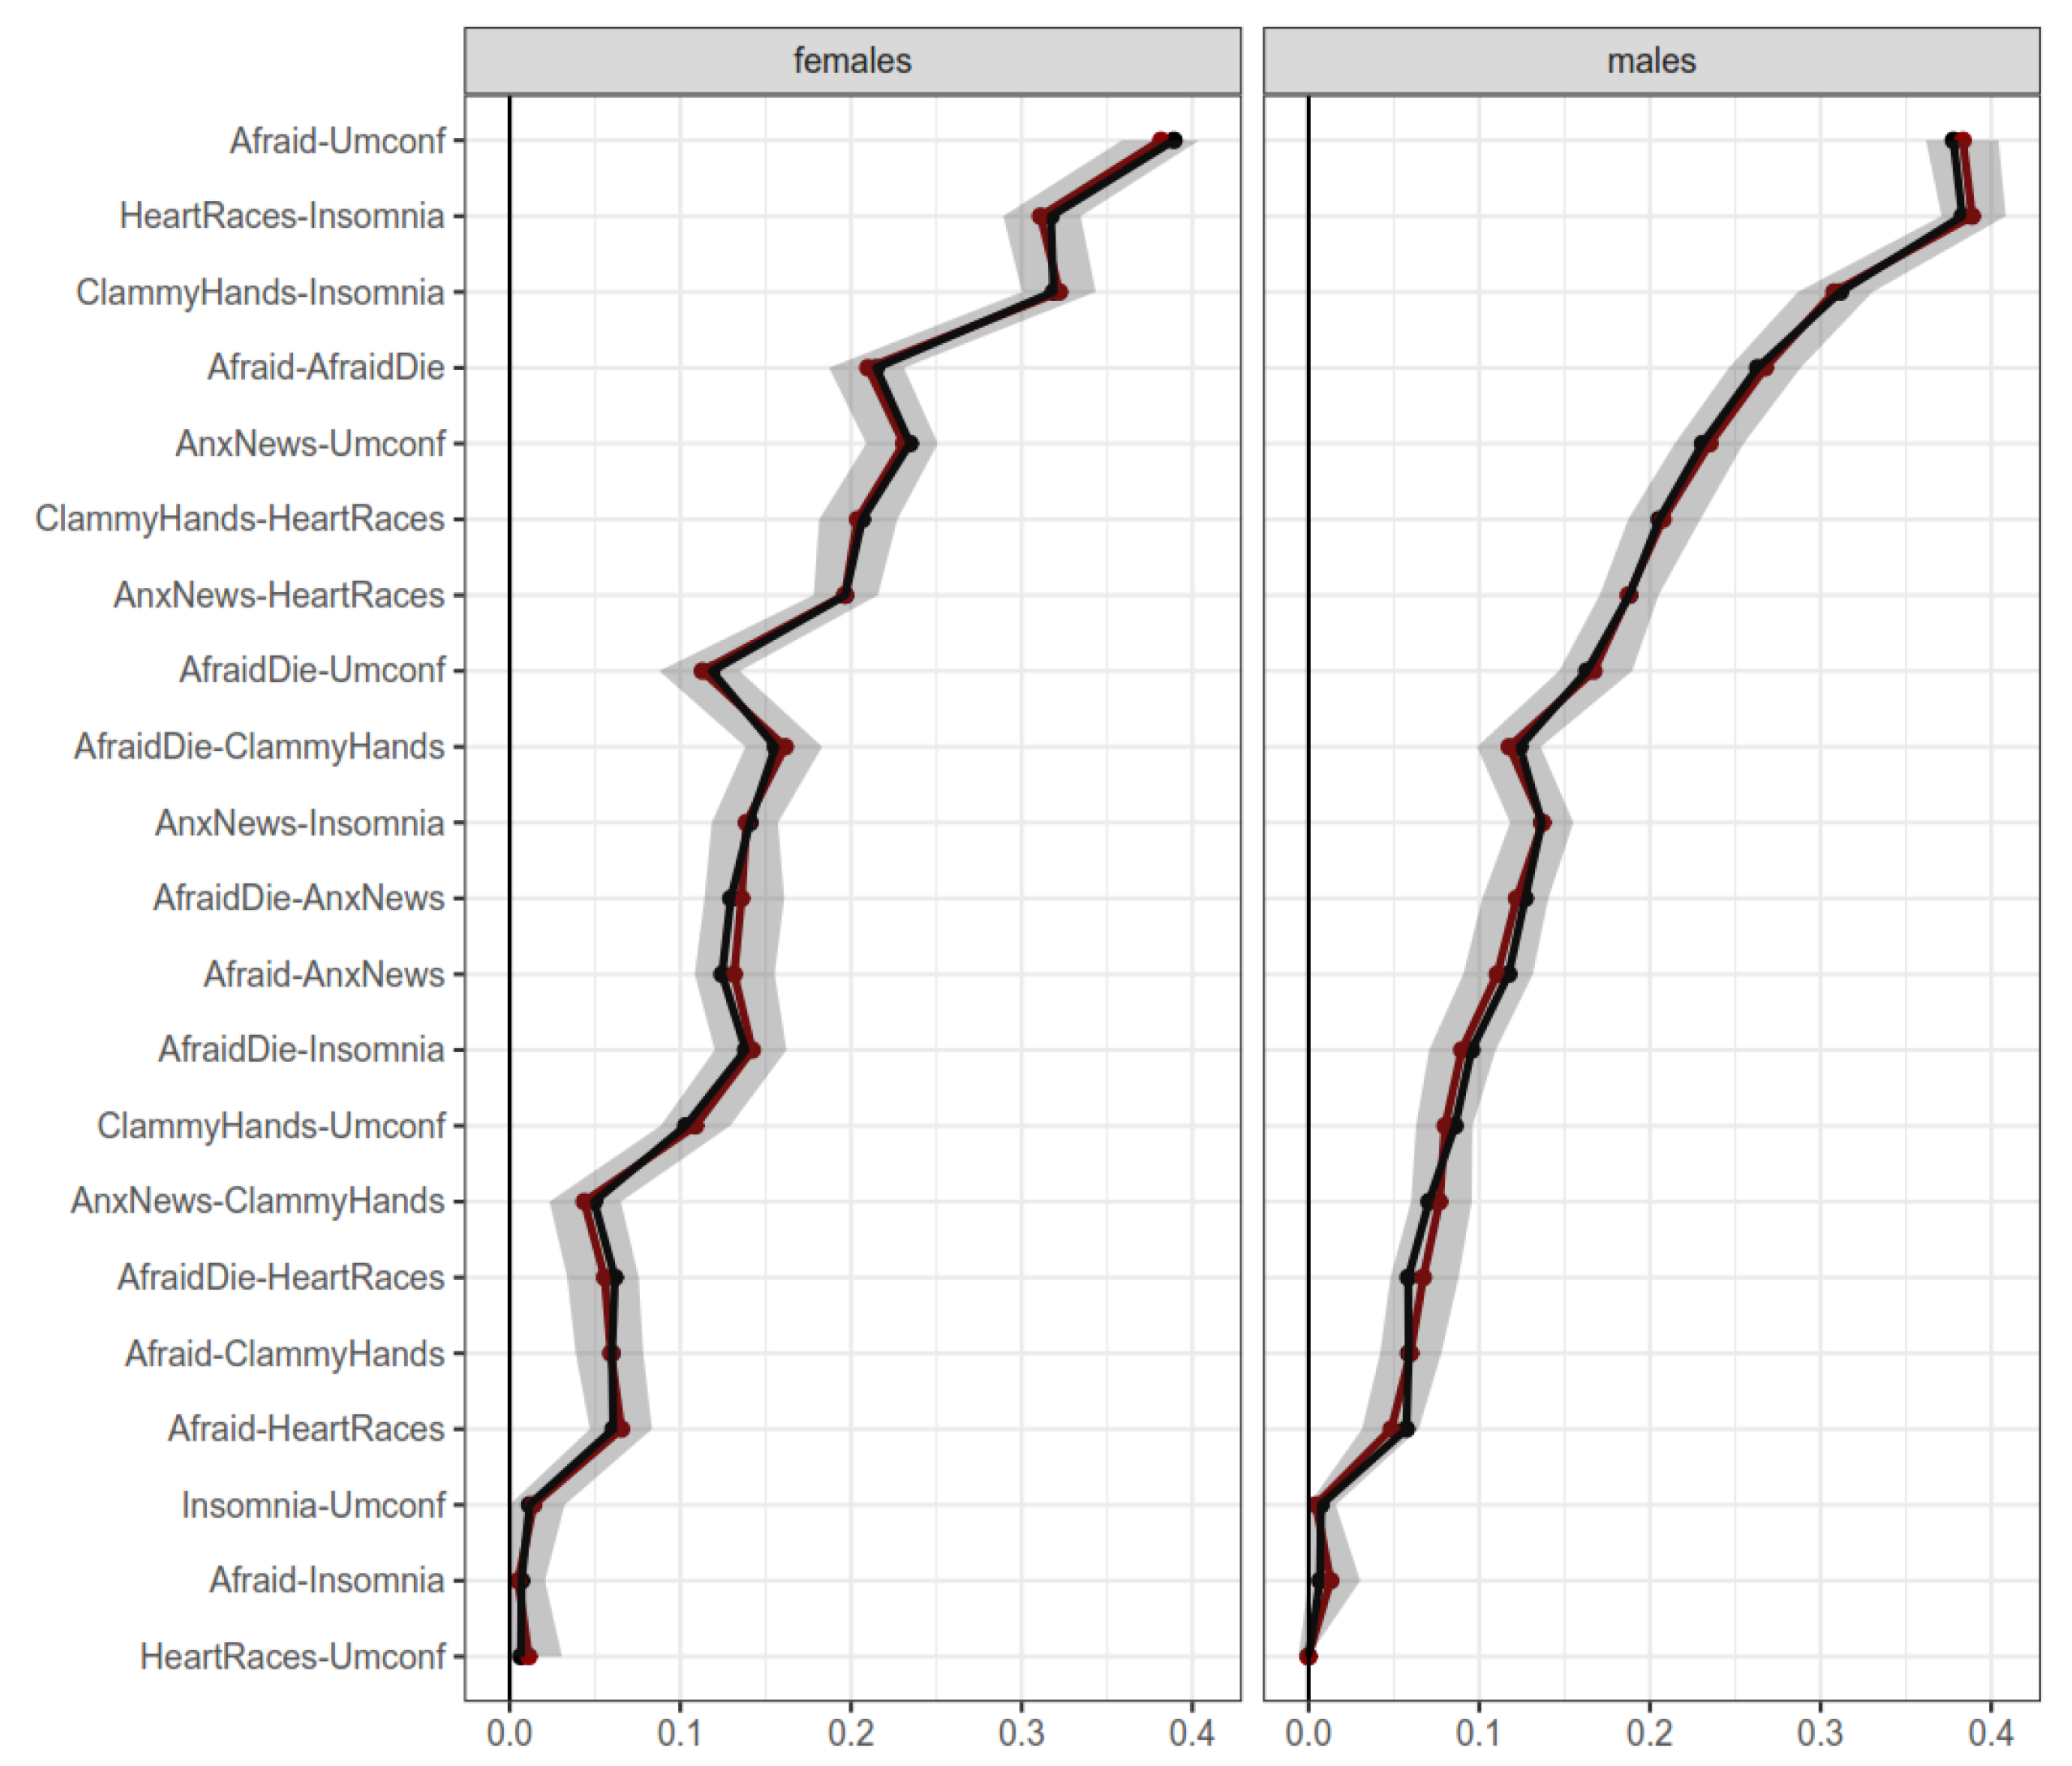
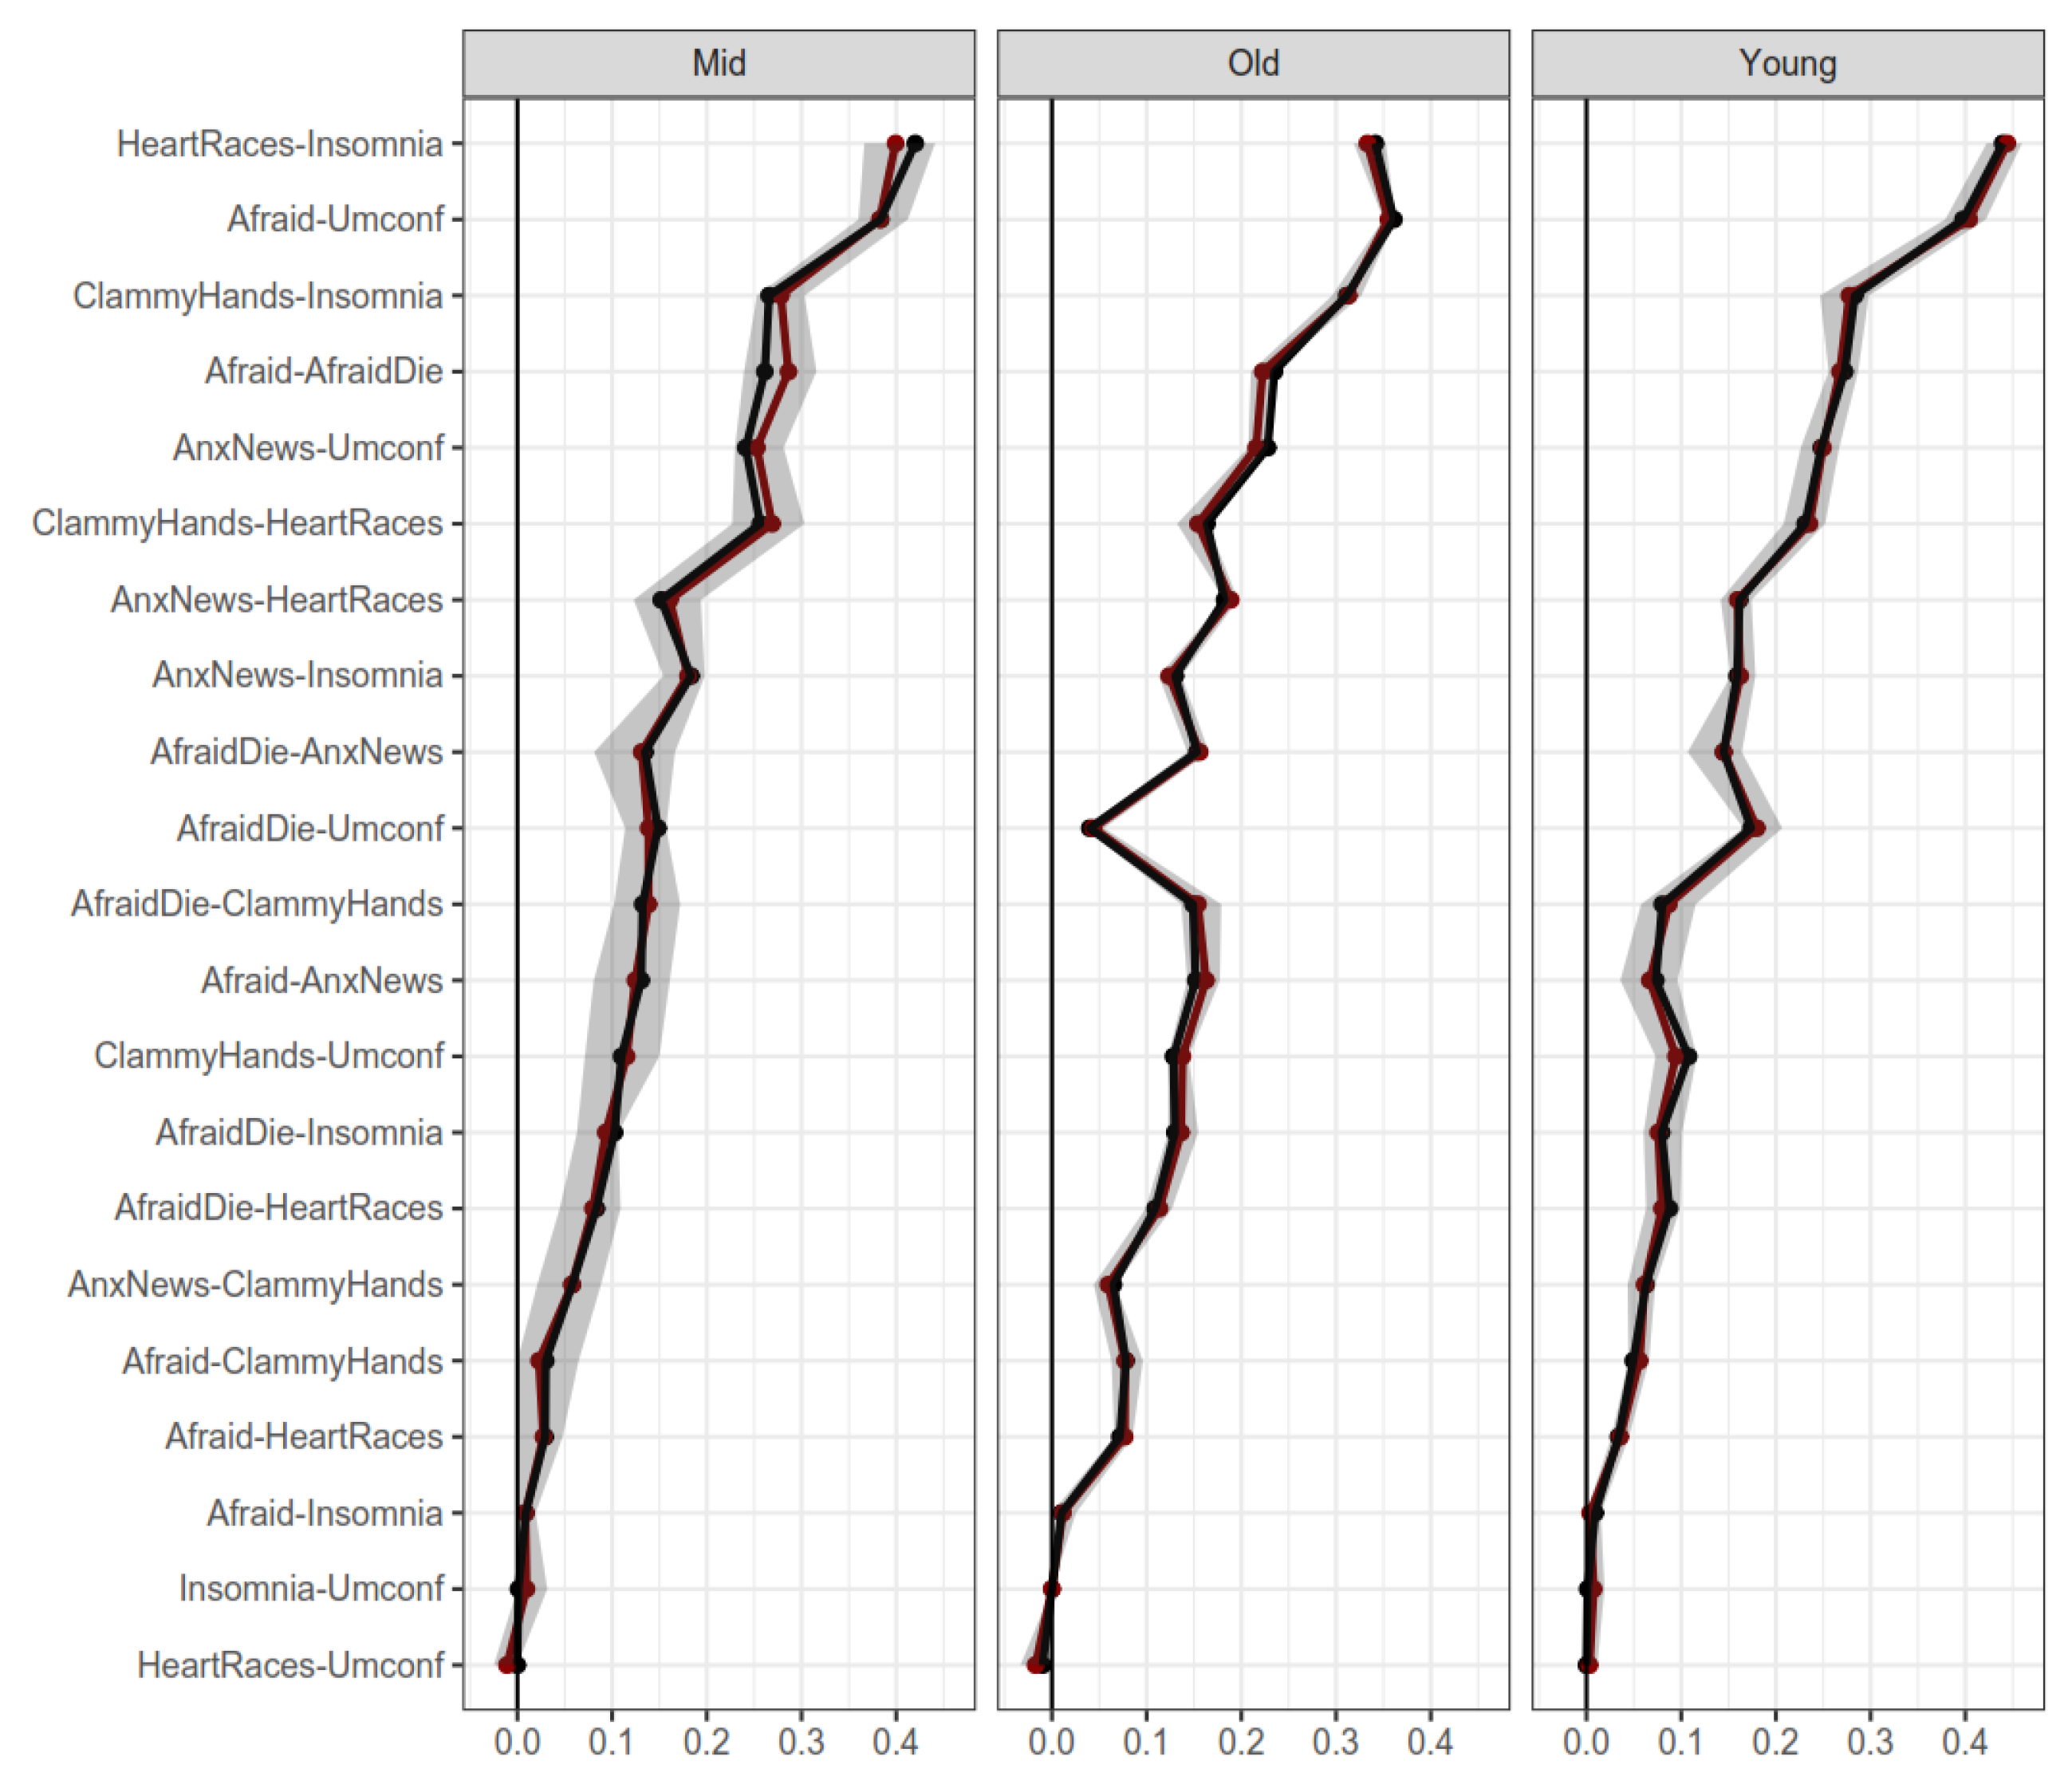
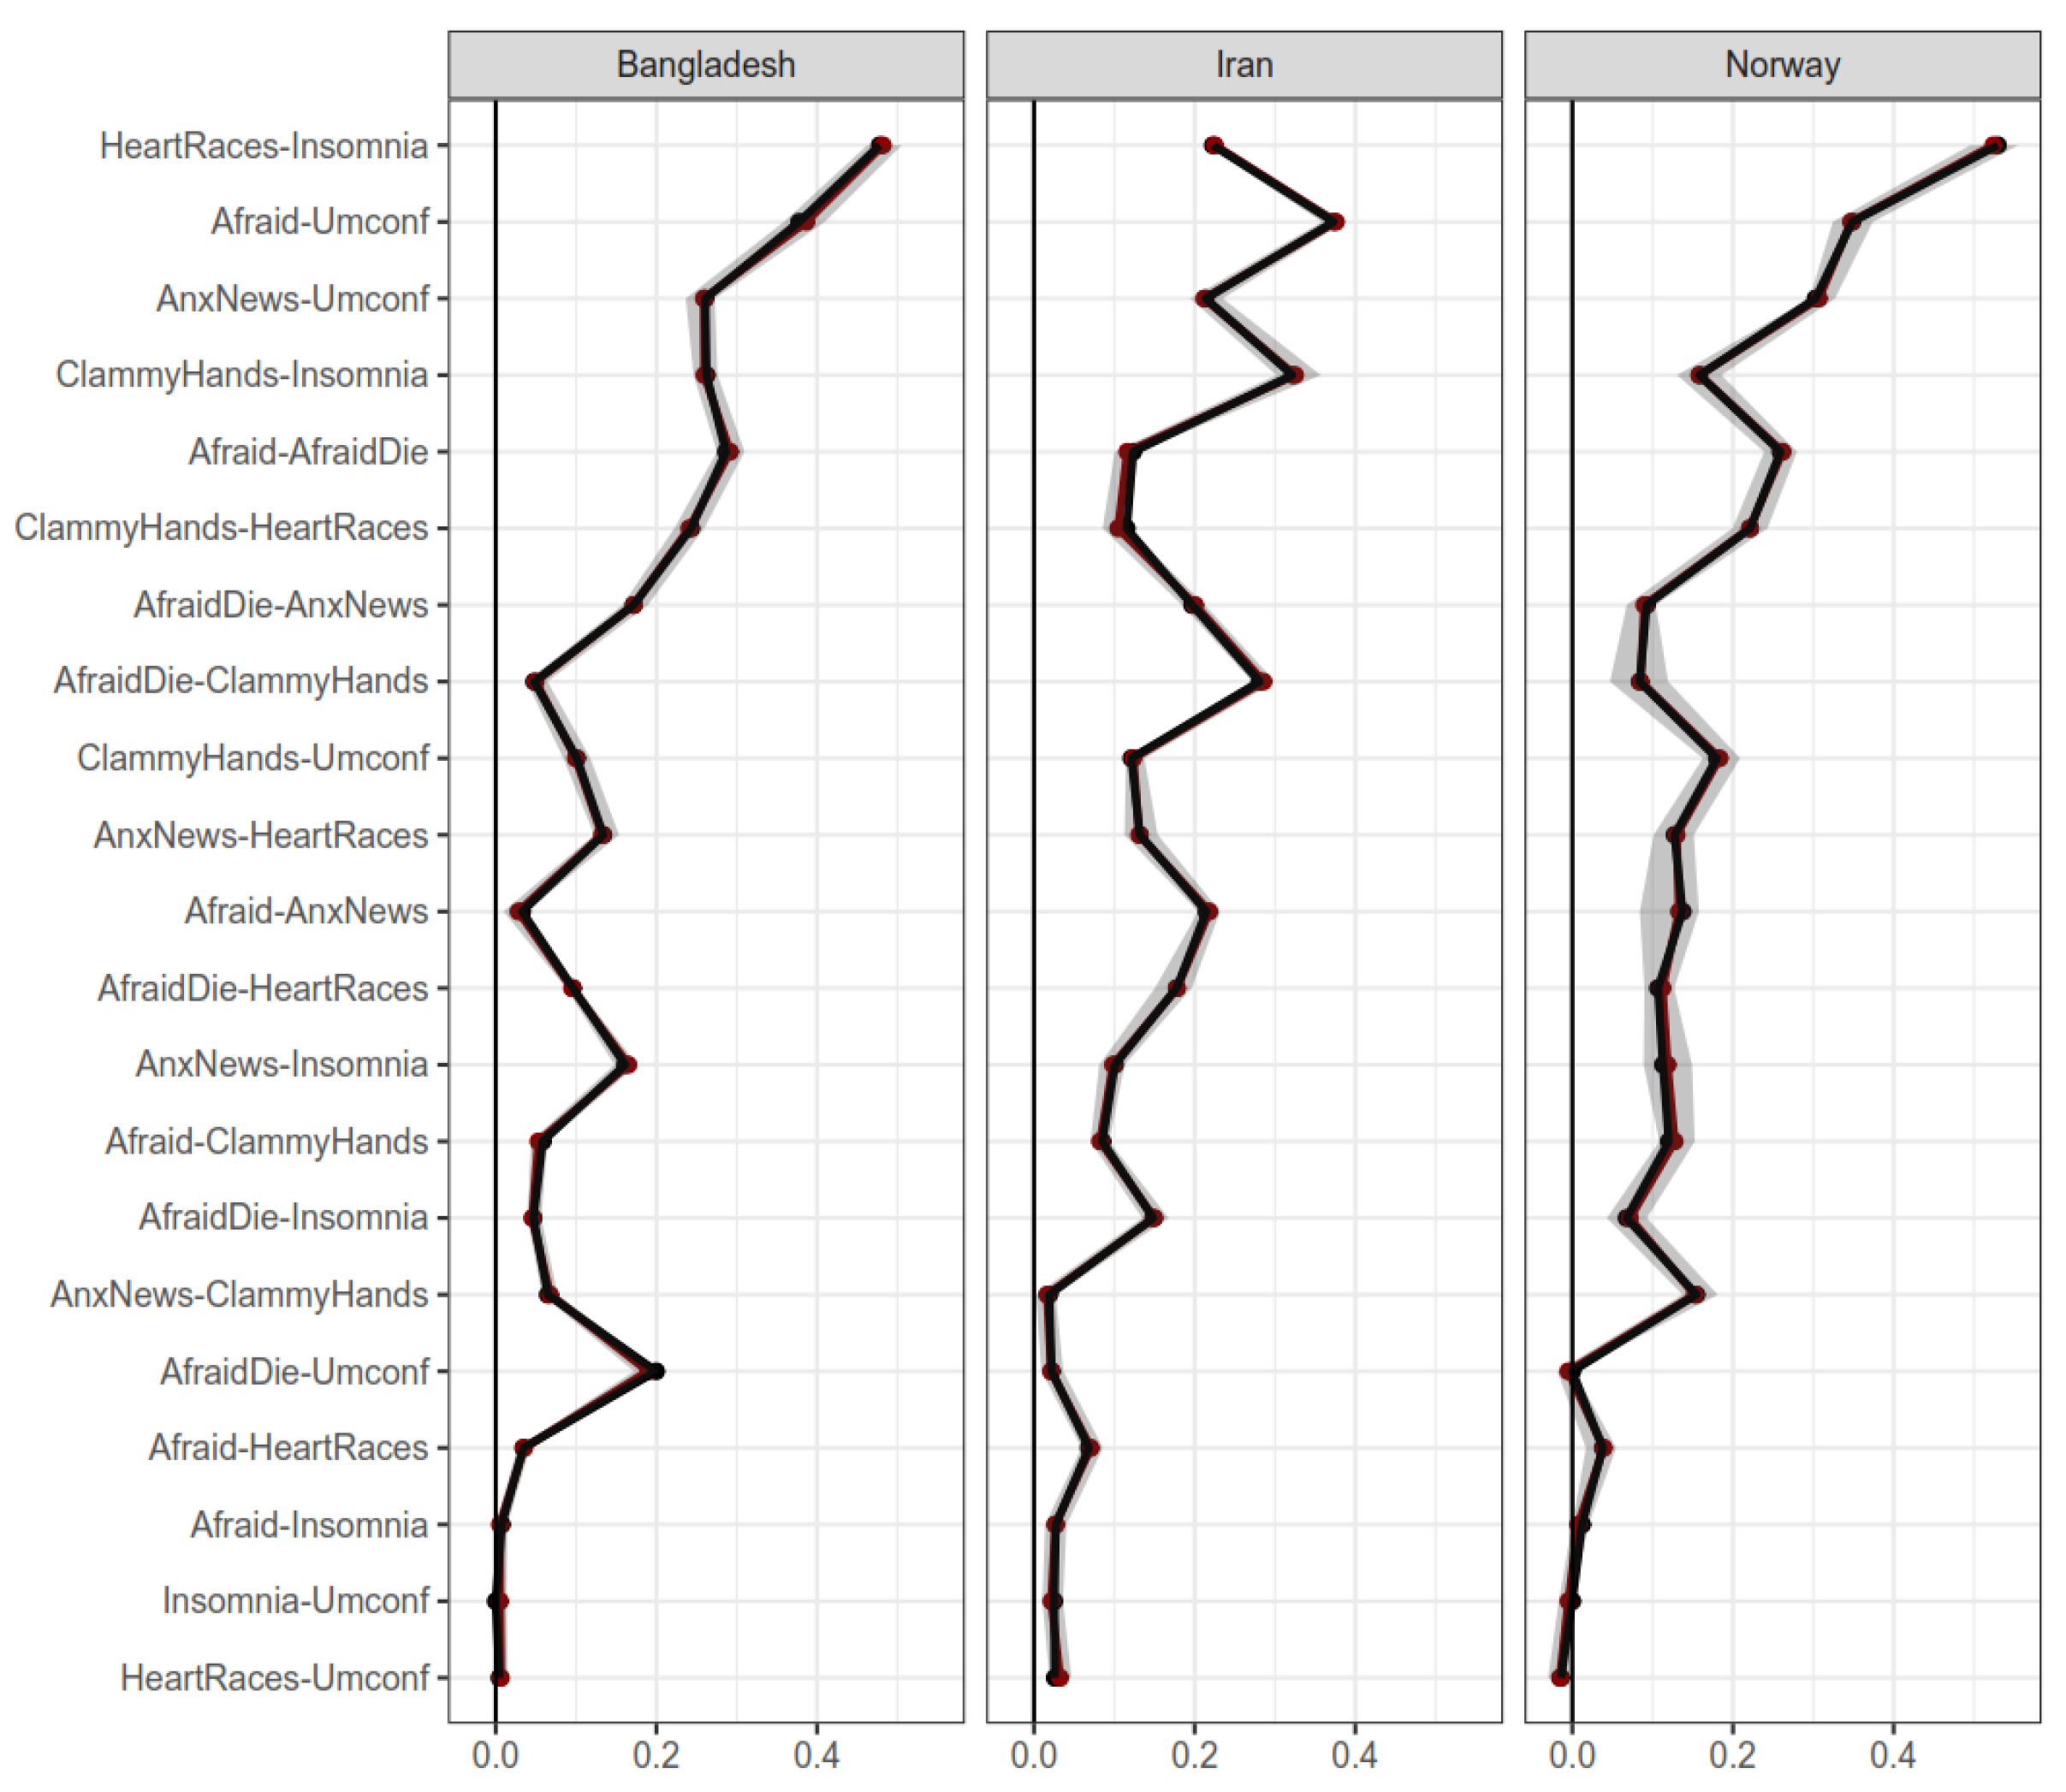
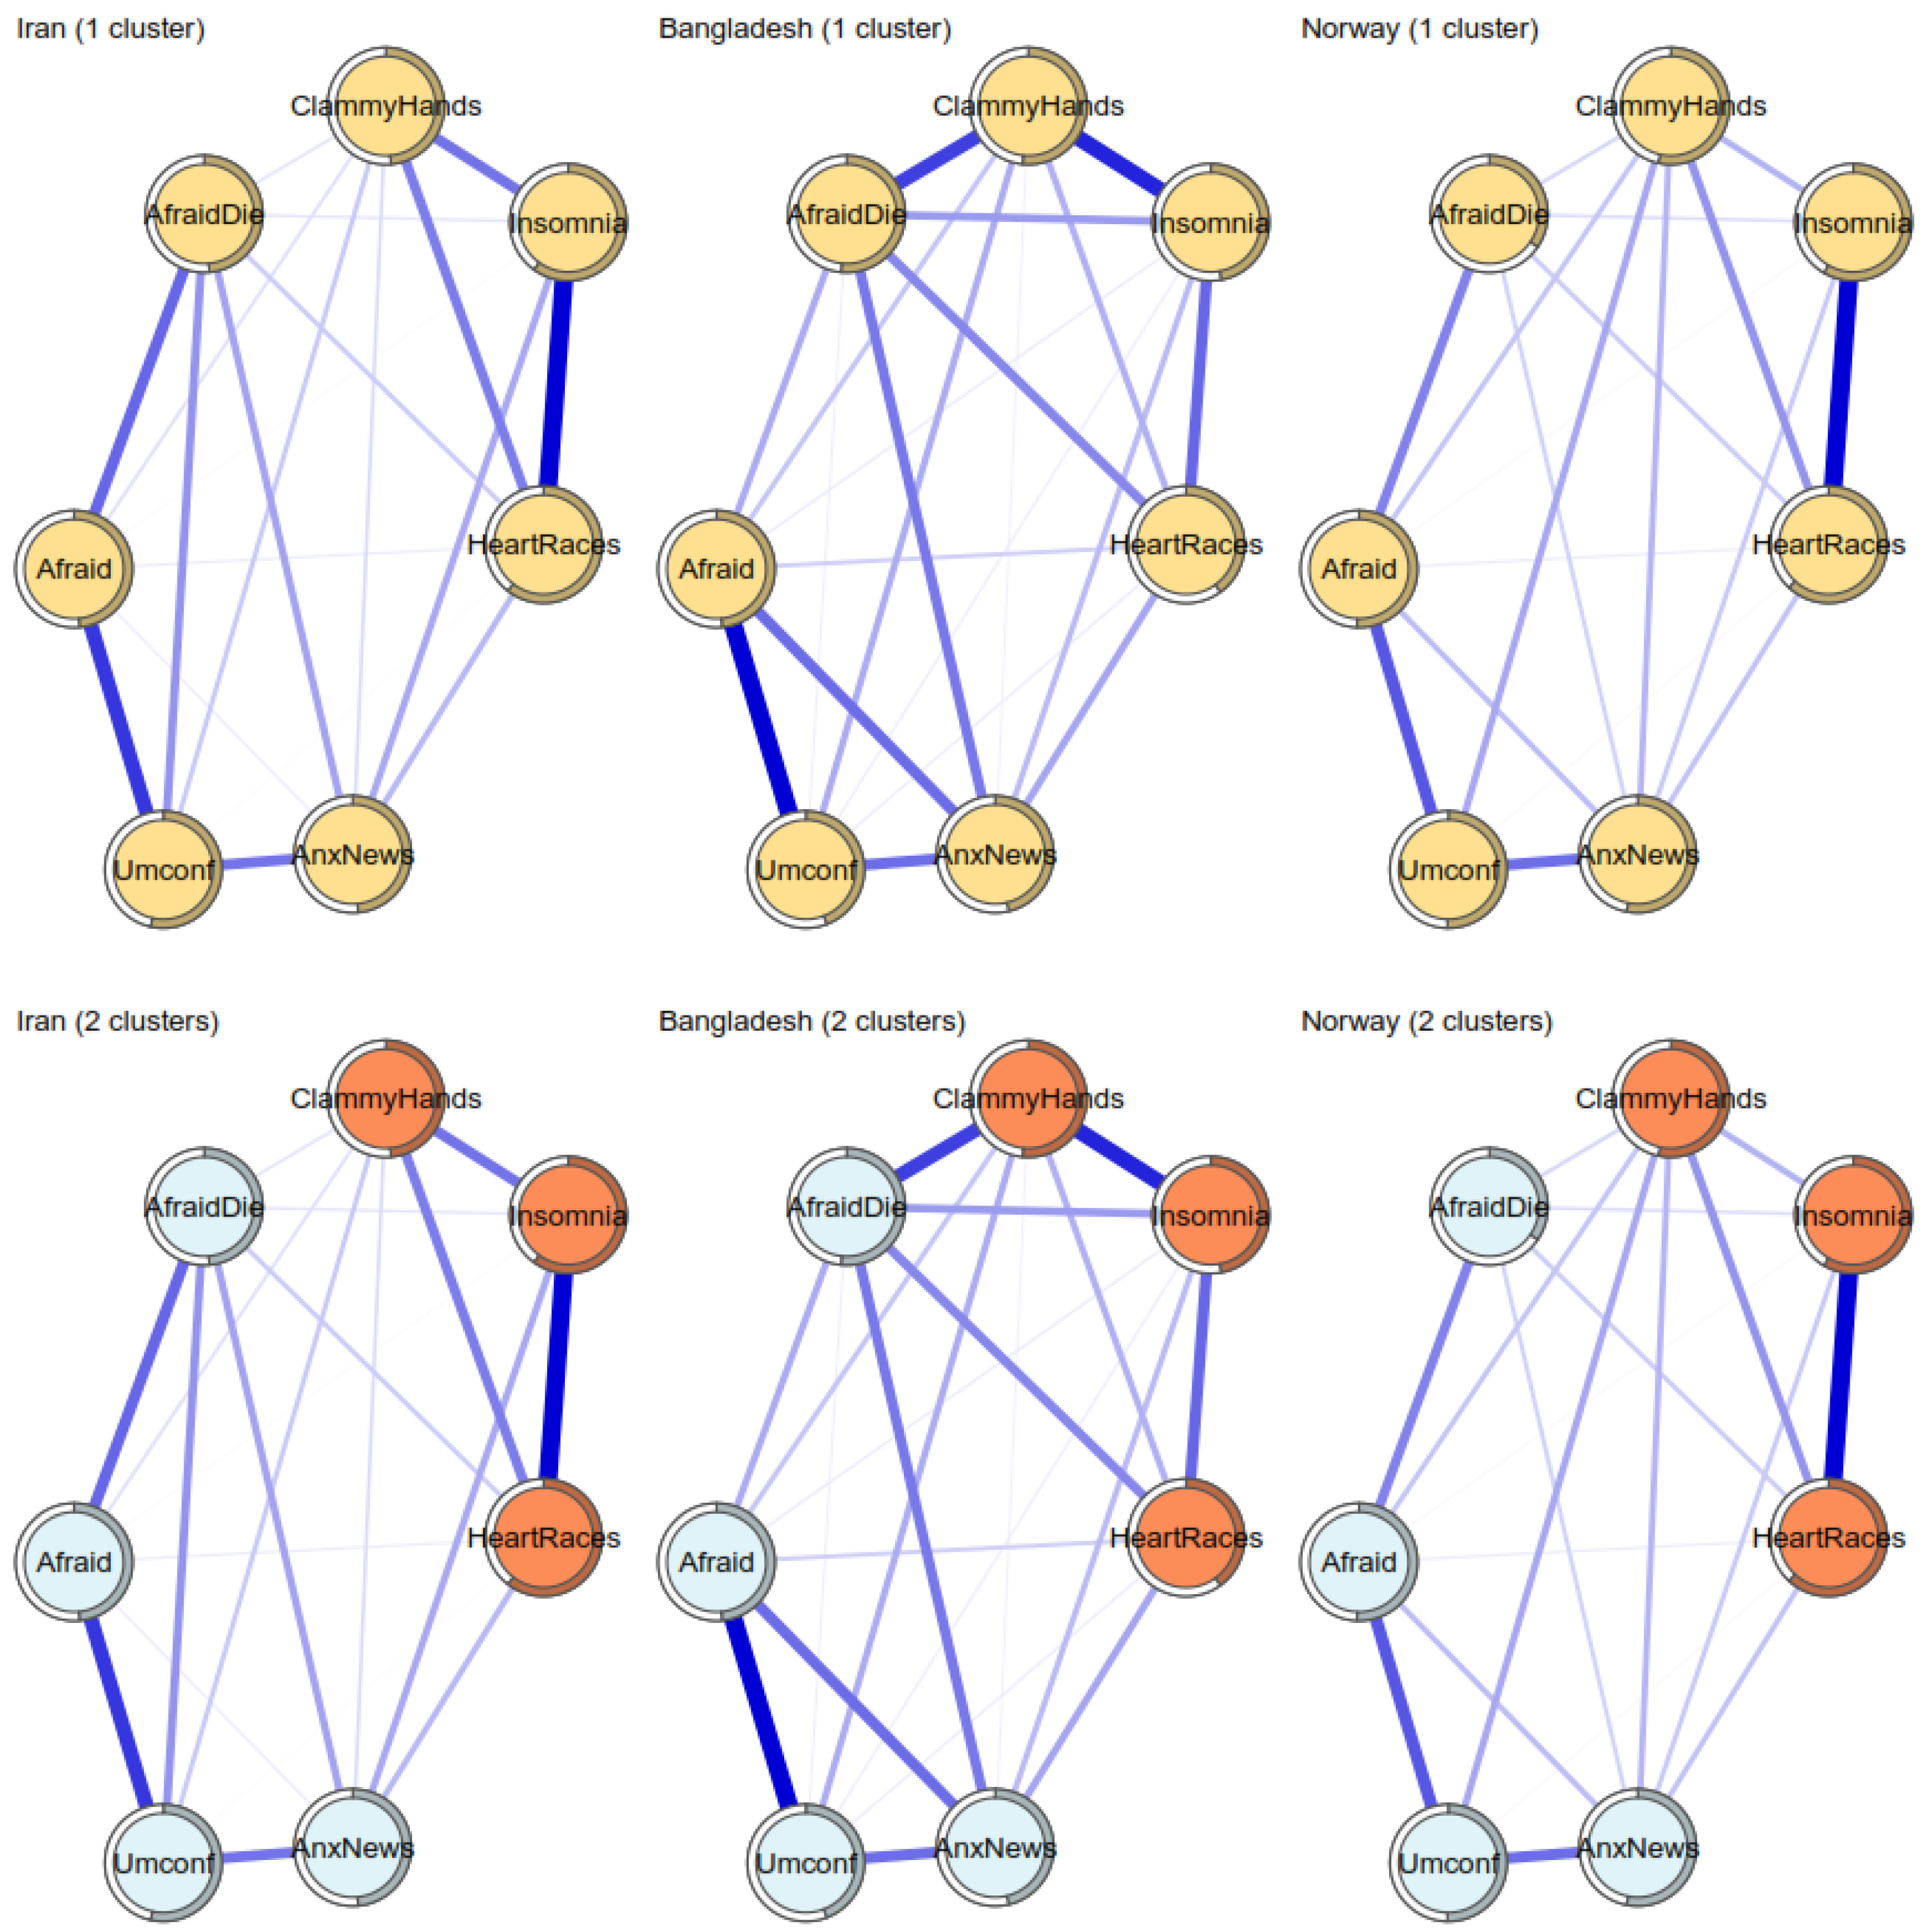
Comparison of Networks
4. Discussion
5. Conclusions
Supplementary Materials
Author Contributions
Funding
Institutional Review Board Statement
Informed Consent Statement
Data Availability Statement
Conflicts of Interest
References
- Worldometer COVID-19 Coronavirus Pandemic American Library Association (ALA). 2022. Available online: https://www.worldometers.info/coronavirus/ (accessed on 27 May 2022).
- Baker, R.E.; Mahmud, A.S.; Miller, I.F.; Rajeev, M.; Rasambainarivo, F.; Rice, B.L.; Takahashi, S.; Tatem, A.J.; Wagner, C.E.; Wang, L.F.; et al. Infectious disease in an era of global change. Nat. Rev. Microbiol. 2022, 20, 193–205. [Google Scholar] [CrossRef] [PubMed]
- United Nations. Global Cooperation Must Adapt to Meet Biggest Threat since Second World War, Secretary-General Says on International Day, as COVID-19 Transcends Borders. Secretary General. SG/SM/20058. 23 April 2020. Available online: https://www.un.org/press/en/2020/sgsm20058.doc.htm (accessed on 21 March 2021).
- Bonanad, C.; García-Blas, S.; Tarazona-Santabalbina, F.; Sanchis, J.; Bertomeu-González, V.; Fácila, L.; Ariza, A.; Núñez, J.; Cordero, A. The effect of age on mortality in patients with COVID-19: A meta-analysis with 611,583 subjects. J. Am. Med. Dir. Assoc. 2020, 21, 915–918. [Google Scholar] [CrossRef] [PubMed]
- Pakpour, A.H.; Liu, C.H.; Hou, W.L.; Chen, Y.P.; Li, Y.P.; Kuo, Y.J.; Lin, C.Y.; Scarf, D. Comparing fear of COVID-19 and preventive COVID-19 infection behaviors between Iranian and Taiwanese older people: Early reaction may be a key. Front. Public Health 2021, 9, 740333. [Google Scholar] [CrossRef] [PubMed]
- Shanafelt, T.; Ripp, J.; Trockel, M. Understanding and addressing sources of anxiety among health care professionals during the COVID-19 pandemic. JAMA 2020, 323, 2133–2134. [Google Scholar] [CrossRef] [PubMed]
- Ahorsu, D.K.; Pramukti, I.; Strong, C.; Wnag, H.W.; Griffiths, M.D.; Lin, C.Y.; Ko, N.Y. COVID-19-related variables and its association with anxiety and suicidal ideation: Differences between international and local university students in Taiwan. Psychol. Res. Behav. Manag. 2021, 14, 1857–1866. [Google Scholar] [CrossRef] [PubMed]
- Hasannia, E.; Mohammadzadeh, F.; Tavakolizadeh, M.; Davoudian, N.; Bay, M. Assessment of the anxiety level and trust in information resources among iranian health-care workers during the pandemic of coronavirus disease 2019. Asian J. Soc. Health Behav. 2021, 4, 163–168. [Google Scholar]
- Patel, B.R.; Khanpara, B.G.; Mehta, P.I.; Patel, K.D.; Marvania, N.P. Evaluation of perceived social stigma and burnout, among health-care workers working in COVID-19 designated hospital of India: A cross-sectional study. Asian J. Soc. Health Behav. 2021, 4, 156–162. [Google Scholar]
- Pramukti, I.; Strong, C.; Sitthimongkol, Y.; Setiawan, A.; Pandin, M.G.R.; Yen, C.F.; Lin, C.Y.; Griffiths, M.D.; Ko, N.Y. Anxiety and suicidal thoughts during the COVID-19 pandemic: A cross-country comparison among Indonesian, Taiwanese, and Thai university students. J. Med. Internet Res. 2020, 22, e24487. [Google Scholar] [CrossRef]
- Shirali, G.A.; Rahimi, Z.; Araban, M.; Mohammadi, M.J.; Cheraghian, B. Social-distancing compliance among pedestrians in Ahvaz, South-West Iran during the Covid-19 pandemic. Asian J. Soc. Health Behav. 2021, 4, 131–136. [Google Scholar]
- Huang, P.C.; Hung, C.H.; Kuo, Y.J.; Chen, Y.P.; Ahorsu, D.K.; Yen, C.F.; Lin, C.Y.; Griffiths, M.D.; Pakpour, A.H. Expanding Protection Motivation Theory to explain willingness of COVID-19 vaccination uptake among Taiwanese university students. Vaccines 2021, 9, 1046. [Google Scholar] [CrossRef]
- Fan, C.W.; Chen, J.S.; Addo, F.M.; Adjaottor, E.S.; Amankwaah, G.B.; Yen, C.F.; Ahorsu, D.K.; Lin, C.Y. Examining the validity of the Drivers of COVID-19 Vaccination Acceptance Scale using Rasch analysis. Expert Rev. Vaccines 2021, 21, 253–260. [Google Scholar] [CrossRef]
- Alimoradi, Z.; Lin, C.Y.; Pakpour, A.H. Coronavirus disease-19 vaccine inequity and gross domestic product. Asian J. Soc. Health Behav. 2021, 4, 129–130. [Google Scholar]
- Chen, I.H.; Ahorsu, D.K.; Ko, N.Y.; Yen, C.F.; Lin, C.Y.; Griffiths, M.D.; Pakpour, A.H. Adapting the Motors of Influenza Vaccination Acceptance Scale into the Motors of COVID-19 Vaccination Acceptance Scale: Psychometric evaluation among mainland Chinese university students. Vaccine 2021, 39, 4510–4515. [Google Scholar] [CrossRef]
- Fan, C.W.; Chen, I.H.; Ko, N.Y.; Yen, C.F.; Lin, C.Y.; Griffiths, M.D.; Pakpour, A.H. Extended theory of planned behavior in explaining the intention to COVID-19 vaccination uptake among mainland Chinese university students: An online survey study. Hum. Vaccines Immunother. 2021, 17, 3413–3420. [Google Scholar] [CrossRef]
- Yeh, Y.C.; Chen, I.H.; Ahorsu, D.K.; Ko, N.Y.; Chen, K.L.; Li, P.C.; Yen, C.F.; Lin, C.Y.; Griffiths, M.D.; Pakpour, A.H. Measurement invariance of the Drivers of COVID-19 Vaccination Acceptance Scale: Comparison between Taiwanese and mainland Chinese-speaking populations. Vaccines 2021, 9, 297. [Google Scholar] [CrossRef]
- Huang, C.; Wang, Y.; Li, X.; Ren, L.; Zhao, J.; Hu, Y.; Zhang, L.; Fan, G.; Xu, J.; Gu, X.; et al. Clinical features of patients infected with 2019 novel coronavirus in Wuhan, China. Lancet 2020, 395, 497–506. [Google Scholar] [CrossRef] [Green Version]
- Lin, C.Y. Social reaction toward the 2019 novel coronavirus (COVID-19). Soc. Health Behav. 2020, 3, 1–2. [Google Scholar] [CrossRef]
- Olashore, A.A.; Akanni, O.O.; Fela-Thomas, A.L.; Khutsafalo, K. The psychological impact of COVID-19 on health-care workers in African Countries: A systematic review. Asian J. Soc. Health Behav. 2021, 4, 85–97. [Google Scholar]
- Patil, S.T.; Datar, M.C.; Shetty, J.V.; Naphade, N.M. Psychological consequences and coping strategies of patients undergoing treatment for COVID-19 at a tertiary care hospital: A qualitative study. Asian J. Soc. Health Behav. 2021, 4, 62–68. [Google Scholar]
- Baud, D.; Qi, X.; Nielsen-Saines, K.; Musso, D.; Pomar, L.; Favre, G. Real estimates of mortality following COVID-19 infection. Lancet Infect. Dis. 2020, 20, 773. [Google Scholar] [CrossRef] [Green Version]
- Bertsimas, D.; Lukin, G.; Mingardi, L.; Nohadani, O.; Orfanoudaki, A.; Stellato, B.; Wiberg, H.; Gonzalez-Garcia, S.; Parra-Calderón, C.L.; Robinson, K.; et al. Hellenic COVID-19 Study Group (2020). COVID-19 mortality risk assessment: An international multi-center study. PLoS ONE 2020, 15, e0243262. [Google Scholar] [CrossRef]
- Chen, J.; Gao, K.; Wang, R.; Wei, G.W. Prediction and mitigation of mutation threats to COVID-19 vaccines and antibody therapies. Chem. Sci. 2021, 12, 6929–6948. [Google Scholar] [CrossRef]
- Notari, A. Temperature dependence of COVID-19 transmission. Sci. Total Environ. 2021, 763, 144390. [Google Scholar] [CrossRef]
- Lin, C.Y.; Hou, W.L.; Mamun, M.A.; da Silva, J.A.; Broche-Pérez, Y.; Ullah, I.; Masuyama, A.; Wakashima, K.; Mailliez, M.; Carre, A.; et al. Fear of COVID-19 Scale (FCV-19S) across countries: Measurement invariance issues. Nurs. Open 2021, 8, 1892–1908. [Google Scholar] [CrossRef]
- Rajabimajd, N.; Alimoradi, Z.; Griffiths, M.D. Impact of COVID-19-related fear and anxiety on job attributes: A systematic review. Asian J. Soc. Health Behav. 2021, 4, 51–55. [Google Scholar] [CrossRef]
- Sharma, R.; Bansal, P.; Chhabra, M.; Bansal, C.; Arora, M. Severe acute respiratory syndrome coronavirus-2-associated perceived stress and anxiety among indian medical students: A cross-sectional study. Asian J. Soc. Health Behav. 2021, 4, 98–104. [Google Scholar] [CrossRef]
- Bhuiyan, A.I.; Sakib, N.; Pakpour, A.H.; Griffiths, M.D.; Mamun, M.A. COVID-19-related suicides in Bangladesh due to lockdown and economic factors: Case study evidence from media reports. Int. J. Ment. Health Addict. 2020, 19, 2110–2115. [Google Scholar] [CrossRef]
- Lin, C.Y.; Broström, A.; Griffiths, M.D.; Pakpour, A.H. Investigating mediated effects of fear of COVID-19 and COVID-19 misunderstanding in the association between problematic social media use and distress/insomnia. Internet Interv. 2020, 21, 100345. [Google Scholar] [CrossRef]
- Qiu, J.; Shen, B.; Zhao, M.; Wang, Z.; Xie, B.; Xu, Y. A nationwide survey of psychological distress among Chinese people in the COVID-19 epidemic: Implications and policy recommendations. Gen. Psychiatry 2020, 33, e100213. [Google Scholar] [CrossRef] [Green Version]
- Taylor, S.; Landry, C.A.; Paluszek, M.M.; Fergus, T.A.; McKay, D.; Asmundson, G.J. Development and initial validation of the COVID Stress Scales. J. Anxiety Disord. 2020, 72, 102232. [Google Scholar] [CrossRef]
- Rogers, R.W.; Prentice-Dunn, S. Protection motivation theory. In Handbook of Health Behavior Research 1: Personal and Social Determinants; Gochman, D.S., Ed.; Plenum Press: New York, NY, USA, 1997; pp. 113–132. [Google Scholar]
- Bloem, J.R.; Salemi, C. COVID-19 and Conflict. World Dev. 2021, 140, 105294. [Google Scholar] [CrossRef] [PubMed]
- Pattavina, A.; Palmieri, M.J. Fears of COVID-19 contagion and the Italian prison system response. Vict. Offenders 2020, 15, 1124–1132. [Google Scholar] [CrossRef]
- Benton, T.G. COVID-19 and disruptions to food systems. Agric. Hum. Values 2020, 37, 577–578. [Google Scholar] [CrossRef] [PubMed]
- Imhoff, R.; Lamberty, P. A bioweapon or a hoax? The link between distinct conspiracy beliefs about the Coronavirus disease (COVID-19) outbreak and pandemic behavior. Soc. Psychol. Pers. Sci. 2020, 11, 1110–1118. [Google Scholar] [CrossRef]
- Dohle, S.; Wingen, T.; Schreiber, M. Acceptance and adoption of protective measures during the COVID-19 pandemic: The role of trust in politics and trust in science. Soc. Psychol. Bull. 2020, 15, 1–23. [Google Scholar] [CrossRef]
- Plohl, N.; Musil, B. Modeling compliance with COVID-19 prevention guidelines: The critical role of trust in science. Psychol. Health Med. 2021, 26, 1–12. [Google Scholar] [CrossRef] [PubMed]
- Ahorsu, D.K.; Lin, C.Y.; Imani, V.; Saffari, M.; Griffiths, M.D.; Pakpour, A.H. The fear of COVID-19 scale: Development and initial validation. Int. J. Ment. Health Addict. 2020, 1–9. [Google Scholar] [CrossRef] [Green Version]
- Chen, I.H.; Chen, C.Y.; Zhao, K.Y.; Gamble, J.H.; Lin, C.Y.; Griffiths, M.D.; Pakpour, A.H. Psychometric evaluation of Fear of COVID-19 Scale (FCV-19S) among Chinese primary and middle schoolteachers, and their students. Curr. Psychol. 2022, 1–17. [Google Scholar] [CrossRef]
- Sawicki, A.J.; Żemojtel-Piotrowska, M.; Balcerowska, J.M.; Sawicka, M.J.; Piotrowski, J.; Sedikides, C.; Jonason, P.K.; Maltby, J.; Adamovic, M.; Agada, M.G.; et al. The Fear of COVID-19 Scale: Its structure and measurement invariance across 48 countries. Psychol. Assess. 2022, 34, 294–310. [Google Scholar] [CrossRef]
- Ullah, I.; Tahir, M.J.; Ali, S.; Waseem, R.; Griffiths, M.D.; Mamun, M.A.; Lin, C.Y.; Pakpour, A.H. COVID-19 fear among Pakistanis: Psychometric evaluation of the Fear of COVID-19 Scale using Item response theory and confirmatory factor analysis. Int. J. Ment. Health Addict. 2021, 1–16. [Google Scholar] [CrossRef]
- Alyami, M.; Henning, M.; Krägeloh, C.U.; Alyami, H. Psychometric evaluation of the Arabic version of the Fear of COVID-19 Scale. Int. J. Ment. Health Addict. 2021, 19, 2219–2232. [Google Scholar] [CrossRef]
- Cavalheiro, F.R.S.; Sticca, M.G. Adaptation and validation of the Brazilian version of the fear of COVID-19 scale. Int. J. Ment. Health Addict. 2020, 20, 921–929. [Google Scholar] [CrossRef]
- Chang, K.C.; Hou, W.L.; Pakpour, A.H.; Lin, C.Y.; Griffiths, M.D. Psychometric testing of three COVID-19-related scales among people with mental illness. Int. J. Ment. Health Addict. 2022, 20, 324–336. [Google Scholar] [CrossRef]
- Mailliez, M.; Griffiths, M.D.; Carre, A. Validation of the French version of the Fear of COVID-19 Scale and its associations with depression, anxiety and differential emotions. Int. J. Ment. Health Addict. 2021, 1–15. [Google Scholar] [CrossRef]
- Wakashima, K.; Asai, K.; Kobayashi, D.; Koiwa, K.; Kamoshida, S.; Sakuraba, M. The Japanese version of the Fear of COVID-19 Scale: Reliability, validity, and relation to coping behavior. PLoS ONE 2020, 15, e0241958. [Google Scholar] [CrossRef]
- Barrios, I.; Ríos-González, C.; O’Higgins, M.; González-Urbieta, I.; García, O.; Almirón-Santacruz, J.; Navarro, R.; Melgarejo, O.; Ruiz Díaz, N.; Castaldelli-Maia, J.M.; et al. Psychometric properties of the Spanish version of the Fear of COVID-19 Scale in Paraguayan population. Ir. J. Psychol. Med. 2021, 38, 266–271. [Google Scholar] [CrossRef]
- Bitan, D.T.; Grossman-Giron, A.; Bloch, Y.; Mayer, Y.; Shiffman, N.; Mendlovic, S. Fear of COVID-19 Scale: Psychometric characteristics, reliability and validity in the Israeli population. Psychiatry Res. 2020, 289, 113100. [Google Scholar] [CrossRef]
- Iversen, M.M.; Norekvål, T.M.; Oterhals, K.; Fadnes, L.T.; Mæland, S.; Pakpour, A.H.; Breivik, K. Psychometric properties of the Norwegian version of the Fear of COVID-19 Scale. Int. J. Ment. Health Addict. 2021, 1–19. [Google Scholar] [CrossRef]
- Midorikawa, H.; Aiba, M.; Lebowitz, A.; Taguchi, T.; Shiratori, Y.; Ogawa, T.; Takahashi, A.; Takahashi, S.; Nemoto, K.; Arai, T.; et al. Confirming validity of the Fear of COVID-19 Scale in Japanese with a nationwide large-scale sample. PLoS ONE 2021, 16, e0246840. [Google Scholar] [CrossRef]
- Reznik, A.; Gritsenko, V.; Konstantinov, V.; Khamenka, N.; Isralowitz, R. COVID-19 fear in Eastern Europe: Validation of the Fear of COVID-19 Scale. Int. J. Ment. Health Addict. 2021, 19, 1903–1908. [Google Scholar] [CrossRef]
- Caycho-Rodríguez, T.; Tomás, J.M.; Barboza-Palomino, M.; Ventura-León, J.; Gallegos, M.; Reyes-Bossio, M.; Vilca, L.W. Assessment of fear of COVID-19 in older adults: Validation of the Fear of COVID-19 Scale. Int. J. Ment. Health Addict. 2021, 20, 1231–1245. [Google Scholar] [CrossRef] [PubMed]
- Huarcaya-Victoria, J.; Villarreal-Zegarra, D.; Podestà, A.; Luna-Cuadros, M.A. Psychometric properties of a Spanish version of the Fear of COVID-19 Scale in general population of Lima, Peru. Int. J. Ment. Health Addict. 2022, 20, 249–262. [Google Scholar] [CrossRef] [PubMed]
- Masuyama, A.; Shinkawa, H.; Kubo, T. Validation and psychometric properties of the Japanese version of the Fear of COVID-19 Scale among adolescents. Int. J. Ment. Health Addict. 2020, 20, 387–397. [Google Scholar] [CrossRef] [PubMed]
- Borgatti, S.P.; Mehra, A.; Brass, D.J.; Labianca, G. Network analysis in the social sciences. Science 2009, 323, 892–895. [Google Scholar] [CrossRef] [Green Version]
- Borsboom, D.; Deserno, M.K.; Rhemtulla, M.; Epskamp, S.; Fried, E.I.; McNally, R.J.; Robinaugh, D.J.; Perugini, M.; Dalege, J.; Costantini, G.; et al. Network analysis of multivariate data in psychological science. Nat. Rev. Methods Primers 2021, 1, 58. [Google Scholar] [CrossRef]
- Bringmann, L.F.; Albers, C.; Bockting, C.; Borsboom, D.; Ceulemans, E.; Cramer, A.; Epskamp, E.; Eronen, E.I.; Hamaker, E.; Kuppens, P.; et al. Psychopathological networks: Theory, methods and practice. Behav. Res. Ther. 2022, 149, 104011. [Google Scholar] [CrossRef]
- Costantini, G.; Epskamp, S.; Borsboom, D.; Perugini, M.; Mõttus, R.; Waldorp, L.J.; Cramer, A.O. State of the aRt personality research: A tutorial on network analysis of personality data in R. J. Res. Pers. 2015, 54, 13–29. [Google Scholar] [CrossRef]
- Dalege, J.; Borsboom, D.; van Harreveld, F.; van der Maas, H.L. Network analysis on attitudes: A brief tutorial. Soc. Psychol. Pers. Sci. 2017, 8, 528–537. [Google Scholar] [CrossRef]
- Briganti, G.; Scutari, M.; Linkowski, P. Network structures of symptoms from the Zung Depression Scale. Psychol. Rep. 2021, 124, 1897–1911. [Google Scholar] [CrossRef]
- Lecuona, O.; García-Rubio, C.; de Rivas, S.; Moreno-Jiménez, J.E.; Meda-Lara, R.M.; Rodríguez-Carvajal, R. A network analysis of the Five Facets Mindfulness Questionnaire (FFMQ). Mindfulness 2021, 12, 2281–2294. [Google Scholar] [CrossRef]
- Li, L.; Niu, Z.; Mei, S.; Griffiths, M.D. A network analysis approach to the relationship between fear of missing out (FoMO), smartphone addiction, and social networking site use among a sample of Chinese university students. Comput. Hum. Behav. 2021, 128, 107086. [Google Scholar] [CrossRef]
- Marcus, D.K.; Preszler, J.; Zeigler-Hill, V. A network of dark personality traits: What lies at the heart of darkness? J. Res. Pers. 2018, 73, 56–62. [Google Scholar] [CrossRef]
- McMally, R.J. Network analysis of psychopathology: Controversies and challenges. Annu. Rev. Clin. Psychol. 2021, 17, 31–53. [Google Scholar] [CrossRef]
- Ahorsu, D.K.; Lin, C.Y.; Yahaghai, R.; Alimoradi, Z.; Broström, A.; Griffiths, M.D.; Pakpour, A.H. The mediational role of trust in the healthcare system in the association between generalized trust and willingness to get COVID-19 vaccination in Iran. Hum. Vaccines Immunother. 2022, 18, 1–8. [Google Scholar] [CrossRef]
- Askim, J.; Bergström, T. Between lockdown and calm down. Comparing the COVID-19 responses of Norway and Sweden. Local Gov. Stud. 2021, 48, 179–190. [Google Scholar] [CrossRef]
- Beisland, E.G.; Gjeilo, K.H.; Andersen, J.R.; Bratås, O.; Bø, B.; Haraldstad, K.; Iversen, M.M.; Løyland, B.; Norekvål, T.M.; Riiser, K.; et al. Quality of life and fear of COVID-19 in 2600 baccalaureate nursing students at five universities: A cross-sectional study. Health Qual. Life Outcomes 2021, 19, 198. [Google Scholar] [CrossRef]
- Sakib, N.; Bhuiyan, A.; Hossain, S.; Al Mamun, F.; Hosen, I.; Abdullah, A.H.; Sarker, M.A.; Mohiuddin, M.S.; Rayhan, I.; Hossain, M.; et al. Psychometric validation of the Bangla Fear of COVID-19 Scale: Confirmatory factor Analysis and Rasch analysis. Int. J. Ment. Health Addict. 2020, 1–12. [Google Scholar] [CrossRef]
- Epskamp, S.; Borsboom, D.; Fried, E.I. Estimating psychological networks and their accuracy: A tutorial paper. Behav. Res. Methods 2018, 50, 195–212. [Google Scholar] [CrossRef] [Green Version]
- Epskamp, S.; Fried, E.I. A tutorial on regularized partial correlation networks. Psychol. Methods 2018, 23, 617–634. [Google Scholar] [CrossRef] [Green Version]
- Mullarkey, M.C.; Stewart, R.A.; Wells, T.T.; Shumake, J.; Beevers, C.G. Self-dislike and sadness are central symptoms of depression in college students: A network analysis. PsyArXiv 2018. [Google Scholar] [CrossRef]
- Golino, H.; Epskamp, S. Exploratory graph analysis: A new approach for estimating the number of dimensions in psychological research. PLoS ONE 2017, 12, e0174035. [Google Scholar] [CrossRef] [Green Version]
- Golino, H.; Shi, D.; Garrido, L.; Christensen, A.; Nieto, M.D.; Sadana, R.; Thiyagarajan, J.A.; Pérez-Molina, A. Investigating the performance of exploratory graph analysis and traditional techniques to identify the number of latent factors: A simulation and tutorial. Psychol. Methods 2020, 25, 292–320. [Google Scholar] [CrossRef] [Green Version]
- Golino, H.; Moulder, R.; Shi, D.; Christensen, A.P.; Nieto, M.D.; Nesselroade, J.R.; Sadana, R.; Thiyagarajan, J.A.; Boker, S.M. Entropy fit index: New fit measures for assessing the structure and dimensionality of multiple latent variables. Multivar. Behav. Res. 2021, 56, 874–902. [Google Scholar] [CrossRef]
- Bringmann, L.F.; Elmer, T.; Epskamp, S.; Krause, R.W.; Schoch, D.; Wichers, M.; Wigman, J.T.W.; Snippe, E. What do centrality measures measure in psychological networks? J. Abnorm. Psychol. 2019, 128, 892–903. [Google Scholar] [CrossRef] [Green Version]
- Jones, P.J.; Ma, R.; McNally, R.J. Bridge centrality: A network approach to understanding comorbidity. Multivar. Behav. Res. 2021, 56, 353–367. [Google Scholar] [CrossRef]
- Costantini, G.; Epskamp, S.; Costantini, M.G. Package “EstimateGroupNetwork” (0.3.1). Available online: https://cloud.r-project.org/web/packages/EstimateGroupNetwork/EstimateGroupNetwork.pdf (accessed on 21 March 2021).
- Fried, E.I.; Eidhof, M.B.; Palic, S.; Costantini, G.; Huisman-van Dijk, H.M.; Bockting, C.L.H.; Engelhard, I.; Armour, C.; Nielsen, A.B.S.; Karstoft, K.I. Replicability and Generalizability of Posttraumatic Stress Disorder (PTSD) Networks: A Cross-Cultural Multisite Study of PTSD Symptoms in Four Trauma Patient Samples. Clin. Psychol. Sci. 2018, 6, 335–351. [Google Scholar] [CrossRef]
- R Development Core Team. R: A Language and Environment for Statistical Computing; R Foundation for Statistical Computing: Vienna, Austria. Available online: http://www.r-project.org/ (accessed on 21 March 2021).
- Rewelle, W. psych: Procedures for Personality and Psychological Research, Version 1.4.8; Northwestern University: Evanston, IL, USA. Available online: http://cran.r-project.org/package=psych (accessed on 21 March 2021).
- Haslbeck, J.M.B.; Waldorp, L.J. mgm: Estimating time-varying mixed graphical models in high-dimensional data. arXiv 2015, arXiv:1510.06871. [Google Scholar] [CrossRef]
- Jones, P.; Networktools: Tools for Identifying Important Nodes in Networks. R Package, Version 1.2.3. Available online: https://cran-r-project.org/web/packages/networktools/ (accessed on 21 March 2021).
- Golino, H.; Christensen, A. EGAnet: Exploratory Graph Analysis—A Framework for Estimating the Number of Dimensions in Multivariate Data Using Network Psychometrics; R Package Version 0.8.0; EGAnet: Berlin, Germany, 2019; Available online: https://cran.r-project.org/web/packages/EGAnet/index.html (accessed on 27 May 2022).
- Rosseel, Y. lavaan: An R package for structural equation modeling. J. Stat. Softw. 2012, 48, 1–36. [Google Scholar] [CrossRef] [Green Version]
- Pakpour, A.H.; Griffiths, M.D.; Lin, C.Y. Assessing the psychological response to the COVID-19: A response to Bitan et al. “Fear of COVID-19 scale: Psychometric characteristics, reliability and validity in the Israeli population”. Psychiatry Res. 2020, 290, 113127. [Google Scholar] [CrossRef] [PubMed]
- Reise, S.P.; Kim, D.S.; Mansolf, M.; Widaman, K.F. Is the bifactor model a better model or is it just better at modeling implausible responses? Application of iteratively reweighted least squares to the Rosenberg Self-Esteem Scale. Multivar. Behav. Res. 2016, 51, 818–838. [Google Scholar] [CrossRef] [PubMed] [Green Version]
- Cori, L.; Curzio, O.; Adorni, F.; Prinelli, F.; Noale, M.; Trevisan, C.; Fortunato, L.; Giacomelli, A.; Bianchi, F. Fear of COVID-19 for Individuals and Family Members: Indications from the National Cross-Sectional Study of the EPICOVID19 Web-Based Survey. Int. J. Environ. Res. Public Health 2021, 18, 3248. [Google Scholar] [CrossRef] [PubMed]
- Lozano-Blasco, R.; Quilez-Robres, A.; Delgado-Bujedo, D.; Latorre-Martínez, M.P. YouTube’s growth in use among children 0–5 during COVID19: The Occidental European case. Technol. Soc. 2021, 66, 101648. [Google Scholar] [CrossRef] [PubMed]
- Elboj-Saso, C.; Cortés-Pascual, A.; Íñiguez-Berrozpe, T.; Lozano-Blasco, R.; Quílez-Robres, A. Emotional and Educational Accompaniment through Dialogic Literary Gatherings: A Volunteer Project for Families Who Suffer Digital Exclusion in the Context of COVID-19. Sustainability 2021, 13, 1206. [Google Scholar] [CrossRef]
- Jimenez, M.; Abad, F.J.; Garcia-Garzon, E.; Golino, H.; Christensen, A.P.; Garrido, L.E.; Dimensionality assessment in generalized bi-factor structures: A network psychometrics approach. PsyArXiv 2022. Available online: https://psyarxiv.com/2ujdk/ (accessed on 27 May 2022).
- Ferrando, P.J.; Lorenzo-Seva, U. Program FACTOR at 10: Origins, development and future directions. Psicothema 2017, 29, 236–241. [Google Scholar] [CrossRef]
- Jones, P.J.; Mair, P.; McNally, R.J. Visualizing psychological networks: A tutorial in R. Front. Psychol. 2018, 9, 1742. [Google Scholar] [CrossRef] [Green Version]


| Items | Overall (N = 24,429) | Men (N = 10,149) | Women (N = 11,657) | |||
|---|---|---|---|---|---|---|
| Mean | SD | Mean | SD | Mean | SD | |
| 1 | 3.51 | 1.23 | 3.40 | 1.26 | 3.68 | 1.21 |
| 2 | 3.53 | 1.19 | 3.35 | 1.23 | 3.67 | 1.16 |
| 3 | 2.37 | 1.21 | 2.26 | 1.18 | 2.52 | 1.23 |
| 4 | 3.04 | 1.39 | 2.93 | 1.36 | 3.37 | 1.34 |
| 5 | 3.25 | 1.26 | 3.16 | 1.28 | 3.44 | 1.23 |
| 6 | 2.29 | 1.21 | 2.00 a | 1.48 a | 2.46 | 1.25 |
| 7 | 2.51 | 1.30 | 2.49 | 1.28 | 2.69 | 1.33 |
| Items | Iran (N = 10,843) | Bangladesh (N = 9906) | Norway (N = 3680) | |||
| Mean | SD | Mean | SD | Mean | SD | |
| 1 | 3.62 | 1.36 | 3.60 | 1.05 | 2.90 | 1.12 |
| 2 | 3.62 | 1.29 | 3.51 | 1.08 | 3.34 | 1.18 |
| 3 | 2.00 a | 1.48 a | 2.49 | 1.13 | 2.00 a | 1.48 a |
| 4 | 3.53 | 1.39 | 2.92 | 1.23 | 2.00 a | 1.48 a |
| 5 | 3.24 | 1.35 | 4.00 a | 1.08 | 2.56 | 1.17 |
| 6 | 2.39 | 1.31 | 2.42 | 1.12 | 1.00 a | 0.88 |
| 7 | 2.47 | 1.32 | 2.86 | 1.24 | 1.00 a | 0.96 |
| Items | 18–30 years old (N = 13,494) | 30–50 years old (N = 8113) | >50 years old (N = 2412) | |||
| Mean | SD | Mean | SD | Mean | SD | |
| 1 | 3.49 | 1.16 | 3.61 | 1.32 | 3.34 | 1.32 |
| 2 | 3.55 | 1.13 | 3.59 | 1.26 | 3.30 | 1.27 |
| 3 | 2.39 | 1.16 | 2.41 | 1.26 | 2.00 a | 1.48 a |
| 4 | 2.91 | 1.35 | 3.34 | 1.41 | 2.93 | 1.41 |
| 5 | 3.33 | 1.19 | 3.26 | 1.34 | 2.92 | 1.33 |
| 6 | 2.24 | 1.16 | 2.40 | 1.28 | 2.24 | 1.24 |
| 7 | 2.57 | 1.30 | 2.51 | 1.32 | 2.31 | 1.28 |
Publisher’s Note: MDPI stays neutral with regard to jurisdictional claims in published maps and institutional affiliations. |
© 2022 by the authors. Licensee MDPI, Basel, Switzerland. This article is an open access article distributed under the terms and conditions of the Creative Commons Attribution (CC BY) license (https://creativecommons.org/licenses/by/4.0/).
Share and Cite
Lecuona, O.; Lin, C.-Y.; Rozgonjuk, D.; Norekvål, T.M.; Iversen, M.M.; Mamun, M.A.; Griffiths, M.D.; Lin, T.-I.; Pakpour, A.H. A Network Analysis of the Fear of COVID-19 Scale (FCV-19S): A Large-Scale Cross-Cultural Study in Iran, Bangladesh, and Norway. Int. J. Environ. Res. Public Health 2022, 19, 6824. https://doi.org/10.3390/ijerph19116824
Lecuona O, Lin C-Y, Rozgonjuk D, Norekvål TM, Iversen MM, Mamun MA, Griffiths MD, Lin T-I, Pakpour AH. A Network Analysis of the Fear of COVID-19 Scale (FCV-19S): A Large-Scale Cross-Cultural Study in Iran, Bangladesh, and Norway. International Journal of Environmental Research and Public Health. 2022; 19(11):6824. https://doi.org/10.3390/ijerph19116824
Chicago/Turabian StyleLecuona, Oscar, Chung-Ying Lin, Dmitri Rozgonjuk, Tone M. Norekvål, Marjolein M. Iversen, Mohammed A. Mamun, Mark D. Griffiths, Ting-I Lin, and Amir H. Pakpour. 2022. "A Network Analysis of the Fear of COVID-19 Scale (FCV-19S): A Large-Scale Cross-Cultural Study in Iran, Bangladesh, and Norway" International Journal of Environmental Research and Public Health 19, no. 11: 6824. https://doi.org/10.3390/ijerph19116824