
Impairment of Assets and Market Reaction during COVID-19 Pandemic on the Example of WSE


Department of Accounting, Faculty of Finance, University of Economics in Katowice, 40-287 Katowice, Poland
Risks 2021, 9(10), 183; https://doi.org/10.3390/risks9100183
Submission received: 12 July 2021
/
Revised: 14 September 2021
/
Accepted: 13 October 2021
/
Published: 15 October 2021
(This article belongs to the Special Issue Financial Stability and Systemic Risk in Times of Pandemic)
Abstract
:The main task of the article is to examine the impact of the reported impairment of assets (IoA) on the market reaction of investors on the Warsaw Stock Exchange [WSE] in the crisis condition caused by the COVID-19 pandemic. There is a need to verify whether the disclosure of this information in the period of economic downturn will cause a similar negative reaction as in previous topics in this area. Research undertaken in this article helps identify the rules of behaviour (in the short term) whether the reaction of investors on updating the company’s assets in crisis conditions is different than in times of prosperity. The main hypothesis will be verified using the event study methodology. It allows to verify whether the upcoming information about IoA during the COVID-19 pandemic confirms an existence of statistically significant negative abnormal returns. Based on the 55 cases of current reports informing about IoA, which were submitted to the investors in the year 2020 and finally qualified for the research sample, I have not observed statistically significant negative abnormal returns on the adjacent days. The results are different from those obtained by researchers who study the market reaction to the IoA under non-crisis conditions of the economy.
1. Introduction
The first quarter of 2020 turned out to be the beginning of a difficult period that global economies have had to face, at least since the financial crisis of 2008–2009. It was at this time that the COVID-19 pandemic (caused by the SARS-CoV-2 virus) started to spread around the world. Its appearance led to a destabilization of the world economy on an unprecedented scale. The occurrence of global supply and demand shocks resulted in a real threat of a permanent recession on a hard to estimate scale.
Although the first case of COVID-19 infection was reported in China (in the city of Wuhan) as early as December 2019 (Singh et al. 2020), it was only the surge in cases and deaths from COVID-19 infection outside China that probably led the World Health Organization to declare a global pandemic on 11 March 2020 (World Health Organization 2020).
The fear of a spreading pandemic has caused significant changes in people’s lives. Social gatherings were restricted, stores were closed, mass events were canceled, and business travel and tourist traffic were halted. All these changes occurred in order to prevent the virus from entering new regions as much as possible. Such a significant destabilization of everyday life had a drastic impact on the functioning of the economies of many countries. Some economic experts claim that because of the effects of the coronavirus pandemic, the global economy will likely undergo its deepest slump since the Great Depression of the 1930s, which occurred after the stock market crash of 1929. The first estimates as of May 2020 pointed to a decline in global GDP of up to 3 percent, while some European countries were expected to contract by as much as 7.5 percent (International Monetary Fund 2020).
The global-widening tightening, which resulted in the shutdown of economies, also resonated with the capital market reaction. The panic peaked in mid-March, when the world’s largest indices plummeted by more than 20% during the week. The scale and suddenness of the fall should be reflected in the fourfold activation in March of the “automatic suspension of quotations” system on the New York Stock Exchange, which is supposed to slow down further price falls by suspending quotations for a short period of time. Since its introduction in 1987, it has not been necessary to use this price volatility stabilizer in the US market several times in such short intervals (Zhang et al. 2020).
The turmoil in the financial markets did not occur only on the New York Stock Exchange. The UK’s FTSE100 index saw declines of up to 10% per day, while Japan’s NIKKEI225 saw a more than 20% correction from the historical boost in December 2019. The dramatic fall in the market valuation of listed issuers did not spare the Polish WIG index either. The panic peaked in the second week of March, when the value of the WSE’s blue chip index was recorded lower than even at the worst moment of the great financial crisis of 2008–2009 (Stooq.com 2021). The reaction of the markets was not exaggerated, as hardly anyone expected the exact consequences for the functioning of the global economy that the COVID-19 pandemic could cause. Its outbreak was a typical “black swan” described by N. Taleb (2010), i.e., an unpredictable event with a very large negative impact on investors’ behavior.
Central banks also reacted to the development of the COVID-19 pandemic by significantly lowering the main interest rates. A few days after declaring a pandemic state, the Federal Reserve Bank introduced a zero interest rate and announced an unlimited quantitative easing program (Zhang et al. 2020). A similar reaction of the central bank also took place in Poland. The Polish central bank [NBP] lowered the main interest rates to an unprecedented level and introduced the purchase of Treasury securities (National Bank of Poland 2020). All this is justified by the specter of the spread of the negative impact of the COVID-19 pandemic on the economy.
Despite the rapid rebound in securities prices, investors were accompanied by uncertainty about the further development of the pandemic. It could be seen, inter alia, by the increase in the daily deviation of the S&P 500 index, which in March 2020 increased almost fourfold (Zhang et al. 2020). According to some researchers, the increase in price volatility on the stock market during the current turmoil is higher than it was in the periods of previous major crises of 1930, 1987 or 2008 (e.g., (Thakur 2020)). This situation creates motives for scientific exploration, which can be used to discover new dependencies occurring on capital markets. The outbreak of the COVID-19 pandemic and the social and economic consequences of its spread have also had a significant impact on the business activities conducted by the entities. A significant number of them noticed in the consequences of the spread of the SARS-CoV-2 virus the occurrence of “changes of technological, market, economic or legal nature in the area of activity conducted by the entity”. These changes are one of the external reasons for entities to test the value of their assets for possible impairment (International Accounting Standard Board 2008, No. 36). Their occurrence, in turn, is a factor of volatility in the prices of financial instruments, which has repeatedly been the subject of research by authors dealing with the topic of capital markets research in accounting (among others, Gu and Lev 2011; Knauer and Wohrmann 2016; Cheng et al. 2017; Lisicki 2021). These researchers made an attempt to verify the market reaction to the disclosure of information on the impairment of assets (IoA). In most cases, the results of their research indicated a short-term negative reaction from investors (Knauer and Wohrmann 2016). However, it was possible to find cases in which the market discounted the news about the write-off differently in the longer term (Gu and Lev 2011). This reaction was also varied due to individual determinants characterizing the issuers (Cheng et al. 2017).
However, they did not focus on the general economic conditions for conducting the analyzes. The research contribution to the state of knowledge is an attempt to verify how the market will react to such information in a situation when the specter of a serious economic crisis hangs over it, which was caused by the pandemic of COVID-19 (Platje et al. 2020). The main purpose of this paper is to show how the market will react to information about IoA in a situation where the prices of securities have already discounted a lot of negative information due to the existence of negative consequences of the COVID-19 pandemic. Such a reaction may be different from that observed in earlier studies.
To verify this purpose, the author adopted a research hypothesis indicating that submitting information about the impairment of the company’s assets during the COVID-19 pandemic first year (2020) results in negative abnormal returns (AR) of their share prices in adjacent days. The negative reaction of investors about IoA was a dominant position in the previous abovementioned research. The research undertaken in this article helps identify the rules of behaviour (in the short term) whether the reaction of investors on updating the company’s assets in crisis conditions is different from their reaction in times of prosperity.
The main hypothesis of the research will be verified using the event study methodology created by E. Fama et al. (1969). The research intends to verify whether the level of achieved AR occurring on the days adjacent to the announcement regarding IoA is significantly different from the average level. The subject of the article will be all current reports about IoA submitted by issuers listed in the main broad market index WIG of the Warsaw Stock Exchange (WSE) in times of the COVID-19 pandemic (year 2020). Results from 2020 will be discussed with other, similar research and with results obtained from previous years from the WSE.
2. Impairment of Assets and Market Reaction—Literature Overview
The first of the studies examining the impact of IoA on the response of investors took place already in the 1980s by Strong and Meyer (1987). The researchers divided their study into six sections. In the first two, they focused on the considerable flexibility of solutions included in accounting standards that allow company managers to be active in the field of write-offs and capital budgeting in the aspect of IoA. The third part described the financial results of companies that reported IoA in their financial statements between 1981 and 1985. The fourth section indicated, in turn, the determinants of such write-offs. The fifth section of the article focused on the core of that research. Using an event study methodology, the researchers analyzed the impact of IoA on “company shareholder wealth”. Their study allowed them to determine the positive impact of the occurrence of IoA on the price formation of issuers’ securities. Moreover, the positive impact was also noted before the information was actually released to investors. This suggested some information leak contradicting the existence of semi-strong information efficiency of the capital market in the United States at that time.
In the following years, one could see an increase in interest in the issue by capital market researchers from different parts of the world. Ghicas et al. (1996) analyzed the relationship between the annual returns of companies listed on the Athens Stock Exchange and the tax benefits of the revaluation of fixed assets. The study focused on industrial firms. The authors found that the revaluation of fixed assets had a positive effect on cash flows from operations, but a negative effect on firms’ returns from revaluation. Elliott and Hanna (1996) attempted to verify the information content of the IoA (which they called “special items”). In the analysed period, an increase in the number of entities disclosing IoA exceeding 1% of their balance sheet total (5% in 1975, 21% in 1993) was observed. Moreover, they usually occurred in the form of multiple write-offs. The market capitalization of entities was decreasing when they were made available, especially when impairment was reported several times. T. Choi (2008), on the other hand, based on the data of more than five thousand cases of IoA exceeding 1% of the balance sheet total by South Korean companies, verified the timeliness of recording write-offs. In his opinion, the long-term return on investment in shares of companies reporting impairment depends largely on the timeliness of their disclosures. Moreover, IoA is reported in a less appropriate time relative to the other elements that shape financial performance. Researchers also investigated the market response and the adequacy of the value of information contained in IFRS 1 (Horton and Serafeim 2009). Their study reported statistically significant negative AR for companies smoothing net profit in minus through the use of IoA. They confirm that managers delay the public disclosure of negative information (such as IoA), which in turn is later met with a much more negative market reaction.
Hamberg et al. (2011) constructed two stock portfolios that differed in the recognition of company value in financial statements. The study involved 226 firms listed on the Stockholm Stock Exchange. They found that IoA affects above-average returns (despite lower earnings). Bowen and Khan (2014), in turn, focused on the reaction of investors in connection with the implementation of IoA in the banking sector in 2008–2009. Their audit was conducted in the context of expanding fair value accounting, which was blamed for the aggravation of the economic crisis. Surprisingly, there was a positive reaction from investors to the information on the decline in the recoverable amount of assets as close to fair value as possible. The results indicate that investors acted as if the potential negative effects of the then existing impairment rules outweighed the benefits of having more timely and transparent measurement-to-market data for decision-making purposes, which is somewhat different from the most common observed results on the market reaction to IoA.
Cheng et al. (2017) surprised with the results of their study on the impact of IoA on returns in both short and long horizons. They stood in opposition to previous studies. They showed AR in the long run (more than 250 days after the announcement of the write-down). According to that, in light of current regulations in the field of company value, investors perceive its update as a positive event in the long term.
With regard to recent studies, a trend can be observed to verify the importance of IoA in the context of the market valuation of the issuers writing it off (e.g., Knauer and Wohrmann 2016; Corona and Randhawa 2018; Iatridis et al. 2021). The researchers mainly point to the timeliness of write-off disclosures and their association with market reaction. In their view, write-offs disclosed later are associated with a significantly more negative market reaction than those communicated to investors without delay.
Additionally, in a research, the implications of the implementation of the mark-to-model fair value measures for asset impairment tests on the relevance and reliability of information presented in financial reports were examined (Dudycz and Praznikow 2021). They concluded that the implementation of asset impairment tests that use the mark-to-model fair value measures is not promising for increasing the quality and reliability of the information presented in financial statements. Furthermore, the capital markets’ reaction to asset impairment announcements is negative, like in most previous research studies.
3. Research Methodology
Verification of the importance of updating the entity’s asset value will be calculated using the event study methodology. It allows to determine the impact of a certain event on the returns of individual securities (in this case shares). It is a tool used to assess the reaction of investors to the occurrence of a certain event (Lisicki 2021). On the other hand, based on the above conditions, the analysis of events allows us to assess the impact (or lack thereof) of a given piece of information on the market valuation of securities of issuers. The capital market receives a lot of announcements every day. It is important for investors to determine which of them are significant for the future cash flows generated by a listed company. When such an impact is noticed, it will be necessary for the investor to take adjusting actions expressed in price volatility or transaction volume (Gurgul and Wójtowicz 2014).
Currently, the methodology of event study is much more often used to “assess the impact of events on company valuations” (Lakshmi and Joshi 2016) or to enable the investor to properly shape the market valuation based on the latest information (Sorescu et al. 2017). It is thanks to it that it is possible to absolutely assess the impact of changes in the company’s policy on its market value.
The methodology of event study has been developed over the years by researchers in the field of finance, which does not exclude the possibility of its application in other areas of social sciences, such as management, economics, and accounting. This justifies its application to the study of the impact of disclosure of information on the IoA on the market valuation of listed entities on the Warsaw Stock Exchange, which are the subject of these considerations (Geiger et al. 2008). The necessary beginning of the event study is to propose the event whose influence on the market valuation of listed issuers will be examined. Once to determine the subject of the study, it is necessary to identify the subject, i.e., the research sample. It is on its example that the significance (or lack thereof) of a given event (information) on the development of securities prices will be verified. After the identification of the event and the entities on which it will be tested, it seems necessary to present the location and length of the estimation and event windows. In relation to the first of them, it is also necessary to indicate the model on the basis of which the expected return will be estimated. Its estimation together with the calculation of AR in the event window should be the next step of the methodology. The last one includes statistical verification of the obtained results determining the significance of the analyzed event for stock prices (Lakshmi and Joshi 2016).
One of the important steps in the event study methodology is specifying the event window (in this project, identical to the issuer’s submission of a report on the write-off) and the estimation window (used to calculate the expected return) allowing to quantify how the market is able to respond to the above-mentioned revision of the asset value.
In the simplest terms, the event window is the time period during which the impact of the event on the market valuation of securities of listed companies is examined. Its length is not constant. On the other hand, in estimation window, model parameters are estimated, which will be used to calculate first the expected return on an adopted period. The expected return is to reflect the “normal” behavior of investors when the market would not receive information about the analyzed event (Corrado and Zivney 2011). S. Sudarsanam (2003) pointed to the existence of the seven most commonly used models, which he divided into: single-index, market, and portfolio.
After determining the expected return, a researcher using the event study can calculate the AR that is at the core of the described methodology. This task is definitely simpler than using one of the above models for estimating the expected return. The AR is the difference between the actually realized return on the day of the event window and the calculated expected return. In the simplest terms, this is illustrated by the following formula:
where:
ARit = Rit − E(Rit)
- ARit—abnormal return of security i in period t,
- Rit—realized return of security i in period t,
- E(Rit)—expected return of security i in period t.
The last of the presented stages of the event study methodology includes an assessment of the statistical significance of the calculated AR. The obtained outcome may result from the “standard” price volatility recorded on global capital markets.
4. Results
According to the research hypothesis adopted in the introduction, the announcement of the IoA should have a negative impact on the market reaction of investors during the COVID-19 pandemic in 2020. It will manifest itself in the occurrence of negative AR on shares of issuers listed in the WIG index on the days following the date of announcement of the information about the IoA. To verify the abovementioned hypothesis, it is necessary to find current reports submitted by issuers from the WIG index informing about IoA during the year 2020 (all issuers are mentioned in the Appendix A, Table A1). This year was the first year of existence of the COVID-19 pandemic in worldwide capital markets. For this purpose, it is necessary to use the Electronic Information Transfer System (ESPI), which is the main information system for investors and issuers from WSE.
After obtaining all information regarding impairment of assets in the analyzed period, it will be necessary to follow several stages of the event study methodology. These are the following (Sorescu et al. 2017):
- construction of a database containing information about the publication of current reports concerning IoA of issuers listed on the WSE;
- defining the event and estimation windows in each of the obtained cases;
- calculation for each event of the expected return based on stock quotations from the estimation window and AR later;
- statistical analysis of calculated average AR (AAR);
- conclusions regarding the impact of IoA on the market reaction of indicated issuers listed on the WSE during the COVID-19 pandemic.
Expected returns have been calculated based on the Sharpe single-index model (Sharpe 1963). In favor of its use, apart from the simplicity of calculations and a significant frequency of use in the literature on the subject, above all is the significant reliability compared to more sophisticated econometric models (Armitrage 1995). It was noticed that the subsequent factors used in the econometric models built in the literature have little explanatory significance (MacKinlay 1997). Some limitations of use include, for example, the CAPM model in relation to this market model. The market model is supposed to work properly in the case of a large number of unrelated observations as well as events not concentrated in time (Binder 1998). These properties perfectly reflect the characteristics of announcements of IoA, which somehow justifies the choice of the model for estimating the expected rate of return.
After estimation of the expected return in each case of submitting to investors a current report about IoA, it is necessary to calculate the AR in the event window. For this purpose, a seven-day, symmetrical event window has been constructed for each qualified cases to the research sample. It covered publication day (t0) and three session days immediately preceding (t−3, t−2, t−1) and following (t+1, t+2, t+3) the disclosure of the information studied. It is also necessary to verify whether on the days immediately preceding the date of publication of the information on the IoA, a kind of information leak to some group of investors could be observed.
From the point of view of the conducted research, it was important to verify whether in the adopted event window, in each of the qualified announcement IoA during the COVID-19 year, there are no disruptive events. The occurrence of such a situation may disrupt the cognitive value of the obtained results.
The last part of the research procedure was the statistical verification of the obtained results. To this end, one of the most popular non-parametric Wilcoxon matched-pairs test (Wilcoxon 1945) (for AAR in each day of event window) and the Cowan Generalized Sign Test (Cowan 1992) (for cumulative abnormal returns—CAR) may be used. Parametric tests, which are more appropriate using the event study methodology, may also be used. For this purpose, however, it is necessary to meet the assumptions of the normality of the distribution of the calculated abnormal returns.
Reviewing the current reports in ESPI of the abovementioned companies in the COVID-19 year 2020, 76 announcements with a reference to the IoA were found. They were provided by 53 issuers, as indicated in Table 1.
Detailing the data on current reports in Table 1, it should be indicated that the first 14 cases refer to the announcing IoA provided by companies grouped in the WIG20 index. Another 10 cases were reported by mWIG40 issuers. The next 18 cases were reported by companies grouped in sWIG80 and the last 34 cases were current reports delivered to investors by companies not grouped in any of the three WSE’ main indices but grouped in WIG, the broad market index. It is worth mentioning here that the research sample used for the verification of the research hypothesis consists of all issuers grouped in the WIG index as at the end of February 2020. According to the historical index portfolios after the revision in March 2020, the WIG index consisted of 329 issuers (Appendix A). This is also how many were qualified to examine current reports for the occurrence of IoA.
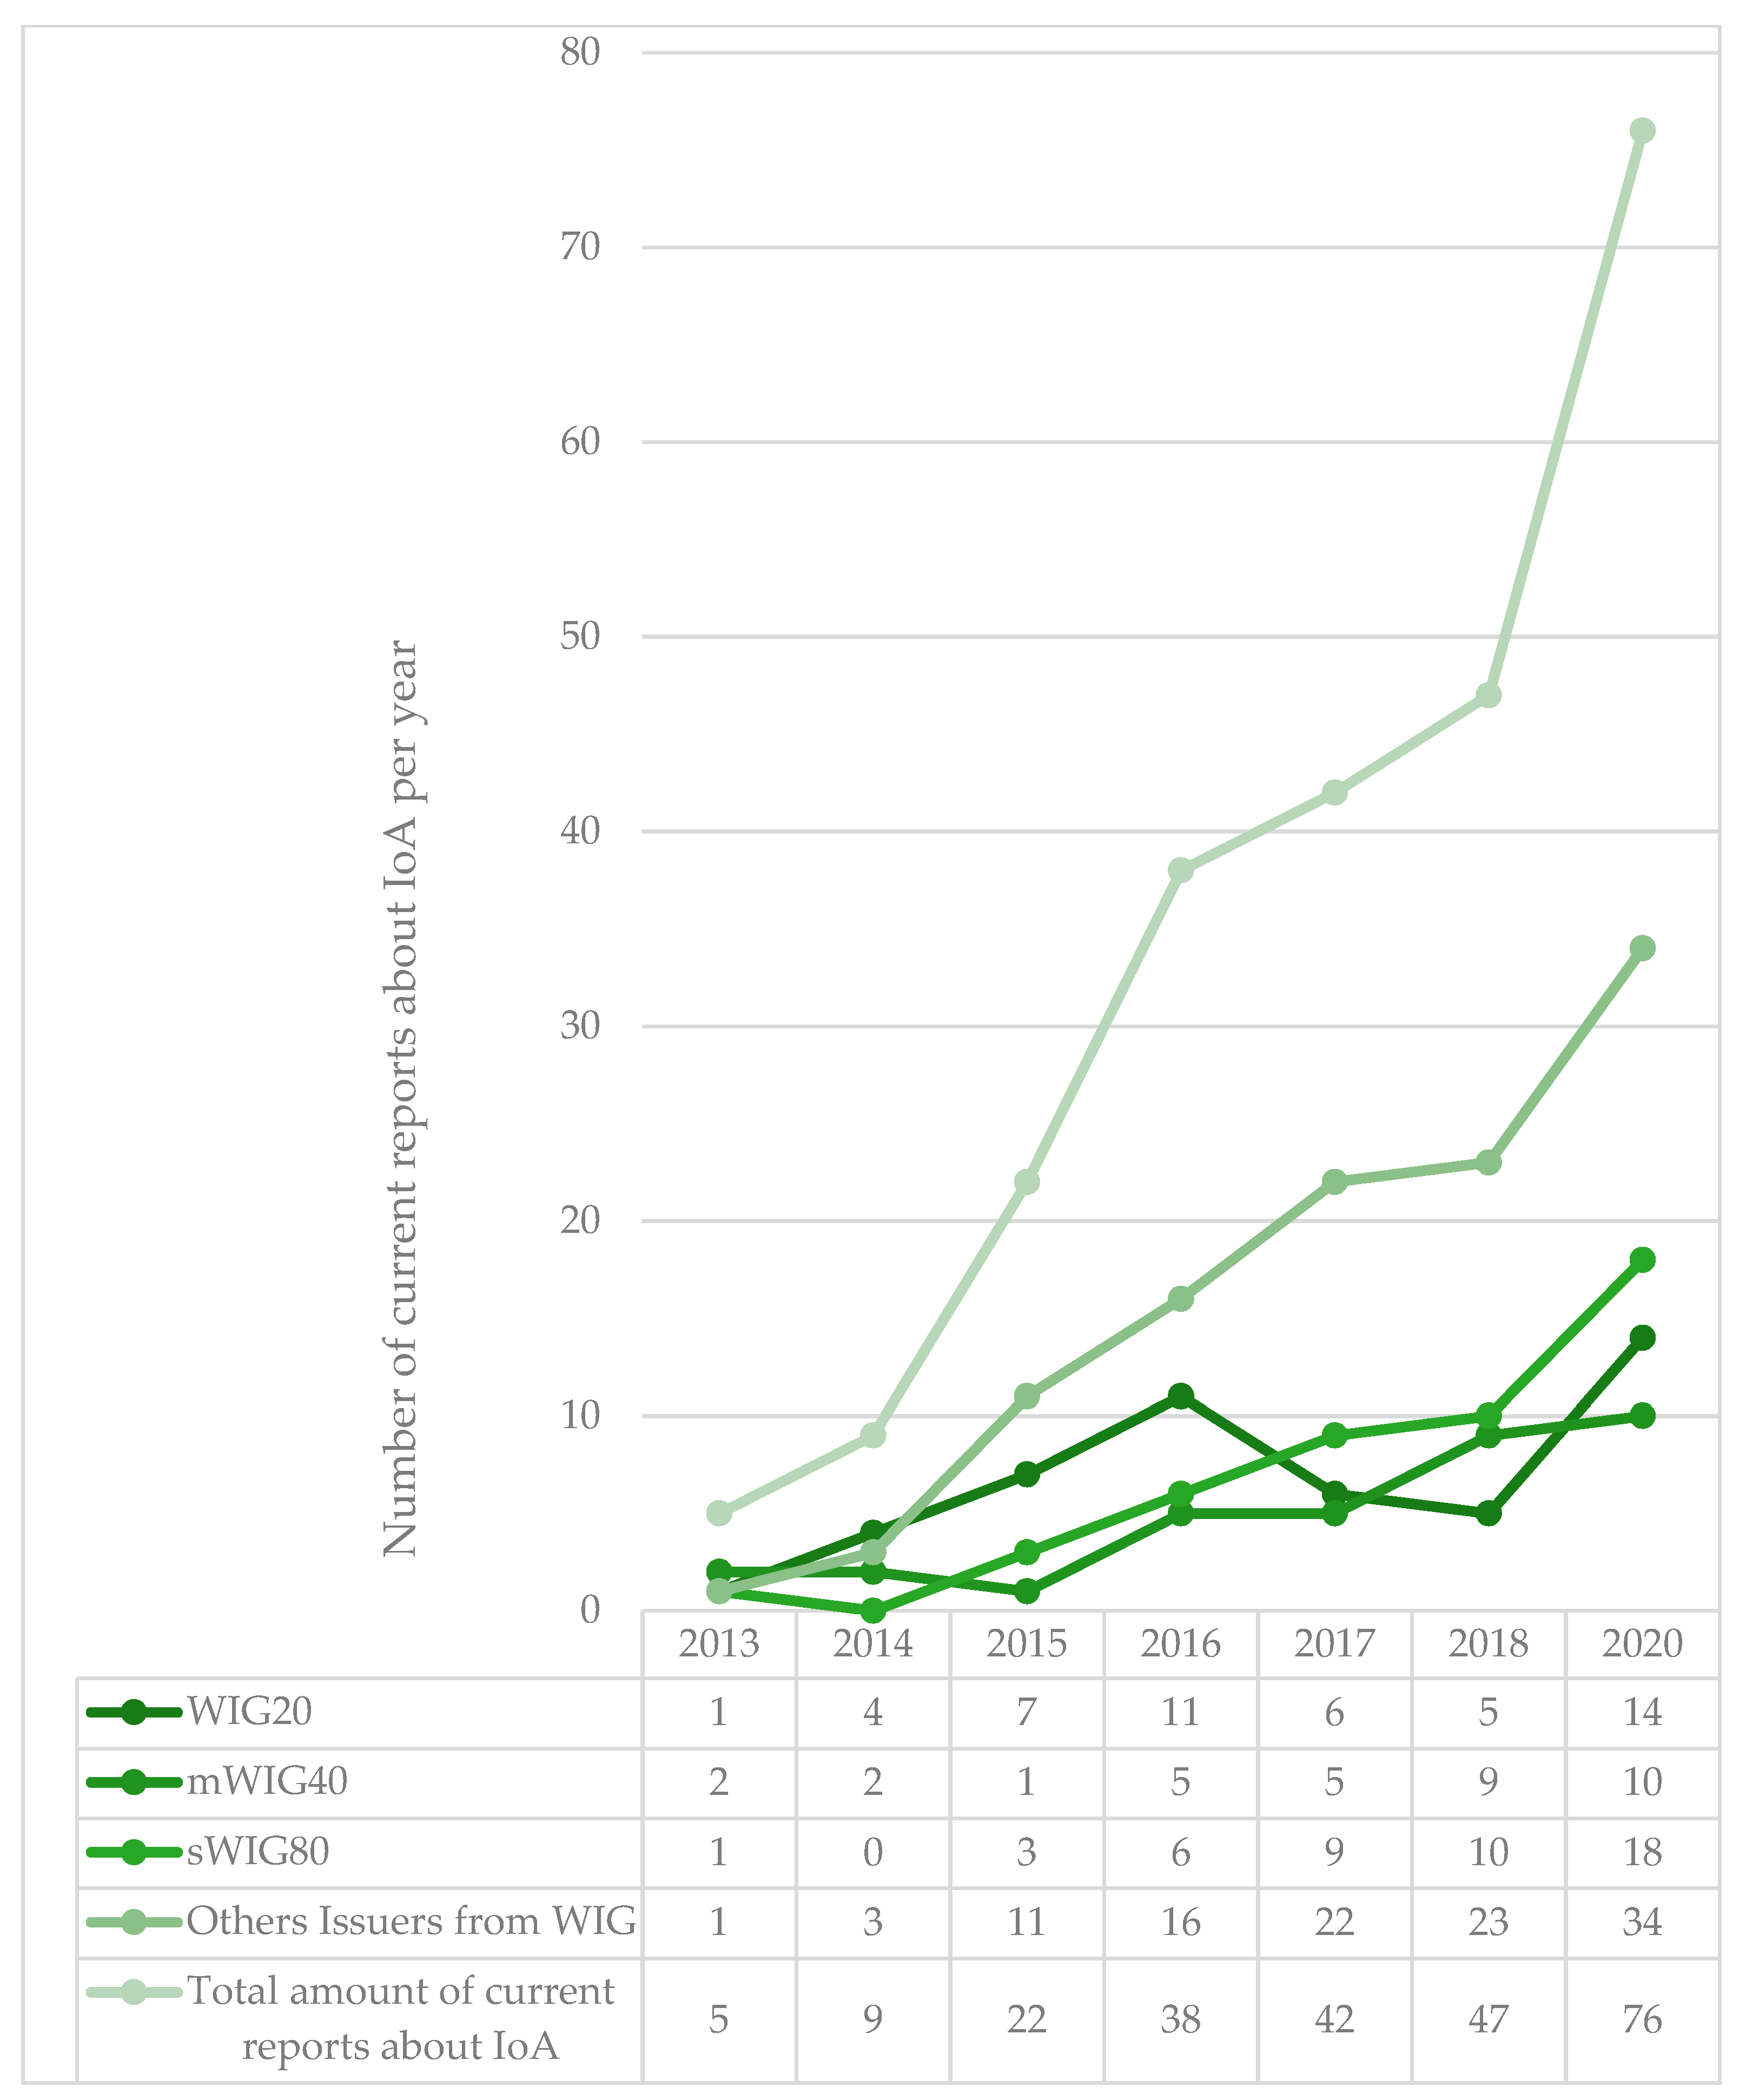
The sheer number of releases of current reports dealing with IoA is impressive. In the previous years, far fewer reports of this type were available to WSE investors. This can be seen by comparing the number of analyzed reports in the pandemic year 2020 and earlier years. They are presented in Figure 1.
As mentioned earlier, in 2020, 76 current reports indicated the IoA by issuers grouped in the WIG index reached investors. This compares to 163 cases in the entire six-year period of 2013–2018. The annual average was therefore just over 27 current reports. The frequency of asset IoA reporting in 2020 for the entire study population is thus near two times higher than the average value would indicate. The readings relating to the number of current reports on IoA delivered to investors are significantly higher than the average for each subgroup (WIG20, mWIG40, sWIG80, and others). The biggest difference is noticeable in the case of issuers from sWIG80, which in 2020 provided current report on IoA nearly three times more often than in previous years.
The aim of this study was to verify the reaction of WSE investors to the provision of information about the IoA in the conditions of the COVID-19 pandemic. Therefore, each of the IoA current reports found in 2020 was verified for the occurrence of other events in the days accompanying its publication that could affect the estimation of market reaction. This is because the capital markets currently receive a multitude of news on a daily basis, more than one of which may relate to a particular issuer. When two or more price-forming news arrive in close succession, a researcher using the event study methodology must be aware of the need to isolate the impact of a single event. Otherwise, the results obtained may not carry the expected cognitive value (Krivin et al. 2003).
Among the disruptive events, we can mention those such as: dividend information (Akron 2011), analyst recommendation (Green 2006), block trades (Bian et al. 2012), significant changes in oil price (Reboredo 2015), global economic shocks (Gurgul and Wójtowicz 2014), and so on. The occurrence of such a situation may disrupt the cognitive value of the obtained results. The results could not capture the proper significance of the IoA for the market valuation of biggest issuers listed on the WSE during economic crisis, because in the analyzed event window, investors could be more strongly influenced by information with a different content.
Therefore, all 76 cases found were verified for the occurrence of such an event on the days accompanying the release of IoA information to investors. Finally, 55 cases of publications of analyzed current reports were qualified for the research sample; 21 of them had to be rejected due to the occurrence of another event in the event window, which could have a price-determining character.
Table 2 indicates the qualified cases of IoA in the analyzed period, together with the dates on which such information was made public. It also includes information on which group of assets were impaired and the amount of write-off. In the event that the issuer revalued more than one group of assets and it was not possible to indicate which asset was specifically affected, it was decided to create a separate category of write-offs, i.e., “Other”. Current reports have been grouped according to the issuers’ affiliation to the three largest indices (WIG20, mWIG40 and sWIG80) listed in the broad market index WIG and other issuers (grouped only under WIG).
The next steps of the event study methodology involved the estimation of expected returns (using Sharpe single-index model) and calculation of AR for each of the 55 qualified cases of current reports about IoA. Model parameters in estimation window were calculated using the least squares method. The estimation window has been set to 30 session days before the seven-day event window. It started from day t−34 to day t−5. The return on the market portfolio was calculated using the WIG quotations. As mentioned above, for each qualified current reports, the calculation of AR took place in seven-day, symmetrical event window between days t−3 to t+3 and also CAR, which is a sum of seven single ARs in event window. Their cross section average values are presented in Table 3.
In order to confirm the results of the study, it was necessary to conduct a statistical test verifying their significance. One of the most obvious tests that can verify the rejection of the null hypothesis in favor of the alternative (indicating the impact of the event on the market valuation on day t) is the average excess returns test, based on the t-Student statistics (Conventional Cross-Sectional t-Test) (Gurgul and Wójtowicz 2014). The necessary condition for its conduct, however, is the fulfillment of the assumption that the distribution of the studied sample is normal.
For this purpose, one of the most popular tests verifying the existence of a normal distribution of the examined variables was used, which was the Shapiro–Wilk t-test (Shapiro and Wilk 1965). The obtained value of the W test statistic for ARs was 0.4351 and was lower than the stabilized test value for the indicated number of observations. Therefore, it became necessary to use a non-parametric test.
Therefore, the results from the statistical verification of obtained results (by using non-parametric Wilcoxon matched-pairs test for each AAR and Cowan Generalized Sign Test designed for CAR) were added to Table 3. Detailed ARs for each qualified case are attached in Appendix B, Table A2. The number of qualified cases in each group is added in brackets.
As can be observed in Table 3 above, the market response for all qualifying IoA cases was negligible. The lowest AAR was recorded on the day t+1 (on the next trading day after the release of the current report) and was −0.65 percentage points. However, critically important to the results of the study, this AAR was not statistically significant as was the AAR from each remaining day of the event window. Statistical significance could not be seen for CAR either. The lowest AAR on day t0 was recorded among the twenty largest issuers listed on the WSE and on the day t+3 in the group of mWIG40 issuers. Moreover, these rates are statistically significant. This could indicate that the IoA in the era of the COVID-19 pandemic does not cause the negative market reaction that was observed in previous years. Such a reaction can only be observed in relation to the sixty largest issuers grouped in the WIG20 and mWIG40 indices. However, it is important to note that this reaction took place only on one of the days of the analysed event window and concerned a narrow research group (11 cases of IoA for WIG20 and 6 cases for mWIG40, respectively).
Moreover, no statistical significance of AAR can be observed in any of the cases presented in the table in the days preceding the day when the IoA current report was made available to investors. This should be understood as the absence of a privileged group of investors who would have access to price-making information before the rest of the market. This phenomenon should be viewed positively in the context of possible information asymmetry in the capital market, which could be exacerbated in the conditions of the COVID-19 pandemic.
CAR does not show statistical significance either. However, we should note the significantly higher (sWIG80 issuers) and lower (other issuers) CAR, respectively. Perhaps further analysis of the successive IoA emerging in 2021 will allow us to find more detailed correlations between them and the reaction of investors allocating their capital on the WSE.
In order to compare whether the observed lack of a clearly negative market reaction to IoA among issuers from the WIG index during the pandemic year 2020 is due to the instability on the capital markets caused by the pandemic, or the specificity of the WSE, it was decided to repeat the study for the same companies. The only difference was the research period, which covered the years 2013–2018, i.e., before the outbreak of the COVID-19 pandemic. The test sample included the same companies as in the original study. In the analyzed test period, 87 cases of IoA announcements submitted by issuers grouped in the broad market index WIG were found and finally qualified for the test sample. The market model was used to calculate the AR, as for 2020. The estimation window has been set also to 30 session days before the seven-day event window. It started from day t−34 to day t−5. The return on the market portfolio was calculated using the WIG quotations as well. The statistical significance of the obtained results was also verified using the non-parametric Wilcoxon signs test and Cowan Generalized Sign Test. The research results are presented in Table 4 below.
Based on the ARs for the years 2013–2018 calculated in the table, it can be clearly stated that the short-term market reaction to the IoA announcement was negative. It was characterized by the presence of statistically significant AR on day t0 (p < 0.05) and on day t+1 (p < 0.01). In addition, the calculated AR on those days were significantly lower than those for 2020. These results are in line with the research results achieved by previous researchers exploring foreign markets.
Moreover, when analyzing the obtained results more cross-sectionally, it can be noticed that the strongest negative market reaction was recorded in relation to companies listed in the sWIG80 index and those not grouped in any of the three main WSE indices. (AR statistical significance on day t0 and t+1 p < 0.01). The lack of investors’ response to similar information in 2020 allows the conclusion to be drawn that the market conditions caused by the COVID-19 pandemic significantly weakened the short-term response of investors from the WSE to the information about IoA. Those in an environment of increased volatility in the markets do not believe that the reduction of the expected benefits from the asset component through the implementation of IoA is a factor that should be seen as a determinant of a short-term downward correction of the market valuation of WSE issuers.
5. Discussion
The research presented in the theoretical part of this article shows the price-making character of the information about the issuer’s IoA. The reaction of investors to the release of such news on global stock exchanges varied, but based on most of the cited examples, we can conclude its negative impact on the formation of securities prices (Hamberg et al. 2011; Fernandes et al. 2016; Knauer and Wohrmann 2016, among others). Therefore, the main motivation of the study was an attempt to quantify the importance of the IoA in the realities of the Polish capital market under the conditions of the occurrence of the economic downturn caused by the COVID-19 pandemic. Thus, the aim of the study was to verify whether the negative market reaction to the IoA noted in previous studies on global markets will also be noticed during the negative sentiment to risky securities. Issuers listed in the WIG broad market index were used as samples in this study. The present study was intended to help recognize the relationship between asset recoverable value reduction and the market reaction that was observed, and thus provide a seed for its verification in other global capital markets.
The main hypothesis is verified negatively. This is because no statistically significant AR was observed on any of the event window days examined to suggest an above-average market reaction to the IoA news. These results stand in opposition to the research results of the majority of researchers exploring this issue in the global capital markets since the 1980s (Elliott and Shaw 1988; Zucca and Campbell 1992; Alciatore et al. 2000; Jarva 2009; AbuGhazaleh et al. 2012; Bowen and Khan 2014; Lisicki 2021). Especially the last of the cited items describing comprehensively the importance of IoA for the market valuation of companies from the main market of the Warsaw Stock Exchange in the period 2013–2018 allowed to define the importance of such information sharing as negative (Lisicki 2021). In the research sample of 129 cases of IoA from the six-year research period (in which de facto capital market turbulence was not as significant as in 2020), on the day the current report on asset impairment was made available, the average AR was −0.74 percentage points (statistically significant at the p < 0.01 level using Wilxocon’s paired rank order test). In addition, on the day following the release of the report, the average AR was −0.97 percentage points (statistical significance at the p < 0.01 level). These results were significantly lower than those obtained in this study, in which the AR on the day t0 was 0.00 percentage points, and on t+1 −0.65, and were not characterized by statistical significance. The current report of the IoA was discounted by the market on the day of the report and the following day in previous years. The market reaction was negative, which was not observed in the pandemic of 2020. During the COVID-19 pandemic, the market seemed to disregard this type of information. These results are strongly unexpected. Similar results were observed in the “results” section when the research sample was narrowed down to the issuers grouped in the WIG index only (as in the case of the research in the COVID-19 pandemic year). As well, in this case, there was a short-term negative market reaction to the information about IoA.
The obtained results are also different in relation to the study conducted by Bowen and Khan (2014), who have so far attempted to establish the influence of IoA on investors’ reaction in times of instability in the capital markets’ crisis met with a positive reception by investors. The valuation of companies’ assets at the value as close to fair value as possible was more important for the market than reducing future benefits to gain from them. These results were somewhat surprising compared to most previously carried out. In reference to them, it could be expected that such a market anomaly would be observed in the WSE. However, a similar reaction was also not recorded in the case of investors from the WSE during the pandemic year 2020. The market did not show major changes in the days accompanying the announcement of the IoA information, which should be seen as a kind of curiosity worth exploring in the following years. Moreover, the negative market reaction is not noticeable even when the vast majority of the write-offs qualified in the research sample were characterized by a significant value (exceeding 1% of the issuer’s total assets). In such cases, it was pointed to a much stronger market reaction (Grabiński 2011; Lisicki 2021) than in the case of write-offs of insignificant amount. In the year of the spread of the COVID-19 pandemic, it was impossible to see a similar negative market reaction, even when issuers significantly reduced the recoverable value of their assets.
The interesting finding of this paper that coincides with the findings of earlier researchers (e.g., Laghi et al. 2013; Fernandes and Gonçalves 2014) is that there is a stronger negative market reaction when larger issuers (with a higher level of market capitalization) release a current report on IoA. However, these results need to be confirmed on a larger research sample, which will only be possible after more months of pandemic.
6. Conclusions
The main purpose of this paper was an examination the capital market reaction (on the example of WSE) to the information provided by the issuers, in the form of a current report on IoA. The research contribution to the state of knowledge in the field of the implemented paper is an attempt to verify how the market will react to such information in a situation when the specter of a serious economic crisis hangs over it, which was caused by the pandemic of COVID-19 during in 2020.
Finding from the abovementioned references by issuers listed on the WSE, 55 cases of IoA announcements were finally qualified to the research sample. For each of them, a seven-day symmetrical event window was constructed, covering the day of publishing information about the IoA and three days preceding and following that day. The obtained research results, verified with the non-parametric tests, demonstrated no statistical significance of the AAR for each of the analyzed days of the event window, except for two cases: WIG20 day t0 and mWIG40 day t+3. Unfortunately, a statistically significant market reaction in these cases was related to a very small research sample.
Based on the lack of statistical significance of the vast majority of obtained results, the main hypothesis adopted at the beginning of this study should be rejected. However, the lack of statistically significant AR on the days following the disclosure of information on impairment of assets allows to indicate a different market reaction in the conditions of the economic crisis caused by COVID-19 as compared to the one observed in previous years.
Lack of market reaction about current reports informing about IoA is somewhat surprising. During the COVID-19 pandemic, investors may discount many different negative informations from the environment and ignore absolutely negative information regarding the reduction of recoverable amount of issuers’ assets. The situation is unexpected because, in the previous years, there was a negative reaction of WSE investors to IoA (Lisicki 2021). This fact manifested itself in the occurrence of statistically significant negative AAR on the day of publishing the current report about IoA and on the following day. It can therefore be assumed that the COVID-19 pandemic made investors be much less sensitive to other (than about COVID-19) information on the market.
The research undertaken in this article allows world researchers to consider the possible occurrence of a different market reaction (or its complete absence) to the upcoming to the capital markets information during the COVID-19 pandemic. The obtained results constitute a certain contradiction of the research results obtained by previous researchers. For this reason, they should be treated as a type of invitation for further scientific exploration. Nevertheless, at this point, some limitations of the study should be pointed out, which were a significant reduction of the study sample (from 76 to 55 cases) due to the presence of coexisting events in the event window. However, an author using the event analysis methodology must always take such a situation into account.
The obtained results may constitute the basis for undertaking research on the verification of investors’ sentiment towards particular data (not only on the WSE), which may have changed in the difficult economic conditions in which we operate. The results of the article may be of interest to stock market analysts, investment advisers, stockbrokers, managers, members of supervisory boards, investors (institutional and individual), and researchers in the field of capital markets research in accounting.
An interesting issue may also be an attempt to verify the market reaction to the announcement of financial results during a COVID-19 pandemic years. The results of that study may indicate that the expected reaction of investors (increase in market valuation/decline in market valuation of shares) to companies’ results that differ from the market consensus may be other than that observed in normal world economies. In times of pandemic, the market does not have to react in direct proportion, which would be an interesting issue to be verified.
Funding
This research was funded by the University of Economics in Katowice, grant for young researchers at College of Finance of University of Economics in Katowice from 15th January 2021. The APC was funded by the the University of Economics in Katowice.
Data Availability Statement
Data available in a publicly accessible repository that does not issue DOIs: http://infostrefa.com/infostrefa/en/index/ and https://stooq.com/ (both accessed on 10–20 May 2021).
Conflicts of Interest
The author declares no conflict of interest.
Appendix A

Table A1.
Composition of the WIG index (after revision on 20 March 2020).
| Company Name | Share (%) | Company Name | Share (%) | Company Name | Share (%) | Company Name | Share (%) |
|---|---|---|---|---|---|---|---|
| PKOBP | 10.0000 | SELVITA | 0.1083 | RONSON | 0.0184 | SIMPLE | 0.0062 |
| PZU | 8.2109 | ATAL | 0.0959 | OEX | 0.0180 | MEDIACAP | 0.0062 |
| CDPROJEKT | 7.7984 | CPGROUP | 0.0896 | MONNARI | 0.0175 | BUMECH | 0.0059 |
| PKNORLEN | 7.0473 | VIGOSYS | 0.0877 | EKOEXPORT | 0.0171 | ESOTIQ | 0.0055 |
| PEKAO | 6.4563 | BOGDANKA | 0.0791 | SONEL | 0.0169 | GRODNO | 0.0055 |
| KGHM | 4.0007 | POLICE | 0.0790 | BIOMEDLUB | 0.0166 | TALANX | 0.0053 |
| LPP | 3.7467 | KOGENERA | 0.0753 | ORZBIALY | 0.0163 | PRAGMAINK | 0.0053 |
| SANPL | 3.4627 | PHN | 0.0721 | ULTGAMES | 0.0163 | ARTERIA | 0.0053 |
| CYFRPLSAT | 2.8845 | OPONEO.PL | 0.0697 | BBIDEV | 0.0163 | MAKARONPL | 0.0052 |
| DINOPL | 2.8262 | BSCDRUK | 0.0669 | SYGNITY | 0.0163 | CAPITAL | 0.0051 |
| INGBSK | 2.4720 | TIM | 0.0666 | AILLERON | 0.0161 | SFINKS | 0.0050 |
| PGNIG | 2.1399 | RAINBOW | 0.0663 | WARIMPEX | 0.0160 | OTMUCHOW | 0.0050 |
| LOTOS | 2.1395 | VOXEL | 0.0663 | ODLEWNIE | 0.0159 | TOWERINVT | 0.0050 |
| ORANGEPL | 1.6607 | DATAWALK | 0.0659 | LOKUM | 0.0156 | ATLANTAPL | 0.0049 |
| MBANK | 1.6103 | AMBRA | 0.0652 | RAFAKO | 0.0156 | SWISSMED | 0.0049 |
| PGE | 1.4808 | BOS | 0.0623 | IMMOBILE | 0.0153 | NORTCOAST | 0.0049 |
| PLAY | 1.4514 | MANGATA | 0.0595 | EUROTEL | 0.0151 | IFIRMA | 0.0049 |
| KETY | 1.4482 | ATMGRUPA | 0.0585 | KREC | 0.0151 | INTROL | 0.0048 |
| ASSECOPOL | 1.4100 | OVOSTAR | 0.0573 | VINDEXUS | 0.0150 | AIRWAY | 0.0048 |
| MILLENNIUM | 1.2146 | DEBICA | 0.0563 | ASMGROUP | 0.0147 | MEXPOLSKA | 0.0047 |
| AMREST | 1.2048 | ZEPAK | 0.0558 | CITYSERV | 0.0145 | ERG | 0.0046 |
| KRUK | 0.9803 | KRUSZWICA | 0.0545 | ZUE | 0.0143 | PEMANAGER | 0.0046 |
| CCC | 0.8352 | R22 | 0.0537 | SERINUS | 0.0141 | BEDZIN | 0.0046 |
| BUDIMEX | 0.8294 | PCCROKITA | 0.0528 | IPOPEMA | 0.0137 | REMAK | 0.0046 |
| KERNEL | 0.8203 | ELEMENTAL | 0.0480 | PGO | 0.0136 | I2DEV | 0.0045 |
| ALIOR | 0.7759 | CORMAY | 0.0478 | LENA | 0.0136 | EUCO | 0.0045 |
| HANDLOWY | 0.7198 | MCI | 0.0463 | COGNOR | 0.0134 | PROTEKTOR | 0.0044 |
| GTC | 0.7074 | LENTEX | 0.0457 | LSISOFT | 0.0131 | ENAP | 0.0044 |
| INTERCARS | 0.6805 | ARCHICOM | 0.0455 | FEERUM | 0.0131 | GLCOSMED | 0.0044 |
| EUROCASH | 0.5867 | UNIBEP | 0.0454 | RELPOL | 0.0131 | K2INTERNT | 0.0043 |
| ENERGA | 0.5859 | ASBIS | 0.0450 | MORIZON | 0.0130 | NTTSYSTEM | 0.0041 |
| WIRTUALNA | 0.5531 | POLIMEXMS | 0.0448 | TRANSPOL | 0.0129 | MAXCOM | 0.0041 |
| BENEFIT | 0.5508 | ENELMED | 0.0445 | ELBUDOWA | 0.0126 | ALTA | 0.0041 |
| ENEA | 0.4984 | WIELTON | 0.0441 | ELEKTROTI | 0.0123 | SANTANDER | 0.0040 |
| TAURONPE | 0.4773 | TOYA | 0.0436 | POZBUD | 0.0121 | SUNEX | 0.0038 |
| DEVELIA | 0.4689 | INSTALKRK | 0.0434 | MOSTALZAB | 0.0121 | APSENERGY | 0.0037 |
| BNPPPL | 0.4326 | IMCOMPANY | 0.0426 | BOOMBIT | 0.0118 | ATLASEST | 0.0037 |
| GPW | 0.4297 | ASTARTA | 0.0414 | IZOSTAL | 0.0118 | HELIO | 0.0037 |
| COMARCH | 0.4135 | PGSSOFT | 0.0413 | ADIUVO | 0.0118 | WORKSERV | 0.0036 |
| GRUPAAZOTY | 0.3958 | BIOTON | 0.0410 | IDEABANK | 0.0117 | INTERFERI | 0.0035 |
| TSGAMES | 0.3796 | TORPOL | 0.0409 | PROJPRZEM | 0.0115 | INC | 0.0035 |
| CIECH | 0.3747 | PEKABEX | 0.0408 | CNT | 0.0115 | INTERSPPL | 0.0035 |
| ECHO | 0.3465 | ARCTIC | 0.0399 | DEKPOL | 0.0112 | KRVITAMIN | 0.0033 |
| 11BIT | 0.3406 | DECORA | 0.0396 | IMPEL | 0.0112 | WOJAS | 0.0033 |
| MOL | 0.3309 | RAWLPLUG | 0.0396 | SILVAIR-REGS | 0.0108 | TBULL | 0.0032 |
| FAMUR | 0.3262 | POLNORD | 0.0390 | FERRUM | 0.0105 | GROCLIN | 0.0032 |
| DOMDEV | 0.3148 | ERBUD | 0.0384 | MIRACULUM | 0.0104 | MWTRADE | 0.0032 |
| JSW | 0.2961 | GETIN | 0.0377 | APLISENS | 0.0103 | VISTAL | 0.0032 |
| ASSECOSEE | 0.2957 | ZPUE | 0.0339 | TESGAS | 0.0103 | 4FUNMEDIA | 0.0032 |
| UNICREDIT | 0.2832 | SECOGROUP | 0.0334 | IZOBLOK | 0.0102 | PATENTUS | 0.0031 |
| ASSECOBS | 0.2618 | QUERCUS | 0.0323 | DELKO | 0.0102 | WIKANA | 0.0029 |
| LIVECHAT | 0.2452 | MERCATOR | 0.0320 | ELZAB | 0.0101 | BRASTER | 0.0028 |
| AMICA | 0.2346 | MEDICALG | 0.0320 | VIVID | 0.0097 | PAMAPOL | 0.0028 |
| CLNPHARMA | 0.2332 | ATENDE | 0.0304 | PROCHEM | 0.0096 | TALEX | 0.0027 |
| VRG | 0.2238 | PANOVA | 0.0297 | SKOTAN | 0.0096 | BETACOM | 0.0026 |
| NEUCA | 0.2204 | OAT | 0.0284 | MOSTALWAR | 0.0094 | SUWARY | 0.0026 |
| MENNICA | 0.2046 | ULMA | 0.0278 | OPTEAM | 0.0092 | MOSTALPLC | 0.0025 |
| CEZ | 0.2021 | XTB | 0.0277 | RANKPROGR | 0.0091 | FON | 0.0024 |
| NEWAG | 0.1915 | KINOPOL | 0.0271 | WASKO | 0.0089 | RAFAMET | 0.0024 |
| FORTE | 0.1902 | CIGAMES | 0.0270 | SEKO | 0.0088 | BOWIM | 0.0024 |
| WAWEL | 0.1818 | UNIMOT | 0.0266 | KGL | 0.0087 | ELKOP | 0.0023 |
| APATOR | 0.1744 | INTERAOLT | 0.0262 | MASTERPHA | 0.0087 | SOLAR | 0.0023 |
| AGORA | 0.1728 | SELENAFM | 0.0251 | CELTIC | 0.0083 | PRAGMAFA | 0.0022 |
| PEP | 0.1725 | MERCOR | 0.0247 | ROPCZYCE | 0.0082 | ZREMB | 0.0020 |
| ALUMETAL | 0.1682 | MARVIPOL | 0.0233 | BIK | 0.0082 | EDINVEST | 0.0020 |
| RYVU | 0.1597 | MFO | 0.0232 | SETANTA | 0.0081 | TRITON | 0.0020 |
| NETIA | 0.1580 | TRAKCJA | 0.0232 | MDIENERGIA | 0.0081 | ATREM | 0.0019 |
| PKPCARGO | 0.1577 | INPRO | 0.0225 | PHARMENA | 0.0080 | EFEKT | 0.0019 |
| SNIEZKA | 0.1515 | SKARBIEC | 0.0223 | OTLOG | 0.0077 | ATLANTIS | 0.0019 |
| BORYSZEW | 0.1435 | STALPROFI | 0.0221 | LIBET | 0.0076 | KPPD | 0.0019 |
| SANOK | 0.1417 | HYDROTOR | 0.0211 | BAHOLDING | 0.0075 | WADEX | 0.0018 |
| MABION | 0.1402 | SYNEKTIK | 0.0211 | PEPEES | 0.0075 | TATRY | 0.0016 |
| PLAYWAY | 0.1387 | LUBAWA | 0.0210 | POLWAX | 0.0073 | PLAZACNTR | 0.0013 |
| ACAUTOGAZ | 0.1386 | XTPL | 0.0206 | IIAAV | 0.0072 | EUROHOLD | 0.0006 |
| ENTER | 0.1384 | IMS | 0.0202 | CDRL | 0.0070 | PROVIDENT | 0.0003 |
| MLPGROUP | 0.1327 | ALTUSTFI | 0.0201 | SILVANO | 0.0070 | MBWS | 0.0003 |
| AUTOPARTN | 0.1294 | VOTUM | 0.0200 | PLASTBOX | 0.0069 | NOVATURAS | 0.0003 |
| FERRO | 0.1267 | KRKA | 0.0197 | HERKULES | 0.0069 | FENGHUA | 0.0002 |
| COMP | 0.1262 | MIRBUD | 0.0196 | ARTIFEX | 0.0068 | AUGA | 0.0002 |
| STALPROD | 0.1219 | RADPOL | 0.0192 | FASING | 0.0068 | SOPHARMA | 0.0000 |
| STALEXP | 0.1197 | ZAMET | 0.0192 | PRAIRIE | 0.0063 | ||
| PBKM | 0.1123 | WITTCHEN | 0.0190 | LARQ | 0.0063 | ||
| ABPL | 0.1089 | MLSYSTEM | 0.0189 | AGROTON | 0.0062 | ||
Source: own preparation based one the https://gpwbenchmark.pl/en-historyczne-portfele (accessed on 10–20 May 2021).
Appendix B
Table A2.
Individual AR for each qualified case of reporting IoA by issuers from the WIG index in the year 2020 (in percentage point).
Table A2.
Individual AR for each qualified case of reporting IoA by issuers from the WIG index in the year 2020 (in percentage point).
| Issuers/Day of Event Window | Date of Current Reports | t−3 | t−2 | t−1 | t0 | t+1 | t+2 | t+3 | CAR |
|---|---|---|---|---|---|---|---|---|---|
| WIG20 | |||||||||
| PZU | 25.08.2020 | 0.45% | 0.52% | 0.33% | −0.10% | −1.50% | 0.15% | −0.22% | −0.37% |
| PGNIG | 12.05.2020 | 1.53% | −0.84% | −1.13% | 0.25% | −0.95% | 0.95% | −1.41% | −1.59% |
| 14.02.2020 | 2.18% | 0.53% | 0.74% | −0.85% | 2.54% | 1.04% | 0.76% | 6.93% | |
| PGE | 31.08.2020 | −3.99% | 0.09% | 3.12% | −2.63% | −0.14% | 1.10% | 1.15% | −1.30% |
| 13.03.2020 | 2.77% | −0.56% | −1.70% | −5.64% | 8.16% | 11.73% | −1.98% | 12.79% | |
| 14.02.2020 | 2.77% | −1.27% | −3.04% | −1.12% | −0.86% | −0.86% | −1.98% | −6.36% | |
| CCC | 21.09.2020 | −2.81% | −1.66% | 5.43% | −0.59% | −6.10% | 2.22% | −2.61% | −6.11% |
| ALIOR | 07.08.2020 | 3.09% | 1.85% | −0.58% | −1.87% | −0.30% | 8.14% | −0.52% | 9.80% |
| TAURONPE | 05.08.2020 | −2.63% | −2.28% | −0.77% | −5.49% | −1.57% | −3.39% | −1.86% | −17.99% |
| 04.03.2020 | 0.49% | 3.51% | 1.05% | −0.47% | −0.93% | 2.21% | 2.35% | 8.20% | |
| JSW | 28.07.2020 | −2.39% | −0.09% | −2.40% | −3.06% | −9.24% | −3.50% | 6.23% | −14.45% |
| mWIG40 | |||||||||
| ENERGA | 08.05.2020 | 0.26% | −0.90% | 1.20% | −1.12% | 0.11% | −3.02% | −0.16% | −3.63% |
| 31.03.2020 | 4.44% | 4.47% | −1.09% | 2.04% | 1.32% | −0.27% | −0.48% | 10.44% | |
| ENEA | 27.10.2020 | 0.31% | −0.83% | 1.40% | −1.27% | 5.61% | −2.50% | −1.57% | 1.16% |
| 11.08.2020 | −2.08% | −0.36% | 1.39% | 1.86% | −1.07% | 0.52% | −2.26% | −2.00% | |
| 19.05.2020 | 1.35% | −0.94% | −0.78% | 3.27% | −2.12% | −0.97% | −2.81% | −2.99% | |
| GRUPA AZOTY | 25.03.2020 | −5.32% | 3.90% | −0.49% | 0.21% | −2.34% | −0.20% | −2.33% | −6.57% |
| sWIG80 | |||||||||
| AGORA | 30.04.2020 | 0.36% | −0.54% | −2.47% | 5.93% | 2.02% | 0.96% | 0.50% | 6.76% |
| 17.01.2020 | 8.16% | 1.42% | −0.10% | −0.44% | −2.37% | 2.32% | −0.62% | 8.37% | |
| PEP | 30.12.2019 | −2.33% | −1.30% | 0.23% | −0.60% | −0.86% | 2.30% | −1.47% | −4.03% |
| SANOK | 06.03.2020 | −7.75% | 2.73% | 0.97% | 4.64% | 2.91% | 8.74% | 1.41% | 13.66% |
| RAINBOW | 27.06.2020 | −0.99% | −3.84% | −2.16% | −7.16% | −4.88% | 5.49% | −0.04% | −13.59% |
| ELEMENTAL | 27.02.2020 | −7.53% | 4.73% | −6.10% | −1.71% | −16.03% | 11.49% | 8.10% | −7.05% |
| ZEPAK | 23.09.2020 | 2.40% | −0.45% | 0.26% | 2.93% | −1.42% | 0.23% | −0.37% | 3.57% |
| POLNORD | 30.06.2020 | −1.48% | −2.17% | 0.23% | 4.80% | −3.14% | −3.04% | −1.06% | −5.87% |
| TRAKCJA | 18.03.2020 | 0.42% | 11.47% | 1.74% | 8.16% | −2.85% | 1.67% | 2.07% | 22.68% |
| RAFAKO | 24.09.2020 | 1.70% | 1.20% | −0.98% | −0.42% | 5.01% | −8.24% | −0.67% | −2.40% |
| BOOMBIT | 28.02.2020 | 0.06% | 3.06% | 7.62% | 9.23% | 9.63% | −16.19% | 7.55% | 20.97% |
| Others | |||||||||
| Getinoble | 27.08.2020 | −1.44% | 1.01% | −0.42% | −0.09% | −0.11% | 2.56% | 0.47% | 1.98% |
| Cormay | 04.04.2020 | −0.22% | 5.12% | 5.12% | −13.92% | −13.08% | −6.64% | −10.29% | −33.90% |
| Atende | 24.03.2020 | 10.89% | −12.52% | 6.52% | 7.95% | −8.15% | 0.47% | −0.46% | 4.70% |
| Zamet | 22.06.2020 | −0.67% | 5.78% | −0.09% | −1.65% | −4.62% | 0.28% | 0.97% | 0.00% |
| BBIDEV | 23.03.2020 | 9.40% | −3.22% | 2.41% | 4.11% | −10.15% | −1.59% | −3.56% | −2.60% |
| Polwax | 11.09.2020 | 3.58% | 4.71% | −1.88% | 0.31% | 2.20% | 1.82% | −1.75% | 8.99% |
| 21.04.2020 | −0.60% | −1.52% | 0.87% | −1.54% | −1.90% | −3.80% | 2.26% | −6.23% | |
| Bumech | 09.09.2020 | −0.91% | 11.49% | −3.18% | −1.54% | −3.56% | −0.34% | 3.22% | 5.18% |
| Herkules | 21.04.2020 | 2.12% | −5.23% | 0.48% | 2.53% | −3.33% | −0.22% | 1.89% | −1.76% |
| Mediacap | 03.04.2020 | −4.35% | 0.33% | −11.98% | 5.45% | 21.57% | −4.74% | 1.88% | 8.16% |
| Makarony Polskie | 02.04.2020 | −0.92% | 2.31% | 2.33% | −2.96% | −3.09% | 0.31% | 0.43% | −1.60% |
| Artifex Mundi | 19.03.2020 | 2.55% | −9.90% | −0.15% | −12.61% | −1.15% | 9.10% | −5.08% | −17.23% |
| 29.01.2020 | −3.63% | 2.46% | 1.65% | 0.21% | −3.52% | 1.20% | 0.07% | −1.56% | |
| Bedzin | 18.06.2020 | 8.14% | −1.75% | −6.04% | −0.08% | 23.93% | 5.26% | −5.48% | 23.98% |
| Otmuchow | 07.05.2020 | −12.23% | 0.37% | −2.06% | −2.06% | 0.30% | −0.17% | −3.18% | −19.03% |
| Protektor | 08.01.2020 | −0.77% | −1.24% | −5.38% | 4.91% | 2.73% | −0.28% | −2.88% | −2.92% |
| 4FUN | 25.09.2020 | −1.07% | 0.58% | 2.95% | 0.42% | −9.64% | 2.56% | −3.16% | −7.36% |
| 23.04.2020 | −1.74% | −4.47% | −1.15% | −0.94% | 3.15% | −2.42% | −0.35% | −7.92% | |
| 28.01.2020 | −0.44% | −0.71% | −2.25% | 0.05% | −5.63% | −0.67% | 0.59% | −9.07% | |
| Wikana | 28.08.2020 | 0.34% | −0.06% | 1.36% | −0.14% | −0.22% | −0.18% | 2.86% | 3.96% |
| 19.02.2020 | −3.72% | −0.29% | −2.66% | −2.60% | −0.41% | −1.56% | −2.18% | −13.43% | |
| INC | 11.05.2020 | −4.39% | −1.86% | 1.73% | 2.53% | −5.04% | 5.82% | −0.64% | −1.84% |
| Groclin | 08.05.2020 | −2.62% | 0.94% | −2.09% | −2.08% | −2.15% | −6.55% | 0.36% | −14.18% |
| Atlantis | 09.07.2020 | −2.04% | −0.54% | −0.43% | −3.60% | 4.09% | 0.25% | 0.00% | −2.27% |
| FON | 09.07.2020 | −4.79% | 2.99% | −1.55% | 0.89% | 7.13% | −0.40% | −1.35% | 2.91% |
| Elkop | 24.04.2020 | 1.65% | −5.61% | −3.25% | 2.24% | −2.36% | 0.15% | −4.65% | −11.83% |
Source: own calculation.
References
- AbuGhazaleh, Naser, Osama Al-Hares, and Ayman Haddad. 2012. The value relevance of goodwill impairments: UK evidence. International Journal of Economics and Finance 4: 206–16. [Google Scholar] [CrossRef]
- Akron, Sagi. 2011. Market reactions to dividend announcements under different business cycles. Emerging Markets Finance & Trade 47: 72–85. [Google Scholar]
- Alciatore, Mimi, Peter Easton, and Nasser Spear. 2000. Accounting for the impairment of long-lived assets: Evidence from the petrolelum industry. Journal of Accounting and Economics 29: 151–72. [Google Scholar] [CrossRef]
- Armitrage, Seth. 1995. Event study methods and evidence on their performance. Journal of Economic Surveys 9: 25–52. [Google Scholar] [CrossRef]
- Bian, Jiangze, Jun Wang, and Ge Zhang. 2012. Chinese Block Transactions and the Market Reaction. China Economic Review 23: 181–89. [Google Scholar] [CrossRef]
- Binder, John. 1998. The Event Study Methodology Since 1969. Review of Quantitative Finance and Acoounting 11: 111–37. [Google Scholar] [CrossRef]
- Bowen, Robert, and Urooj Khan. 2014. Market reactions to policy deliberations on fair value accounting and impairment rules during the financial crisis of 2008–2009. Journal of Accounting and Public Policy 33: 233–59. [Google Scholar] [CrossRef]
- Cheng, Yingmei, David Peterson, and Karen Sherrill. 2017. Admitting mistakes pays: The long term impact of goodwill impairment write-offs on stock prices. Journal of Economics & Finance 41: 311–29. [Google Scholar] [CrossRef]
- Choi, Tien. 2008. Asset Write-offs: An Empirical Investigation of Timeliness. Asia-Pacific Journal of Accounting & Economics 15: 11–28. [Google Scholar] [CrossRef]
- Corona, Carlos, and Ramandeep S. Randhawa. 2018. The Value of Confession: Admitting Mistakes to Build Reputation. The Accounting Review 93: 133–61. [Google Scholar] [CrossRef]
- Corrado, Charles, and Terry Zivney. 2011. The Sepcification and Power of the Sign Test in Event Study Hypothesis Tests Using Daily Stocks Returns. Journal of Financial and Quantiative Analysis 27: 465–78. [Google Scholar] [CrossRef]
- Cowan, Arnold R. 1992. Nonparametric Event Study Tests. Review of Quantitative Finance and Accounting 2: 344–48. [Google Scholar] [CrossRef]
- Dudycz, Tadeusz, and Jadwiga Praznikow. 2021. Does the Mark-to-Model Fair Value Measure Make Assets Impairment Noisy?: A Literature Review. Sustainability 12: 1504. [Google Scholar] [CrossRef] [Green Version]
- Elliott, John, and Douglas Hanna. 1996. Repeated accounting write-offs and the information content of earning. Journal of Accounting Research 34: 145–52. [Google Scholar] [CrossRef]
- Elliott, John, and Wayne Shaw. 1988. Write-Offs as Accounting Procedures to Manage Perceptions. Journal of Accounting Research 26: 91–119. [Google Scholar] [CrossRef]
- Fama, Eugene, Lawrence Fisher, Michael Jensen, and Richard Roll. 1969. The adjustment of stock prices to new information. International Economic Review 10: 1–21. [Google Scholar] [CrossRef]
- Fernandes, Joaquim, and Cristina Gonçalves. 2014. A relevância do goodwill e respetivas imparidades para o valor de mercado das empresas com títulos cotados: O caso da Euronext Lisbon. Revista Contabilidade e Gestão 15: 137–45. [Google Scholar]
- Fernandes, Joaquim, Cristina Gonçalves, Cristina Guerreiro, and Luis Pereira. 2016. Impairment losses: Causes and impacts. Review of Business Management 18: 305–18. [Google Scholar] [CrossRef] [Green Version]
- Geiger, Marshall A., Clive S. Lennox, and David S. North. 2008. The hiring of accounting and finance officers from audit firms: How did the market react? Review of Accounting Studies 13: 55–86. [Google Scholar] [CrossRef] [Green Version]
- Ghicas, Dimitrios C., Dimosthenis Hevas, and Aphroditi J. Papadaki. 1996. Fixed assets revaluations and their association with stock returns. European Accounting Review 5: 651–70. [Google Scholar] [CrossRef]
- Grabiński, Konrad. 2011. Reakcja rynku na informację zawartą w sprawozdaniu finansowym na przykładzie utraty wartości. Zeszyty Naukowe Uniwersytetu Ekonomicznego w Krakowie 849: 145–59. [Google Scholar]
- Green, Clifton. 2006. The Value of Client Access to Analyst Recommendations. The Journal of Financial and Quantitative Analysis 41: 1–24. [Google Scholar] [CrossRef]
- Gu, Feng, and Baruch Lev. 2011. Overpriced Shares, Ill-Advised Acquisitions, and Goodwill Impairment. Accounting Review 86: 1995–2022. [Google Scholar] [CrossRef]
- Gurgul, Henryk, and Tomasz Wójtowicz. 2014. The Impact of US Macroeconomic News on the Polish Stock Market. The Importance of Company Size to Information Flow. Central European Journal of Operations Research 22: 795–817. [Google Scholar] [CrossRef] [Green Version]
- Hamberg, Mattias, Mari Paananen, and Jiri Novak. 2011. The Adoption of IFRS 3: The Effects of Managerial Discretion and Stock Market Reactions. European Accounting Review 20: 263–88. [Google Scholar] [CrossRef] [Green Version]
- Horton, Joanne, and George Serafeim. 2009. Market reaction to and valuation of IFRS reconciliation adjustments: First evidence from the UK. Review of Accounting Studies 15: 725–51. [Google Scholar] [CrossRef]
- International Accounting Standard Board. 2008. International Accounting Standard No. 36 Impairment of Assets. Londyn: IASB Publisher House, Available online: https://www.ifrs.org/issued-standards/list-of-standards/ias-36-impairment-of-assets/ (accessed on 30 May 2021).
- Iatridis, George E., Kostas Pappas, and Martin Walker. 2021. Narrative Disclosure Quality and the Timeliness of Goodwill Impairments. British Accounting Review. Available online: https://www.sciencedirect.com/science/article/abs/pii/S0890838921000044 (accessed on 10 June 2021).
- International Monetary Fund. 2020. World Economic Outlook, April 2020: The Great Lockdown. Washington, D.C.: International Monetary Fund, Publication Services, Available online: https://www.imf.org/en/Publications/WEO/Issues/2020/04/14/weo-april-2020 (accessed on 29 May 2021).
- Jarva, Henry. 2009. Do firms manage fair value estimates? An examination of SFAS 142 goodwill impairments. Journal of Business Finance and Accounting 36: 1079–86. [Google Scholar] [CrossRef]
- Knauer, Thorsten, and Arnt Wohrmann. 2016. Market reaction to Goodwill Impairments. European Accounting Review 25: 421–49. [Google Scholar] [CrossRef]
- Krivin, Dmitry, Robert Patton, Erica Rose, and David Tabak. 2003. Determination of the Appropriate Event Window Length in Individual Stock Event Studies. New York: NERA Economic Consulting. [Google Scholar] [CrossRef]
- Laghi, Enrico, Marco Mattei, and Michele Di Marcantonio. 2013. Assessing the Value Relevance of Goodwill Impairment Considering Country-Specific Factors: Evidence from EU Listed Companies. International Journal of Economics and Finance 5: 32–49. [Google Scholar] [CrossRef] [Green Version]
- Lakshmi, V. D. M. V., and Medha Joshi. 2016. Market Reaction to Listing of Stocks on F&O Segment of NSE: Application of Event Study Methodology. IUP Journal of Apllied Economics 15: 37–76. [Google Scholar]
- Lisicki, Bartłomiej. 2021. Utrata Wartości Aktywów a Wycena Rynkowa Spółek Publicznych—Przykład Warszawskiej Giełdy Papierów Wartościowych. Katowice: Publishing House of University of Economics in Katowice, in print. [Google Scholar]
- MacKinlay, Craig A. 1997. Event Studies in Economics and Finance. Journal of Economic Literature 35: 13–39. [Google Scholar]
- National Bank of Poland. 2020. Information after the Meeting of the Monetary Policy Council on 8 April 2020. Available online: https://www.nbp.pl/homen.aspx?f=/srodeken.htm (accessed on 28 July 2021).
- Platje, Joost, Jeffrey Harvey, and Lez M. R. Bacchus. 2020. COVID-19—Reflections on the Surprise of Both an Expected and Unexpected Event. Central European Review of Economics and Management 4: 149–62. [Google Scholar] [CrossRef]
- Reboredo, Juan. 2015. Is there dependence and systemic risk between oil and renewable Energy stock prices? Energy Economics 48: 32–45. [Google Scholar] [CrossRef]
- Shapiro, Samuel, and Martin Wilk. 1965. Ananalysis of variance test for normality (completesamples). Biometries 52: 591–611. [Google Scholar] [CrossRef]
- Sharpe, William. 1963. Capital Asset Prices: A Theory of Market Equilibrium under Conditions of Risk. Journal of Finance 19: 425–42. [Google Scholar] [CrossRef] [Green Version]
- Singh, Bhanwar, Rosy Dhall, Sahil Narang, and Sawita Ravat. 2020. The Outbreak of COVID-19 and Stock Market Responses: An Event Study and Panel Data Analysis for G-20 Countries. Global Business Review. Available online: https://journals.sagepub.com/doi/full/10.1177/0972150920957274 (accessed on 28 May 2021).
- Sorescu, Alina, Nooshin L. Warren, and Larisa Ertekin. 2017. Event study methodology in the marketing literature: An overview. Journal of the Academy of Marketing Science 45: 186–207. [Google Scholar] [CrossRef]
- Stooq.com. 2021. Quotations of Polish Shares. Available online: https://stooq.pl/t/?i=523 (accessed on 1 June 2021).
- Strong, John, and John Meyer. 1987. Asset Writedowns: Managerial Incentives and Security Returns. Journal of Finance 42: 643–61. [Google Scholar] [CrossRef]
- Sudarsanam, Sudi. 2003. Creating Value from Mergers and Acquisitions. Harlow: Prentice Hall, pp. 90–103. [Google Scholar]
- Taleb, Nassim N. 2010. The Black Swan: The Impact of the Highly Improbable. London: Penguin, pp. 40–56. [Google Scholar]
- Thakur, Shreeram. 2020. Effect of COVID-19 on Capital Market with Reference to S&P 500. International Journal of Adnaced Research 8: 1180–88. [Google Scholar]
- World Health Organization. 2020. WHO Director-General’s Opening Remarks at the Media Briefing on COVID-19—11 March 2020. Available online: https://www.who.int/director-general/speeches/detail/who-director-general-s-opening-remarks-at-the-media-briefing-on-covid-19-11-march-2020 (accessed on 29 May 2021).
- Wilcoxon, Frank. 1945. Individual comparisons by ranking methods. Biometrics Bulletin 1: 80–83. [Google Scholar] [CrossRef]
- Zhang, Dayong, Min Hu, and Qiang Ji. 2020. Financial markets under the global pandemic of COVID-19. Finance Research Letters 36: 101528. [Google Scholar] [CrossRef]
- Zucca, Linda, and David Campbell. 1992. A closer look at discretionary writedowns od impaired assets. Accounting Horizons 6: 30–41. [Google Scholar]
Figure 1.
The list of the number of current reports of issuers from the WIG index informing about an impairment of assets in the years 2013–2018 and 2020. Source: own preparation.
Figure 1.
The list of the number of current reports of issuers from the WIG index informing about an impairment of assets in the years 2013–2018 and 2020. Source: own preparation.

Table 1.
Current reports informing about the impairment of assets submitted by issuers grouped in WIG index in the year 2020.
Table 1.
Current reports informing about the impairment of assets submitted by issuers grouped in WIG index in the year 2020.
| Issuer/Date (s) of Current Report | Issuer/Date (s) of Current Report | ||
|---|---|---|---|
| WIG20 | mWIG40 | ||
| ALIOR | 07.08.2020 | ENEA | 27.10.2020 |
| 11.08.2020 | |||
| 19.05.2020 | |||
| 14.02.2020 | |||
| CCC | 21.09.2020 | ENERGA | 23.07.2020 |
| 19.05.2020 | |||
| 08.05.2020 | |||
| 31.03.2020 | |||
| JSW | 28.07.2020 | FAMUR | 10.02.2020 |
| PGE | 31.08.2020 | GRUPAAZOTY | 25.03.2020 |
| 13.03.2020 | Others | ||
| 14.02.2020 | GETINOBLE | 27.08.2020 | |
| PGNIG | 08.10.2020 | PZ CORMAY | 04.04.2020 |
| 12.05.2020 | ATENDE | 24.03.2020 | |
| 14.02.2020 | ZAMET | 22.06.2020 | |
| PKNORLEN | 04.05.2020 | MONNARI | 13.02.2020 |
| PZU | 25.08.2020 | BBIDEV | 23.03.2020 |
| TAURONPE | 05.08.2020 | ASM GROUP | 30.09.2020 |
| 30.06.2020 | |||
| sWIG80 | RAFAKO | 24.09.2020 | |
| AGORA | 30.04.2020 | ELEKTROTIM | 02.06.2020 |
| 17.01.2020 | POLWAX | 11.09.2020 | |
| 21.04.2020 | |||
| BAH | 07.08.2020 | MOSTOSTAL WARSZAWA | 27.03.2020 |
| BIOTON | 10.04.2020 | SFINKS | 29.09.2020 |
| BOOMBIT | 28.02.2020 | BUMECH | 09.09.2020 |
| BORYSZEW | 26.05.2020 | HERKULES | 21.04.2020 |
| 09.03.2020 | MEDIACAP | 03.04.2020 | |
| DATAWALK | 04.09.2020 | MAKARONY POLSKIE | 02.04.2020 |
| 16.11.2020 | FASING | 02.04.2020 | |
| ELEMENTAL | 27.02.2020 | ARTIFEX MUNDI | 19.03.2020 |
| 29.01.2020 | |||
| PEP | 30.12.2019 | LARQ | 23.10.2020 |
| 24.04.2020 | |||
| POLNORD | 30.06.2020 | BEDZIN | 18.06.2020 |
| RAFAKO | 24.09.2020 | OTMUCHOW | 07.05.2020 |
| RAINBOW | 27.06.2020 | PROTEKTOR | 08.01.2020 |
| SANOK | 06.03.2020 | 4FUN | 25.09.2020 |
| TRAKCJA | 18.03.2020 | 23.04.2020 | |
| 28.01.2020 | |||
| ZEPAK | 23.09.2020 | WIKANA | 28.08.2020 |
| 19.02.2020 | |||
| 26.03.2020 | INC | 11.05.2020 | |
| GROCLIN | 08.05.2020 | ||
| PLAZA CENTERS | 31.03.2020 | ||
| ATLANTIS | 09.07.2020 | ||
| FON | 09.07.2020 | ||
| ELKOP | 24.04.2020 | ||
| 07.02.2020 | |||
Source: http://infostrefa.com/infostrefa/pl/index/(accessed on 10–20 May 2021).
Table 2.
All qualified cases of current reports about impairment of assets submitted by issuers from WIG index in 2020.
Table 2.
All qualified cases of current reports about impairment of assets submitted by issuers from WIG index in 2020.
| Issuer | Date of Current Report | Number of Current Report | Amount of Write-Off (in Million PLN) | Group of Impaired Assets |
|---|---|---|---|---|
| WIG20 | ||||
| ALIOR | 07.08.2020 | 37/2020 | 676 | Other |
| CCC | 21.09.2020 | 61/2020 | 448.7 | Other |
| JSW | 28.07.2020 | 28/2020 | 431 | Tangible fixed assets |
| PGE | 31.08.2020 | 25/2020 | 1012 | Other |
| 13.03.2020 | 10/2020 | 7100 | Tangible fixed assets | |
| 14.02.2020 | 5/2020 | 79 | Tangible fixed assets | |
| PGNIG | 12.05.2020 | 18/2020 | 770 | Tangible fixed assets |
| 14.02.2020 | 6/2020 | 837 | Other | |
| PZU | 25.08.2020 | 28/2020 | 1594 | Intangible assets |
| TAURONPE | 05.08.2020 | 37/2020 | 227 | Other |
| 04.03.2020 | 5/2020 | 914 | Other | |
| mWIG40 | ||||
| ENERGA | 08.05.2020 | 39/2020 | 502 | Other |
| 31.03.2020 | 26/2020 | 340 | Other | |
| ENEA | 27.10.2020 | 47/2020 | 254 | Long-term investments |
| 11.08.2020 | 18/2020 | 1027 | Tangible fixed assets | |
| 19.05.2020 | 6/2020 | 53 | Long-term investments | |
| GRUPAAZOTY | 25.03.2020 | 17/2020 | 28.8 | Long-term investments |
| sWIG80 | ||||
| AGORA | 30.04.2020 | 20/2020 | 59.5 | Long-term investments |
| 17.01.2020 | 1/2020 | 11.2 | Long-term investments | |
| BOOMBIT | 28.02.2020 | 6/2020 | 5.9 | Intangible assets |
| ELEMENTAL | 27.02.2020 | 26/2020 | 6.06 | Other |
| PEP | 30.12.2019 | 40/2019 | 16 | Long-term investments |
| POLNORD | 30.06.2020 | 45/2020 | 52.2 | Tangible fixed assets |
| RAFAKO | 24.09.2020 | 50/2020 | 166.5 | Other |
| RAINBOW | 27.06.2020 | 25/2020 | 13.2 | Other |
| SANOK | 06.03.2020 | 2/2020 | 41.6 | Long-term investments |
| TRAKCJA | 18.03.2020 | 8/2020 | 252.4 | Other |
| ZEPAK | 23.09.2020 | 45/2020 | 289 | Tangible fixed assets |
| Others | ||||
| GETINOBLE | 27.08.2020 | 21/2020 | 90 | Long-term investments |
| PZ CORMAY | 04.04.2020 | 9/2020 | 36.98 | Intangible assets |
| ATENDE | 24.03.2020 | 3/2020 | 3.15 | Long-term investments |
| ZAMET | 22.06.2020 | 8/2020 | 15.1 | Long-term investments |
| BBIDEV | 23.03.2020 | 6/2020 | 32.5 | Stocks |
| POLWAX | 11.09.2020 | 29/2020 | 2.4 | Tangible fixed assets |
| 21.04.2020 | 10/2020 | 77.2 | Tangible fixed assets | |
| BUMECH | 09.09.2020 | 40/2020 | 14.2 | Other |
| HERKULES | 21.04.2020 | 20/2020 | 7.1 | Tangible fixed assets |
| MEDIACAP | 03.04.2020 | 9/2020 | 2.3 | Intangible assets |
| MAKARONY POLSKIE | 02.04.2020 | 9/2020 | 2.6 | Intangible assets |
| ARTIFEX MUNDI | 19.03.2020 | 10/2020 | 11.4 | Intangible assets |
| 29.01.2020 | 4/2020 | 3.9 | Intangible assets | |
| BEDZIN | 18.06.2020 | 13/2020 | 104 | Other |
| OTMUCHOW | 07.05.2020 | 9/2020 | 5.1 | Tangible fixed assets |
| PROTEKTOR | 08.01.2020 | 1/2020 | 1.93 | Investment estates |
| 4FUN | 25.09.2020 | 22/2020 | 6.98 | Long-term investments |
| 23.04.2020 | 10/2020 | 7.7 | Long-term investments | |
| 28.01.2020 | 4/2020 | 3.2 | Long-term investments | |
| WIKANA | 28.08.2020 | 24/2020 | 2.1 | Tangible fixed assets |
| 19.02.2020 | 9/2020 | 4.6 | Tangible fixed assets | |
| INC | 11.05.2020 | 10/2020 | 3.1 | Long-term investments |
| GROCLIN | 08.05.2020 | 7/2020 | 16.05 | Other |
| ATLANTIS | 09.07.2020 | 5/2020 | 12.9 | Long-term investments |
| FON | 09.07.2020 | 21/2020 | 15.3 | Long-term investments |
| ELKOP | 24.04.2020 | 15/2020 | 1.7 | Long-term investments |
| 07.02.2020 | 7/2020 | 7.4 | Investment estates | |
Source: own preparation based one the current reports by issuers available at: http://infostrefa.com/infostrefa/pl/index/ (accessed on 10–20 May 2021).
Table 3.
Cross-section analysis of AAR for each qualified case of reporting IoA by issuers from the WIG index in year 2020 (in percentage point).
Table 3.
Cross-section analysis of AAR for each qualified case of reporting IoA by issuers from the WIG index in year 2020 (in percentage point).
| Issuers/Day of Event Window | T−3 | t−2 | T−1 | t0 | t+1 | t+2 | t+3 | CAR |
|---|---|---|---|---|---|---|---|---|
| All qualified Issuers (55) | −0.09 | 0.14 | −0.50 | 0.00 | −0.65 | 0.33 | −0.58 | 1.04 |
| WIG20, mWIG40, sWIG80 Issuers (28) | −0.23 | 0.77 | 0.07 | 0.31 | −0.76 | 0.68 | 0.20 | 1.04 |
| WIG20 Issuers (11) | 0.13 | −0.02 | 0.10 | −1.96 ** | −0.99 | 1.80 | −0.01 | −0.95 |
| mWIG40 Issuers (6) | −0.17 | 0.89 | 0.27 | 0.83 | 0.25 | −1.07 | −1.60 * | −0.60 |
| sWIG80 Issuers (11) | −0.63 | 1.48 | −0.07 | 2.30 | −1.09 | 0.52 | 1.40 | 3.92 |
| Other Issuers (27) | 0.07 | −0.51 | −1.10 | −0.33 | −0.53 | −0.03 | −1.40 | −3.83 |
** statistical significance at level p < 0.01. * statistical significance at level p < 0.05. Source: own calculation.
Table 4.
Cross-section analysis of AAR for each qualified case of reporting IoA by issuers from the WIG index in years 2013–2018 (in percentage point).
Table 4.
Cross-section analysis of AAR for each qualified case of reporting IoA by issuers from the WIG index in years 2013–2018 (in percentage point).
| Issuers/Day of Event Window | t−3 | t−2 | t−1 | t0 | t+1 | t+2 | t+3 | CAR |
|---|---|---|---|---|---|---|---|---|
| All qualified Issuers (87) | 0.08 | −0.06 | 0.03 | −0.71 * | −1.05 ** | 0.34 | 0.21 | −1.16 |
| WIG20, mWIG40, sWIG80 Issuers (49) | −0.11 | −0.56 | 0.06 | −0.31 | −0.98 * | 0.73 | 0.22 | −0.96 |
| WIG20 Issuers (16) | −0.59 | −0.17 | −0.29 | 0.61 | −0.36 | 1.06 * | −0.09 | 0.17 |
| mWIG40 Issuers (12) | −0.48 | −1.06 * | 0.15 | −0.08 | −0.01 | 0.93 | 0.34 | −0.21 |
| sWIG80 Issuers (21) | 0.48 | −0.58 | 0.27 | −1.14 ** | −2.02 ** | 0.37 | 0.39 | −2.24 |
| Other Issuers (38) | 0.31 | 0.59 | −0.01 | −1.24 ** | −1.13 ** | −0.16 | 0.20 | −1.43 |
** statistical significance at level p < 0.01. * statistical significance at level p < 0.05. Source: own calculation.
Publisher’s Note: MDPI stays neutral with regard to jurisdictional claims in published maps and institutional affiliations. |
© 2021 by the author. Licensee MDPI, Basel, Switzerland. This article is an open access article distributed under the terms and conditions of the Creative Commons Attribution (CC BY) license (https://creativecommons.org/licenses/by/4.0/).
Share and Cite
MDPI and ACS Style
Lisicki, B. Impairment of Assets and Market Reaction during COVID-19 Pandemic on the Example of WSE. Risks 2021, 9, 183. https://doi.org/10.3390/risks9100183
AMA Style
Lisicki B. Impairment of Assets and Market Reaction during COVID-19 Pandemic on the Example of WSE. Risks. 2021; 9(10):183. https://doi.org/10.3390/risks9100183
Chicago/Turabian StyleLisicki, Bartłomiej. 2021. "Impairment of Assets and Market Reaction during COVID-19 Pandemic on the Example of WSE" Risks 9, no. 10: 183. https://doi.org/10.3390/risks9100183
Note that from the first issue of 2016, this journal uses article numbers instead of page numbers. See further details here.