
Analysis of the Impact of COVID-19 Pandemic on the Intraday Efficiency of Agricultural Futures Markets


1
Department of Management Sciences, Comsats University, Park Road, Islamabad 45550, Pakistan
2
VALORIZA—Research Center for Endogenous Resource Valorization, 7300-555 Portalegre, Portugal
3
Instituto Politécnico de Portalegre, 7300-110 Portalegre, Portugal
*
Author to whom correspondence should be addressed.
J. Risk Financial Manag. 2022, 15(12), 607; https://doi.org/10.3390/jrfm15120607
Submission received: 20 October 2022
/
Revised: 13 December 2022
/
Accepted: 14 December 2022
/
Published: 15 December 2022
(This article belongs to the Special Issue Commodity Market Finance)
Abstract
:The investigation of the fractal nature of financial data has been growing in the literature. The purpose of this paper is to investigate the impact of the COVID-19 pandemic on the efficiency of agricultural futures markets by using multifractal detrended fluctuation analysis (MF-DFA). To better understand the relative changes in the efficiency of agriculture commodities due to the pandemic, we split the dataset into two equal periods of seven months, i.e., 1 August 2019 to 10 March 2020 and 11 March 2020 to 25 September 2020. We used the high-frequency data at 15 min intervals of cocoa, cotton, coffee, orange juice, soybean, and sugar. The findings reveal that the COVID-19 pandemic has great but varying impacts on the intraday multifractal properties of the selected agricultural future markets. In particular, the London sugar witnessed the lowest multifractality while orange juice exhibited the highest multifractality before the pandemic declaration. Cocoa became the most efficient while the cotton exhibited the minimum efficient pattern after the pandemic. Our findings show that the highest improvement is found in the market efficiency of orange juice. Furthermore, the behavior of these agriculture commodities shifted from a persistent to an antipersistent behavior after the pandemic. The information given by the detection of multifractality can be used to support investment and policy-making decisions.
1. Introduction
According to the World Health Organization (WHO), COVID-19 has led to more than 620,000,000 confirmed infections along with more than 6,500,000 confirmed deaths. Keeping in view the alarming levels of spread and severity, the World Health Organization (WHO), on 11 March 2020, declared COVID-19 a pandemic. In addition to human loss, the indirect effects through fear and uncertainty have fostered a sense of emergency and tendency of pessimism (Barrafrem et al. 2020).
The COVID-19 pandemic has far-reaching economic implications and is becoming an extremely serious economic event (Laing 2020). It triggered a global lockdown and significantly impacted global mobility. Sadowski et al. (2021) investigated the connection between the transmission of COVID-19 and human movement and discovered that “retail and recreation areas”, “transit stations”, “workplaces”, “grocery stores”, and “pharmacies” are the hotspots for COVID-19 dissemination. Hence, the transport and energy industries suffered significant financial losses as a result of restricted movement. All forms of transport were suspended, with the exception of a few emergency situations. A similar situation prevailed in all other sectors, leading to a sharp drop in energy demand. The food business attempted to cope with COVID-19 but supply lines from farmers to retail stores and consumers were disrupted by the closure of many restaurants. However, grocery businesses and supermarkets benefited reasonably well in terms of volume of sales and earnings as a result of panic buying. Due to delays in electronic goods and industry shipments, many technological companies ceased operations. However, COVID-19 raised the need for medical supplies and medication, which increased sales for pharmaceutical and healthcare organizations. Likewise, the revenue of Internet-based companies soared due to increased online activities such as remote office working and remote learning (Alam et al. 2021).
Global financial markets, on the other hand, also reacted strongly to this immense outbreak (Nicola et al. 2020). Fast-growing literature is focusing on different aspects of financial impacts caused by the COVID-19 pandemic. During the COVID-19 pandemic, financial markets became risky (Ali et al. 2020; Barro et al. 2020), with a drastic decline in the stock market indices (Czech et al. 2020; McKibbin and Vines 2020) and causing enormous losses (Zhang et al. 2020). This pandemic had larger impacts on the US stock market than other regions (Garcin et al. 2020). In comparison, Topcu and Gulal (2020) reported a larger impact on Asian stock markets than on European ones. From a global perspective, Aslam et al. (2020d) documented a structural change and significant changes in the financial networks due to COVID-19. Furthermore, the market’s reaction to confirmed cases is larger than the confirmed deaths (Ashraf 2020). Likewise, Ali et al. (2020) reported the deterioration of financial markets when this outbreak changed from an epidemic to a pandemic.
Since the beginning of the pandemic, we can attest to a growing number of research studies focusing on the financial impacts of COVID-19 pandemic. Recently, different topics had been developed, including financial networks, (Aslam et al. 2020d; Zhang et al. 2020), stock market reactions (Aslam et al. 2020c; Zhang et al. 2020), exchange-rate fluctuation during pandemic (Njindan Iyke 2020), oil-market reactions (Apergis and Apergis 2020; Devpura and Narayan 2020), air-quality performance and multifractality (Ming et al. 2020; Sipra et al. 2021), insurance (Wang et al. 2020b), and gold and cryptocurrencies (Corbet et al. 2020).
Multifractality is central to the science of complexity and it is possible to find different applications in several essential areas of scientific activity, including physics (Muzy et al. 2008; Subramaniam et al. 2008), chemistry (Stanley and Meakin 1988; Udovichenko and Strizhak 2002), biology (Makowiec et al. 2009; Rosas et al. 2002), hydrology (Telesca et al. 2005b), environment (Farjah 2019; Sipra et al. 2021), linguistics (Drożdż et al. 2016), physiology (Nagy et al. 2017), psychology (Kelty-Stephen 2017), behavioral sciences (Ihlen and Vereijken 2013), economics (Drożdż et al. 2010), or even in music (Jafari et al. 2007) and sin markets (Aslam et al. 2021a). Particularly, multifractal detrended fluctuation analysis (MFDFA) is a stronger tool capable of detecting long-term correlations in nonstationary time series (Laib et al. 2018). In the context of finance, it helps to determine the efficiency ranking of the markets under study despite revealing the extent of the inefficiency (Rizvi et al. 2014). After the seminal works of (Mandelbrot 1967; Mandelbrot and Wallis 1969; Mandelbrot 1971, 1982, 1997), when the author introduced the concept of fractal geometry, after investigating the behavior of cotton prices and finding that these commodity prices do not exhibit a random-walk behavior, this particular method was applied to several fields with data structures, including finance (Kumar and Deo 2009; Oh et al. 2010; Podobnik and Stanley 2008; Wang and Liu 2010).
The COVID-19 pandemic also affected the efficiency of different financial markets. For instance, the intraday efficiency of European stock markets and exchange-rate markets declined during the COVID-19 outbreak (Aslam et al. 2020b). Furthermore, Aslam et al. (2020a) reported that the stock-market efficiency varies with the evolution of COVID-19 with decreasing efficiency in February–March (2020) and a recovery in April–May (2020). Particularly with respect to commodity markets, the experimental findings of (Wang et al. 2020a, 2020b) indicate that the cross-correlations of multifractality between crude oil and sugar future markets remained stronger during the pandemic. On the other hand, the efficiency of the cryptocurrency market improved during the COVID-19 pandemic (Aslam et al. 2021b; Mnif et al. 2020).
Historically, a diverse range of techniques had been adopted to analyze the efficiency of agricultural markets, including the cointegration test (Ali and Gupta 2011), VR test (Mishra 2019), and social loss index (Consuegra and Garcia-Verdugo 2017), among others. However, few studies have investigated the efficiency of agriculture commodities by applying econophysics techniques such as DFA (Cao and Xu 2016; Kim et al. 2011; Kim and Venkatachalam 2011) and MF-DFA (Aslam et al. 2022a). Li and Lu (2011) applied MF-DFA and multifractal spectrum analysis on Chinese agricultural markets and confirmed the presence of multifractality, with highest levels in the hard winter wheat commodity market. In a recent study, Stosic et al. (2020) examined the fractal behavior of the Brazilian agriculture market through MF-DFA and confirmed that coffee futures showed the highest multifractality among the other commodities.
This paper is unique and different in many ways. Unlike other financial markets, the agricultural commodity future markets were jolted during COVID-19 through three main channels: demand, supply, and heightened uncertainty (Sifat et al. 2021). Due to basic exposure and market emotions, different commodity classes experienced varying degrees of shocks. For instance, as global demand declined during the pandemic, oil prices fell to their lowest levels since 1995, falling more steeply than other commodities and financial markets (Aslam et al. 2022b). The futures of agricultural commodities such as soybean and rice rose sharply, while corn and coffee remained stable, presumably as a result of steady real demand, declining currencies, and decreasing production of edible oil. The futures markets were established to allow economic agents to protect themselves against price risk. However, these economic and financial shocks brought about by the pandemic outbreak inflate a long-standing futures-related conundrum. Hence, it is essential to pay close attention to how commodity markets futures behaved during the COVID-19 outbreak.
We make the following contributions to the recent literature on COVID-19 and its impact on agricultural commodity markets. Firstly, as far as we are aware, this is the first study to distinguish between the impacts of the COVID-19 pandemic on the efficiency of agricultural futures markets in a multifractal context. To do this, we followed (Aslam et al. 2021b), and divided the overall data into two equal periods, before the outbreak of the pandemic (1 August 2018 to 10 March 2020) and afterwards (11 March 2020 to 25 September 2020). Secondly, unlike other studies, we employed the 15 min high-frequency data of six agricultural futures: cocoa, cotton, coffee, orange juice, soybean, and sugar. This is justified by the fact that, compared to daily data, high-frequency data allows for a more precise calculation of the complexity and multifractal properties in a time series (Aslam et al. 2021b, 2021c). Thirdly, the robust fractal market-theory-based MFDFA of Kantelhardt et al. (2002) is used in this study. Using this approach, we investigate four key questions: (1) Do agricultural future markets have multifractal properties? (2) Do agricultural future markets’ multifractal characteristics change before and after the declaration of the COVID-19 pandemic? (3) Does the strength of the multifractal characteristics change before and after the declaration of the COVID-19 pandemic? (4) Do the persistent behavior or autocorrelation characteristics change before and after the declaration of the COVID-19 pandemic?
2. Data Description
Despite the fear of inciting panic or prompting some countries to flag in their efforts, the World Health Organization (WHO) had to declare the novel coronavirus (COVID-19) as a global pandemic on 11 March 2020 (Maier and Brockmann 2020). In a few weeks, this pandemic shaved off nearly a third of the global market capitalization. Numerous studies have revealed that COVID-19 primarily impacted financial markets in the second and third quarters of 2020, which is from March 2020 to September 2020 (Aslam et al. 2021b). For instance, Aslam et al. (2021b) quantified the self-similarity intensity of six stock markets in Europe and Asia and investigated the quarterly variations in herding behavior using MFDFA. They discovered that COVID-19 had a variable influence on these markets on a quarterly basis, but that the impact peaked in the second quarter and recovered in the third and fourth quarters of 2020. Hence, following Aslam et al. (2021b), we restrict our period from 1 August 2019 to 25 September 2020 and split the dataset into two equal periods of seven months. By using the pandemic declaration date, the intraday prices ranging from 1 August 2019 to 10 March 2020 refer to the period before the pandemic and prices from 11 March 2020 to 25 September 2020 form the sample for the period after announcing the pandemic. To overcome the problem of microstructure noise and duplicate values, the high-frequency data is aggregated into a 15 min frequency, which is the highest and best frequency and is in line with (Aslam et al. 2021b; Chen et al. 2022; Zhang and Ma 2021). Due to removal of the duplicate values and different number of trading days in different months, we have a different number of observations for these time periods. The list of agriculture commodities, data range, and the number of observations of both time periods are presented in Table 1. These commodities were chosen solely on the basis of the availability of intraday data. In Figure 1, the trend shows an instant decline in all commodity prices after the declaration of the pandemic, except for orange Juice.
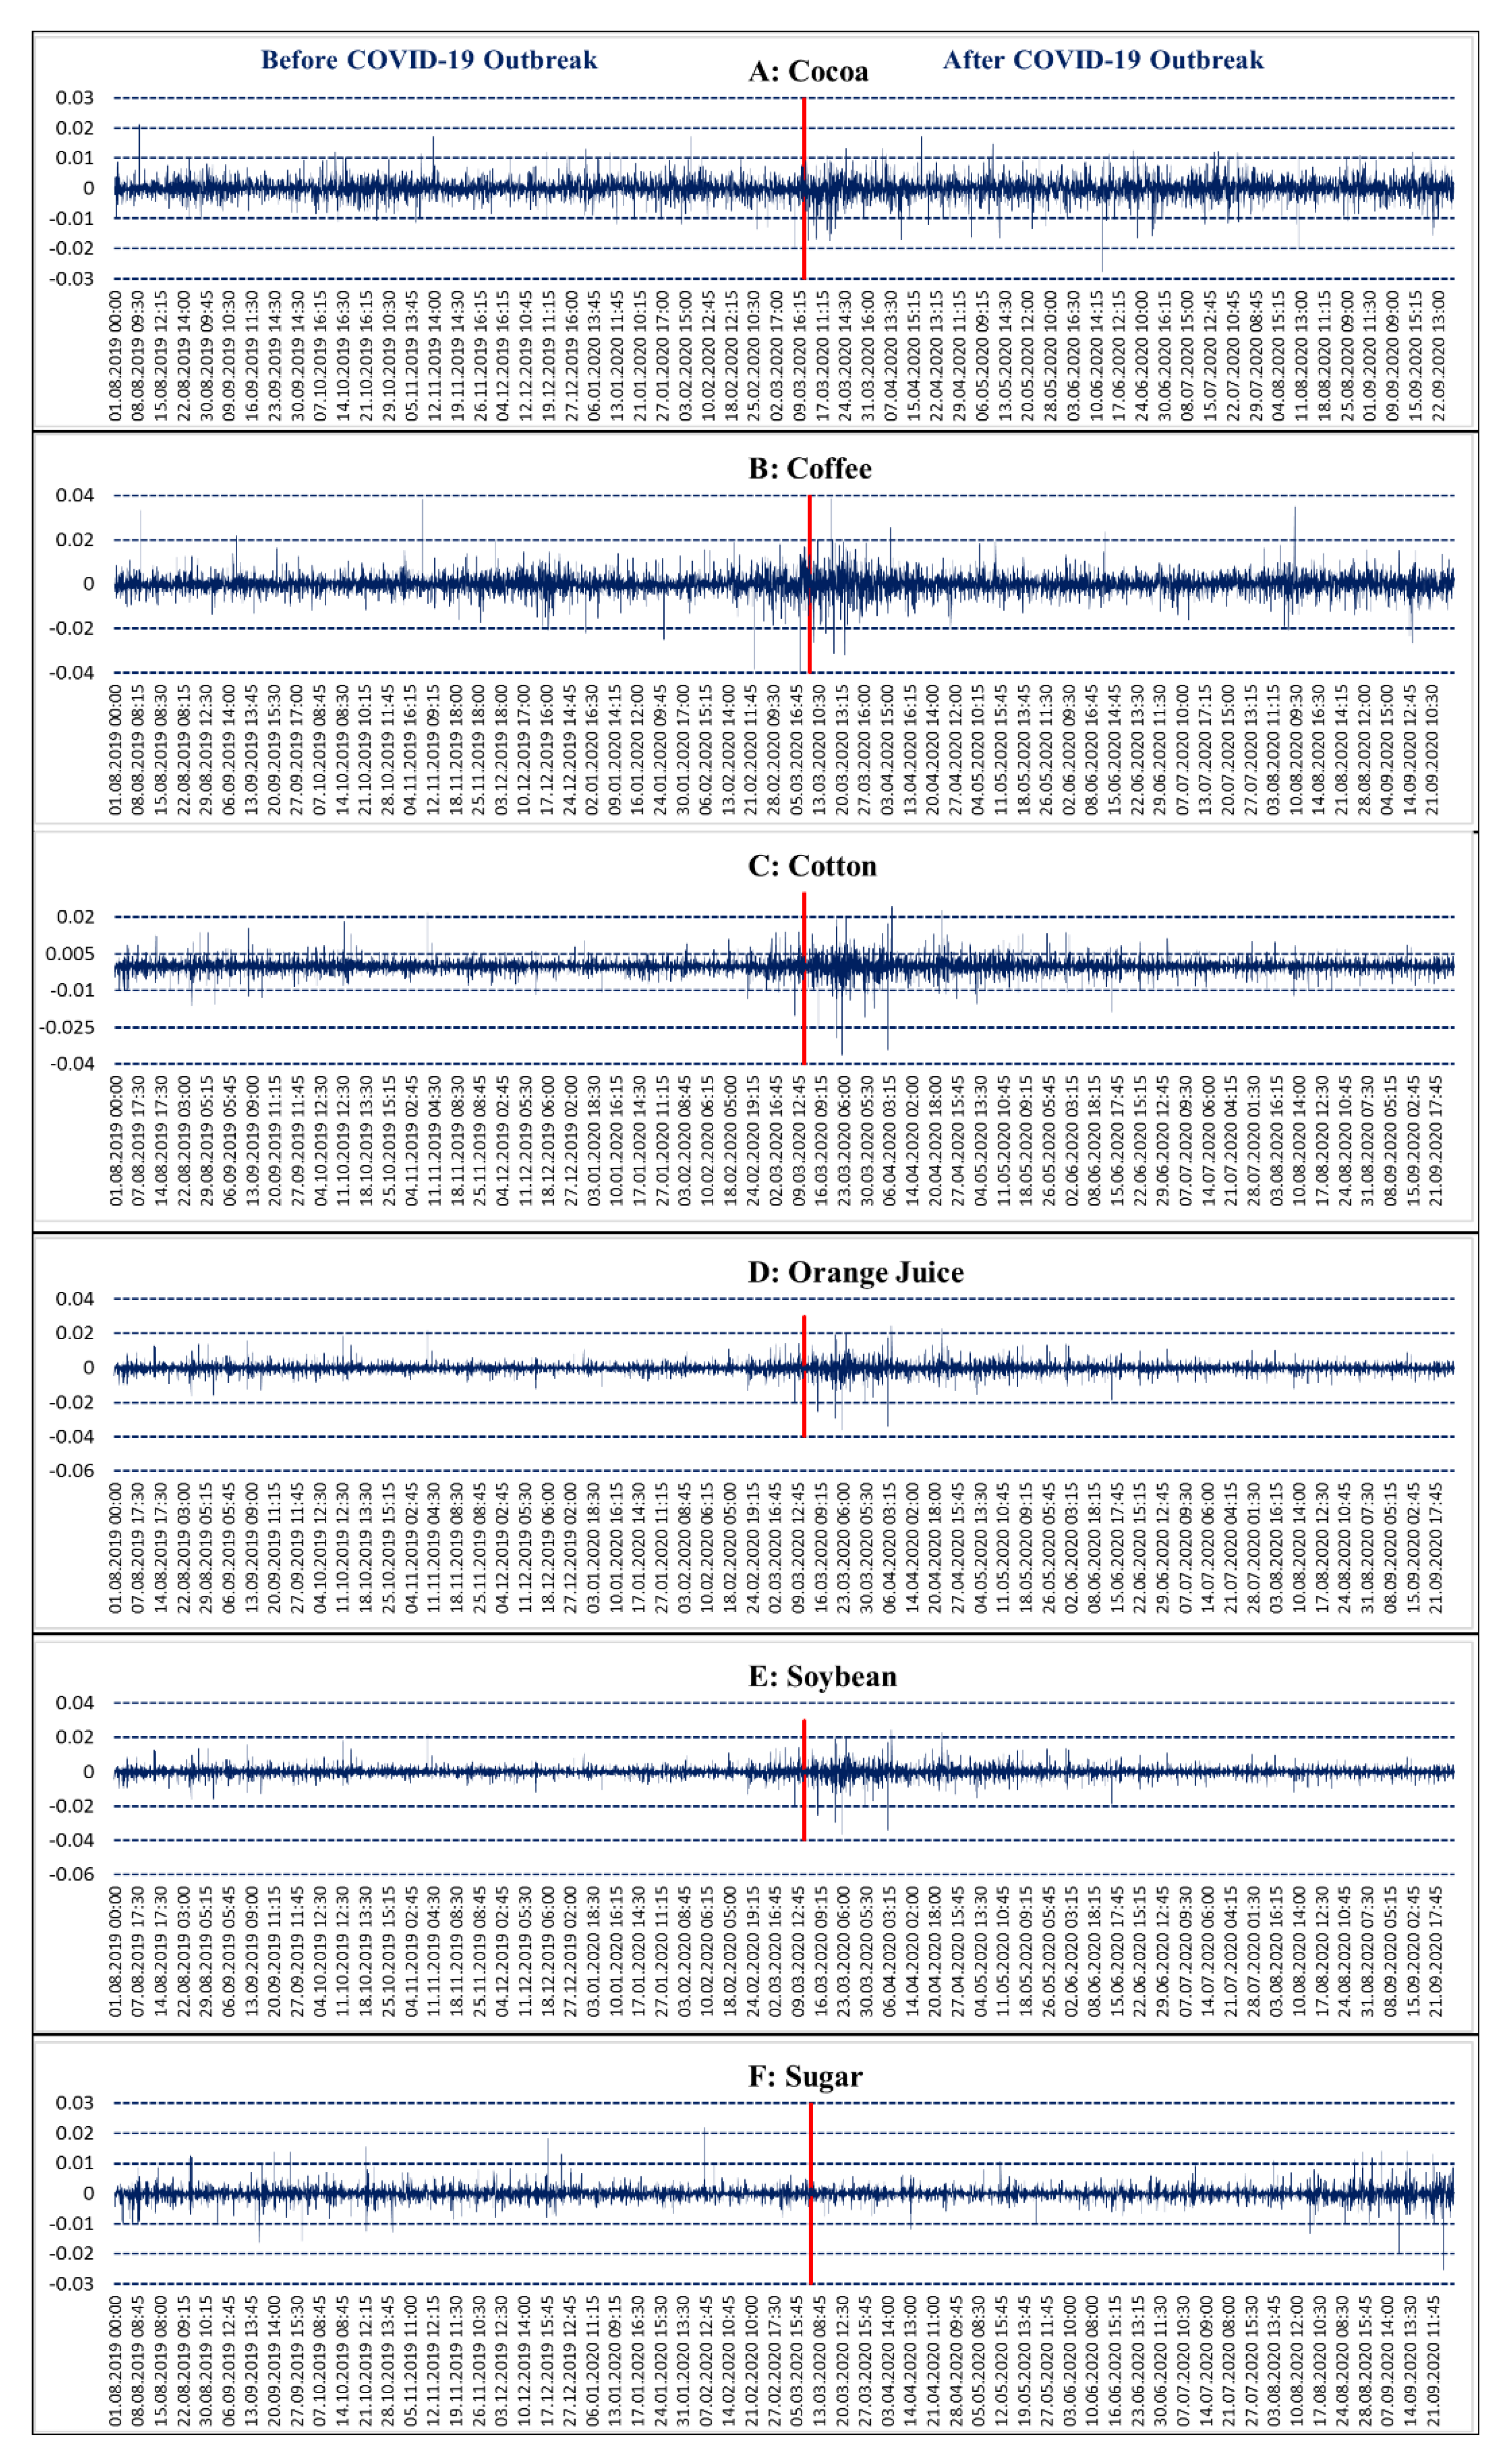
One of the reasons for this was an increase in the demand of orange juice across the globe. For the return rates of the agriculture commodity futures, we used the normal logarithm difference, i.e.,
where is the price of a given index at time t. It is clear in Figure 2 that after the pandemic declaration on 11 March 2020, more volatility returns can be observed in all commodities.
3. Multifractal Detrended Fluctuation Analysis (MF-DFA)
The procedure of MF-DFA detailed by Kantelhardt et al. (2002) could be briefly identified as follows.
Considering a time series with length N, the first step considers the construction of the profile , i.e.,
where and is the observed mean. This profile obtained is divided in = int nonoverlapping boxes with a length s. According to Kantelhardt et al. (2002), it is possible to use a final part of the sample, when N is a nonmultiple of s, allowing to have a total of segments, and following the rule proposed by Peng et al. (1994), i.e., . After this, a local trend is estimated for all segments based on the ordinary least squares, with
for the segments between m = 1 and m = Ns, while for the segments between and , this is given by
representing as the polynomial fit of the segments. Prior functions are averaged, allowing to obtain the qth-order fluctuation function for any , given by
and for
Negative values of q represent small fluctuations and positive values represent larger fluctuations. The value at q = 2 represents the DFA exponent. The value of increases with s, and performing a log–log regression allows to obtain a power law given by
The value of h(q) is the Hurst exponent, which measures the dependence levels of financial assets (see, for example, (Domino 2011; Pleşoianu et al. 2012)). A value of h(q) = 0.5 implies that the financial market under analysis behaves like a random walk; if h(q) > 0.5 and h(q) < 0.5, that market represents, respectively, persistent and antipersistent patterns.
The Renyi exponent can be calculated by using the value of h(q) to measure the mono- or multifractality behavior of a given series.
By using the Legendre transformation, the relationship between and can be written as follows:
Through Equations (8) and (9), we can obtain the multifractal spectrum
with α being the Holder exponent given by
The degree of multifractality can be quantified by the width of spectrum and , i.e.,
or
A higher width of or implies a higher degree of multifractality.
4. Empirical Findings
The estimation of the MF-DFA for each commodity at each period under analysis provides us the information given in Figure 3, in this case representing the estimations for the cocoa. The panel (A) (top left) shows the log–log relationship between the fluctuation function and the time scale from , which, in the case under analysis, exhibits a well-fit straight line. In panel (B), we have the generalized Hurst exponent , which is a decreasing function of the value of . Panel (A) has the quickest decline, which will be consistent with the difference of the maximum and minimum values of . On the other hand, indicates the higher multifractality levels and is related with higher degrees of inefficiency. In panel (A), we have the Renyi exponent, which is nonlinear in the case of the existence of multifractality, and panel (D) represents the multifractal spectrum, which identifies multifractality when it is described by a single-humped shape. In conclusion, Figure 3 shows that there exists evidence of multifractality in cocoa both before and after the declaration of the pandemic.
For the behavior of the remaining commodities, the evidence is rather similar, excepting the case of the orange juice in the period after the pandemic (see Figure 4 and Figure 5, showing all the other results). In that case, all the panels show differences when compared with the other general figures. In panel (A), the log–log relationship shows some instability; in panel (B), the Hurst exponent decreases sharply from , then goes up until , and decreases again until ; panel (C) is near to a linear relationship, but panel (D), representing the multifractal spectrum , also has a single humped-shape, indicating that the series is multifractal.
The generalized Hurst exponents of all commodities future markets over the range of are shown in Table 2. All the values for ‘before pandemic’ and ‘after pandemic’ decrease with the increase of , confirming that the generalized Hurst exponent depends on the value of , suggesting the presence of multifractality in these markets for both periods.
For instance, before the pandemic, the highest value of of London sugar, represented in Table 2, is 0.62 for , falling to at , and with the lowest value of for . Likewise, after the pandemic declaration, the highest value of of USA cocoa is for , falling to at , and with the lowest value of for . Comparable declining patterns are found in other markets for both time periods.
The width of the generalized Hurst exponents is documented in Table 2. The value of specifies the degree of the multifractality, with a smaller width meaning lower multifractality levels (Telesca et al. 2005a).
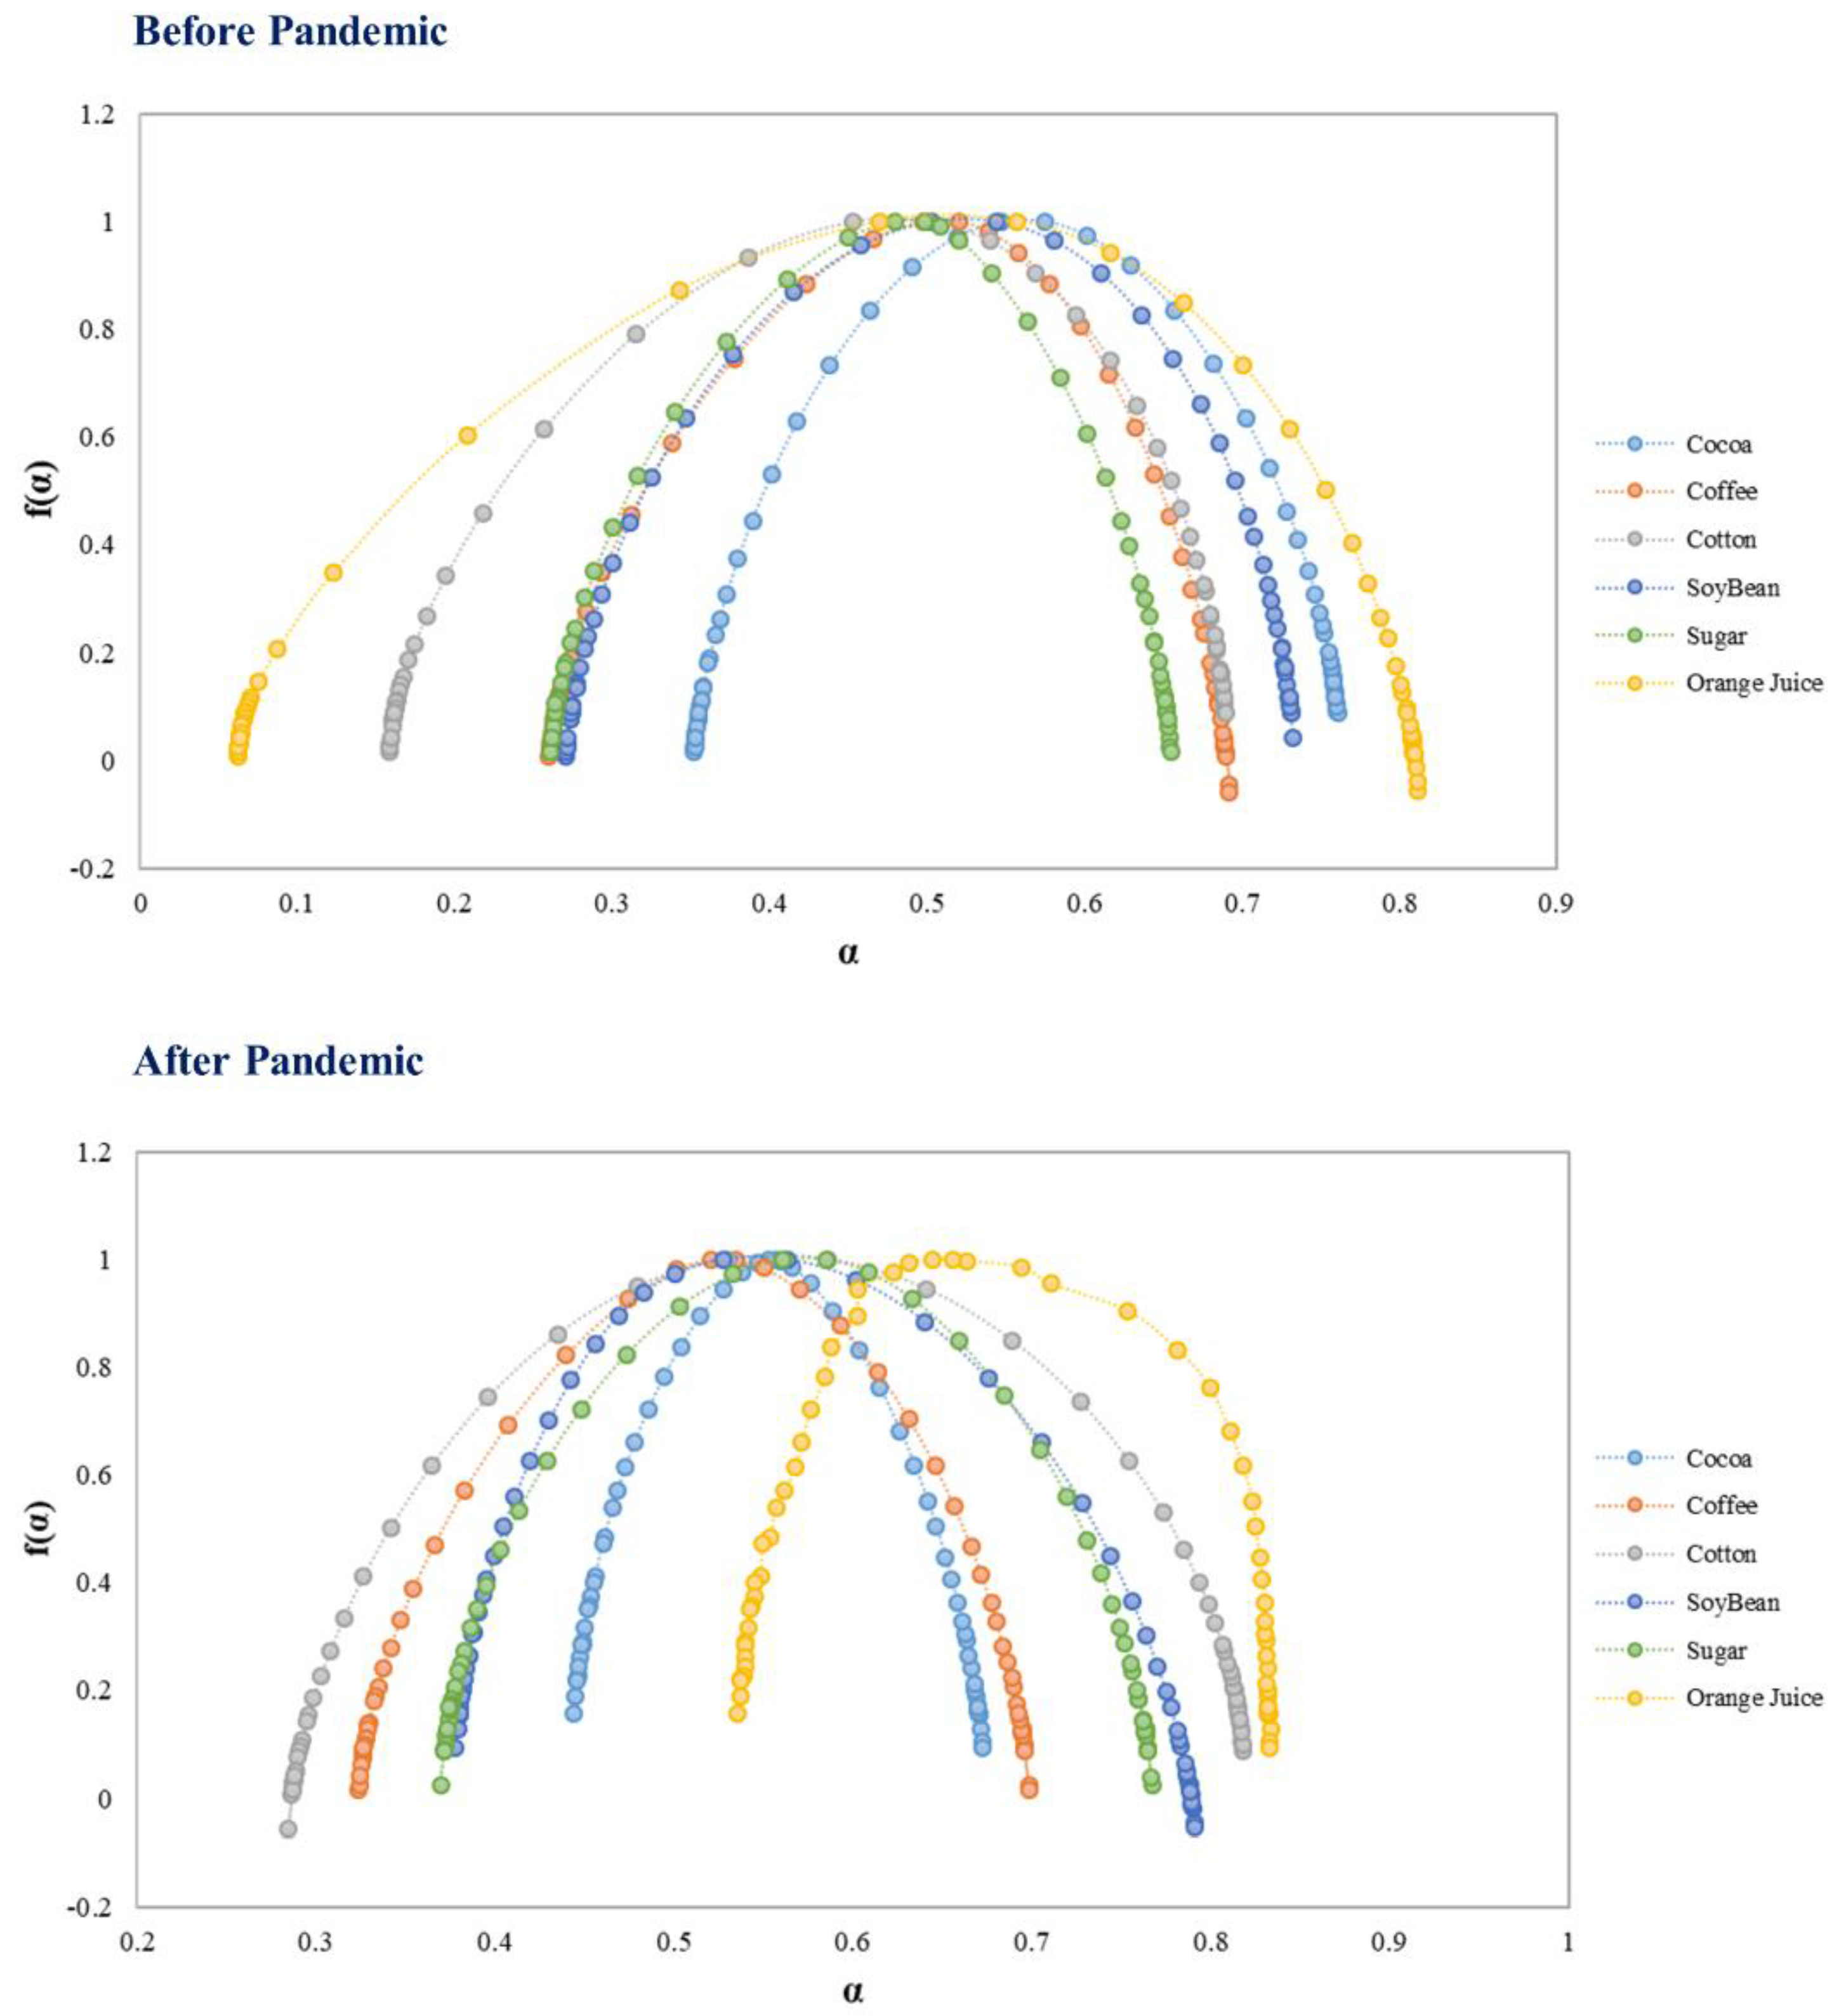
By comparing in Table 2 in subperiod 1 of before the pandemic, the orange juice future market shows the highest multifractality patterns, with , followed by cotton , while the sugar and cocoa markets show the lowest multifractality, respectively. After the pandemic declaration on 11 March 2020, a significant change in the multifractality can be observed. After the pandemic declaration, the cotton future market exhibited the highest multifractality , followed by soybeans , while the cocoa market showed the lowest degree of multifractality with multifractality . Overall, an increase in the multifractally is confirmed in two out of six (sugar and cotton) markets, while a decline is found in the remaining four markets. The comparative multiple spectra of all six agriculture future markets are presented in Figure 6.
The same conclusion can also be obtained by comparing the spectrum width in Figure 6 and last row of Table 2. Finally, the COVID-19 pandemic significantly affected the persistence level of commodity future markets. Before the pandemic, only the USA cocoa future market showed persistent behavior, while the remaining five markets showed an antipersistence feature. However, all the markets exhibit evidently persistent features with a clear shape and a trace of herd behavior. Somewhat similar patterns are found in the bitcoin market during the COVID-19 pandemic (Aslam et al. 2021b; Mnif et al. 2020).
The multifractal characteristics reveal the efficiency of financial markets (Anagnostidis et al. 2016). Consequently, based on the multifractal properties examined, USA cotton and London sugar showed a decline level while cocoa, coffee, orange juice, and soybean showed an efficiency improvement after the declaration of the COVID-19 pandemic. The market efficiency of orange juice improved the most among these six commodities, as it was the most inefficient market before the pandemic and became relatively more efficient after the pandemic. Overall, the findings reveal that the COVID-19 pandemic has a great but varying impact on the multifractal properties and persistence levels of agricultural future markets.
5. Conclusions and Discussion
Agricultural commodities are viewed as central resources for the food security and social stability of any economy. With this background, this paper investigates why it is critical to monitor their prices, especially during times of increased instability. Additionally, during times of global uncertainty, commodities are increasingly seen as replacement assets by investors seeking alternative investments for diversification purposes. Goodell (2020) describes this pandemic as a worldwide crisis with severe economic harm that has never been experienced before. This period of economic and social unrest, which is akin to the GFC of 2007–2008, stands out, and much research has concentrated on analyzing the effects of the COVID-19 pandemic on various commodity markets (Lu and Zeng 2022; Sifat et al. 2021; Štreimikienė et al. 2022; Wang et al. 2020a). This, however, does not make this paper any less valuable. The most significant aspect of this paper is that it splits a 14-month dataset into two equal periods from 1 August 2019 to 10 March 2020 and 11 March 2020 to 25 September 2020. The purpose of doing this is to better understand the inner dynamics of agricultural commodity markets during an extreme crisis time, i.e., March 2020 to September 2020, as found by (Aslam et al. 2021b). They discovered that this pandemic mostly affected financial markets in the second quarter of 2020, with the third and subsequent quarters being the period of recovery. In this connection, we investigated the intraday multifractal behavior of six agricultural futures: USA cocoa, USA cotton, USA coffee, USA orange juice, USA soybean, and London sugar.
The findings of this study are as follows: Firstly, all agricultural commodities are found to have significant multifractal patterns in both periods, i.e., before and after the outbreak of COVID-19. Secondly, a significant change in the multifractality is observed, where the multifractality of cotton and sugar increases significantly after the pandemic, while cocoa, orange juice, and soybean are found to be less multifractal after the pandemic. This indicates that the market efficiency of cotton and sugar decreases significantly while the market efficiency of cocoa, orange juice and soybean increase after the pandemic. Interestingly, the overall results found orange juice to be highly efficient among all commodities. Thirdly, all the markets have values greater than , indicating an increase in the strength of positive persistence after the COVID-19 pandemic.
Furthermore, our findings are in line with previous studies (Heng et al. 2020; Umar et al. 2021; Wang et al. 2020a). For instance, Wang et al. (2020a) used multifractal detrended cross-correlation analysis (MF-DCCA) to investigate the effects of the COVID-19 pandemic on the cross-correlations between the crude oil and agricultural futures markets. They discovered that, with the exception of the orange juice future market, all agricultural futures’ cross-correlations rose following the outbreak of the COVID-19 pandemic. Similarly, Akyildirim et al. (2022) discovered that, during pandemics, orange juice sentiments are the least correlated with other market sentiments. The possible explanation is that orange juice was seen as a popular commodity during the pandemic, and many consumers believed that orange juice would keep them healthy during the worrying times of the COVID-19 pandemic. According to Heng et al. (2020), the dollar sales of orange juice at grocery stores rose by 50.7% for the four-week period in March-April 2020 in comparison to the dollar sales of March–April 2019. Similarly, in response to consumers’ altered purchasing patterns, the futures price for frozen concentrated orange juice increased by 24 percent in mid-March 2020, making orange juice one of the best-performing commodities during the COVID-19 pandemic (Heng et al. (2020).
The existence of multifractality in agricultural commodities suggests that prices have a pattern and that price volatility has clusters, demonstrating some predictability. This, however, defies the principles of the Efficient Market Hypothesis (EMH) of Fama (1970) and presents an exploitable opportunity for investors to outperform the market and attain abnormal returns. Investors can therefore take this market persistence level into account when developing their investment strategy. Numerous studies have employed multifractality and the Hurst exponent to examine the market’s inefficiency to predict changes in financial market movements (Ali et al. 2021; Alvarez-Ramirez et al. 2008; Aslam et al. 2021a, 2022a). According to our findings, a wider multiple spectrum and a wider range of ∆h are the signs of greater inefficiency (Cajueiro et al. 2009; Caraiani 2012). These findings also give authorities better understanding, since multifractality brought about by market complexity or the lesser development of these markets may cause these inefficiencies (Aslam et al. 2021a; Rizvi et al. 2014).
Hence, our study has different implications for investors, practitioners, managers, and policymakers. Firstly, the multifractality caused by market complexity or by the lesser development of these markets may cause these inefficiencies (Aslam et al. 2021a; Rizvi et al. 2014). This raises the likelihood of herding behavior and irrational speculation, both of which could skew the expected payoffs from underlying investment evaluation. Consequently, these findings offer useful information for investors, practitioners, and managers in obtaining abnormal returns. Secondly, these findings help authorities and policymakers to implement measures that increase transparency, which will boost the efficiency of these futures markets, particularly during moments of economic and financial instability. Thirdly, our findings imply that investors need to be more cautious when underestimating the risk exposure to agricultural commodities, contrarily to a prevalent misconception that these commodities provide safe-haven benefits in crisis moments. Finally, it is essential to use nonlinear approaches to detect and identify all the possible patterns in the financial markets.
Despite the findings, it is relevant to identify the possible limitations of this paper, namely, the fact that it only examines the multifractal properties of agricultural futures markets before and after the COVID-19 outbreak without the identification of any conclusions about the causes which underlie the physical mechanism or multifractal properties. Hence, future studies should employ various multifractal approaches to understand the underlying sources of multifractality in these markets. This study also does not take any grain-based commodities due to data availability constraints; hence, the inclusion of more agricultural futures markets should be considered. Moreover, the analysis could also be extended by examining the impact of geopolitical risk and economic-policy-uncertainty indicators on the efficiency of these markets. Finally, the application of the rolling window on the multifractality would also provide more insights regarding the efficiency of these markets over time.
Author Contributions
Conceptualization, F.A. and P.F.; methodology, F.A. and P.F.; formal analysis, F.A. and P.F.; writing—original draft preparation, F.A. and P.F.; writing—review and editing, F.A., P.F. and H.A. All authors have read and agreed to the published version of the manuscript.
Funding
Paulo Ferreira is pleased to acknowledge financial support from Fundação para a Ciência e a Tecnologia (grant UIDB/05064/2020).
Data Availability Statement
The data presented in this study are available on request from the corresponding author.
Acknowledgments
We sincerely appreciate all valuable comments and suggestions from the anonymous reviewers and the Academic Editor, which helped us to improve the quality of the manuscript.
Conflicts of Interest
The authors declare no conflict of interest.
References
- Akyildirim, Erdinc, Oguzhan Cepni, Linh Pham, and Gazi Salah Uddin. 2022. How connected is the agricultural commodity market to the news-based investor sentiment? Energy Economics 113: 106174. [Google Scholar] [CrossRef]
- Alam, Md Mahmudul, Haitian Wei, and Abu N. M. Wahid. 2021. COVID-19 outbreak and sectoral performance of the Australian stock market: An event study analysis. Australian Economic Papers 60: 482–95. [Google Scholar] [CrossRef]
- Ali, Haider, Faheem Aslam, and Paulo Ferreira. 2021. Modeling Dynamic Multifractal Efficiency of US Electricity Market. Energies 14: 6145. [Google Scholar] [CrossRef]
- Ali, Jabir, and Kriti Bardhan Gupta. 2011. Efficiency in agricultural commodity futures markets in India: Evidence from cointegration and causality tests. Agricultural Finance Review 71: 162–78. [Google Scholar] [CrossRef]
- Ali, Mohsin, Nafis Alam, and Syed Aun R. Rizvi. 2020. Coronavirus (COVID-19)—An epidemic or pandemic for financial markets. Journal of Behavioral and Experimental Finance 27: 100341. [Google Scholar] [CrossRef]
- Alvarez-Ramirez, Jose, Jesus Alvarez, and Eduardo Rodriguez. 2008. Short-term predictability of crude oil markets: A detrended fluctuation analysis approach. Energy Economics 30: 2645–56. [Google Scholar] [CrossRef]
- Anagnostidis, Panagiotis, Christos Varsakelis, and Christos J Emmanouilides. 2016. Has the 2008 financial crisis affected stock market efficiency? The case of Eurozone. Physica A: Statistical Mechanics and its Applications 447: 116–28. [Google Scholar] [CrossRef]
- Apergis, Emmanuel, and Nicholas Apergis. 2020. Can the COVID-19 pandemic and oil prices drive the US Partisan Conflict Index. Energy Research Letters 1: 13144. [Google Scholar] [CrossRef]
- Ashraf, Badar Nadeem. 2020. Stock markets’ reaction to COVID-19: Cases or fatalities? Research in International Business and Finance 54: 101249. [Google Scholar] [CrossRef]
- Aslam, Faheem, Francisca Nogueiro, Mariana Brasil, Paulo Ferreira, Khurram Shahzad Mughal, Beenish Bashir, and Saima Latif. 2020a. The footprints of COVID-19 on Central Eastern European stock markets: An intraday analysis. Post-Communist Economies 33: 751–69. [Google Scholar] [CrossRef]
- Aslam, Faheem, Ijaz Ali, Fahd Amjad, Haider Ali, and Inza Irfan. 2022a. On the inner dynamics between Fossil fuels and the carbon market: A combination of seasonal-trend decomposition and multifractal cross-correlation analysis. Environmental Science and Pollution Research, 1–19. [Google Scholar] [CrossRef] [PubMed]
- Aslam, Faheem, Paulo Ferreira, Fahd Amjad, and Haider Ali. 2021a. The Efficiency of Sin Stocks: A Multifractal Analysis of Drug Indices. The Singapore Economic Review, 1–22. [Google Scholar] [CrossRef]
- Aslam, Faheem, Paulo Ferreira, Haider Ali, and Ana Ercília José. 2022b. Application of Multifractal Analysis in Estimating the Reaction of Energy Markets to Geopolitical Acts and Threats. Sustainability 14: 5828. [Google Scholar] [CrossRef]
- Aslam, Faheem, Paulo Ferreira, Haider Ali, and Sumera Kauser. 2021b. Herding behavior during the COVID-19 pandemic: A comparison between Asian and European stock markets based on intraday multifractality. Eurasian Economic Review 12: 333–59. [Google Scholar] [CrossRef]
- Aslam, Faheem, Paulo Ferreira, Khurrum Shahzad Mughal, and Beenish Bashir. 2021c. Intraday volatility spillovers among european financial markets during COVID-19. International Journal of Financial Studies 9: 5. [Google Scholar] [CrossRef]
- Aslam, Faheem, Saqib Aziz, Duc Khuong Nguyen, Khurrum S. Mughal, and Maaz Khan. 2020b. On the efficiency of foreign exchange markets in times of the COVID-19 pandemic. Technological Forecasting and Social Change 161: 120261. [Google Scholar] [CrossRef]
- Aslam, Faheem, Tahir Mumtaz Awan, Jabir Hussain Syed, Aisha Kashif, and Mahwish Parveen. 2020c. Sentiments and emotions evoked by news headlines of coronavirus disease (COVID-19) outbreak. Humanities and Social Sciences Communications 7: 23. [Google Scholar] [CrossRef]
- Aslam, Faheem, Yasir Tariq Mohmand, Paulo Ferreira, Bilal Ahmed Memon, Maaz Khan, and Mrestyal Khan. 2020d. Network analysis of global stock markets at the beginning of the coronavirus disease (COVID-19) outbreak. Borsa Istanbul Review 20: S49–S61. [Google Scholar] [CrossRef]
- Barrafrem, Kinga, Daniel Västfjäll, and Gustav Tinghög. 2020. Financial well-being, COVID-19, and the financial better-than-average-effect. Journal of Behavioral and Experimental Finance 28: 100410. [Google Scholar] [CrossRef]
- Barro, Robert J., José F. Ursúa, and Joanna Weng. 2020. The Coronavirus and the Great Influenza Pandemic: Lessons from the “Spanish Flu” for the Coronavirus’s Potential Effects on Mortality and Economic Activity. Munich: Munich Society for the Promotion of Economic Research—CESifo GmbH. [Google Scholar]
- Cajueiro, Daniel O., Periklis Gogas, and Benjamin M. Tabak. 2009. Does financial market liberalization increase the degree of market efficiency? The case of the Athens stock exchange. International Review of Financial Analysis 18: 50–57. [Google Scholar] [CrossRef]
- Cao, Guangxi, and Wei Xu. 2016. Nonlinear structure analysis of carbon and energy markets with MFDCCA based on maximum overlap wavelet transform. Physica A: Statistical Mechanics and Its Applications 444: 505–23. [Google Scholar] [CrossRef]
- Caraiani, Petre. 2012. Evidence of multifractality from emerging European stock markets. PLoS ONE 7: e40693. [Google Scholar] [CrossRef] [PubMed] [Green Version]
- Chen, Jilong, Liao Xu, and Hao Xu. 2022. The impact of COVID-19 on commodity options market: Evidence from China. Economic Modelling 116: 105998. [Google Scholar] [CrossRef] [PubMed]
- Consuegra, Meliyara, and Javier Garcia-Verdugo. 2017. Measuring the functional efficiency of agricultural futures markets. Australian Journal of Agricultural and Resource Economics 61: 232–46. [Google Scholar] [CrossRef] [Green Version]
- Corbet, Shaen, Charles Larkin, and Brian Lucey. 2020. The contagion effects of the COVID-19 pandemic: Evidence from gold and cryptocurrencies. Finance Research Letters 35: 101554. [Google Scholar] [CrossRef]
- Czech, Katarzyna, Michał Wielechowski, Pavel Kotyza, Irena Benešová, and Adriana Laputková. 2020. Shaking stability: COVID-19 impact on the Visegrad Group countries’ financial markets. Sustainability 12: 6282. [Google Scholar] [CrossRef]
- Devpura, Neluka, and Paresh Kumar Narayan. 2020. Hourly oil price volatility: The role of COVID-19. Energy Research Letters 1: 13683. [Google Scholar] [CrossRef]
- Domino, Krzysztof. 2011. The use of the Hurst exponent to predict changes in trends on the Warsaw Stock Exchange. Physica A: Statistical Mechanics and its Applications 390: 98–109. [Google Scholar] [CrossRef]
- Drożdż, Stanisław, Jarosław Kwapień, Paweł Oświȩcimka, and Rafał Rak. 2010. The foreign exchange market: Return distributions, multifractality, anomalous multifractality and the Epps effect. New Journal of Physics 12: 105003. [Google Scholar] [CrossRef]
- Drożdż, Stanisław, Paweł Oświȩcimka, Andrzej Kulig, Jarosław Kwapień, Katarzyna Bazarnik, Iwona Grabska-Gradzińska, Jan Rybicki, and Marek Stanuszek. 2016. Quantifying origin and character of long-range correlations in narrative texts. Information Sciences 331: 32–44. [Google Scholar] [CrossRef]
- Fama, Eugene F. 1970. Efficient market hypothesis: A review of theory and empirical work. Journal of Finance 25: 28–30. [Google Scholar] [CrossRef]
- Farjah, Ebrahim. 2019. Proposing an efficient wind forecasting agent using adaptive MFDFA. Journal of Power Technologies 99: 152. [Google Scholar]
- Garcin, Matthieu, Jules Klein, and Sana Laaribi. 2020. Estimation of time-varying kernel densities and chronology of the impact of COVID-19 on financial markets. arXiv arXiv:2007.09043. [Google Scholar]
- Goodell, John W. 2020. COVID-19 and finance: Agendas for future research. Finance Research Letters 35: 101512. [Google Scholar] [CrossRef]
- Heng, Yan, Marisa Zansler, and Lisa House. 2020. Orange Juice Consumers Response to the COVID-19 Outbreak: FE1082, 06/2020. EDIS 2020: 4. [Google Scholar]
- Ihlen, Espen A. F., and Beatrix Vereijken. 2013. Multifractal formalisms of human behavior. Human Movement Science 32: 633–51. [Google Scholar] [CrossRef]
- Jafari, G. Reza, Pouria Pedram, and Leila Hedayatifar. 2007. Long-range correlation and multifractality in Bach’s inventions pitches. Journal of Statistical Mechanics: Theory and Experiment 2007: P04012. [Google Scholar] [CrossRef] [Green Version]
- Kantelhardt, Jan W., Stephan A. Zschiegner, Eva Koscielny-Bunde, Shlomo Havlin, Armin Bunde, and H. Eugene Stanley. 2002. Multifractal detrended fluctuation analysis of nonstationary time series. Physica A: Statistical Mechanics and its Applications 316: 87–114. [Google Scholar] [CrossRef] [Green Version]
- Kelty-Stephen, Damian G. 2017. Threading a multifractal social psychology through within-organism coordination to within-group interactions: A tale of coordination in three acts. Chaos, Solitons & Fractals 104: 363–70. [Google Scholar]
- Kim, Hongseok, Gabjin Oh, and Seunghwan Kim. 2011. Multifractal analysis of the Korean agricultural market. Physica A: Statistical Mechanics and its Applications 390: 4286–92. [Google Scholar]
- Kim, Irene, and Mohan Venkatachalam. 2011. Are sin stocks paying the price for accounting sins? Journal of Accounting, Auditing & Finance 26: 415–42. [Google Scholar]
- Kumar, Sunil, and Nivedita Deo. 2009. Multifractal properties of the Indian financial market. Physica A: Statistical Mechanics and Its Applications 388: 1593–602. [Google Scholar] [CrossRef]
- Laib, Mohamed, Jean Golay, Luciano Telesca, and Mikhail Kanevski. 2018. Multifractal analysis of the time series of daily means of wind speed in complex regions. Chaos, Solitons & Fractals 109: 118–27. [Google Scholar]
- Laing, Timothy. 2020. The economic impact of the Coronavirus 2019 (COVID-2019): Implications for the mining industry. The Extractive Industries and Society 7: 580–82. [Google Scholar] [CrossRef]
- Li, Zhihui, and Xinsheng Lu. 2011. Multifractal analysis of China’s agricultural commodity futures markets. Energy Procedia 5: 1920–26. [Google Scholar] [CrossRef] [Green Version]
- Lu, Ran, and Hongjun Zeng. 2022. VIX and major agricultural future markets: Dynamic linkage and time-frequency relations around the COVID-19 outbreak. Studies in Economics and Finance. ahead-of-print. [Google Scholar] [CrossRef]
- Maier, Benjamin F., and Dirk Brockmann. 2020. Effective containment explains subexponential growth in recent confirmed COVID-19 cases in China. Science 368: 742–46. [Google Scholar] [CrossRef]
- Makowiec, Danuta, Aleksandra Dudkowska, Rafał Gałaska, and Andrzej Rynkiewicz. 2009. Multifractal estimates of monofractality in RR-heart series in power spectrum ranges. Physica A: Statistical Mechanics and Its Applications 388: 3486–502. [Google Scholar] [CrossRef]
- Mandelbrot, Benoit B. 1971. When can price be arbitraged efficiently? A limit to the validity of the random walk and martingale models. The Review of Economics and Statistics 53: 225–36. [Google Scholar] [CrossRef]
- Mandelbrot, Benoit B. 1982. The Fractal Geometry of Nature. New York: WH Freeman, vol. 1. [Google Scholar]
- Mandelbrot, Benoit B. 1997. The variation of the prices of cotton, wheat, and railroad stocks, and of some financial rates. In Fractals and Scaling in Finance. Berlin/Heidelberg: Springer, pp. 419–43. [Google Scholar]
- Mandelbrot, Benoit B., and James R. Wallis. 1969. Robustness of the rescaled range R/S in the measurement of noncyclic long run statistical dependence. Water Resources Research 5: 967–88. [Google Scholar] [CrossRef]
- Mandelbrot, Benoit. 1967. The variation of some other speculative prices. The Journal of Business 40: 393–413. [Google Scholar] [CrossRef]
- McKibbin, Warwick, and David Vines. 2020. Global macroeconomic cooperation in response to the COVID-19 pandemic: A roadmap for the G20 and the IMF. Oxford Review of Economic Policy 36: S297–S337. [Google Scholar] [CrossRef]
- Ming, Wen, Zhengqing Zhou, Hongshan Ai, Huimin Bi, and Yuan Zhong. 2020. COVID-19 and air quality: Evidence from China. Emerging Markets Finance and Trade 56: 2422–42. [Google Scholar] [CrossRef]
- Mishra, Sibanjan. 2019. Testing Martingale Hypothesis Using Variance Ratio Tests: Evidence from High-frequency Data of NCDEX Soya Bean Futures. Global Business Review 20: 1407–22. [Google Scholar] [CrossRef]
- Mnif, Emna, Anis Jarboui, and Khaireddine Mouakhar. 2020. How the cryptocurrency market has performed during COVID 19? A multifractal analysis. Finance Research Letters 36: 101647. [Google Scholar] [CrossRef] [PubMed]
- Muzy, Jean-François, Emmanuel Bacry, Rachel Baile, and Philippe Poggi. 2008. Uncovering latent singularities from multifractal scaling laws in mixed asymptotic regime. Application to turbulence. EPL (Europhysics Letters) 82: 60007. [Google Scholar] [CrossRef] [Green Version]
- Nagy, Zoltan, Peter Mukli, Peter Herman, and Andras Eke. 2017. Decomposing multifractal crossovers. Frontiers in Physiology 8: 533. [Google Scholar] [CrossRef]
- Nicola, Maria, Zaid Alsafi, Catrin Sohrabi, Ahmed Kerwan, Ahmed Al-Jabir, Christos Iosifidis, Maliha Agha, and Riaz Agha. 2020. The socio-economic implications of the coronavirus pandemic (COVID-19): A review. International Journal of Surgery 78: 185–93. [Google Scholar] [CrossRef]
- Njindan Iyke, Bernard. 2020. The disease outbreak channel of exchange rate return predictability: Evidence from COVID-19. Emerging Markets Finance and Trade 56: 2277–97. [Google Scholar] [CrossRef]
- Oh, Gabjin, Seunghwan Kim, and Cheoljun Eom. 2010. Multifractal analysis of Korean stock market. Journal of the Korean Physical Society 56: 982–85. [Google Scholar] [CrossRef]
- Peng, Chung-Kang, Sergey V. Buldyrev, Shlomo Havlin, Michael Simons, H. Eugene Stanley, and Ary L. Goldberger. 1994. Mosaic organization of DNA nucleotides. Physical Review E 49: 1685. [Google Scholar] [CrossRef] [PubMed] [Green Version]
- Pleşoianu, Anita, Alexandru Todea, and Răzvan Căpuşan. 2012. The informational efficiency of the Romanian stock market: Evidence from fractal analysis. Procedia Economics and Finance 3: 111–18. [Google Scholar] [CrossRef] [Green Version]
- Podobnik, Boris, and H. Eugene Stanley. 2008. Detrended cross-correlation analysis: A new method for analyzing two nonstationary time series. Physical Review Letters 100: 084102. [Google Scholar] [CrossRef] [PubMed] [Green Version]
- Rizvi, Syed Aun R., Ginanjar Dewandaru, Obiyathulla I Bacha, and Mansur Masih. 2014. An analysis of stock market efficiency: Developed vs Islamic stock markets using MF-DFA. Physica A: Statistical Mechanics and Its Applications 407: 86–99. [Google Scholar] [CrossRef]
- Rosas, Alexandre, Edvaldo Nogueira Jr., and José F Fontanari. 2002. Multifractal analysis of DNA walks and trails. Physical Review E 66: 061906. [Google Scholar] [CrossRef] [Green Version]
- Sadowski, Adam, Zbigniew Galar, Robert Walasek, Grzegorz Zimon, and Per Engelseth. 2021. Big data insight on global mobility during the COVID-19 pandemic lockdown. Journal of Big Data 8: 78. [Google Scholar] [CrossRef]
- Sifat, Imtiaz, Abdul Ghafoor, and Abdollah Ah Mand. 2021. The COVID-19 pandemic and speculation in energy, precious metals, and agricultural futures. Journal of Behavioral and Experimental Finance 30: 100498. [Google Scholar] [CrossRef]
- Sipra, Hassaan, Faheem Aslam, Jabir Hussain Syed, and Tahir Mumtaz Awan. 2021. Investigating the Implications of COVID-19 on PM2. 5 in Pakistan. Aerosol and Air Quality Research 21: 200459. [Google Scholar] [CrossRef]
- Stanley, H. Eugene, and Paul Meakin. 1988. Multifractal phenomena in physics and chemistry. Nature 335: 405–09. [Google Scholar] [CrossRef]
- Stosic, Tatijana, Salman Abarghouei Nejad, and Borko Stosic. 2020. Multifractal analysis of Brazilian agricultural market. Fractals 28: 2050076. [Google Scholar] [CrossRef]
- Štreimikienė, Dalia, Tomas Baležentis, Artiom Volkov, Erika Ribašauskienė, Mangirdas Morkūnas, and Agnė Žičkienė. 2022. Negative effects of covid-19 pandemic on agriculture: Systematic literature review in the frameworks of vulnerability, resilience and risks involved. Economic Research-Ekonomska Istraživanja 35: 529–45. [Google Scholar] [CrossRef]
- Subramaniam, Arvind R., Ilya A. Gruzberg, and Andreas W. W. Ludwig. 2008. Boundary criticality and multifractality at the two-dimensional spin quantum Hall transition. Physical Review B 78: 245105. [Google Scholar] [CrossRef] [Green Version]
- Telesca, Luciano, Vincenzo Lapenna, and Maria Macchiato. 2005a. Multifractal fluctuations in seismic interspike series. Physica A: Statistical Mechanics and Its Applications 354: 629–40. [Google Scholar] [CrossRef] [Green Version]
- Telesca, Luciano, Vincenzo Lapenna, and Maria Macchiato. 2005b. Multifractal fluctuations in earthquake-related geoelectrical signals. New Journal of Physics 7: 214. [Google Scholar] [CrossRef]
- Topcu, Mert, and Omer Serkan Gulal. 2020. The impact of COVID-19 on emerging stock markets. Finance Research Letters 36: 101691. [Google Scholar] [CrossRef]
- Udovichenko, Vladimir, and Peter Strizhak. 2002. Multifractal properties of copper sulfide film formed in self-organizing chemical system. Theoretical and Experimental Chemistry 38: 259–62. [Google Scholar] [CrossRef]
- Umar, Zaghum, Francisco Jareño, and Ana Escribano. 2021. Agricultural commodity markets and oil prices: An analysis of the dynamic return and volatility connectedness. Resources Policy 73: 102147. [Google Scholar] [CrossRef]
- Wang, Jian, Wei Shao, and Junseok Kim. 2020a. Analysis of the impact of COVID-19 on the correlations between crude oil and agricultural futures. Chaos, Solitons & Fractals 136: 109896. [Google Scholar]
- Wang, Yating, Donghao Zhang, Xiaoquan Wang, and Qiuyao Fu. 2020b. How does COVID-19 affect China’s insurance market? Emerging Markets Finance and Trade 56: 2350–62. [Google Scholar] [CrossRef]
- Wang, Yudong, and Li Liu. 2010. Is WTI crude oil market becoming weakly efficient over time?: New evidence from multiscale analysis based on detrended fluctuation analysis. Energy Economics 32: 987–92. [Google Scholar] [CrossRef]
- Zhang, Dayong, Min Hu, and Qiang Ji. 2020. Financial markets under the global pandemic of COVID-19. Finance Research Letters 36: 101528. [Google Scholar] [CrossRef] [PubMed]
- Zhang, Yue-Jun, and Shu-Jiao Ma. 2021. Exploring the dynamic price discovery, risk transfer and spillover among INE, WTI and Brent crude oil futures markets: Evidence from the high-frequency data. International Journal of Finance & Economics 26: 2414–35. [Google Scholar]
Figure 1.
Time trend of 15 min prices from 1 August 2019 to 25 September 2020.

Figure 2.
Time trend of 15 min log returns from 1 August 2019 to 25 September 2020.

Figure 3.
MFDFA results for cocoa. (Panel A) Fluctuation functions for q = [−30,0,+30]; (Panel B) Generalized Hurst exponent depending on q; (Panel C) Mass exponent t(q); (Panel D) Multifractal spectrum. On the left is the information for the period before the declaration of the COVID-19 pandemic and on the right is the information for the period after the declaration of the COVID-19 pandemic.

Figure 4.
MFDFA results for coffee, cotton, and orange Juice. (Panel A) Fluctuation functions for q = [−30,0,+30]; (Panel B) Generalized Hurst exponent depending on q; (Panel C) Mass exponent t(q); (Panel D) Multifractal spectrum. On the left is the information for the period before the declaration of theCOVID-19 pandemic and on the right is the information for the period after the declaration of the COVID-19 pandemic.

Figure 5.
MFDFA results for soybean and sugar. (Panel A) Fluctuation functions for q = [−30,0,+30]; (Panel B) Generalized Hurst exponent depending on q; (Panel C) Mass exponent t(q); (Panel D) Multifractal spectrum. On the left is the information for the period before the declaration of the COVID-19 pandemic and on the right is the information for the period after the declaration of the COVID-19 pandemic.

Figure 6.
The multifractal spectra for agricultural commodities before and after the declaration of the pandemic.
Figure 6.
The multifractal spectra for agricultural commodities before and after the declaration of the pandemic.


Table 1.
Data description of agriculture commodities (1 August 2019 to 25 September 2020).
| S. No. | Commodity | Number Obs. Before Pandemic (1 August 2019 to 10 March 2020) | Number Obs. After Pandemic (11 March 2020 to 25 September 2020) |
|---|---|---|---|
| 1 | US Cocoa | 8986 | 4704 |
| 2 | US Coffee | 5385 | 4999 |
| 3 | US Cotton | 10,143 | 9567 |
| 4 | US Orange Juice | 3460 | 3314 |
| 5 | US Soybean | 9414 | 8961 |
| 6 | London Sugar | 5421 | 5014 |
Table 2.
Generalized Hurst exponents for the agriculture futures ranging from q = −30 to q = 30.
| Q | Before COVID-19 Outbreak | After COVID-19 Outbreak | ||||||||||
|---|---|---|---|---|---|---|---|---|---|---|---|---|
| Cocoa | Coffee | Cotton | Orange Juice | Soybean | Sugar | Cocoa | Coffee | Cotton | Orange Juice | Soybean | Sugar | |
| −30 | 0.7302 | 0.6568 | 0.6588 | 0.7765 | 0.7007 | 0.6219 | 0.6424 | 0.6658 | 0.7878 | 0.7983 | 0.7559 | 0.7346 |
| −29 | 0.7292 | 0.6556 | 0.6578 | 0.7754 | 0.6996 | 0.6208 | 0.6414 | 0.6648 | 0.7868 | 0.7971 | 0.7547 | 0.7336 |
| −28 | 0.7281 | 0.6544 | 0.6567 | 0.7741 | 0.6985 | 0.6196 | 0.6403 | 0.6636 | 0.7857 | 0.7959 | 0.7535 | 0.7324 |
| −27 | 0.7269 | 0.653 | 0.6555 | 0.7728 | 0.6973 | 0.6184 | 0.6391 | 0.6624 | 0.7846 | 0.7945 | 0.7522 | 0.7312 |
| −26 | 0.7256 | 0.6516 | 0.6543 | 0.7714 | 0.696 | 0.617 | 0.6379 | 0.661 | 0.7833 | 0.7931 | 0.7507 | 0.7299 |
| −25 | 0.7243 | 0.6501 | 0.6529 | 0.7698 | 0.6946 | 0.6156 | 0.6366 | 0.6596 | 0.782 | 0.7915 | 0.7492 | 0.7285 |
| −24 | 0.7228 | 0.6485 | 0.6515 | 0.7682 | 0.6931 | 0.6141 | 0.6352 | 0.6581 | 0.7805 | 0.7898 | 0.7475 | 0.7269 |
| −23 | 0.7212 | 0.6467 | 0.6499 | 0.7664 | 0.6915 | 0.6124 | 0.6337 | 0.6565 | 0.779 | 0.788 | 0.7457 | 0.7253 |
| −22 | 0.7195 | 0.6448 | 0.6482 | 0.7644 | 0.6898 | 0.6106 | 0.6321 | 0.6547 | 0.7773 | 0.786 | 0.7437 | 0.7235 |
| −21 | 0.7176 | 0.6427 | 0.6464 | 0.7623 | 0.688 | 0.6086 | 0.6303 | 0.6528 | 0.7754 | 0.7838 | 0.7416 | 0.7216 |
| −20 | 0.7155 | 0.6404 | 0.6444 | 0.76 | 0.6859 | 0.6065 | 0.6284 | 0.6507 | 0.7734 | 0.7814 | 0.7392 | 0.7195 |
| −19 | 0.7133 | 0.6379 | 0.6422 | 0.7574 | 0.6837 | 0.6042 | 0.6264 | 0.6484 | 0.7713 | 0.7787 | 0.7366 | 0.7172 |
| −18 | 0.7108 | 0.6352 | 0.6399 | 0.7546 | 0.6813 | 0.6016 | 0.6241 | 0.6459 | 0.7688 | 0.7758 | 0.7338 | 0.7147 |
| −17 | 0.7081 | 0.6323 | 0.6373 | 0.7515 | 0.6786 | 0.5988 | 0.6217 | 0.6432 | 0.7662 | 0.7725 | 0.7307 | 0.7119 |
| −16 | 0.7051 | 0.629 | 0.6344 | 0.748 | 0.6757 | 0.5957 | 0.6191 | 0.6401 | 0.7632 | 0.7688 | 0.7272 | 0.7089 |
| −15 | 0.7017 | 0.6254 | 0.6312 | 0.7441 | 0.6724 | 0.5923 | 0.6162 | 0.6368 | 0.7599 | 0.7646 | 0.7233 | 0.7055 |
| −14 | 0.6979 | 0.6214 | 0.6277 | 0.7398 | 0.6688 | 0.5886 | 0.613 | 0.6331 | 0.7562 | 0.7599 | 0.719 | 0.7017 |
| −13 | 0.6937 | 0.6169 | 0.6237 | 0.7348 | 0.6648 | 0.5843 | 0.6095 | 0.629 | 0.752 | 0.7545 | 0.7141 | 0.6975 |
| −12 | 0.6889 | 0.612 | 0.6193 | 0.7292 | 0.6603 | 0.5796 | 0.6057 | 0.6244 | 0.7472 | 0.7483 | 0.7085 | 0.6927 |
| −11 | 0.6834 | 0.6064 | 0.6142 | 0.7227 | 0.6552 | 0.5743 | 0.6015 | 0.6193 | 0.7417 | 0.7411 | 0.7022 | 0.6873 |
| −10 | 0.6771 | 0.6002 | 0.6085 | 0.7152 | 0.6494 | 0.5682 | 0.597 | 0.6135 | 0.7352 | 0.7327 | 0.6949 | 0.6811 |
| −9 | 0.6699 | 0.5933 | 0.602 | 0.7066 | 0.6429 | 0.5615 | 0.592 | 0.607 | 0.7277 | 0.7226 | 0.6865 | 0.674 |
| −8 | 0.6617 | 0.5857 | 0.5946 | 0.6964 | 0.6353 | 0.5538 | 0.5867 | 0.5996 | 0.7188 | 0.7107 | 0.6768 | 0.6659 |
| −7 | 0.6521 | 0.5773 | 0.586 | 0.6844 | 0.6267 | 0.5453 | 0.581 | 0.5914 | 0.7081 | 0.6964 | 0.6655 | 0.6566 |
| −6 | 0.6412 | 0.5682 | 0.576 | 0.6702 | 0.6169 | 0.5359 | 0.5753 | 0.5823 | 0.6953 | 0.6792 | 0.6524 | 0.6461 |
| −5 | 0.629 | 0.5587 | 0.5646 | 0.6536 | 0.6056 | 0.5262 | 0.5697 | 0.5724 | 0.6797 | 0.6587 | 0.6373 | 0.6343 |
| −4 | 0.6158 | 0.549 | 0.5517 | 0.6343 | 0.5929 | 0.5169 | 0.5649 | 0.562 | 0.661 | 0.635 | 0.6203 | 0.6217 |
| −3 | 0.6021 | 0.5393 | 0.5373 | 0.6122 | 0.5785 | 0.509 | 0.5611 | 0.5517 | 0.6389 | 0.6098 | 0.6018 | 0.609 |
| −2 | 0.5884 | 0.5298 | 0.5215 | 0.587 | 0.5624 | 0.5032 | 0.5586 | 0.5425 | 0.6137 | 0.5868 | 0.5826 | 0.5968 |
| −1 | 0.5748 | 0.5203 | 0.5032 | 0.5572 | 0.5443 | 0.4982 | 0.5569 | 0.5346 | 0.5862 | 0.5713 | 0.5633 | 0.5852 |
| 0 | 0.5612 | 0.51 | 0.4807 | 0.5195 | 0.5242 | 0.491 | 0.5553 | 0.5275 | 0.5577 | 0.5694 | 0.5446 | 0.5736 |
| 1 | 0.5474 | 0.4976 | 0.4525 | 0.4695 | 0.5027 | 0.4796 | 0.5531 | 0.5203 | 0.5302 | 0.5842 | 0.528 | 0.5611 |
| 2 | 0.5332 | 0.4816 | 0.4194 | 0.4059 | 0.4804 | 0.4645 | 0.55 | 0.5111 | 0.5049 | 0.6079 | 0.5144 | 0.5472 |
| 3 | 0.519 | 0.462 | 0.3846 | 0.3398 | 0.4585 | 0.4468 | 0.5461 | 0.4988 | 0.4816 | 0.6268 | 0.5039 | 0.5325 |
| 4 | 0.5051 | 0.4408 | 0.3525 | 0.2855 | 0.438 | 0.4283 | 0.5414 | 0.484 | 0.4603 | 0.636 | 0.4952 | 0.5177 |
| 5 | 0.4917 | 0.4203 | 0.3255 | 0.2458 | 0.4198 | 0.4106 | 0.5361 | 0.4686 | 0.4412 | 0.6377 | 0.4874 | 0.5038 |
| 6 | 0.4793 | 0.4022 | 0.3036 | 0.2173 | 0.404 | 0.3949 | 0.5307 | 0.4543 | 0.4246 | 0.6352 | 0.4799 | 0.4913 |
| 7 | 0.4681 | 0.3867 | 0.2862 | 0.1963 | 0.3907 | 0.3814 | 0.5255 | 0.4417 | 0.4106 | 0.6306 | 0.4728 | 0.4802 |
| 8 | 0.4582 | 0.3738 | 0.2722 | 0.1804 | 0.3794 | 0.3698 | 0.5205 | 0.4308 | 0.3987 | 0.6253 | 0.4661 | 0.4706 |
| 9 | 0.4495 | 0.363 | 0.2609 | 0.1679 | 0.3698 | 0.3601 | 0.5158 | 0.4215 | 0.3886 | 0.6199 | 0.46 | 0.4622 |
| 10 | 0.4418 | 0.354 | 0.2515 | 0.1578 | 0.3616 | 0.3517 | 0.5115 | 0.4135 | 0.38 | 0.6147 | 0.4545 | 0.455 |
| 11 | 0.4351 | 0.3463 | 0.2437 | 0.1495 | 0.3546 | 0.3446 | 0.5076 | 0.4066 | 0.3726 | 0.6099 | 0.4495 | 0.4488 |
| 12 | 0.4293 | 0.3397 | 0.2371 | 0.1426 | 0.3486 | 0.3384 | 0.5041 | 0.4006 | 0.3662 | 0.6055 | 0.445 | 0.4433 |
| 13 | 0.4241 | 0.3341 | 0.2314 | 0.1367 | 0.3433 | 0.3331 | 0.5008 | 0.3954 | 0.3607 | 0.6015 | 0.441 | 0.4385 |
| 14 | 0.4196 | 0.3291 | 0.2265 | 0.1316 | 0.3386 | 0.3284 | 0.4979 | 0.3909 | 0.3558 | 0.5978 | 0.4374 | 0.4343 |
| 15 | 0.4155 | 0.3248 | 0.2222 | 0.1271 | 0.3345 | 0.3242 | 0.4951 | 0.3868 | 0.3515 | 0.5945 | 0.4341 | 0.4305 |
| 16 | 0.4119 | 0.3209 | 0.2184 | 0.1232 | 0.3309 | 0.3205 | 0.4926 | 0.3832 | 0.3477 | 0.5914 | 0.4312 | 0.4272 |
| 17 | 0.4086 | 0.3175 | 0.215 | 0.1197 | 0.3276 | 0.3172 | 0.4903 | 0.38 | 0.3443 | 0.5887 | 0.4285 | 0.4242 |
| 18 | 0.4057 | 0.3145 | 0.212 | 0.1166 | 0.3246 | 0.3143 | 0.4882 | 0.3771 | 0.3412 | 0.5862 | 0.4261 | 0.4215 |
| 19 | 0.4031 | 0.3117 | 0.2093 | 0.1138 | 0.3219 | 0.3116 | 0.4863 | 0.3745 | 0.3384 | 0.5839 | 0.4238 | 0.419 |
| 20 | 0.4006 | 0.3092 | 0.2069 | 0.1113 | 0.3195 | 0.3092 | 0.4845 | 0.3721 | 0.3359 | 0.5817 | 0.4218 | 0.4168 |
| 21 | 0.3984 | 0.3069 | 0.2047 | 0.109 | 0.3173 | 0.307 | 0.4828 | 0.3699 | 0.3336 | 0.5798 | 0.4199 | 0.4147 |
| 22 | 0.3964 | 0.3049 | 0.2026 | 0.1069 | 0.3152 | 0.305 | 0.4812 | 0.3679 | 0.3315 | 0.578 | 0.4181 | 0.4129 |
| 23 | 0.3945 | 0.303 | 0.2008 | 0.105 | 0.3134 | 0.3031 | 0.4798 | 0.3661 | 0.3296 | 0.5763 | 0.4165 | 0.4111 |
| 24 | 0.3928 | 0.3012 | 0.1991 | 0.1032 | 0.3116 | 0.3014 | 0.4784 | 0.3644 | 0.3278 | 0.5748 | 0.415 | 0.4096 |
| 25 | 0.3912 | 0.2996 | 0.1975 | 0.1016 | 0.3101 | 0.2998 | 0.4771 | 0.3629 | 0.3262 | 0.5733 | 0.4137 | 0.4081 |
| 26 | 0.3897 | 0.2981 | 0.196 | 0.1001 | 0.3086 | 0.2984 | 0.476 | 0.3615 | 0.3247 | 0.572 | 0.4124 | 0.4067 |
| 27 | 0.3884 | 0.2967 | 0.1947 | 0.0987 | 0.3072 | 0.297 | 0.4748 | 0.3601 | 0.3233 | 0.5707 | 0.4112 | 0.4054 |
| 28 | 0.3871 | 0.2954 | 0.1934 | 0.0974 | 0.3059 | 0.2957 | 0.4738 | 0.3589 | 0.322 | 0.5696 | 0.41 | 0.4043 |
| 29 | 0.3859 | 0.2942 | 0.1922 | 0.0962 | 0.3047 | 0.2946 | 0.4728 | 0.3577 | 0.3207 | 0.5685 | 0.409 | 0.4031 |
| 30 | 0.3848 | 0.2931 | 0.1911 | 0.0951 | 0.3036 | 0.2935 | 0.4719 | 0.3566 | 0.3196 | 0.5674 | 0.408 | 0.4021 |
| Delta H | 0.3454 | 0.3637 | 0.4677 | 0.6814 | 0.3971 | 0.3284 | 0.1705 | 0.3092 | 0.4682 | 0.2309 | 0.3479 | 0.3325 |
| Delta α | 0.4087 | 0.4324 | 0.531 | 0.75 | 0.4624 | 0.3942 | 0.2291 | 0.3751 | 0.5341 | 0.2982 | 0.4136 | 0.3977 |
Publisher’s Note: MDPI stays neutral with regard to jurisdictional claims in published maps and institutional affiliations. |
© 2022 by the authors. Licensee MDPI, Basel, Switzerland. This article is an open access article distributed under the terms and conditions of the Creative Commons Attribution (CC BY) license (https://creativecommons.org/licenses/by/4.0/).
Share and Cite
MDPI and ACS Style
Aslam, F.; Ferreira, P.; Ali, H. Analysis of the Impact of COVID-19 Pandemic on the Intraday Efficiency of Agricultural Futures Markets. J. Risk Financial Manag. 2022, 15, 607. https://doi.org/10.3390/jrfm15120607
AMA Style
Aslam F, Ferreira P, Ali H. Analysis of the Impact of COVID-19 Pandemic on the Intraday Efficiency of Agricultural Futures Markets. Journal of Risk and Financial Management. 2022; 15(12):607. https://doi.org/10.3390/jrfm15120607
Chicago/Turabian StyleAslam, Faheem, Paulo Ferreira, and Haider Ali. 2022. "Analysis of the Impact of COVID-19 Pandemic on the Intraday Efficiency of Agricultural Futures Markets" Journal of Risk and Financial Management 15, no. 12: 607. https://doi.org/10.3390/jrfm15120607