
Did Electric Vehicle Sales Skyrocket Due to Increased Environmental Awareness While Total Vehicle Sales Declined during COVID-19?


Institute for Mobility, IMO, School of Management, University of St. Gallen, 9000 St. Gallen, Switzerland
*
Author to whom correspondence should be addressed.
Sustainability 2021, 13(24), 13839; https://doi.org/10.3390/su132413839
Submission received: 11 October 2021
/
Revised: 25 November 2021
/
Accepted: 4 December 2021
/
Published: 15 December 2021
(This article belongs to the Special Issue Electric Mobility, Sustainability, Smart Cities, Green Policies and Electric Vehicles Adoption)
Abstract
:Since the beginning of 2020, the COVID-19 pandemic has posed a global threat to humankind. In addition to many cases of illness and millions of deaths, the economy has suffered. Not surprisingly, vehicle sales have declined sharply in most countries by up to 25%. However, the overall sales of electric vehicles (EVs) did not stall; instead, they increased to previously forecasted levels. Is this increase evidence that COVID-19 has promoted sustainable action and strengthened environmental awareness, as researchers have discussed in recently published articles? Or is this merely the effect of monetary incentives by governments, as has been demonstrated in scientific research? This study examines the causes behind the surprising continuous climb of EV sales despite the outbreak of the pandemic by contrasting the influence of COVID-19 on environmental concerns and the usual monetary incentives with their potential complementary effects.
1. Introduction
Crises are abrupt negative changes regarding security-relevant, economic, political, environmental, or health issues. While local crises (e.g., famines, floods, wars) may arise in places all over the world, global phenomena of this kind rarely occur. The most recent global crisis was the financial crisis in 2008, which resulted in a severe imbalance of the global banking system. National banks such as the Federal Reserve flooded the entire world with an enormous amount of liquidity, resulting in loans with low interest rates being widely available. As a result, the impacts of the financial crisis were quickly mitigated, and by 2011, the economy had almost completely recovered [1,2].
Another crisis that is said to be global is the ongoing destruction of the environment due to the emission of greenhouse gases (GHGs) and global warming [3,4]. However, for most people, the salience of the consequences of global warming is limited. There have been local floods and other phenomena that could be attributed to global warming; however, most people have not (yet) been affected by the destruction of the environment [5]. Most predictions of negative consequences are based on scientific research, which is excessively abstract for many individuals.
While the consequences of global warming are not visible to everyone, the threat of the COVID-19 pandemic is unavoidable. Since the outbreak of COVID-19 in 2020, this pandemic has lasted for a lengthy period of time. By the time the pandemic passes, hundreds of millions will have been infected, and millions will have died globally [6]. It is a situation of maximal risk and uncertainty for all mankind. Even the efficacy of vaccines is questionable due to the occurrence of mutations of the virus. Clearly, COVID-19 is a threat to most individuals [7,8].
Researchers have analyzed how the highly salient threats of COVID-19 can promote environmental awareness [9,10,11]. On the one hand, due to environmental degradation, there exists a greater proximity between wild animals and humans. This proximity favors so-called zoonosis, which is the spread of pathogens from animals to humans [12,13,14]. On the other hand, the concern and fear associated with the ubiquitous risk of infection can lead to increased conformity for those whose aim is to protect the environment from destruction [15,16,17].
Based on these ideas, Bouman et al. [7] developed a theory of how the COVID-19 pandemic could impact personal norms, which could lead to increased environmental awareness. The key question posed by Bouman et al., (2020) was to what extent one can learn from the pandemic to promote the mitigation of global environmental crises. A potential answer suggests that the COVID-19 pandemic has increased environmental awareness.
Such an answer could be found by observing changes in ecosensitive behavior after the outbreak of the pandemic. One global market in which environmental awareness plays a pivotal role is vehicle sales [18]. Personal transport is highly important, and the COVID-19 pandemic has reinforced this situation [19]. Findings [20] have indicated that desired self-identity, green perceived value, and altruistic values positively influence consumer engagement behavior with focal green car brands. Although the production of electric vehicles (EVs) and, in particular, their batteries require environmental resources, it has been widely accepted that EVs are at least a first step towards mitigating air pollution since they create no tailpipe emissions [21,22,23]. Acquiring an EV instead of a traditional internal combustion engine (ICE) vehicle could result from improved environmental awareness and behavior [24]. Li et al., (2019) [22] emphasized that the awareness of environmental issues continuously enhances the development of EVs.
For several years, national governments have successfully promoted electric mobility through financial subsidies and tax exemptions [25,26]. In this context, increased environmental awareness and government subsidies could have a mutual complementary effect on promoting electric mobility. Thereby, incentives continue to support the purchase of EVs (in this article, electric vehicles (EVs) and plug-in-hybrid electric vehicles (PHEVs) are grouped together; latest sales numbers indicate that the proportion of EVs in the total number of EVs and PHEVs is increasing), and, spurred on by increased environmental awareness due to COVID-19, they may have resulted in increasing sales numbers despite the dangers of the pandemic.
To date, there is no empirical evidence to support the above theories. The aim of this article is to examine the effect of the global COVID-19 pandemic on an increased awareness of global environmental threats and a subsequent positive effect on EV sales due to these stronger environmental concerns. Additionally, the well-known monetary incentives given by governments are incorporated into the inquiry to distinguish between both measures and to uncover any complementary effects. The results could yield a strong contribution for researchers regarding sustainability and for policymakers adjusting their measures to promote electric mobility.
In what follows, first, the actual vehicle sales numbers in the months since the beginning of the COVID-19 outbreak until the end of 2020 (i.e., February to December 2020) will be analyzed by comparing ICE and EV sales in different countries. Subsequently, hypotheses will be formulated regarding a potential chain of effects due to the threat of the pandemic, such as an increased perception of environmental hazards or, reinforced by EV incentives, a higher acceptance of EVs. The results of a worldwide survey conducted in 25 countries on five continents will be reported to determine consumers’ motivations and explain these motivations in an adequate model. The discussion and conclusion will complete the article.
2. The Effect of COVID-19 on Total Vehicle Sales and Environmental Awareness
2.1. Worldwide Vehicle Sales after the Outbreak of COVID-19 (February until December 2020)
This study addresses vehicle sales figures between the beginning of the COVID-19 pandemic and the end of 2020 (i.e., February to December 2020). For all vehicles, data were retrieved from an online automotive industry platform [27]. The data for EVs originated from a consulting company specializing in EVs [28]. The 25 countries (Table 1) were selected based on the following selection criteria: (1) countries from all five continents, (2) those countries that represent the majority of the world population (here, 4.2 billion = 55%), and (3) countries with the highest EV sales (93% of all 3.25 million EV sales worldwide in 2020 are covered in this study); however, (4) some countries had very low EV sales (such as Australia, India, Brazil, and Russia). Data from the year 2020 will be compared to those of the previous year. The numbers are presented in Table 1.
Unsurprisingly, total vehicle sales have declined since the outbreak of the COVID-19 pandemic by up to 25% in some countries. Due to the minimal decline in East Asian countries, the average total decline was 14.4% (Table 1, Column 3). In contrast, EV sales increased by 46.4% (Table 1, Column 6). EV sales for 2020 were forecasted to be higher than those in 2019 [28,31]. However, China did not meet its high projection due to a policy change in mid-2019 [32]. Subsidies were cut by approximately 50%; moreover, the policy allowing EV buyers to register their cars immediately, rather than waiting a certain amount of time for their license plates, as is the case with conventional cars, was made more restrictive. In contrast to the expected sales of two to three million EVs in 2020, only 1.28 million EVs were sold. In summary, other countries were consistent with expectations. Some countries, such as the USA and Canada, fell short of expectations, but others could make up the difference (e.g., the UK, Germany, and France). Thus, as a first result, we can state that the COVID-19 crisis caused a decline in total vehicle sales but not in EV sales. Figure 1 shows the opposing effects between forecasted and actual sales for all cars and EVs only. It is based on a yearly growth of 2.6% for all cars and 20% for EVs.
Further tests have suggested that there is a correlation between the severity of the pandemic—indicated by the incidence per 100,000 people from February to December 2020 (Table 1, Column 8)—and the percentage of decline in sales (Table 1, Column 3). This correlation is highly significant (r = 0.623, p < 0.001). Another correlation can be found between the incidence (Table 1, Column 8) and the EV market share in 2020 (Table 1, Column 7). However, as in Norway, the incidence was low (below 1000) but the EV market share was the highest worldwide (nearly 80%). Norway was an outlier and had to be removed from the sample to test for a possible correlation. As a result, the correlation between incidence and market share yields r = 0.419, p < 0.05. Although these results represent mere correlations, it can be concluded that there is a relationship between the severity of the pandemic and the decline in total vehicle sales. However, there was not a decline but, rather, a predicted increase in EV sales. The following section will attempt to explain the above relationships by proposing respective hypotheses.
2.2. The Effect of COVID-19 on Environmental Awareness—Theory and Hypotheses
The starting point of the COVID-19 outbreak was the Huanan seafood market in Wuhan, China [33]. This market is a wildlife market where many types of animals (bats, frogs, snakes, birds, etc.) are sold. Population growth and deforestation have brought wildlife and humans closer together, rendering such markets vulnerable to diseases caused by pathogens due to zoonosis, which is defined as a disease that is transmitted from animals to humans [34]. Thus, COVID-19 has an immediate link to nature and the environment. Several researchers have noted that environmental degradation, particularly deforestation, brings animals closer to human settlements, partly as a source of nutrition, which favors the outbreak of epidemics or even pandemics [12,35,36,37,38]. Due to this direct link, people associate COVID-19 with environmental influences, resulting in the first hypothesis:
Hypothesis 1 (H1).
A majority of people attribute the COVID-19 pandemic to environmental degradation.
In addition to this superficial explanation, there are psychological effects. COVID-19 represents an imminent threat that is experienced up close, and people are acutely aware of this danger [7]. The fact that COVID-19 and its health-related consequences are relatively unexplored exacerbates this perceived threat. It is impossible to predict how long the pandemic will persist, how severe potential mutations will be, and what damage long-term effects could cause [39]. The consequence for individuals is total risk aversion and uncertainty, leading to the second hypothesis:
Hypothesis 2 (H2).
A majority of people perceive COVID-19 as a danger to themselves.
In this mental state of risk aversion and uncertainty, personal norms and moral obligations are influenced [7], in such a way that behavior towards the environment could change positively [9]. COVID-19 is so salient that the threat posed by the pathogen increases conformity among group members [15,16]. Thus, the salience of mortality caused by COVID-19 may increase environmental awareness [17]. In combination with the technical background of the emergence of the pandemic due to environmental destruction, these psychosocial effects could lead to greater environmental awareness.
Hypothesis 3 (H3).
The COVID-19 pandemic has intensified people’s environmental awareness.
Moreover, although the effects of global warming are not immediately observable, people are becoming increasingly aware of the long-term consequences. Aside from higher odds of pandemics, global warming is associated with atmospheric changes, sea level rise and warming, soil depletion and resulting droughts, famine, water scarcity, biodiversity loss, and other issues [40,41]. All these consequences pose an increasing threat to individuals, of which they are becoming increasingly aware, and this is reinforced by politics and media [42].
Hypothesis 4 (H4).
A majority of people perceive global warming as a danger to themselves.
Furthermore, according to the literature, people with a green self-identity and high levels of ecological care are more likely to make sustainable purchases [43] and exhibit a higher probability of adopting EVs [24]. Consequently, we propose that this effect also applies in a pandemic context, which has a direct link to nature and the environment.
Hypothesis 5 (H5).
The outbreak of the coronavirus pandemic has caused people to give greater consideration to purchasing an EV.
Aside from COVID-19 being a factor in contemplating the purchase of an EV, other motivators may also contribute to the increase in EV sales. As revealed by prior research, financial incentives supplied by governments positively influence EV adoption rates in many countries [25,26]. We therefore propose that such incentives are further influential factors in the context of a pandemic.
Hypothesis 6 (H6).
Governmental incentives and tax benefits increase people’s odds of purchasing an EV.
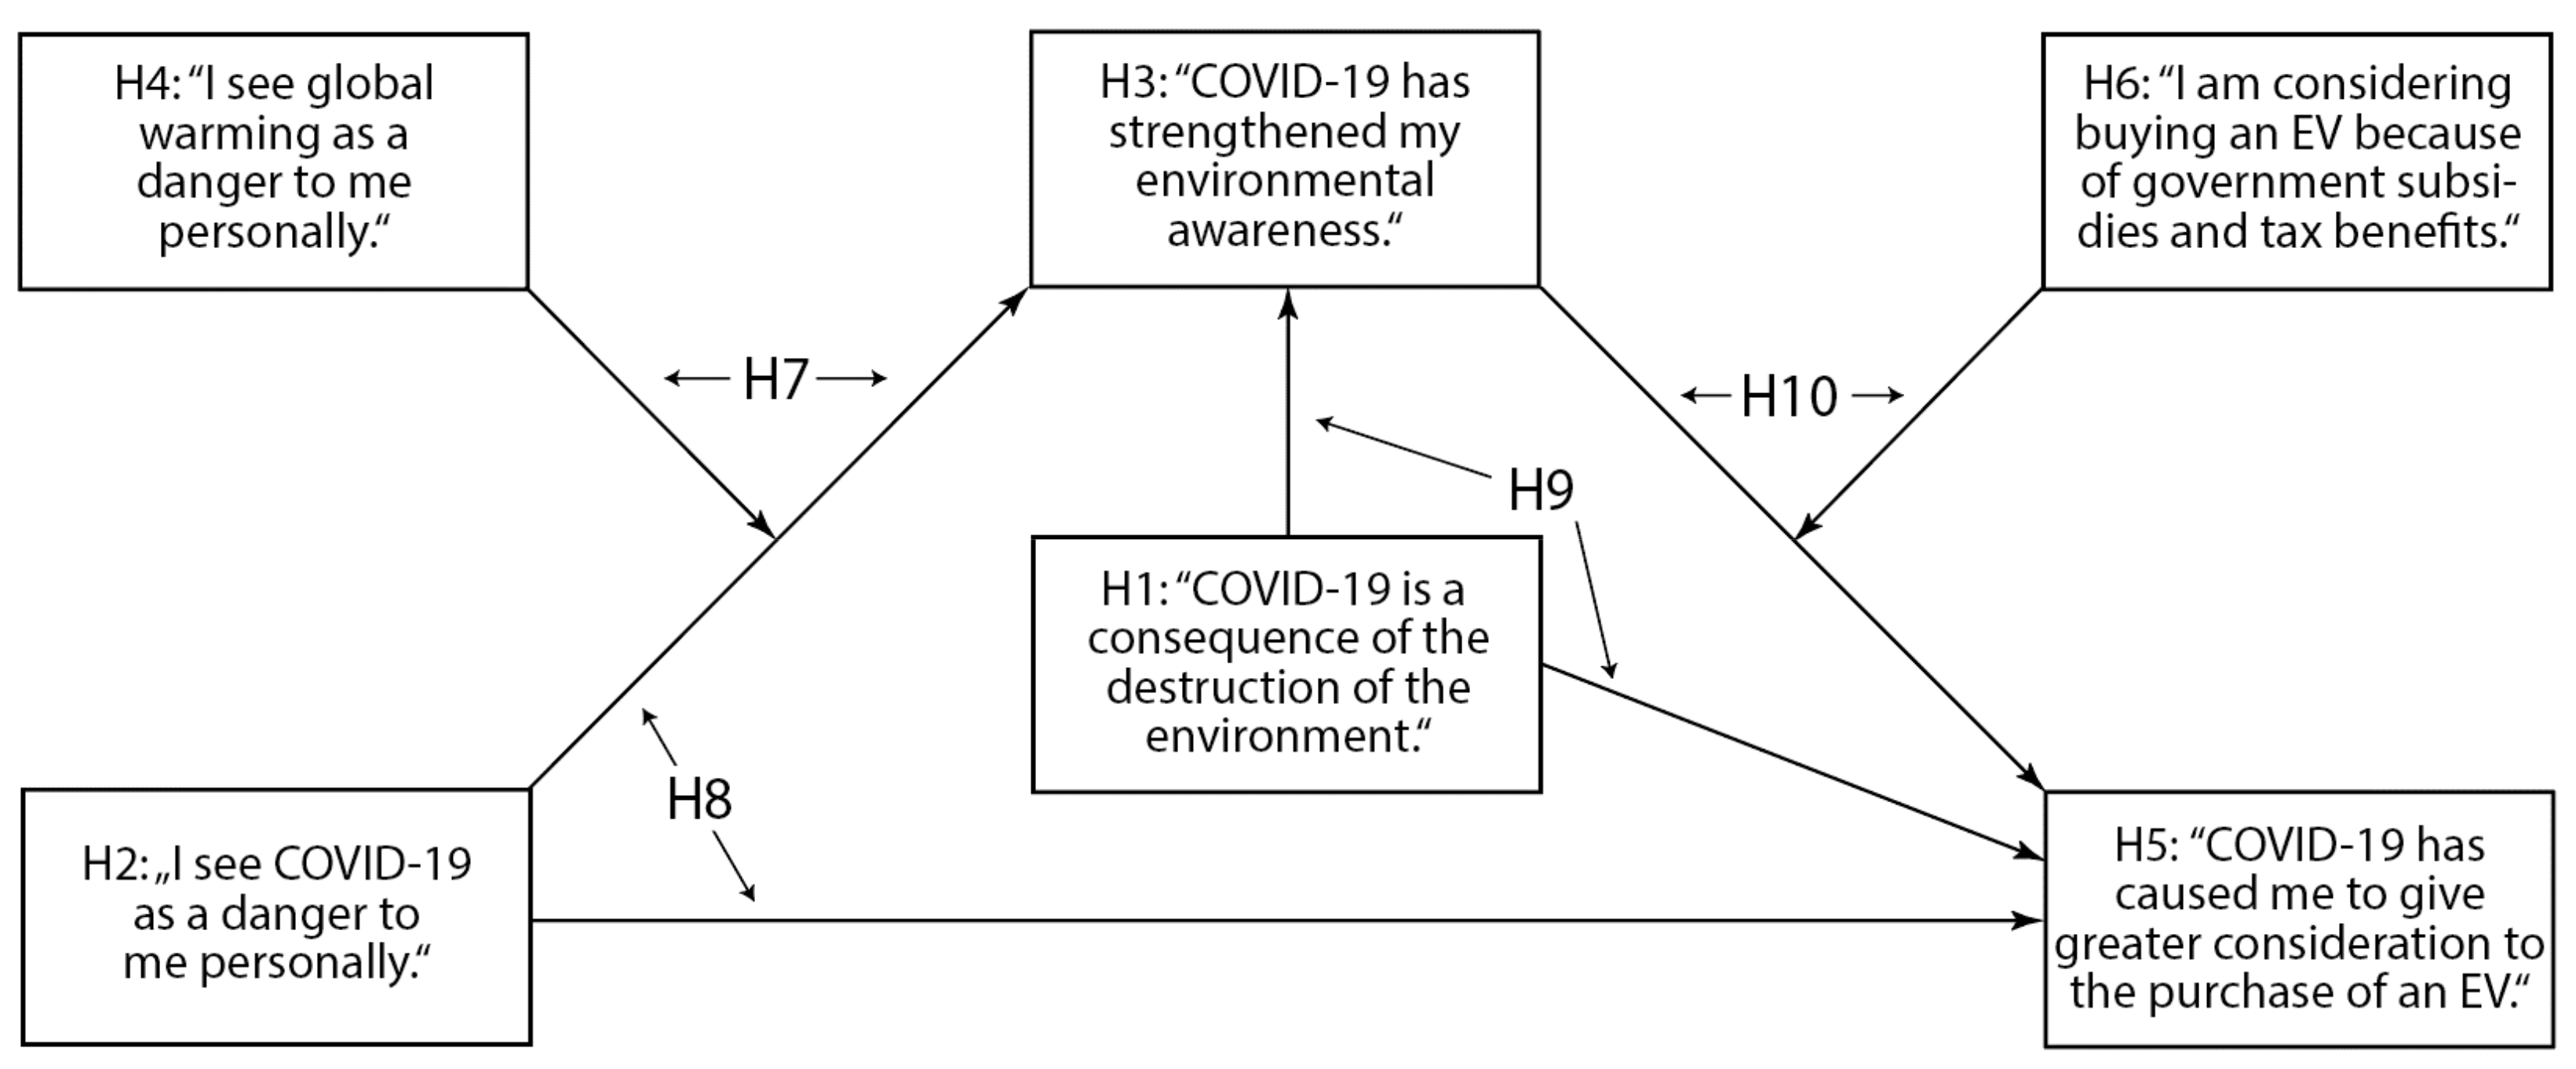
In addition, we propose causalities between the aforementioned hypotheses, including moderating and mediating effects. More specifically, we hypothesize that both COVID-19 and global warming precipitate increased environmental awareness via their own effects and their interactions. Hereby, we presume that the fear of COVID-19 increases with an increasing fear of global warming.
Hypothesis 7 (H7).
The threats from COVID-19 and global warming increase environmental awareness, with the effect of COVID-19 anxiety being greater the higher the perceived threat from global warming is.
Given the above-stated propositions, people’s perceived threat of COVID-19 leads to an increased likelihood of purchasing an EV. Hereby, the overall effect is mediated by greater environmental awareness. We therefore propose the following:
Hypothesis 8 (H8).
The perceived danger of COVID-19 has caused people to give greater consideration to purchasing an EV, such that the total effect is mediated by strengthened environmental awareness.
Furthermore, people’s assumption that COVID-19 is caused by environmental degradation makes them more likely to purchase an EV. Hereby, the overall effect is also mediated by greater environmental awareness.
Hypothesis 9 (H9).
The fact that environmental degradation is the reason for COVID-19 has caused people to give greater consideration to purchasing an EV, such that the total effect is mediated by strengthened environmental awareness.
Finally, as research demonstrates, both environmental awareness and financial incentives result in taking the purchase of an EV into greater account [24,25,26]. In this context, we propose that the more attractive the monetary incentives, the stronger the effect of greater environmental awareness.
Hypothesis 10 (H10).
Strengthened environmental awareness and governmental incentives cause people to give greater consideration to the purchase of an EV, with the effect of stronger environmental awareness being greater the more attractive the monetary incentives are.
The above hypotheses will be tested by a large-scale survey conducted in 25 countries on five continents. The structural double-moderated and double-mediated model is depicted in Figure 2.
3. Empirical Analysis
3.1. Method
In the empirical part, consumers were invited to participate in a survey if they had purchased a new vehicle or were thinking about purchasing one in the past two years, either an ICE or an EV. Questions pertained to consumers’ opinions about COVID-19, their environmental attitudes, and their motivations behind their decision to purchase either an ICE or an EV.
Thus, the survey was administered only to participants who had bought or had thought about buying a new car within the last two years. Those who did not were excluded at the beginning of the survey. The first question assessed whether people bought a new car or if they had thought about doing so. They were then asked about the type of car, i.e., an ICE vehicle or EV. Participants were also asked whether they had already been infected with COVID-19, whether they had relatives or knew people who had already been infected with the virus, whether they had relatives who died as a result of COVID-19, and whether they knew other people who died due to the virus (since these items are personal health questions, we followed the ethical guidance of informed consent [44], and the participants were informed of the following at the very beginning of the survey: “We will ask you some personal questions, such as whether or not you have ever contracted COVID-19. All the questions are structured such that you do not have to answer them. You can skip right on to the next question or simply close the browser. The survey is completely anonymous, and we cannot draw any conclusions about the identity of the participants. You can even declare that you want to end your participation now. To do so, simply click the relevant box. Otherwise, click “CONTINUE”. The participants indicated either “I would like to take part in the survey, but I can opt out at any time” or “I do not want to take part in the survey”. Out of all participants worldwide, approximately 1% decided not to take part).
The survey continued with a question regarding the participants’ awareness that COVID-19 could have been caused by deforestation and the destruction of nature. Subsequently, participants indicated their feelings towards COVID-19 as a danger to themselves. Participants were then asked whether the COVID-19 pandemic had strengthened their environmental awareness. Further questions asked about the participants’ opinions related to global warming and whether they perceived global warming as a danger to themselves. Subsequently, participants were asked whether the pandemic outbreak had caused them to consider purchasing an EV. To ascertain potential complementary effects of monetary incentives for the purchase of EVs, such as governmental grants or tax benefits, participants were asked whether these incentives increased their willingness to consider purchasing an EV. The answers to these six questions were used to examine their support for the hypotheses 1 to 6. Thereafter, their effects were tested in a simultaneous equation model (SEM) with regard to hypotheses 7 through 10.
Except for the questions regarding personal infections (answered YES or NO), the other items were assessed on a 7-point Likert scale ranging from 1 = “strongly disagree” to 7 = “strongly agree.” Additionally, demographic variables were assessed. In cases in which the original English questionnaire was unsuitable, translations were prepared via a professional translation service using a backtranslation technique to ensure a valid translation into the other language.
The survey was administered in the same 25 countries as those indicated in Table 1. Data collection was conducted by an international survey provider with subsidiaries worldwide. The survey began on 18 March and was completed on 31 March 2021. Data were analyzed by SPSS 27 statistical software and AMOS 27 structural equation modeling analysis software.
3.2. Results
In all 25 countries, approximately 15,000 individuals were invited to participate; however, approximately 31% were rejected, as they did not meet the selection criteria requiring a vehicle purchase during the last two years. Only 100 participants (approximately 1%) opted out of the survey after being asked for content information [44]. Thus, in each country, approximately 350 to 400 individuals participated (9478 in total). Descriptive results are shown in Table A1 and Table A2 in the Appendix A. The samples were quite balanced between females (46%) and males. The average age was 40 years, with a standard deviation of 13 years. Purchase intentions were indicated by 95% of the participants, and the actual purchase of a vehicle was indicated by 51%.
As a plausibility assessment, one question gauged the degree to which the participants were affected by COVID-19 themselves (worldwide, 8.6% had already had COVID-19 themselves, 26.6% knew a relative who had been infected with COVID-19, and 53.0% knew an acquaintance who had been infected with COVID-19). The percentages in the specific countries were significantly correlated with the incidence rates in these countries (r between 0.114 and 0.268, p < 0.001). Deaths known to have been caused by COVID-19 were associated with COVID-19 anxiety. Those who encountered a death in their family (n = 627, 6.6%) perceived a significantly higher danger of COVID-19 to themselves (5.25 vs. 4.75, p < 0.001). Those who encountered a death among their acquaintances (n = 1641, 17.3%) perceived a significantly higher danger of COVID-19 to themselves (5.34 vs. 4.64, p < 0.001). Thus, anyone who had been personally confronted with the COVID-19 virus perceived the pandemic as more dangerous to themselves than others, which supports the plausibility of the assessed data.
On a 7-point Likert scale, the participants agreed with the statement that the COVID-19 pandemic was caused by environmental degradation (H1), with a worldwide average value of 4.39 (a relative majority of 45.9% at least rather believed; p < 0.001). Participants agreed that the COVID-19 pandemic is a threat to them personally (H2), with a worldwide average value of 4.78 (an absolute majority of 61.8% at least somewhat agreed; p < 0.001). An absolute majority of 61.1% stated that the COVID-19 crisis had at least partly strengthened their environmental awareness (H3, 4.85, p < 0.001). The participants’ agreement with the statement that global warming is a danger to themselves (H4) produced a worldwide average value of 5.15 (an absolute majority of 70.4% at least somewhat agreed; p < 0.001). The question regarding whether COVID-19 had caused participants to give greater consideration to the purchase of an EV (H5) was answered in total by a value of 4.30 (a relative majority of 46.9% at least somewhat agreed; p < 0.001). Governmental subsidies caused participants to consider purchasing an EV (H6) by 4.38 in total (a relative majority of 49.4% at least somewhat agreed; p < 0.001). Distributions are indicated in Figure 3.
Thus, hypotheses H1 through H6 were supported, and at least the relative majority of participants agreed to the statements. Furthermore, those participants who had purchased an EV or were considering doing so assigned higher ratings to all six statements than those with a decision for an ICE (Appendix A Table A1 and Table A2). This also supports the assumption that COVID-19 and its consequences, combined with governmental subsidies, increased consumers’ willingness to purchase an EV. However, an adequate evaluation of whether and how these six single items have causal effects on each other has to be examined through further analyses. Thus, a simultaneous equation model was applied, as shown in Figure 2.
The double-moderated and double-mediated model was evaluated with SPSS 27 and AMOS 27 [45]. The variables concerning the moderating effects were mean centered before execution to build the product terms of the moderating interaction (H2 and H4, and H3 and H6). All results were reported as unstandardized coefficients. This seemed appropriate, since all measurement methods were the same on a 7-point scale; thus, the effects were directly comparable [46,47].
The evaluation of the data was performed stepwise. First, to determine the total effect of COVID-19′s perceived danger (H2) on EV purchase consideration (H5), a linear regression was conducted with a significant coefficient of 0.285 (p < 0.001, Model 1 in Table 2). Subsequently, the first mediation model was tested with H3 as a mediator (Model 2 in Table 2). In Model 3, environmental degradation as a cause of COVID-19 (H1) was added as a second mediator. Global warming as a threat (H4) was added in Model 4 as a moderator, monetary incentives (H6) as a moderator in Model 5, and finally, both moderators (H4 and H6) were added to complete the full model. Both direct and indirect effects yielded the total effects. These details are reported in Table 2 for the worldwide sample. For the different countries, direct, indirect, and total effects are reported in Appendix A Table A3, Table A4, Table A5 and Table A6.
In each step from one to the next model, the coefficients of determination (R2) increased, thereby explaining increasingly more of the variance in the data. As a measure of the size of the effect on R2, Cohen’s f2 was calculated [48,49]. It ranged from 0.13 as a rather mid-size effect up to 0.56 for the inclusion of the mediators, which is a strong effect [49]. Thus, the final model depicted in Figure 4, with a total R2 of 0.533, can be assumed to be a viable solution for the present research question.
The effect of COVID-19′s danger (H2) on strengthened environmental awareness (H3) is b = 0.118 (p < 0.001). The danger of global warming (H4) exerts a strong effect on environmental awareness (H3), with b = 0.357 (p < 0.001), and it serves as a moderator. This reinforces the effect of COVID-19′s danger (the interaction term H2 x H4 has a significant b = 0.016, p < 0.001), which supports H7.
The direct effect of COVID-19′s danger (H2) on greater proclivity to buy an EV (H5) is quite low (b = 0.020, p < 0.05) because its total effect on H5 (b = 0.074, p < 0.001) is largely mediated by strengthened environmental awareness (H3, indirect effect = 0.054, p < 0.001). This supports H8.
The fact that people believe that COVID-19 has been caused by the destruction of the environment (H1) exerts a direct effect on a greater consideration to purchase an EV (H5, b = 0.132, p < 0.001). The total effect of H1 on H5 (b = 0.255, p < 0.001) has been partly mediated by strengthened environmental awareness (H3; indirect effect = 0.123, p < 0.001). This supports H9.
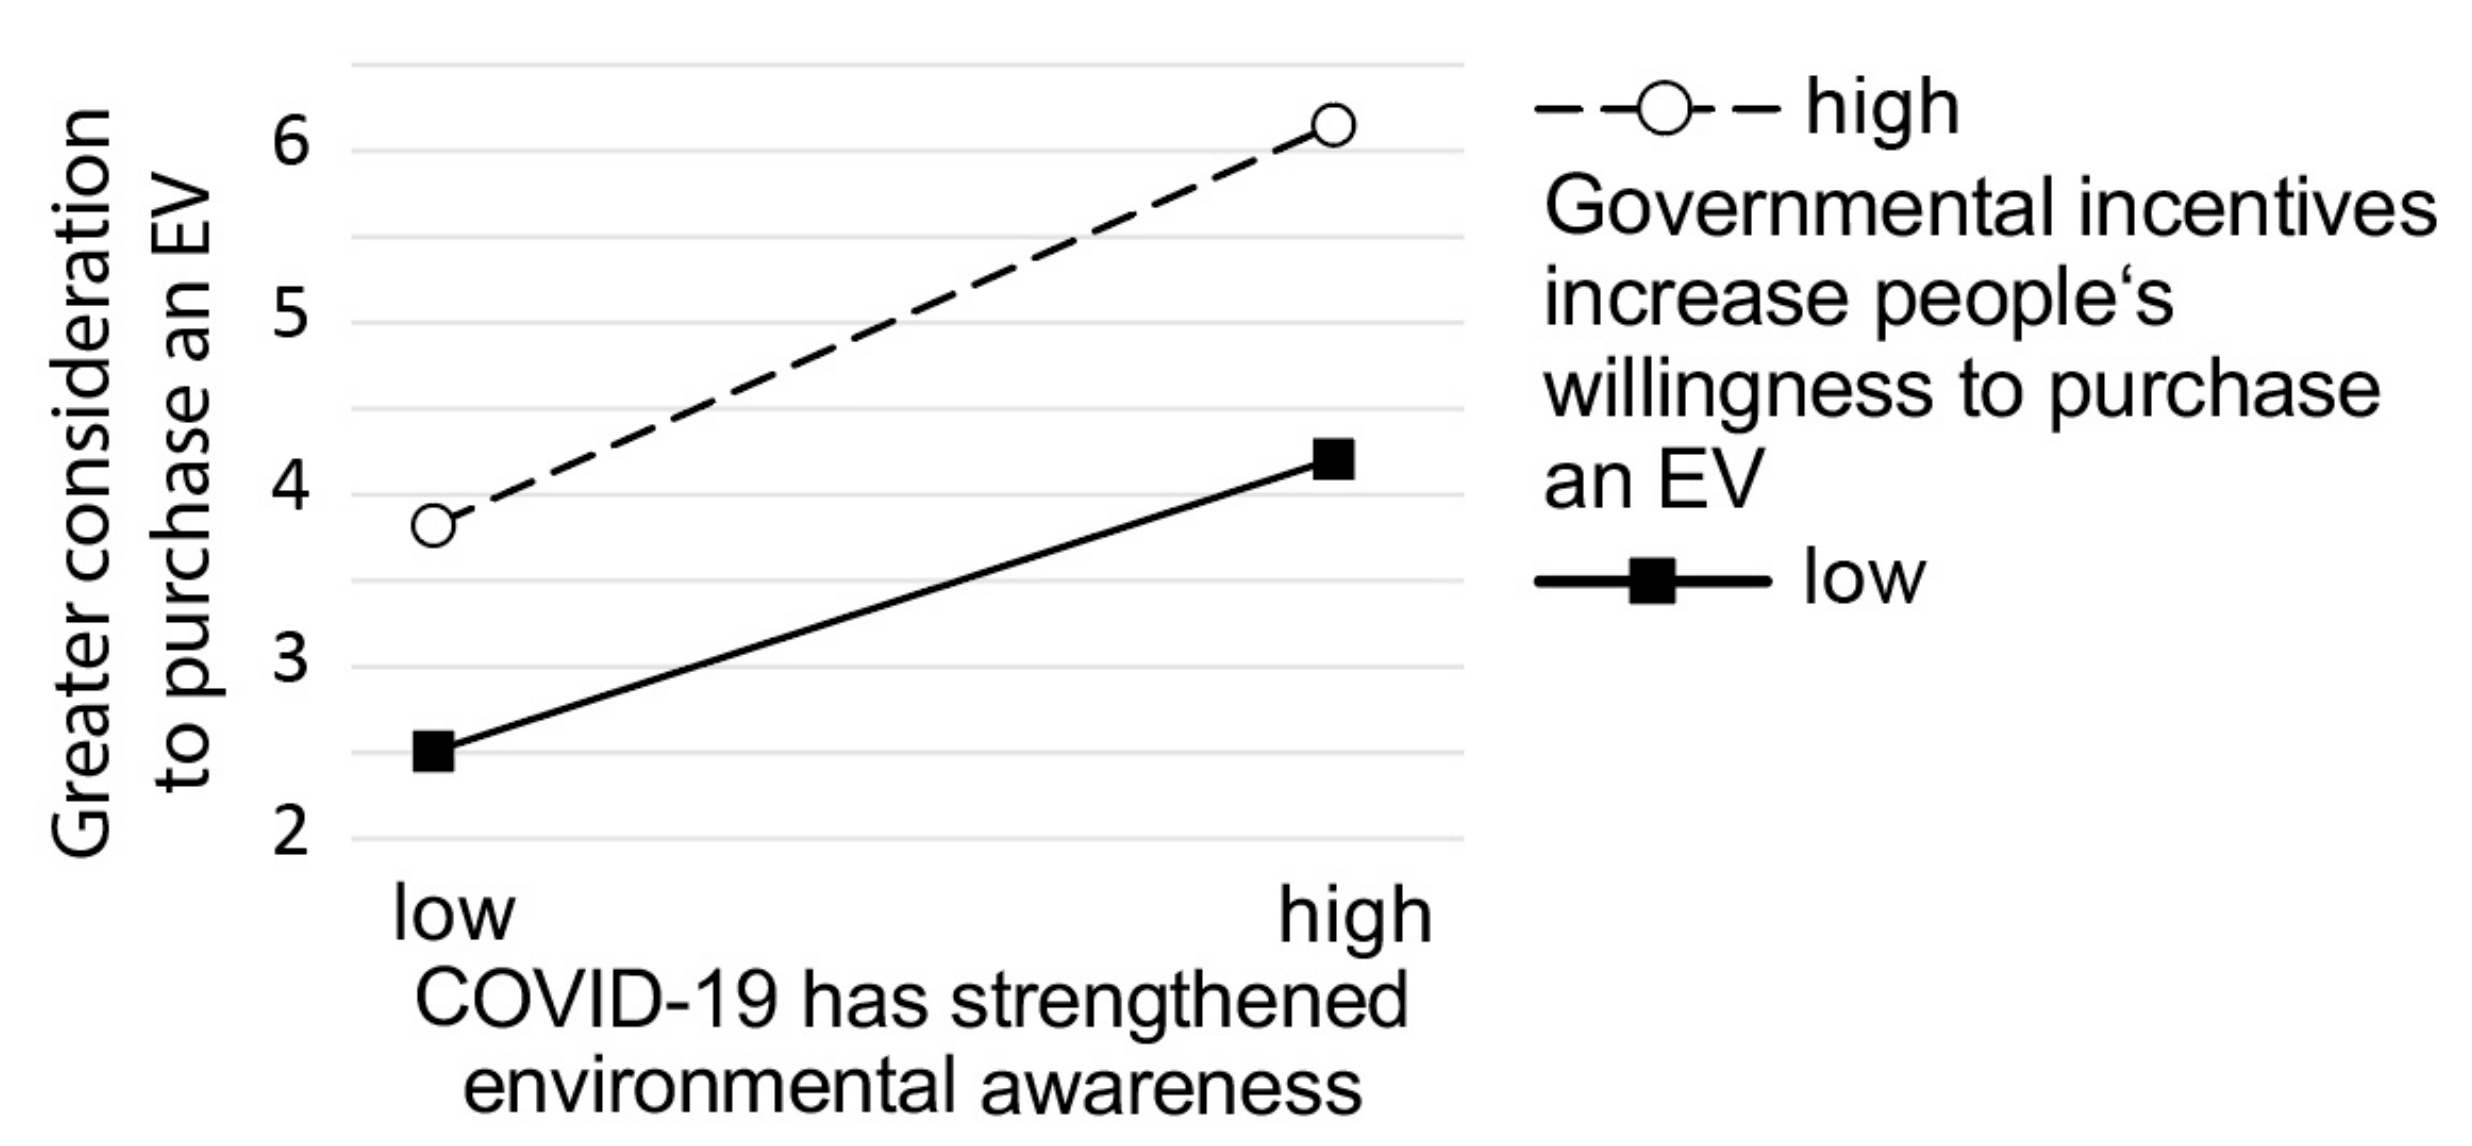
With b = 0.462 (p < 0.001), strengthened environmental awareness (H3) had the strongest effect on increased consideration to buy an EV (H5). Governmental incentives (H6) had the second strongest effect, with b = 0.383 (p < 0.001). Most important was the moderating effect of governmental incentives, with a significant interaction term benvironmental awareness x incentives = 0.036 (p < 0.001). The reinforcing effect is illustrated in Figure 5. Governmental incentives increased the willingness to purchase an EV not only via a fixed effect; however, they did so disproportionally by augmenting the effect of increased environmental awareness as well.
4. Conclusions, Limitations, and Further Research
The surprising fact about car sales in 2020 was that ICE sales plummeted after COVID-19 emerged, while EV sales not only did not decline but continued to increase as predicted [31]. One would have to assume that after the outbreak of the pandemic, EV sales would have also suffered. Studies in Korea [50] have demonstrated that among attitudinal attributes, not only environmental but also economic perceptions concerning EV use were the strongest predictors for an EV purchase. This study confirmed the assumption that the environmental awareness raised by COVID-19 in addition to governmental subsidies prompted a disproportional increase in EV sales despite the threat of the pandemic.
From a theoretical point of view, this study unveiled an important mechanism underlying this surprising phenomenon of incongruent market behavior. COVID-19 itself has a strong connection to nature and the environment due to its perceived origin, zoonosis, i.e., the transmission of pathogens from animals to humans in degraded environments. This fact and the personal threats of COVID-19 and global warming strengthened peoples’ environmental awareness. While these effects occur instantaneously and intuitively in peoples’ perceptions and are not easily altered, the strong effect of subsidies can be controlled by governments. Further, while it has been shown that there is a strong positive interaction between investments in EV infrastructure and governmental subsidies [26], this study again supports the intention of governments to promote electric mobility through monetary incentives, which is the practical contribution of this study. As long as the acquisition of an EV is significantly more expensive than that of an ICE, governments should continue to facilitate consumers’ decision to purchase an EV by offering financial relief. Sales numbers in 2020 show that people with a higher willingness to purchase an EV due to strengthened environmental awareness will in fact buy or plan to do so if governmental incentives are granted. This explains the surprising gap between ICE and EV sales after the outbreak of COVID-19 in 2020.
Other factors promoting electric mobility were not included in this study, such as traffic regulations to facilitate parking and driving of EVs in contrast to ICEs. The charging infrastructure was not analyzed either. An analysis of policy measures contrasted by the severity of the pandemic in the respective countries as in [26] could deliver further insights. Performing such tests was beyond the scope of this study; however, it could be a promising venue for further research.
The overall significant effects in the worldwide model are partly due to the large size of the sample with 9478 participants. The higher the number of cases (N), the more significant the results are. Thus, as can be seen from Table A1 and Table A2 in the Appendix A, hypotheses H1 to H6 were supported in general, and in cases in which the respective vehicle type was an EV, ratings were mostly higher. Yet, this effect was not significant in all countries (note that the sample size within the countries was only about 400, compared to the worldwide sample of 9478 cases). Nevertheless, the high proportion of variance that could be explained (R2 = 0.533 worldwide) is an acceptable result for such a large sample.
This study demonstrated that the COVID-19 pandemic has given new momentum to global environmental concern, which could have fruitful results on measures to reduce environmental degradation and global warming, such as increased demand for environmentally friendly technologies such as EVs. Additionally, the results confirmed the findings of former studies that governments should continue to promote electric mobility through monetary incentives.
Author Contributions
Conceptualization, T.L. and B.H.; methodology, T.L.; validation, T.L. and B.H.; formal analysis, T.L.; B.H.; writing—original draft preparation, T.L.; writing—review and editing, B.H. All authors have read and agreed to the published version of the manuscript.
Funding
This research received no external funding.
Informed Consent Statement
Informed consent was obtained from all subjects involved in the study.
Data Availability Statement
The complete set of worldwide data is available upon request from the authors.
Conflicts of Interest
The authors declare no conflict of interest.
Appendix A

Table A1.
Main Results by Country.
| Australia | Austria | Belgium | Brazil | Canada | China | Denmark | Finland | France | Germany | India | Italy | Japan | |
|---|---|---|---|---|---|---|---|---|---|---|---|---|---|
| N | 355 | 396 | 375 | 403 | 390 | 411 | 357 | 385 | 375 | 396 | 412 | 392 | 325 |
| female | 48% | 44% | 49% | 50% | 54% | 46% | 46% | 42% | 49% | 47% | 39% | 50% | 33% |
| M Age | 46 | 41 | 41 | 35 | 48 | 35 | 44 | 37 | 44 | 44 | 33 | 42 | 45 |
| SD Age | 13 | 13 | 14 | 10 | 13 | 8 | 14 | 13 | 12 | 13 | 8 | 12 | 12 |
| Considered ICE | 142 | 147 | 123 | 170 | 161 | 55 | 101 | 145 | 110 | 146 | 85 | 118 | 93 |
| Purchased ICE | 180 | 170 | 179 | 175 | 152 | 159 | 150 | 142 | 148 | 138 | 232 | 98 | 147 |
| Considered EV | 18 | 53 | 43 | 30 | 53 | 51 | 61 | 52 | 78 | 74 | 27 | 123 | 46 |
| Purchased EV | 15 | 26 | 30 | 28 | 24 | 146 | 45 | 46 | 39 | 38 | 68 | 53 | 39 |
| H1: The emergence of COVID-19 is a consequence of the destruction of the environment. | |||||||||||||
| * | n.s. | n.s. | n.s. | ** | n.s. | n.s. | n.s. | n.s. | n.s. | n.s. | n.s. | n.s. | |
| Considered ICE | 4.0 | 3.8 | 4.2 | 4.4 | 4.0 | 4.6 | 3.8 | 3.8 | 4.4 | 3.8 | 5.0 | 4.8 | 3.7 |
| Purchased ICE | 4.1 | 4.3 | 4.3 | 4.7 | 4.3 | 5.2 | 3.8 | 4.2 | 4.7 | 3.7 | 5.3 | 4.9 | 3.9 |
| Considered EV | 4.2 | 4.1 | 4.1 | 5.0 | 4.8 | 4.8 | 3.8 | 4.1 | 4.7 | 4.1 | 5.3 | 4.9 | 4.1 |
| Purchased EV | 5.5 | 3.8 | 4.4 | 5.0 | 4.7 | 5.0 | 3.9 | 4.4 | 5.2 | 4.0 | 5.2 | 5.1 | 4.0 |
| H2: I see COVID-19 as a danger to me personally | |||||||||||||
| n.s. | n.s. | n.s. | n.s. | n.s. | n.s. | n.s. | n.s. | n.s. | n.s. | n.s. | * | n.s. | |
| Considered ICE | 4.1 | 4.1 | 4.3 | 6.0 | 5.0 | 4.9 | 4.0 | 4.0 | 4.1 | 4.4 | 5.1 | 4.9 | 5.5 |
| Purchased ICE | 4.3 | 4.1 | 4.3 | 6.0 | 4.7 | 5.2 | 4.3 | 4.4 | 4.5 | 4.4 | 5.1 | 4.8 | 5.2 |
| Considered EV | 4.6 | 4.3 | 4.4 | 6.0 | 5.2 | 5.1 | 4.4 | 4.3 | 4.7 | 4.9 | 5.1 | 5.1 | 5.5 |
| Purchased EV | 4.2 | 4.3 | 4.5 | 6.1 | 5.0 | 5.4 | 4.3 | 4.6 | 4.4 | 4.5 | 4.8 | 5.3 | 5.3 |
| H3: The coronavirus pandemic has strengthened my environmental awareness. | |||||||||||||
| ** | n.s. | n.s. | * | * | ** | n.s. | * | *** | * | n.s. | * | *** | |
| Considered ICE | 4.5 | 4.1 | 4.4 | 5.6 | 4.4 | 5.7 | 4.2 | 4.0 | 4.3 | 3.9 | 6.0 | 5.3 | 4.2 |
| Purchased ICE | 4.4 | 4.5 | 4.6 | 6.0 | 4.7 | 5.9 | 4.1 | 4.3 | 4.8 | 4.4 | 5.7 | 5.1 | 4.3 |
| Considered EV | 4.9 | 4.3 | 4.3 | 6.2 | 4.9 | 6.1 | 4.2 | 4.5 | 5.2 | 4.4 | 6.0 | 5.4 | 4.8 |
| Purchased EV | 5.6 | 4.6 | 5.1 | 6.3 | 5.2 | 6.2 | 4.3 | 4.7 | 5.7 | 4.5 | 5.6 | 5.8 | 5.2 |
| H4: I see global warming as a danger to me personally. | |||||||||||||
| * | n.s. | * | n.s. | ** | * | n.s. | ** | n.s. | n.s. | n.s. | * | n.s. | |
| Considered ICE | 4.6 | 4.8 | 4.9 | 5.8 | 4.8 | 5.5 | 4.9 | 4.2 | 4.9 | 4.9 | 5.8 | 5.6 | 5.2 |
| Purchased ICE | 4.7 | 4.8 | 4.7 | 5.9 | 4.9 | 5.5 | 4.4 | 4.2 | 5.2 | 4.6 | 5.7 | 5.4 | 5.3 |
| Considered EV | 5.3 | 5.0 | 5.3 | 6.1 | 5.4 | 5.5 | 4.7 | 4.5 | 5.3 | 5.0 | 5.7 | 5.8 | 5.5 |
| Purchased EV | 5.3 | 4.7 | 5.0 | 6.1 | 5.5 | 5.9 | 4.4 | 5.1 | 5.5 | 5.1 | 5.5 | 5.7 | 5.6 |
| H5: The outbreak of the COVID-19 pandemic has caused me to give greater consideration to the purchase of an electric car. | |||||||||||||
| * | * | * | *** | *** | *** | n.s. | *** | *** | *** | n.s. | *** | *** | |
| Considered ICE | 3.7 | 2.9 | 3.7 | 4.5 | 3.6 | 4.7 | 3.8 | 3.4 | 3.3 | 3.1 | 5.4 | 4.3 | 3.5 |
| Purchased ICE | 4.0 | 3.6 | 3.9 | 5.3 | 4.1 | 5.4 | 3.8 | 3.7 | 4.1 | 3.7 | 5.5 | 4.3 | 4.0 |
| Considered EV | 3.8 | 3.7 | 4.0 | 6.0 | 4.7 | 5.7 | 3.9 | 4.4 | 4.8 | 4.3 | 5.9 | 5.2 | 4.8 |
| Purchased EV | 5.7 | 4.2 | 4.6 | 5.8 | 5.2 | 6.0 | 4.1 | 4.8 | 5.2 | 4.4 | 5.6 | 5.2 | 5.0 |
| H6: I am considering buying an electric car because of government subsidies and tax benefits. | |||||||||||||
| ** | ** | ** | *** | *** | *** | ** | *** | *** | *** | n.s. | *** | *** | |
| Considered ICE | 3.5 | 3.9 | 3.7 | 4.4 | 3.7 | 4.8 | 3.9 | 3.6 | 3.5 | 3.9 | 5.1 | 4.3 | 3.5 |
| Purchased ICE | 3.7 | 4.3 | 3.8 | 5.0 | 4.0 | 5.3 | 3.7 | 3.9 | 4.1 | 4.0 | 5.4 | 4.2 | 4.0 |
| Considered EV | 3.8 | 4.8 | 4.1 | 5.4 | 5.2 | 5.8 | 4.5 | 4.3 | 5.0 | 4.9 | 4.9 | 5.1 | 4.8 |
| Purchased EV | 5.6 | 4.8 | 4.9 | 5.7 | 5.4 | 5.8 | 4.2 | 4.6 | 5.1 | 5.3 | 5.2 | 5.6 | 4.8 |
Note: *** p < 0.001; ** p < 0.01; * p < 0.05; n.s. not significant. Scores were assessed on a 7-point scale ranging from 1 = “strongly disagree” to 7 = “strongly agree”.
Table A2.
Main Results by Country (cont’d).
| The Netherlands | Norway | Portugal | Russia | South Africa | Korea | Spain | Sweden | Switzerland | Taiwan | UK | USA | Total | |
|---|---|---|---|---|---|---|---|---|---|---|---|---|---|
| N | 358 | 361 | 381 | 387 | 403 | 391 | 385 | 376 | 382 | 372 | 363 | 347 | 9.478 |
| female | 47% | 53% | 46% | 35% | 58% | 43% | 44% | 47% | 52% | 43% | 48% | 31% | 46% |
| M Age | 41 | 37 | 39 | 37 | 34 | 42 | 41 | 39 | 42 | 38 | 44 | 46 | 40 |
| SD Age | 14 | 14 | 12 | 10 | 10 | 10 | 11 | 13 | 13 | 10 | 13 | 15 | 13 |
| Considered ICE | 115 | 77 | 144 | 234 | 178 | 99 | 108 | 101 | 142 | 93 | 100 | 102 | 3.089 |
| Purchased ICE | 155 | 129 | 119 | 125 | 201 | 105 | 94 | 130 | 135 | 129 | 156 | 188 | 3.736 |
| Considered EV | 41 | 83 | 88 | 24 | 11 | 132 | 141 | 99 | 74 | 67 | 49 | 14 | 1.532 |
| Purchased EV | 47 | 72 | 30 | 4 | 13 | 55 | 42 | 46 | 31 | 83 | 58 | 43 | 1.121 |
| H1: The emergence of COVID-19 is a consequence of the destruction of the environment. | |||||||||||||
| ** | n.s. | * | * | * | * | * | * | n.s. | ** | *** | ** | *** | |
| Considered ICE | 3.9 | 3.7 | 4.4 | 3.9 | 4.4 | 4.8 | 4.4 | 4.0 | 3.6 | 4.5 | 4.0 | 3.8 | 4.1 |
| Purchased ICE | 4.1 | 4.0 | 4.6 | 4.0 | 4.7 | 4.6 | 4.7 | 4.4 | 4.5 | 4.5 | 4.3 | 4.8 | 4.4 |
| Considered EV | 4.4 | 4.1 | 4.8 | 4.3 | 5.1 | 5.0 | 4.9 | 4.5 | 4.4 | 4.8 | 4.9 | 4.3 | 4.6 |
| Purchased EV | 4.7 | 4.0 | 4.9 | 6.5 | 5.4 | 4.9 | 4.7 | 4.6 | 3.9 | 4.9 | 4.9 | 5.6 | 4.7 |
| H2: I see COVID-19 as a danger to me personally. | |||||||||||||
| n.s. | n.s. | n.s. | n.s. | n.s. | n.s. | ** | * | n.s. | n.s. | n.s. | n.s. | *** | |
| Considered ICE | 4.2 | 4.7 | 5.4 | 4.3 | 5.5 | 5.2 | 5.1 | 4.3 | 3.8 | 5.2 | 4.6 | 4.7 | 4.7 |
| Purchased ICE | 4.3 | 4.4 | 5.3 | 4.4 | 5.6 | 4.9 | 5.1 | 3.8 | 4.3 | 5.0 | 4.9 | 5.3 | 4.8 |
| Considered EV | 4.9 | 4.7 | 5.6 | 4.8 | 6.1 | 5.3 | 5.5 | 4.5 | 4.1 | 5.3 | 5.0 | 5.0 | 5.0 |
| Purchased EV | 4.4 | 4.5 | 5.2 | 5.3 | 6.3 | 5.3 | 5.4 | 4.2 | 3.7 | 5.3 | 4.5 | 5.2 | 4.9 |
| H3: The coronavirus pandemic has strengthened my environmental awareness. | |||||||||||||
| n.s. | n.s. | n.s. | ** | n.s. | *** | *** | * | n.s. | ** | * | *** | *** | |
| Considered ICE | 4.2 | 4.0 | 4.9 | 4.1 | 5.6 | 5.3 | 4.6 | 4.3 | 4.2 | 5.1 | 4.5 | 3.9 | 4.6 |
| Purchased ICE | 4.5 | 4.4 | 5.2 | 4.3 | 5.6 | 5.0 | 5.1 | 4.4 | 4.6 | 5.2 | 4.7 | 4.9 | 4.9 |
| Considered EV | 4.5 | 4.5 | 5.1 | 5.0 | 5.7 | 5.7 | 5.5 | 4.6 | 4.1 | 5.3 | 5.0 | 4.9 | 5.0 |
| Purchased EV | 4.7 | 4.5 | 5.4 | 5.8 | 6.4 | 5.7 | 5.6 | 5.0 | 4.9 | 5.7 | 5.1 | 5.7 | 5.4 |
| H4: I see global warming as a danger to me personally. | |||||||||||||
| *** | n.s. | n.s. | n.s. | n.s. | * | ** | *** | n.s. | n.s. | ** | *** | *** | |
| Considered ICE | 4.6 | 4.8 | 5.8 | 4.4 | 5.7 | 5.6 | 5.1 | 4.5 | 4.6 | 5.8 | 4.7 | 4.2 | 5.0 |
| Purchased ICE | 4.6 | 4.6 | 5.9 | 4.6 | 5.8 | 5.5 | 5.3 | 4.6 | 4.8 | 5.6 | 4.9 | 5.0 | 5.1 |
| Considered EV | 5.1 | 5.1 | 5.9 | 5.0 | 6.1 | 5.8 | 5.6 | 5.2 | 5.1 | 5.9 | 5.4 | 5.1 | 5.4 |
| Purchased EV | 5.4 | 4.6 | 5.8 | 5.5 | 6.3 | 5.7 | 5.8 | 5.3 | 4.9 | 5.8 | 5.2 | 5.8 | 5.4 |
| H5: The outbreak of the COVID-19 pandemic has caused me to give greater consideration to the purchase of an electric car. | |||||||||||||
| * | ** | *** | * | *** | *** | *** | * | n.s. | *** | *** | ** | *** | |
| Considered ICE | 3.7 | 3.3 | 3.9 | 3.4 | 4.2 | 4.7 | 4.0 | 3.6 | 3.5 | 4.5 | 3.9 | 3.3 | 3.8 |
| Purchased ICE | 4.2 | 4.0 | 4.4 | 3.3 | 4.9 | 4.6 | 4.5 | 4.1 | 4.1 | 4.7 | 4.3 | 4.5 | 4.3 |
| Considered EV | 4.3 | 4.2 | 4.6 | 3.8 | 6.0 | 5.0 | 5.3 | 4.1 | 3.7 | 5.2 | 4.6 | 4.4 | 4.7 |
| Purchased EV | 4.6 | 4.3 | 5.4 | 5.5 | 6.4 | 5.3 | 5.4 | 4.7 | 4.7 | 5.5 | 5.1 | 5.1 | 5.1 |
| H6: I am considering buying an electric car because of government subsidies and tax benefits. | |||||||||||||
| *** | *** | ** | n.s. | *** | *** | *** | ** | * | *** | *** | *** | *** | |
| Considered ICE | 4.0 | 3.7 | 3.8 | 3.9 | 3.8 | 4.8 | 3.7 | 3.8 | 3.7 | 4.7 | 4.0 | 3.4 | 3.9 |
| Purchased ICE | 3.9 | 4.4 | 4.3 | 4.0 | 4.2 | 4.8 | 4.4 | 4.3 | 4.3 | 4.8 | 4.3 | 4.5 | 4.3 |
| Considered EV | 4.6 | 5.1 | 4.5 | 4.0 | 4.5 | 5.4 | 4.8 | 4.4 | 4.3 | 5.6 | 4.7 | 4.1 | 4.8 |
| Purchased EV | 4.7 | 5.0 | 4.6 | 6.3 | 6.3 | 5.5 | 5.2 | 4.8 | 4.5 | 5.7 | 5.1 | 5.6 | 5.2 |
Note: *** p < 0.001; ** p < 0.01; * p < 0.05; n.s. not significant. Scores were assessed on a 7-point scale ranging from 1 = “strongly disagree” to 7 = “strongly agree”.
Table A3.
Direct, Indirect, and Total Effects per Country.
| Australia | Austria | Belgium | Brazil | Canada | China | |||||||
|---|---|---|---|---|---|---|---|---|---|---|---|---|
| Dependent: COVID-19 has strengthened environmental awareness. | ||||||||||||
| R2 | 0.428 | 0.322 | 0.201 | 0.173 | 0.173 | 0.219 | ||||||
| Intercept | −1.090 | *** | −0.727 | *** | −0.861 | *** | −0.797 | *** | −0.797 | *** | −0.342 | n.s. |
| Direct effect of H2 on H3: People perceive COVID-19 as a danger. | 0.070 | n.s. | 0.207 | *** | −0.013 | n.s. | 0.122 | * | 0.122 | * | 0.028 | n.s. |
| Direct effect of H1 on H3: People attribute the COVID-19 pandemic to environmental degradation. | 0.262 | *** | 0.163 | *** | 0.202 | *** | 0.174 | *** | 0.174 | *** | 0.068 | * |
| Direct effect of H4 on H3: People perceive global warming as a danger. | 0.457 | *** | 0.438 | *** | 0.370 | *** | 0.257 | ** | 0.257 | ** | 0.380 | *** |
| Direct effect of Interaction H2 × H4 on H3 | 0.007 | n.s. | 0.053 | * | 0.000 | n.s. | −0.017 | n.s. | −0.017 | n.s. | 0.007 | n.s. |
| Dependent: People give greater consideration to the purchase of an EV. | ||||||||||||
| R2 | 0.613 | 0.559 | 0.433 | 0.438 | 0.438 | 0.474 | ||||||
| Intercept | 3.376 | *** | 2.295 | *** | 3.596 | *** | 4.640 | *** | 4.640 | *** | 5.111 | *** |
| Direct effect of H2 on H5: People perceive COVID-19 as a danger to themselves. | 0.031 | n.s. | −0.021 | n.s. | 0.024 | n.s. | 0.050 | n.s. | 0.050 | n.s. | 0.059 | n.s. |
| Direct effect of H3 on H5: COVID-19 has strengthened environmental awareness. | 0.352 | *** | 0.349 | *** | 0.432 | *** | 0.527 | *** | 0.527 | *** | 0.312 | *** |
| Direct effect of H1 on H5: People attribute the COVID-19 pandemic to environmental degradation. | 0.130 | ** | 0.243 | *** | 0.065 | n.s. | 0.070 | n.s. | 0.070 | n.s. | 0.085 | * |
| Direct effect of H6 on H5: Governmental incentives increase people’s willingness to purchase an EV. | 0.507 | *** | 0.491 | *** | 0.409 | *** | 0.252 | *** | 0.252 | *** | 0.429 | *** |
| Direct effect of Interaction H3 × H6 on H5 | 0.023 | n.s. | 0.102 | *** | 0.049 | * | 0.096 | * | 0.096 | * | 0.040 | n.s. |
| Indirect effect of H2 on H5 | 0.025 | n.s. | 0.072 | *** | −0.006 | n.s. | 0.064 | * | 0.064 | * | 0.009 | n.s. |
| Indirect effect of H1 on H5 | 0.092 | *** | 0.057 | *** | 0.088 | *** | 0.092 | *** | 0.092 | *** | 0.021 | * |
| Indirect effect of H4 on H5 | 0.161 | *** | 0.153 | *** | 0.160 | *** | 0.136 | ** | 0.136 | ** | 0.119 | *** |
| Indirect effect of Interaction H2 × H4 on H5 | 0.002 | n.s. | 0.018 | * | 0.000 | n.s. | −0.009 | n.s. | −0.009 | n.s. | 0.002 | n.s. |
| Total effect of H2 on H5 | 0.055 | n.s. | 0.051 | n.s. | 0.019 | n.s. | 0.115 | * | 0.115 | * | 0.068 | n.s. |
| Total effect of H2 on H3 | 0.070 | n.s. | 0.207 | *** | −0.013 | n.s. | 0.122 | * | 0.122 | * | 0.028 | n.s. |
| Total effect of H3 on H5 | 0.352 | *** | 0.349 | *** | 0.432 | *** | 0.527 | *** | 0.527 | *** | 0.312 | *** |
| Total effect of H1 on H3 | 0.262 | *** | 0.163 | *** | 0.202 | *** | 0.174 | *** | 0.174 | *** | 0.068 | * |
| Total effect of H1 on H5 | 0.222 | *** | 0.300 | *** | 0.152 | ** | 0.161 | *** | 0.161 | *** | 0.107 | * |
| Total effect of H4 on H3 | 0.457 | *** | 0.438 | *** | 0.370 | *** | 0.257 | ** | 0.257 | ** | 0.380 | *** |
| Total effect of H4 on H5 | 0.161 | *** | 0.153 | *** | 0.160 | *** | 0.136 | ** | 0.136 | ** | 0.119 | *** |
| Total effect of Interaction H2 × H4 on H3 | 0.007 | n.s. | 0.053 | * | 0.000 | n.s. | −0.017 | n.s. | −0.017 | n.s. | 0.007 | n.s. |
| Total effect of Interaction H2 × H4 on H5 | 0.002 | n.s. | 0.018 | * | 0.000 | n.s. | −0.009 | n.s. | −0.009 | n.s. | 0.002 | n.s. |
| Total effect of H6 on H5 | 0.507 | *** | 0.491 | *** | 0.409 | *** | 0.252 | *** | 0.252 | *** | 0.429 | *** |
| Total effect of Interaction H3 × H6 on H5 | 0.023 | n.s. | 0.102 | *** | 0.049 | * | 0.096 | * | 0.096 | * | 0.040 | n.s. |
Note: *** p < 0.001; ** p < 0.01; * p < 0.05; n.s. not significant.
Table A4.
Direct, Indirect, and Total Effects per Country (cont’d).
| Denmark | Finland | France | Germany | India | Italy | |||||||
|---|---|---|---|---|---|---|---|---|---|---|---|---|
| Dependent: COVID-19 has strengthened environmental awareness. | ||||||||||||
| R2 | 0.205 | 0.297 | 0.245 | 0.173 | 0.354 | 0.218 | ||||||
| Intercept | −1.012 | *** | −1.255 | *** | −1.042 | *** | −0.642 | ** | −1.012 | *** | −1.183 | *** |
| Direct effect of H2 on H3: People perceive COVID-19 as a danger. | 0.097 | n.s. | 0.099 | n.s. | 0.230 | *** | 0.108 | n.s. | 0.066 | n.s. | 0.124 | * |
| Direct effect of H1 on H3: People attribute the COVID-19 pandemic to environmental degradation. | 0.259 | *** | 0.305 | *** | 0.227 | *** | 0.171 | *** | 0.202 | *** | 0.231 | *** |
| Direct effect of H4 on H3: People perceive global warming as a danger. | 0.297 | *** | 0.304 | *** | 0.217 | ** | 0.220 | *** | 0.375 | *** | 0.233 | *** |
| Direct effect of Interaction H2 × H4 on H3 | 0.019 | n.s. | 0.010 | n.s. | −0.016 | n.s. | −0.010 | n.s. | −0.029 | n.s. | 0.078 | * |
| Dependent: People give greater consideration to the purchase of an EV. | ||||||||||||
| R2 | 0.543 | 0.525 | 0.540 | 0.470 | 0.498 | 0.506 | ||||||
| Intercept | 3.342 | *** | 3.292 | *** | 3.627 | *** | 3.050 | *** | 4.479 | *** | 4.166 | *** |
| Direct effect of H2 on H5: People perceive COVID-19 as a danger to themselves. | −0.029 | n.s. | −0.060 | n.s. | 0.011 | n.s. | 0.034 | n.s. | 0.033 | n.s. | 0.010 | n.s. |
| Direct effect of H3 on H5: COVID-19 has strengthened environmental awareness. | 0.637 | *** | 0.525 | *** | 0.517 | *** | 0.492 | *** | 0.418 | *** | 0.519 | *** |
| Direct effect of H1 on H5: People attribute the COVID-19 pandemic to environmental degradation. | 0.136 | ** | 0.115 | * | 0.102 | * | 0.141 | *** | 0.201 | *** | 0.101 | * |
| Direct effect of H6 on H5: Governmental incentives increase people’s willingness to purchase an EV. | 0.286 | *** | 0.415 | *** | 0.399 | *** | 0.398 | *** | 0.252 | *** | 0.325 | *** |
| Direct effect of Interaction H3 × H6 on H5 | 0.015 | n.s. | 0.053 | ** | 0.049 | * | 0.059 | ** | −0.006 | n.s. | 0.068 | * |
| Indirect effect of H2 on H5 | 0.062 | * | 0.052 | n.s. | 0.119 | *** | 0.053 | n.s. | 0.028 | n.s. | 0.064 | * |
| Indirect effect of H1 on H5 | 0.165 | *** | 0.160 | *** | 0.118 | *** | 0.084 | *** | 0.084 | *** | 0.120 | *** |
| Indirect effect of H4 on H5 | 0.189 | *** | 0.160 | *** | 0.112 | ** | 0.108 | *** | 0.157 | *** | 0.121 | *** |
| Indirect effect of Interaction H2 × H4 on H5 | 0.012 | n.s. | 0.005 | n.s. | −0.008 | n.s. | −0.005 | n.s. | −0.012 | n.s. | 0.040 | * |
| Total effect of H2 on H5 | 0.033 | n.s. | −0.008 | n.s. | 0.130 | * | 0.087 | n.s. | 0.061 | n.s. | 0.074 | n.s. |
| Total effect of H2 on H3 | 0.097 | n.s. | 0.099 | n.s. | 0.230 | *** | 0.108 | n.s. | 0.066 | n.s. | 0.124 | * |
| Total effect of H3 on H5 | 0.637 | *** | 0.525 | *** | 0.517 | *** | 0.492 | *** | 0.418 | *** | 0.519 | *** |
| Total effect of H1 on H3 | 0.259 | *** | 0.305 | *** | 0.227 | *** | 0.171 | *** | 0.202 | *** | 0.231 | *** |
| Total effect of H1 on H5 | 0.301 | *** | 0.275 | *** | 0.220 | *** | 0.225 | *** | 0.286 | *** | 0.221 | *** |
| Total effect of H4 on H3 | 0.297 | *** | 0.304 | *** | 0.217 | ** | 0.220 | *** | 0.375 | *** | 0.233 | *** |
| Total effect of H4 on H5 | 0.189 | *** | 0.160 | *** | 0.112 | ** | 0.108 | *** | 0.157 | *** | 0.121 | *** |
| Total effect of Interaction H2 × H4 on H3 | 0.019 | n.s. | 0.010 | n.s. | −0.016 | n.s. | −0.010 | n.s. | −0.029 | n.s. | 0.078 | * |
| Total effect of Interaction H2 × H4 on H5 | 0.012 | n.s. | 0.005 | n.s. | −0.008 | n.s. | −0.005 | n.s. | −0.012 | n.s. | 0.040 | * |
| Total effect of H6 on H5 | 0.286 | *** | 0.415 | *** | 0.399 | *** | 0.398 | *** | 0.252 | *** | 0.325 | *** |
| Total effect of Interaction H3 × H6 on H5 | 0.015 | n.s. | 0.053 | ** | 0.049 | * | 0.059 | ** | −0.006 | n.s. | 0.068 | * |
Note: *** p < 0.001; ** p < 0.01; * p < 0.05; n.s. not significant.
Table A5.
Direct, Indirect, and Total Effects per Country (cont’d).
| Japan | The Netherlands | Norway | Portugal | Russia | South Africa | |||||||
|---|---|---|---|---|---|---|---|---|---|---|---|---|
| Dependent: COVID-19 has strengthened environmental awareness. | ||||||||||||
| R2 | 0.395 | 0.312 | 0.353 | 0.078 | 0.266 | 0.163 | ||||||
| Intercept | −2.245 | *** | −0.797 | *** | −1.434 | *** | −0.603 | * | −1.273 | *** | −0.794 | *** |
| Direct effect of H2 on H3: People perceive COVID-19 as a danger. | 0.014 | n.s. | 0.142 | ** | 0.016 | n.s. | 0.040 | n.s. | 0.121 | * | 0.052 | n.s. |
| Direct effect of H1 on H3: People attribute the COVID-19 pandemic to environmental degradation. | 0.577 | *** | 0.195 | *** | 0.362 | *** | 0.139 | * | 0.324 | *** | 0.168 | *** |
| Direct effect of H4 on H3: People perceive global warming as a danger. | 0.283 | *** | 0.359 | *** | 0.366 | *** | 0.259 | ** | 0.204 | ** | 0.270 | *** |
| Direct effect of Interaction H2 × H4 on H3 | 0.016 | n.s. | −0.010 | n.s. | −0.001 | n.s. | −0.049 | n.s. | −0.010 | n.s. | 0.022 | n.s. |
| Dependent: People give greater consideration to the purchase of an EV. | ||||||||||||
| R2 | 0.642 | 0.488 | 0.407 | 0.411 | 0.384 | 0.379 | ||||||
| Intercept | 4.177 | *** | 3.528 | *** | 3.286 | *** | 3.856 | *** | 3.189 | *** | 3.926 | *** |
| Direct effect of H2 on H5: People perceive COVID-19 as a danger to themselves. | 0.055 | n.s. | 0.004 | n.s. | −0.010 | n.s. | −0.046 | n.s. | 0.066 | n.s. | 0.061 | n.s. |
| Direct effect of H3 on H5: COVID-19 has strengthened environmental awareness. | 0.538 | *** | 0.451 | *** | 0.446 | *** | 0.478 | *** | 0.421 | *** | 0.262 | *** |
| Direct effect of H1 on H5: People attribute the COVID-19 pandemic to environmental degradation. | −0.036 | n.s. | 0.131 | ** | 0.148 | ** | 0.098 | n.s. | 0.039 | n.s. | 0.163 | *** |
| Direct effect of H6 on H5: Governmental incentives increase people’s willingness to purchase an EV. | 0.469 | *** | 0.432 | *** | 0.316 | *** | 0.330 | *** | 0.345 | *** | 0.412 | *** |
| Direct effect of Interaction H3 × H6 on H5 | 0.028 | n.s. | 0.028 | n.s. | 0.045 | * | 0.073 | ** | 0.082 | ** | −0.006 | n.s. |
| Indirect effect of H2 on H5 | 0.007 | n.s. | 0.064 | ** | 0.007 | n.s. | 0.019 | n.s. | 0.051 | * | 0.014 | n.s. |
| Indirect effect of H1 on H5 | 0.310 | *** | 0.088 | *** | 0.161 | *** | 0.066 | * | 0.136 | *** | 0.044 | *** |
| Indirect effect of H4 on H5 | 0.152 | *** | 0.162 | *** | 0.163 | *** | 0.124 | *** | 0.086 | ** | 0.071 | *** |
| Indirect effect of Interaction H2 × H4 on H5 | 0.009 | n.s. | −0.005 | n.s. | 0.000 | n.s. | −0.023 | n.s. | −0.004 | n.s. | 0.006 | n.s. |
| Total effect of H2 on H5 | 0.062 | n.s. | 0.068 | n.s. | −0.003 | n.s. | −0.027 | n.s. | 0.117 | * | 0.075 | n.s. |
| Total effect of H2 on H3 | 0.014 | n.s. | 0.142 | ** | 0.016 | n.s. | 0.040 | n.s. | 0.121 | * | 0.052 | n.s. |
| Total effect of H3 on H5 | 0.538 | *** | 0.451 | *** | 0.446 | *** | 0.478 | *** | 0.421 | *** | 0.262 | *** |
| Total effect of H1 on H3 | 0.577 | *** | 0.195 | *** | 0.362 | *** | 0.139 | * | 0.324 | *** | 0.168 | *** |
| Total effect of H1 on H5 | 0.274 | *** | 0.219 | *** | 0.310 | *** | 0.165 | ** | 0.175 | *** | 0.207 | *** |
| Total effect of H4 on H3 | 0.283 | *** | 0.359 | *** | 0.366 | *** | 0.259 | ** | 0.204 | ** | 0.270 | *** |
| Total effect of H4 on H5 | 0.152 | *** | 0.162 | *** | 0.163 | *** | 0.124 | *** | 0.086 | ** | 0.071 | *** |
| Total effect of Interaction H2 × H4 on H3 | 0.016 | n.s. | −0.010 | n.s. | −0.001 | n.s. | −0.049 | n.s. | −0.010 | n.s. | 0.022 | n.s. |
| Total effect of Interaction H2 × H4 on H5 | 0.009 | n.s. | −0.005 | n.s. | 0.000 | n.s. | −0.023 | n.s. | −0.004 | n.s. | 0.006 | n.s. |
| Total effect of H6 on H5 | 0.469 | *** | 0.432 | *** | 0.316 | *** | 0.330 | *** | 0.345 | *** | 0.412 | *** |
| Total effect of Interaction H3 × H6 on H5 | 0.028 | n.s. | 0.028 | n.s. | 0.045 | * | 0.073 | ** | 0.082 | ** | −0.006 | n.s. |
Note: *** p < 0.001; ** p < 0.01; * p < 0.05; n.s. not significant.
Table A6.
Direct, Indirect, and Total Effects per Country (cont’d).
| Korea | Spain | Sweden | Switzerland | Taiwan | UK | USA | Total | ||||||||||||
|---|---|---|---|---|---|---|---|---|---|---|---|---|---|---|---|---|---|---|---|
| Dependent: COVID-19 has strengthened environmental awareness. | |||||||||||||||||||
| R2 | 0.356 | 0.368 | 0.200 | 0.333 | 0.166 | 0.318 | 0.456 | 0.316 | |||||||||||
| Intercept | −2.195 | *** | −0.838 | *** | −1.06 | *** | −0.882 | *** | −1.343 | *** | −1.15 | *** | −1.956 | *** | −1.189 | *** | |||
| Direct effect of H2 on H3: People perceive COVID-19 as a danger. | 0.101 | * | 0.147 | * | 0.070 | n.s. | 0.206 | *** | 0.077 | n.s. | 0.052 | n.s. | 0.114 | n.s. | 0.118 | *** | |||
| Direct effect of H1 on H3: People attribute the COVID-19 pandemic to environmental degradation. | 0.447 | *** | 0.182 | *** | 0.237 | *** | 0.192 | *** | 0.284 | *** | 0.254 | *** | 0.416 | *** | 0.267 | *** | |||
| Direct effect of H4 on H3: People perceive global warming as a danger. | 0.207 | *** | 0.457 | *** | 0.305 | *** | 0.468 | *** | 0.157 | * | 0.364 | *** | 0.309 | *** | 0.357 | *** | |||
| Direct effect of Interaction H2 × H4 on H3 | 0.048 | n.s. | −0.017 | n.s. | 0.049 | n.s. | 0.089 | *** | 0.034 | n.s. | 0.026 | n.s. | 0.020 | n.s. | 0.016 | ** | |||
| Dependent: People give greater consideration to the purchase of an EV. | |||||||||||||||||||
| R2 | 0.388 | 0.483 | 0.469 | 0.484 | 0.549 | 0.542 | 0.687 | 0.533 | |||||||||||
| Intercept | 3.326 | *** | 4.315 | *** | 3.388 | *** | 3.626 | *** | 4.216 | *** | 3.691 | *** | 3.177 | *** | 3.676 | *** | |||
| Direct effect of H2 on H5: People perceive COVID-19 as a danger to themselves. | −0.077 | n.s. | −0.028 | n.s. | 0.016 | n.s. | 0.054 | n.s. | −0.045 | n.s. | 0.032 | n.s. | −0.016 | n.s. | 0.020 | * | |||
| Direct effect of H3 on H5: COVID-19 has strengthened environmental awareness. | 0.454 | *** | 0.467 | *** | 0.540 | *** | 0.379 | *** | 0.360 | *** | 0.280 | *** | 0.410 | *** | 0.462 | *** | |||
| Direct effect of H1 on H5: People attribute the COVID-19 pandemic to environmental degradation. | 0.312 | *** | 0.091 | * | 0.149 | ** | 0.050 | n.s. | 0.146 | ** | 0.150 | *** | 0.216 | *** | 0.132 | *** | |||
| Direct effect of H6 on H5: Governmental incentives increase people’s willingness to purchase an EV. | 0.079 | n.s. | 0.371 | *** | 0.307 | *** | 0.426 | *** | 0.436 | *** | 0.516 | *** | 0.436 | *** | 0.383 | *** | |||
| Direct effect of Interaction H3 × H6 on H5 | 0.032 | n.s. | 0.003 | n.s. | 0.025 | n.s. | 0.017 | n.s. | 0.031 | n.s. | −0.022 | n.s. | 0.022 | n.s. | 0.036 | *** | |||
| Indirect effect of H2 on H5 | 0.046 | * | 0.069 | * | 0.038 | n.s. | 0.078 | *** | 0.028 | n.s. | 0.015 | n.s. | 0.047 | n.s. | 0.054 | *** | |||
| Indirect effect of H1 on H5 | 0.203 | *** | 0.085 | *** | 0.128 | *** | 0.073 | *** | 0.102 | *** | 0.071 | *** | 0.171 | *** | 0.123 | *** | |||
| Indirect effect of H4 on H5 | 0.094 | *** | 0.213 | *** | 0.165 | *** | 0.177 | *** | 0.057 | * | 0.102 | *** | 0.127 | *** | 0.165 | *** | |||
| Indirect effect of Interaction H2 × H4 on H5 | 0.022 | n.s. | −0.008 | n.s. | 0.027 | n.s. | 0.034 | *** | 0.012 | n.s. | 0.007 | n.s. | 0.008 | n.s. | 0.007 | ** | |||
| Total effect of H2 on H5 | −0.031 | n.s. | 0.041 | n.s. | 0.054 | n.s. | 0.133 | ** | −0.018 | n.s. | 0.046 | n.s. | 0.031 | n.s. | 0.074 | *** | |||
| Total effect of H2 on H3 | 0.101 | * | 0.147 | * | 0.070 | n.s. | 0.206 | *** | 0.077 | n.s. | 0.052 | n.s. | 0.114 | n.s. | 0.118 | *** | |||
| Total effect of H3 on H5 | 0.454 | *** | 0.467 | *** | 0.540 | *** | 0.379 | *** | 0.360 | *** | 0.280 | *** | 0.410 | *** | 0.462 | *** | |||
| Total effect of H1 on H3 | 0.447 | *** | 0.182 | *** | 0.237 | *** | 0.192 | *** | 0.284 | *** | 0.254 | *** | 0.416 | *** | 0.267 | *** | |||
| Total effect of H1 on H5 | 0.514 | *** | 0.176 | *** | 0.277 | *** | 0.123 | ** | 0.248 | *** | 0.221 | *** | 0.386 | *** | 0.255 | *** | |||
| Total effect of H4 on H3 | 0.207 | *** | 0.457 | *** | 0.305 | *** | 0.468 | *** | 0.157 | * | 0.364 | *** | 0.309 | *** | 0.357 | *** | |||
| Total effect of H4 on H5 | 0.094 | *** | 0.213 | *** | 0.165 | *** | 0.177 | *** | 0.057 | * | 0.102 | *** | 0.127 | *** | 0.165 | *** | |||
| Total effect of Interaction H2 × H4 on H3 | 0.048 | n.s. | −0.017 | n.s. | 0.049 | n.s. | 0.089 | *** | 0.034 | n.s. | 0.026 | n.s. | 0.020 | n.s. | 0.016 | ** | |||
| Total effect of Interaction H2 × H4 on H5 | 0.022 | n.s. | −0.008 | n.s. | 0.027 | n.s. | 0.034 | *** | 0.012 | n.s. | 0.007 | n.s. | 0.008 | n.s. | 0.007 | ** | |||
| Total effect of H6 on H5 | 0.079 | n.s. | 0.371 | *** | 0.307 | *** | 0.426 | *** | 0.436 | *** | 0.516 | *** | 0.436 | *** | 0.383 | *** | |||
| Total effect of Interaction H3 × H6 on H5 | 0.032 | n.s. | 0.003 | n.s. | 0.025 | n.s. | 0.017 | n.s. | 0.031 | n.s. | −0.022 | n.s. | 0.022 | n.s. | 0.036 | *** | |||
Note: *** p < 0.001; ** p < 0.01; * p < 0.05; n.s. not significant.
References
- Cecchetti, S.G. Crisis and responses: The Federal reserve in the early stages of the financial crisis. J. Econ. Perspect. 2009, 23, 51–75. [Google Scholar] [CrossRef] [Green Version]
- Anand, A.; Irvine, P.; Puckett, A.; Venkataraman, K. Institutional trading and stock resiliency: Evidence from the 2007–2009 financial crisis. J. Financ. Econ. 2013, 108, 773–797. [Google Scholar] [CrossRef]
- Dai, S.; Duan, X.; Zhang, W. Knowledge map of environmental crisis management based on keywords network and co-word analysis, 2005–2018. J. Clean. Prod. 2020, 262, 121168. [Google Scholar] [CrossRef]
- Fatai Adedoyin, F.; Agboola, P.O.; Ozturk, I.; Bekun, F.V.; Agboola, M.O. Environmental consequences of economic complexities in the EU amidst a booming tourism industry: Accounting for the role of brexit and other crisis events. J. Clean. Prod. 2021, 305, 127117. [Google Scholar] [CrossRef]
- Lorenzoni, I.; Pidgeon, N.F. Public views on climate change: European and USA perspectives. Clim. Chang. 2006, 77, 73–95. [Google Scholar] [CrossRef]
- Perkins, K.M.; Munguia, N.; Ellenbecker, M.; Moure-Eraso, R.; Velazquez, L. COVID-19 pandemic lessons to facilitate future engagement in the global climate crisis. J. Clean. Prod. 2021, 290, 125178. [Google Scholar] [CrossRef] [PubMed]
- Bouman, T.; Steg, L.; Dietz, T. Insights from early COVID-19 responses about promoting sustainable action. Nat. Sustain. 2020, 4, 194–200. [Google Scholar] [CrossRef]
- Stewart, D.W. Uncertainty and Risk Are Multidimensional: Lessons from the COVID-19 Pandemic. J. Public Policy Mark. 2021, 40, 97–98. [Google Scholar] [CrossRef]
- Helm, D. The Environmental Impacts of the Coronavirus. Environ. Resour. Econ. 2020, 76, 21–38. [Google Scholar] [CrossRef] [PubMed]
- Manzanedo, R.D.; Manning, P. COVID-19: Lessons for the climate change emergency. Sci. Total Environ. 2020, 742, 140563. [Google Scholar] [CrossRef]
- Forster, P.M.; Forster, H.I.; Evans, M.J.; Gidden, M.J.; Jones, C.D.; Keller, C.A.; Lamboll, R.D.; Quéré, C.L.; Rogelj, J.; Rosen, D.; et al. Current and future global climate impacts resulting from COVID-19. Nat. Clim. Chang. 2020, 10, 913–919. [Google Scholar] [CrossRef]
- Johnson, C.K.; Hitchens, P.L.; Pandit, P.S.; Rushmore, J.; Evans, T.S.; Young, C.C.W.; Doyle, M.M.; Johnson, C.K. Global shifts in mammalian population trends reveal key predictors of virus spillover risk. Proc. R. Soc. B 2020, 287. [Google Scholar] [CrossRef] [PubMed] [Green Version]
- Jones, K.E.; Patel, N.G.; Levy, M.A.; Storeygard, A.; Balk, D.; Gittleman, J.L.; Daszak, P. Global trends in emerging infectious diseases. Nature 2008, 451, 990–993. [Google Scholar] [CrossRef] [PubMed]
- Qiu, J. One world, one health: Combating infectious diseases in the age of globalization. Natl. Sci. Rev. 2017, 4, 493–499. [Google Scholar] [CrossRef] [PubMed] [Green Version]
- Wu, B.P.; Chang, L. The social impact of pathogen threat: How disease salience influences conformity. Pers. Individ. Dif. 2012, 53, 50–54. [Google Scholar] [CrossRef]
- Murray, D.R.; Schaller, M. Threat(s) and conformity deconstructed: Perceived threat of infectious disease and its implications for conformist attitudes and behavior. Eur. J. Soc. Psychol. 2012, 42, 180–188. [Google Scholar] [CrossRef]
- Vess, M.; Arndt, J. The nature of death and the death of nature: The impact of mortality salience on environmental concern. J. Res. Pers. 2008, 42, 1376–1380. [Google Scholar] [CrossRef]
- Guo, J.; Zhang, X.; Gu, F.; Zhang, H.; Fan, Y. Does air pollution stimulate electric vehicle sales? Empirical evidence from twenty major cities in China. J. Clean. Prod. 2020, 249, 119372. [Google Scholar] [CrossRef]
- Will, S.; Luger-Bazinger, C.; Schmitt, M.; Zankl, C. Towards the future of sustainable mobility: Results from a European survey on (electric) powered-two wheelers. Sustainability 2021, 13, 7151. [Google Scholar] [CrossRef]
- Leckie, C.; Rayne, D.; Johnson, L.W. Promoting customer engagement behavior for green brands. Sustainability 2021, 13, 8404. [Google Scholar] [CrossRef]
- Ajanovic, A.; Haas, R. Electric vehicles: Solution or new problem? Environ. Dev. Sustain. 2018, 20, 7–22. [Google Scholar] [CrossRef]
- Li, Z.; Khajepour, A.; Song, J. A comprehensive review of the key technologies for pure electric vehicles. Energy 2019, 182, 824–839. [Google Scholar] [CrossRef]
- Requia, W.J.; Mohamed, M.; Higgins, C.D.; Arain, A.; Ferguson, M. How clean are electric vehicles? Evidence-based review of the effects of electric mobility on air pollutants, greenhouse gas emissions and human health. Atmos. Environ. 2018, 185, 64–77. [Google Scholar] [CrossRef]
- Barbarossa, C.; Pelsmacker, P.D.; Moons, I. Personal Values, Green Self-identity and Electric Car Adoption. Ecol. Econ. 2017, 140, 190–200. [Google Scholar] [CrossRef]
- Lieven, T. Policy measures to promote electric mobility—A global perspective. Transp. Res. Part A Policy Pract. 2015, 82, 78–93. [Google Scholar] [CrossRef] [Green Version]
- Rietmann, N.; Lieven, T. How policy measures succeeded to promote electric mobility—Worldwide review and outlook. J. Clean. Prod. 2019, 206, 66–75. [Google Scholar] [CrossRef]
- MarkLines Vehicle Sales Data. Available online: www.marklines.com (accessed on 3 December 2021).
- EV-Volumes EV Sales Worldwide. Available online: www.ev-volumes.com (accessed on 3 December 2021).
- CSSEGIS Time Series COVID-19 Confirmed Cases Globally. Available online: https://github.com/CSSEGISandData/COVID-19/blob/master/csse_covid_19_data/csse_covid_19_time_series/time_series_covid19_confirmed_global.csv (accessed on 3 December 2021).
- Population by Country No Title. Available online: https://www.worldometers.info/world-population/population-by-country/ (accessed on 3 December 2021).
- Rietmann, N.; Hügler, B.; Lieven, T. Forecasting the trajectory of electric vehicle sales and the consequences for worldwide CO2 emissions. J. Clean. Prod. 2020, 261, 1–16. [Google Scholar] [CrossRef]
- Soat, R. Chinese EV Subsidy Elimination Could Mean Trouble for Some EV Companies. Available online: https://www.forbes.com/sites/pikeresearch/2019/10/17/chinese-ev-subsidy-elimination-could-mean-trouble-for-some-ev-companies/?sh=127466123005 (accessed on 3 December 2021).
- Chakraborty, I.; Maity, P. COVID-19 outbreak: Migration, effects on society, global environment and prevention. Sci. Total Environ. 2020, 728, 138882. [Google Scholar] [CrossRef] [PubMed]
- Keck, F.; Lynteris, C. Zoonosis. Med. Anthropol. Theory 2018, 5, 1–14. [Google Scholar] [CrossRef]
- Brancalion, P.H.S.; Broadbent, E.N.; de-Miguel, S.; Cardil, A.; Rosa, M.R.; Almeida, C.T.; Almeida, D.R.A.; Chakravarty, S.; Zhou, M.; Gamarra, J.G.P.; et al. Emerging threats linking tropical deforestation and the COVID-19 pandemic. Perspect. Ecol. Conserv. 2020, 18, 243–246. [Google Scholar] [CrossRef]
- Luisetto, M.; Almukthar, N.; Edbey, K.; Fiazza, C.; Rafa, A.Y.; Rasool, G.; Yurevich, L.O. Deforestation, Air Pollution and Brazilian COVID-19 Variant. J. Clin. Immunol. Microbiol. 2021, 2, 1–19. [Google Scholar]
- Tollefson, J. Why deforestation and extinctions make pandemics more likely. Nature 2020, 584, 175–176. [Google Scholar] [CrossRef] [PubMed]
- Wolfe, N.; Daszak, P.; Kilpatrick, M.; Burke, D. Bushmeat Hunting, Deforestation, and Prediction of Zoonotic Disease Emergence. Perspect. Ecol. Conserv. 2005, 11, 1822–1872. [Google Scholar]
- Mamun, M.A.; Griffiths, M.D. First COVID-19 suicide case in Bangladesh due to fear of COVID-19 and xenophobia: Possible suicide prevention strategies. Asian J. Psychiatr. 2020, 51, 102073. [Google Scholar] [CrossRef]
- Hughes, L. Biological consequences of global warming: Is the signal already apparent? Trends Ecol. Evol. 2000, 15, 56–61. [Google Scholar] [CrossRef]
- Walther, G.; Post, E.; Convey, P.; Menzel, A.; Parmesank, C.; Beebee, T.J.C.; Fromentin, J.-M.; Hoegh-Guldberg, O.; Bairlein, F. Ecological responses to recent climate change. Nature 2002, 416, 385–395. [Google Scholar] [CrossRef] [PubMed]
- Feldman, L.; Hart, P.S. Using Political Efficacy Messages to Increase Climate Activism: The Mediating Role of Emotions. Sci. Commun. 2016, 38, 1–29. [Google Scholar] [CrossRef]
- Yang, D.; Lu, Y.; Zhu, W.; Su, C. Going green: How different advertising appeals impact green consumption behavior. J. Bus. Res. 2015, 68, 2663–2675. [Google Scholar] [CrossRef]
- WMA Declaration of Helsinki—Ethical Principles for Medical Research Involving Human Subjects. Available online: https://www.wma.net/policies-post/wma-declaration-of-helsinki-ethical-principles-for-medical-research-involving-human-subjects/ (accessed on 3 December 2021).
- Arbuckle, J.L. AMOS 27; IBM SPSS: Chicago, IL, USA, 2014. [Google Scholar]
- Hayes, A.F. Introduction to Mediation, Moderation, and Conditional Process Analysis, 2nd ed.; The Guilford Press: New York, NY, USA; London, UK, 2017. [Google Scholar]
- Baguley, T. Standardized or simple effect size: What should be reported? Br. J. Psychol. 2009, 100, 603–617. [Google Scholar] [CrossRef] [PubMed]
- Cohen, J. A Power Primer. Psychol. Bull. 1992, 112, 155–159. [Google Scholar] [CrossRef] [PubMed]
- Cohen, J. Statistical Power Analysis for the Behavioral Sciences, 2nd ed.; Lawrence Erlbaum Associates: Hillsdale, NJ, USA, 1988. [Google Scholar]
- Lashari, Z.A.; Ko, J.; Jang, J. Consumers’ intention to purchase electric vehicles: Influences of user attitude and perception. Sustainability 2021, 13, 6778. [Google Scholar] [CrossRef]
Figure 1.
Sales forecasts and actual sales for all vehicles versus only EVs 2019-2020 (in million cars).
Figure 1.
Sales forecasts and actual sales for all vehicles versus only EVs 2019-2020 (in million cars).

Figure 2.
Conceptional double-moderated and double-mediated model.

Figure 3.
Distributions for H1 to H6.

Figure 4.
Direct effects and coefficients of determination R2 worldwide. (Note: Unstandardized coefficients. The intercepts are reported in Table 2.). *** p < 0.001; * p < 0.05.
Figure 4.
Direct effects and coefficients of determination R2 worldwide. (Note: Unstandardized coefficients. The intercepts are reported in Table 2.). *** p < 0.001; * p < 0.05.

Figure 5.
The moderating effect of governmental incentives on strengthened environmental awareness.

Table 1.
Vehicle sales, February-December 2019/2020.
| 1 | 2 | 3 | 4 | 5 | 6 | 7 | 8 | |
|---|---|---|---|---|---|---|---|---|
| Country | Total Vehicle Sales a | Difference | EV Sales b | Difference | EV Market | Incidence per 100,000 c | ||
| 2–12 2019 | 2–12 2020 | 2020–2019 | 2–12 2019 | 2–12 2020 | 2020–2019 | Share 2020 | ||
| Australia | 735,273 | 620,939 | −15.5% | 8853 | 5970 | −32.6% | 1.0% | 111 |
| Austria | 304,028 | 226,081 | −25.6% | 11,784 | 23,153 | 96.5% | 10.2% | 4097 |
| Belgium | 499,029 | 379,651 | −23.9% | 17,031 | 45,350 | 166.3% | 11.9% | 5578 |
| Brazil | 2,468,462 | 1,766,882 | −28.4% | 1426 | 1851 | 29.8% | 0.1% | 3611 |
| Canada | 1,811,719 | 1,428,527 | −21.2% | 48,640 | 43,814 | −9.9% | 3.1% | 1548 |
| China | 19,411,783 | 18,529,276 | −4.5% | 1,090,920 | 1,280,376 | 17.4% | 6.9% | 6 |
| Denmark | 204,282 | 179,407 | −12.2% | 8903 | 31,798 | 257.2% | 17.7% | 2833 |
| Finland | 102,495 | 85,617 | −16.5% | 7318 | 16,070 | 119.6% | 18.8% | 652 |
| France | 2,059,348 | 1,515,886 | −26.4% | 64,651 | 179,038 | 176.9% | 11.8% | 4102 |
| Germany | 3,341,556 | 2,671,378 | −20.1% | 105,711 | 383,791 | 263.1% | 14.4% | 2101 |
| India | 2,681,923 | 2,169,900 | −19.1% | 791 | 4080 | 415.8% | 0.2% | 745 |
| Italy | 1,751,456 | 1,225,940 | −30.0% | 17,431 | 57,671 | 230.9% | 4.7% | 3485 |
| Japan | 3,958,614 | 3,508,786 | −11.4% | 39,407 | 29,693 | −24.7% | 0.8% | 186 |
| The Netherlands | 402,938 | 313,693 | −22.1% | 64,631 | 87,542 | 35.4% | 27.9% | 4718 |
| Norway | 133,377 | 131,844 | −1.1% | 76,580 | 101,909 | 33.1% | 77.3% | 914 |
| Portugal | 208,107 | 130,996 | −37.1% | 11,973 | 18,354 | 53.3% | 14.0% | 4057 |
| Russia | 1,656,468 | 1,492,853 | −9.9% | 1188 | 1431 | 20.5% | 0.1% | 2161 |
| South Africa | 493,070 | 339,881 | −31.1% | 274 | 135 | −50.7% | 0.0% | 1782 |
| Korea | 1,199,772 | 1,293,556 | 7.8% | 38,314 | 57,065 | 48.9% | 4.4% | 120 |
| Spain | 1,164,824 | 764,775 | −34.3% | 18,208 | 40,363 | 121.7% | 5.3% | 4124 |
| Sweden | 335,558 | 274,866 | −18.1% | 38,652 | 90,362 | 133.8% | 32.9% | 4384 |
| Switzerland | 290,535 | 218,040 | −25.0% | 17,173 | 32,953 | 91.9% | 15.1% | 5226 |
| Taiwan | 241,881 | 244,321 | 1.0% | 1565 | 6453 | 312.3% | 2.6% | 3 |
| UK | 2,150,127 | 1,481,812 | −31.1% | 74,098 | 171,258 | 131.1% | 11.6% | 3677 |
| USA | 15,915,945 | 13,396,462 | −15.8% | 300,969 | 314,144 | 4.4% | 2.3% | 6035 |
| Total | 63,522,570 | 54,391,369 | −14.4% | 2,066,491 | 3,024,624 | 46.4% | 5.6% | 1356 |
Table 2.
Direct, indirect, and total effects (worldwide).
| Model 1: Only COVID-19 Danger as Predictor H2 → H5 | Model 2: + Environ-Mental Awareness as Mediator H2 → H3 → H5 | Model 3: + COVID-19 Caused by Degradation H2, H1 → H3 → H5 | Model 4: + First Moderator (Global Warming) H2, H1, H4 → H3 → H5 | Model 5: + Second Moderator (Monetary Incentives) H2, H1 → H3, H6 → H5 | Model 6: Double-Moderated Mediation Model H2, H1, H4 → H3, H6 → H5 | |||
|---|---|---|---|---|---|---|---|---|
| Dependent: COVID-19 has strengthened environmental awareness. | ||||||||
| R2 = 0.115 | R2 = 0.237 | R2 = 0.316 | R2 = 0.237 | R2 = 0.316 | ||||
| Intercept | 3.299 *** | 2.164 *** | 3.664 *** | −2.689 *** | −1.189 *** | |||
| Direct effect of H2 on H3: People perceive COVID-19 as a danger. | 0.325 *** | 0.231 *** | 0.118 *** | 0.231 *** | 0.118 *** | |||
| Direct effect of H1 on H3: People attribute the COVID-19 pandemic to environmental degradation. | 0.361 *** | 0.267 *** | 0.361 *** | 0.267 *** | ||||
| Direct effect of H4 on H3: People perceive global warming as a danger. | 0.357 *** | 0.357 *** | ||||||
| Direct effect of Interaction H2 × H4 on H3 | 0.016 *** | 0.016 *** | ||||||
| Dependent: People give greater consideration to the purchase of an EV. | ||||||||
| R2 = 0.075 | R2 = 0.406 | R2 = 0.428 | R2 = 0.428 | R2 = 0.533 | R2 = 0.533 | |||
| Intercept | 2.934 *** | 0.737 *** | 0.396 *** | 0.608 *** | 3.582 *** | 3.676 *** | ||
| Direct effect of H2 on H5: People perceive COVID-19 as a danger to themselves. | 0.285 *** | 0.069 *** | 0.044 *** | 0.044 *** | 0.020 * | 0.020 * | ||
| Direct effect of H3 on H5: COVID-19 has strengthened environmental awareness. | 0.666 *** | 0.597 *** | 0.597 *** | 0.462 *** | 0.462 *** | |||
| Direct effect of H1 on H5: People attribute the COVID-19 pandemic to environmental degradation. | 0.181 *** | 0.181 *** | 0.132 *** | 0.132 *** | ||||
| Direct effect of H6 on H5: Governmental incentives increase people’s willingness to purchase an EV. | 0.383 *** | 0.383 *** | ||||||
| Direct effect of Interaction H3 × H6 on H5 | 0.036 *** | 0.036 *** | ||||||
| Indirect effect of H2 on H5 | 0.216 *** | 0.138 *** | 0.070 *** | 0.106 *** | 0.054 *** | |||
| Indirect effect of H1 on H5 | 0.215 *** | 0.159 *** | 0.167 *** | 0.123 *** | ||||
| Indirect effect of H4 on H5 | 0.213 *** | 0.165 *** | ||||||
| Indirect effect of Interaction H2 × H4 on H5 | 0.009 ** | 0.007 ** | ||||||
| Total effect of H2 on H5 | 0.285 *** | 0.285 *** | 0.182 *** | 0.114 *** | 0.126 *** | 0.074 *** | ||
| Total effect of H2 on H3 | 0.325 *** | 0.231 *** | 0.118 *** | 0.231 *** | 0.118 *** | |||
| Total effect of H3 on H5 | 0.666 *** | 0.597 *** | 0.597 *** | 0.462 *** | 0.462 *** | |||
| Total effect of H1 on H3 | 0.361 *** | 0.267 *** | 0.361 *** | 0.267 *** | ||||
| Total effect of H1 on H5 | 0.396 *** | 0.340 *** | 0.299 *** | 0.255 *** | ||||
| Total effect of H4 on H3 | 0.357 *** | 0.357 *** | ||||||
| Total effect of H4 on H5 | 0.213 *** | 0.165 *** | ||||||
| Total effect of Interaction H2 × H4 on H3 | 0.016 *** | 0.016 ** | ||||||
| Total effect of Interaction H2 × H4 on H5 | 0.009 ** | 0.007 ** | ||||||
| Total effect of H6 on H5 | 0.383 *** | 0.383 *** | ||||||
| Total effect of Interaction H3 × H6 on H5 | 0.036 *** | 0.036 *** | ||||||
Note: *** p < 0.001, ** p < 0.01, * p < 0.05.
Publisher’s Note: MDPI stays neutral with regard to jurisdictional claims in published maps and institutional affiliations. |
© 2021 by the authors. Licensee MDPI, Basel, Switzerland. This article is an open access article distributed under the terms and conditions of the Creative Commons Attribution (CC BY) license (https://creativecommons.org/licenses/by/4.0/).
Share and Cite
MDPI and ACS Style
Lieven, T.; Hügler, B. Did Electric Vehicle Sales Skyrocket Due to Increased Environmental Awareness While Total Vehicle Sales Declined during COVID-19? Sustainability 2021, 13, 13839. https://doi.org/10.3390/su132413839
AMA Style
Lieven T, Hügler B. Did Electric Vehicle Sales Skyrocket Due to Increased Environmental Awareness While Total Vehicle Sales Declined during COVID-19? Sustainability. 2021; 13(24):13839. https://doi.org/10.3390/su132413839
Chicago/Turabian StyleLieven, Theo, and Beatrice Hügler. 2021. "Did Electric Vehicle Sales Skyrocket Due to Increased Environmental Awareness While Total Vehicle Sales Declined during COVID-19?" Sustainability 13, no. 24: 13839. https://doi.org/10.3390/su132413839
Note that from the first issue of 2016, this journal uses article numbers instead of page numbers. See further details here.