Article

Telemedicine Acceptance during the COVID-19 Pandemic: An Empirical Example of Robust Consistent Partial Least Squares Path Modeling

by
Patricio Ramírez-Correa
1,*,
Catalina Ramírez-Rivas
1,
Jorge Alfaro-Pérez
1 and
Ari Melo-Mariano
2
1
School of Engineering, Universidad Católica del Norte, Coquimbo 1781421, Chile
2
Department of Production Engineering, Universidade de Brasília, Campus Darcy Ribeiro Asa Norte, Brasília 04457, Brazil
*
Author to whom correspondence should be addressed.
Symmetry 2020, 12(10), 1593; https://doi.org/10.3390/sym12101593
Submission received: 25 August 2020 / Revised: 16 September 2020 / Accepted: 19 September 2020 / Published: 25 September 2020
(This article belongs to the Special Issue Recent Advances in Social Data and Artificial Intelligence 2019)

Abstract

:
The explanation of behaviors concerning telemedicine acceptance is an evolving area of study. This topic is currently more critical than ever, given that the COVID-19 pandemic is making resources scarcer within the health industry. The objective of this study is to determine which model, the Theory of Planned Behavior or the Technology Acceptance Model, provides greater explanatory power for the adoption of telemedicine addressing outlier-associated bias. We carried out an online survey of patients. The data obtained through the survey were analyzed using both consistent partial least squares path modeling (PLSc) and robust PLSc. The latter used a robust estimator designed for elliptically symmetric unimodal distribution. Both estimation techniques led to similar results, without inconsistencies in interpretation. In short, the results indicate that the Theory of Planned Behavior Model provides a significant explanatory power. Furthermore, the findings show that attitude has the most substantial direct effect on behavioral intention to use telemedicine systems.

1. Introduction

Partial least squares path modeling (PLS) has been widely used to analyze data associated with complex phenomena [1]. The characteristics of PLS have managed to be seen by some social sciences researchers as a fundamental tool to try to explain causal relationships among concepts of the real world [2]. Many enhancements have been incorporated into PLS throughout the years. Among them, it is worth mentioning the following, multigroup analysis [3], identifying and treating unobserved heterogeneity [4], measures of model fit [5], predictive power assessment [6], and consistent PLS (PLSc) [7]. Despite the several enrichments of PLS [8], handling outliers in the context of PLS has been broadly ignored [9]. Johnson and Wichern [10] referred to an outlier as an observation in a dataset that appeared to be inconsistent with the rest of that dataset.
Commonly, two types of outliers are observed. Some outliers arise following no pattern, i.e., unsystematic outliers. Other outliers arise systematically, being part of a population different from the rest of the observations [11]. Considering that outliers are often found in empirical social sciences research, ignoring outliers is extraordinarily likely to lead to inaccurate results and debatable conclusions. Considering the above, robust PLS has recently been proposed to address this problem [9]. A highly robust estimator designed for elliptically symmetric unimodal distributions is central to this proposal. This option is considered to be a better approach for only identifying and manually removing outliers, which has two drawbacks. First, outliers may not be easily identified by visualization or statistical methods. Second, even if this is possible, removing outliers would imply information lost and the sample size decreasing [9]. On the basis of the robust PLS proposal, this study is aimed at evaluating a social phenomenon where the analysis should be as free as possible from outlier-related bias. This research addresses a current social phenomenon, telemedicine acceptance during the COVID-19 pandemic, comparing the two known models, the Theory of Planned Behavior (TPB) and the Technology Acceptance Model (TAM). Therefore, in the following paragraphs, we develop both the telemedicine and technology acceptance concepts.
First, telemedicine refers to healthcare services provided by healthcare providers in a patient-centered manner, from a geographical distance, and using digital technologies [12]. Over the last decade, a technology shift has created a rise in the accessibility to technology and mobile services, including mobile health services [13]. However, although telemedicine technology has been in use for over five decades, it has still not moved past a pilot stage, with traditional in-person service preferred [14]. Global statistics back up this claim, as only ten percent of people have ever used telemedicine. Within this group of people, their approval level is positive, with two out of three individuals stating they would use the service again [15]. The usage of telemedicine is not the same across the globe. There is higher usage in developing countries within Asia and the Middle East (31% in Saudi Arabia, 27% in India, 24% in China, and 15% in Malaysia). However, in Europe, telemedicine is less common (2–4% in Belgium, Serbia, Russia, France, Spain, and Hungary) [15]. The current global COVID-19 crisis adds a new layer to the literature surrounding telemedicine and its usage. The onset of the virus has highlighted the ability of health providers to manage patient visits triaged to telemedicine services. It has also shown the importance of connectivity and how quickly the logistics behind these services could be put into place [16]. Telemedicine allows patients with mild conditions to obtain the attention that they need while minimizing their exposure to other patients with more severe conditions [17]. The ability to support healthcare workers during this time is a significant focus, as they are battling with pressure from the virus, which not only presents itself as a high rate of occupied resources but also a high rate of resources being removed due to exposure [18]. Concern regarding this quick spread of telemedicine is related to how long the measures in place will last past the pandemic. While the pre-pandemic adoption was not high, the telemedicine model greatly benefits both the patient and the provider from a business standpoint (e.g., [19]). Providers with better telemedicine services aim to gain a better competitive advantage, from which patients can significantly benefit [20]. This competitive advantage is more critical than ever at a time when governments are struggling to minimize both the death toll and the virus’ economic impact [21].
Second, multiple authors have explored telemedicine acceptance using models rooted in technology acceptance theories or behavioral theories [14]. In general, these studies indicate that technology acceptance models perform better than behavioral models when it comes to telemedicine acceptance [14,22,23]. The TPB and the TAM are the two most popular models to explain the use of systems [24,25,26] and, in particular, within the adoption of telemedicine systems, their utilization has been highlighted separately [27,28,29,30,31] or in a complementary way [32]. Previous ideas led us to choose TPB and TAM in the present study as a research framework. The TPB originated from the Theory of Reasoned Action (TRA) [33]. The TRA proposed that attitude toward behavior and subjective norms surrounding that behavior directly affects the individual’s behavioral intention. Attitude relates to how individuals perceive behavior. If the behavior is perceived as beneficial to themselves, they are more likely to partake in the behavior. Social norms are the way that individuals perceive others’ beliefs regarding their behavior. If individuals see the behavior as viewed to be beneficial by those around them, then, they are more likely to partake in the behavior. Lastly, behavioral intention is how likely they are to participate in the observed behavior. The TPB adds a new concept to the TRA, i.e., perceived behavioral control [25]. Perceived behavioral control is the individual’s perceived ability to perform the observed behavior. It considers if the individual believes that participating in this behavior is within their capabilities. If they believe that the behavior is within their reach, then they are likely to have a higher intention to take part in the behavior. Similar to the TPB, the TAM proposed by Fred Davis [25] also had its roots in the TRA. The TAM looks at how users accept a technology through the same measure as the TRA and the TPB, i.e., behavioral intention. However, the TAM proposes different variables in order to predict behavioral intention. In the TAM, attitude, perceived use, and perceived ease-of-use are used to measure the individual’s behavioral intention to use technology. Perceived use relates to how individuals perceive that the technology will be useful to them; perceived ease-of-use is how much effort the individual perceives that the technology requires to use it [25]. The TPB and the TAM both assume that once an individual develops an intention to partake in a behavior or use technology, they can carry out this behavior. This intention is the most significant predictor of this occurrence [25]. Since models are abstractions of a phenomenon within a context, their explanatory capabilities must be systematically tested to determine their usefulness in new settings. Therefore, comparing which model best explains telemedicine adoption in the current context emerges as a necessary action.
In this context, the objective of this study is to determine which model, TPB or TAM, provides greater explanatory power for the adoption of telemedicine addressing outlier-associated bias.
The main contributions of this study are three-fold. First, from a practical viewpoint, this research provides empirical evidence of the application of the robust PLS proposal to test the outlier bias effects in a PLS model based on primary data. Second, from an academic viewpoint, this study contributes by testing the technology acceptance theories’ applicability in a new social context, validating the circumstances where these theories can be supported. Third, from a social perspective, this study gives an exploratory baseline to define public policies that support telemedicine implementation in a pandemic context.
The organization of this paper is as follows: In Section 2, we explain the data collection process and methods used to analyze the data; in Section 3, We present the results of this data analysis; in Section 4, we offer a discussion of these results; and finally, in the last section, we provide a summary of the outcome of this study.

2. Methods

2.1. Data

A cross-sectional study was carried out between January and June 2020. A convenience sampling technique was used to collect data from Brazilian adults. The anonymity of the respondents was guaranteed in the data collection process. According to standard socioeconomic studies, no ethical concerns were involved other than preserving the participants’ anonymity.
Specifically, the data was obtained through an online questionnaire for current and future adult telemedicine users in Brasilia. The scales were adapted from Jen and Hung [32]. A 7-point Likert scale was used with answers ranging from 1 (strongly disagree) to 7 (strongly agree). Table 1 shows the questions that were included in the online questionnaire. Figure 1A,B represents the variables and relationships associated with the models under study.

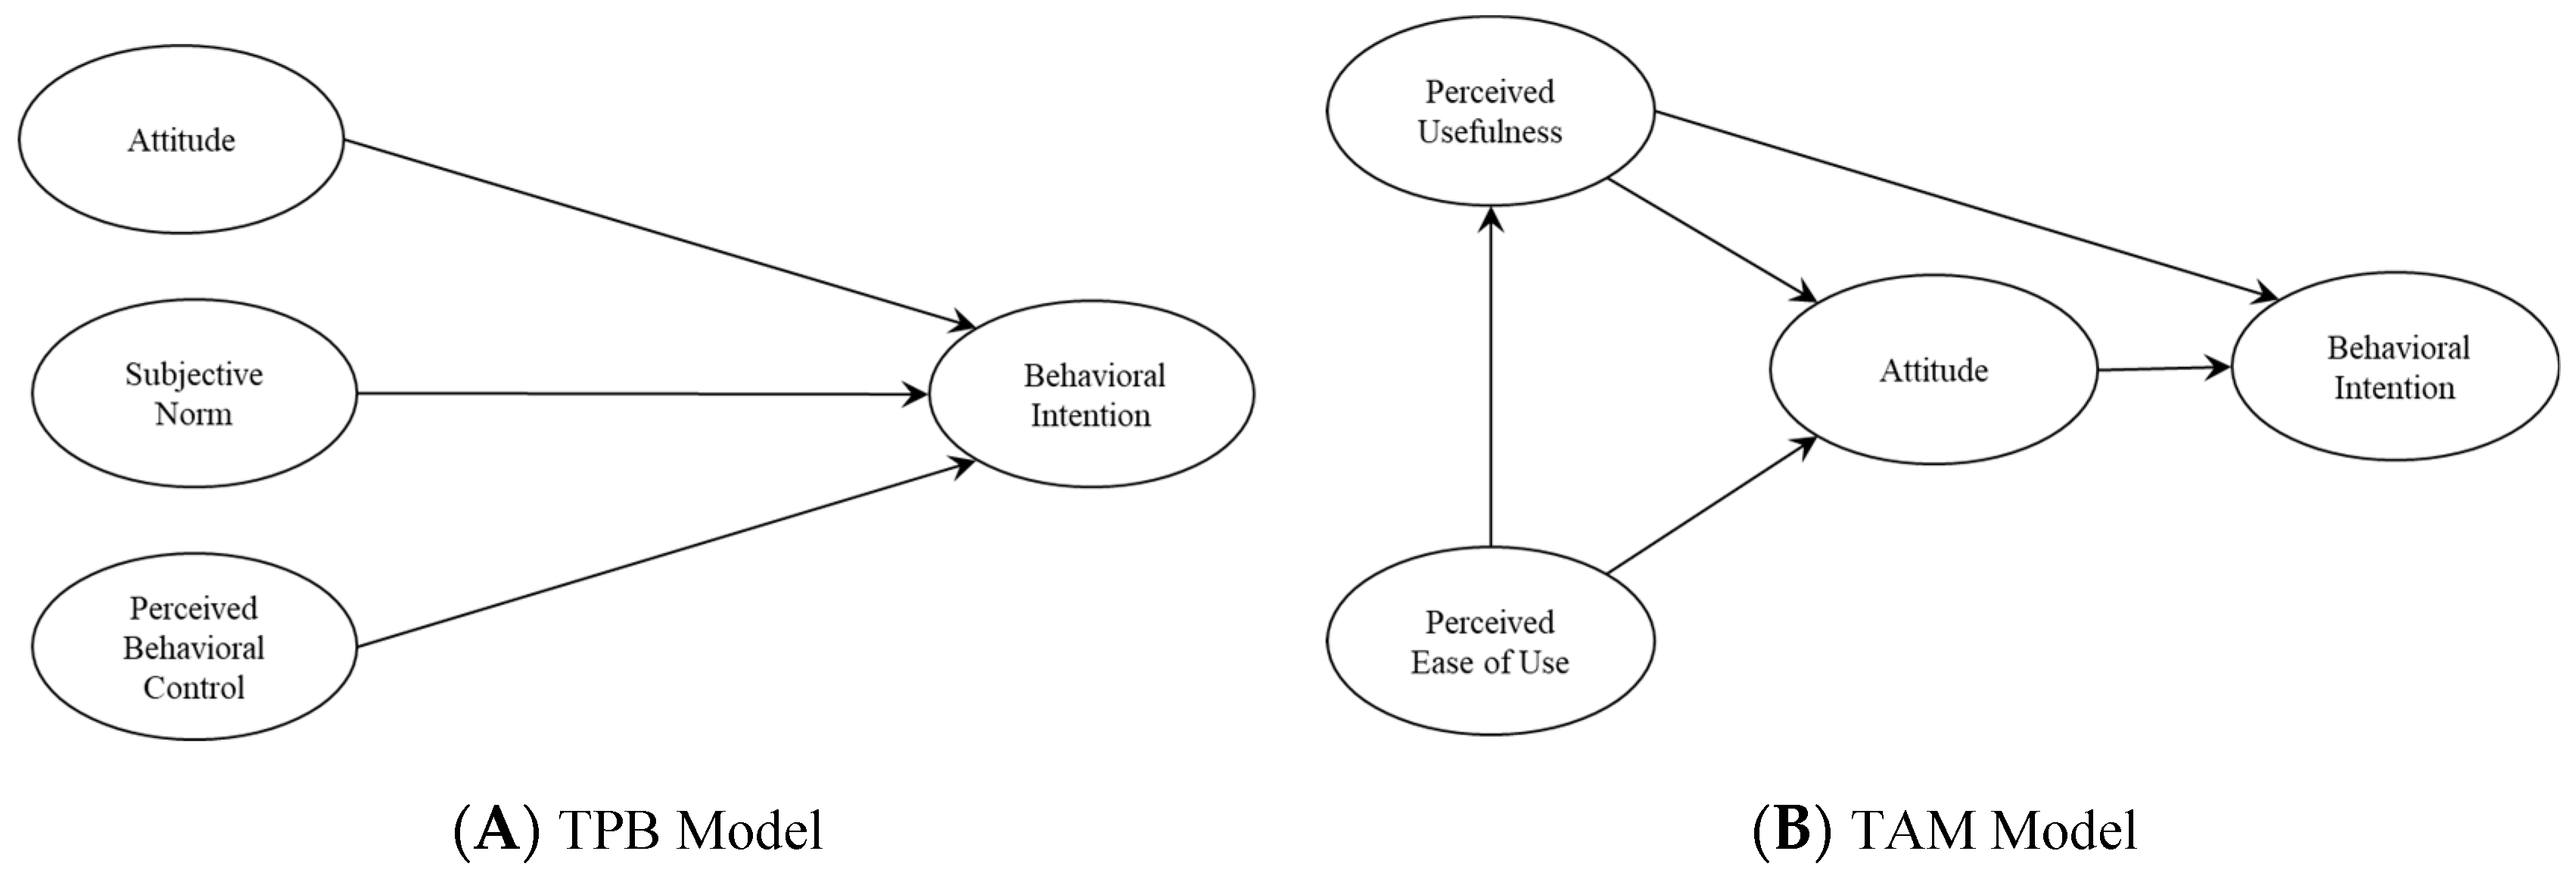
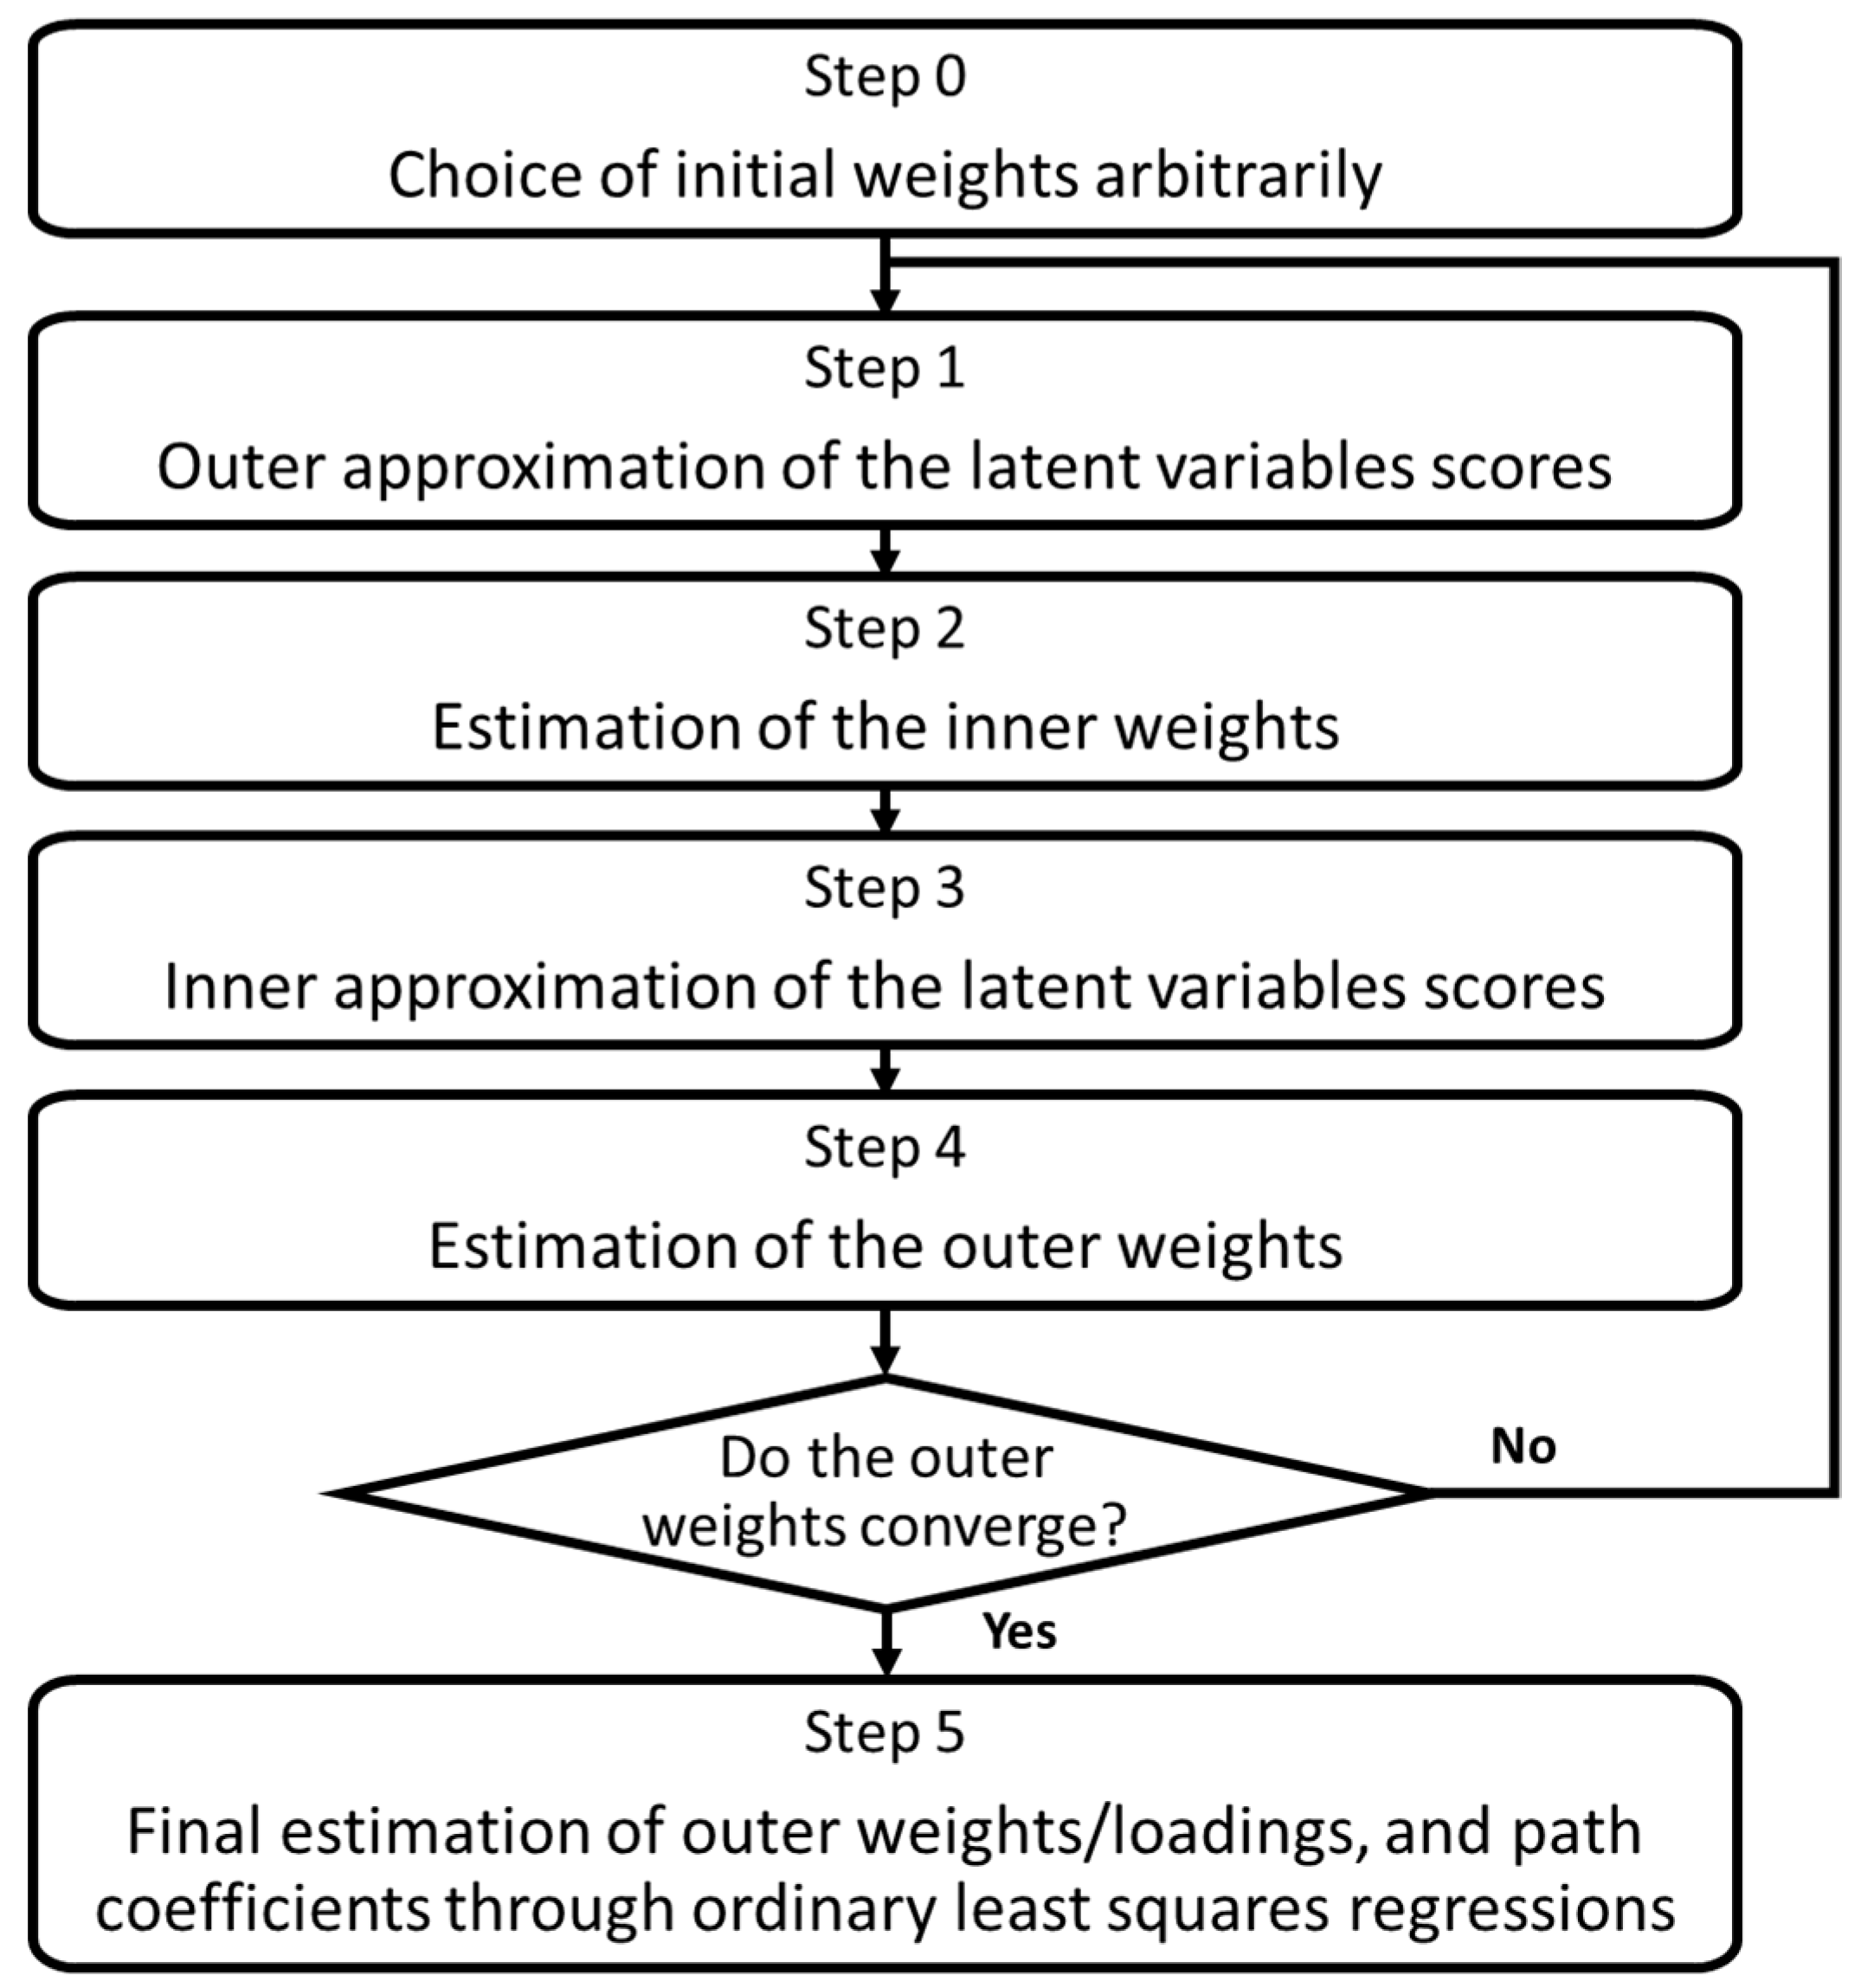
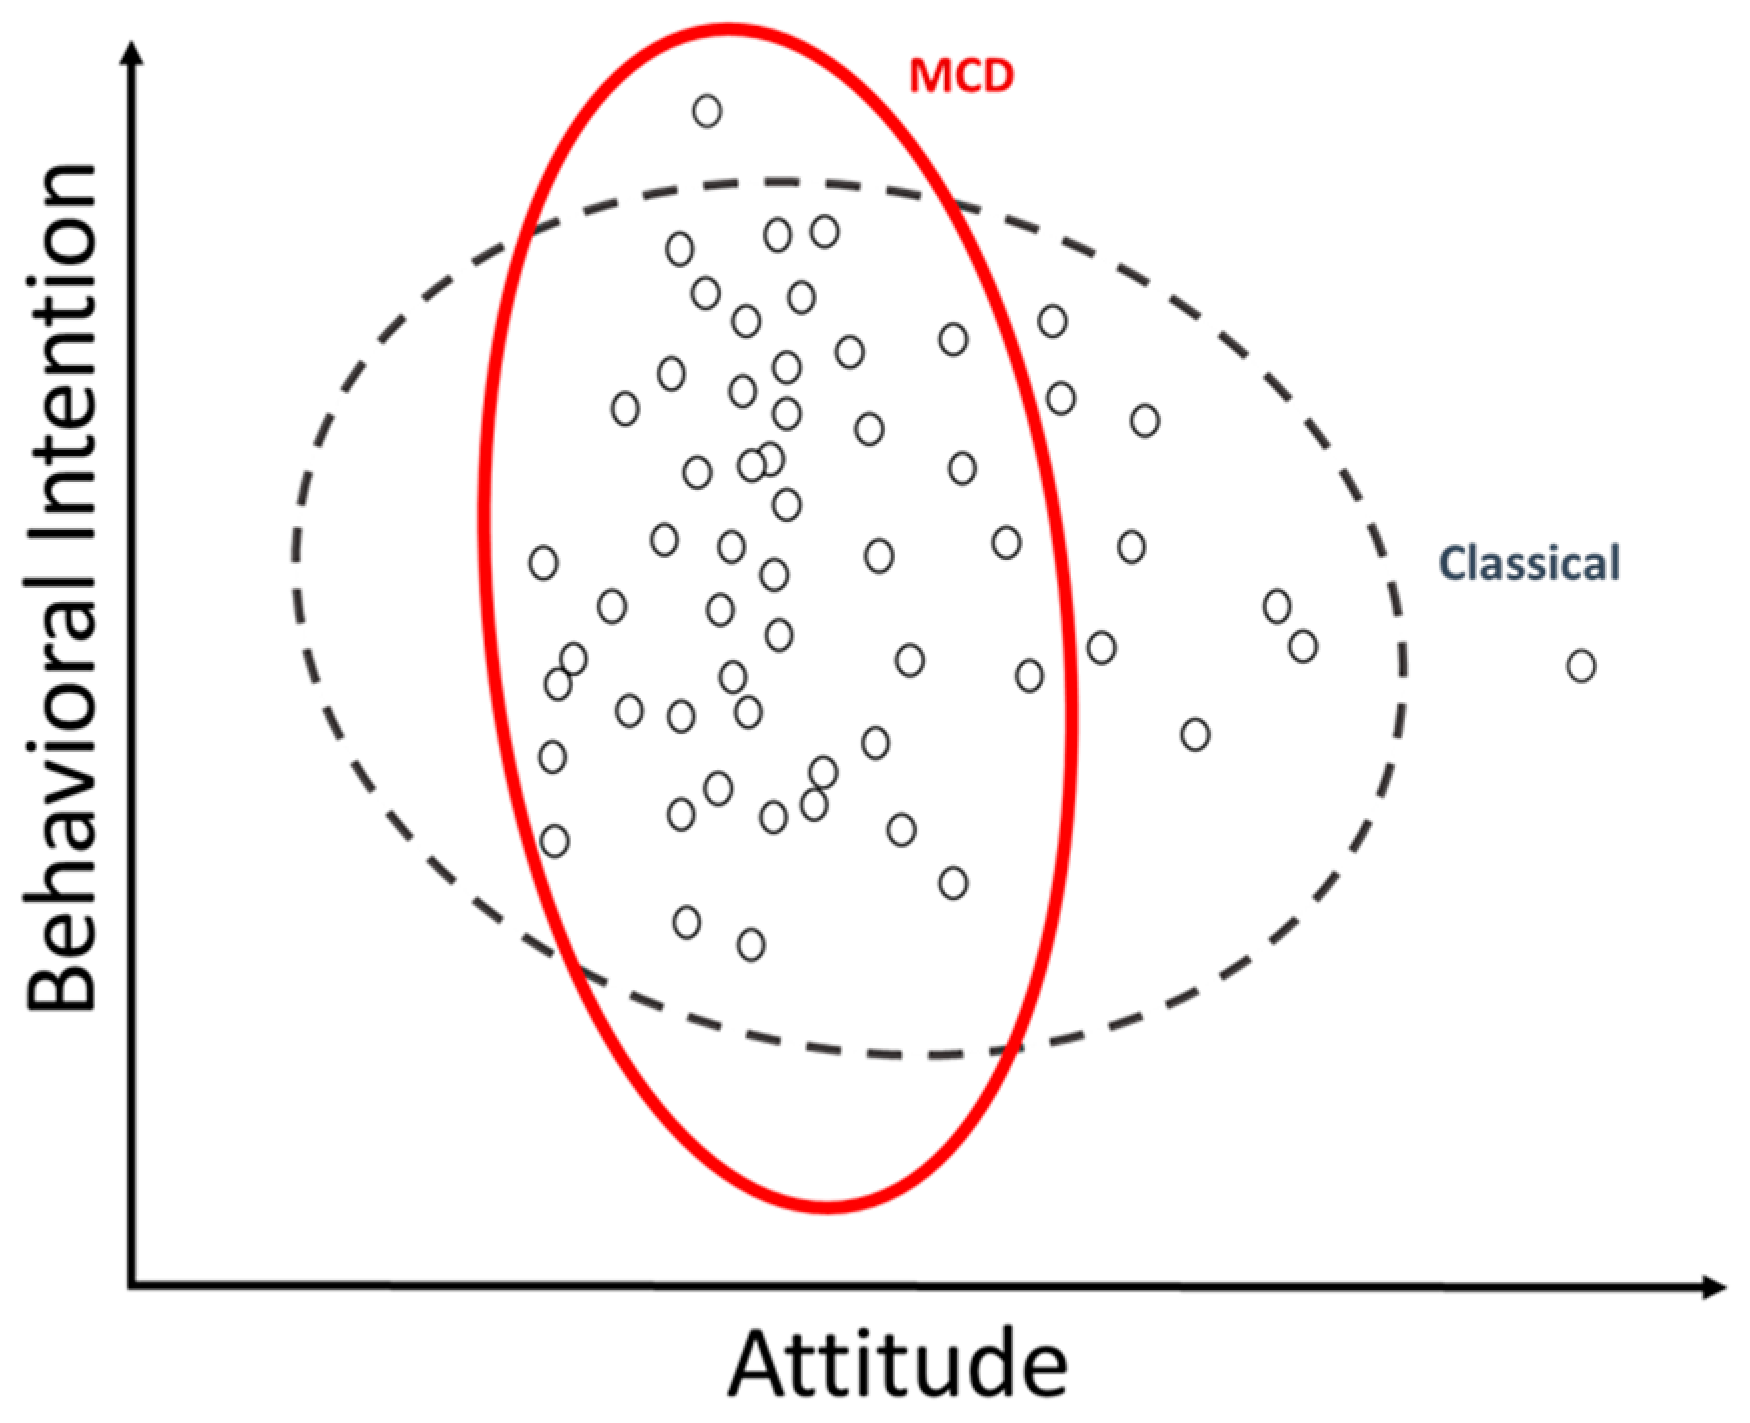
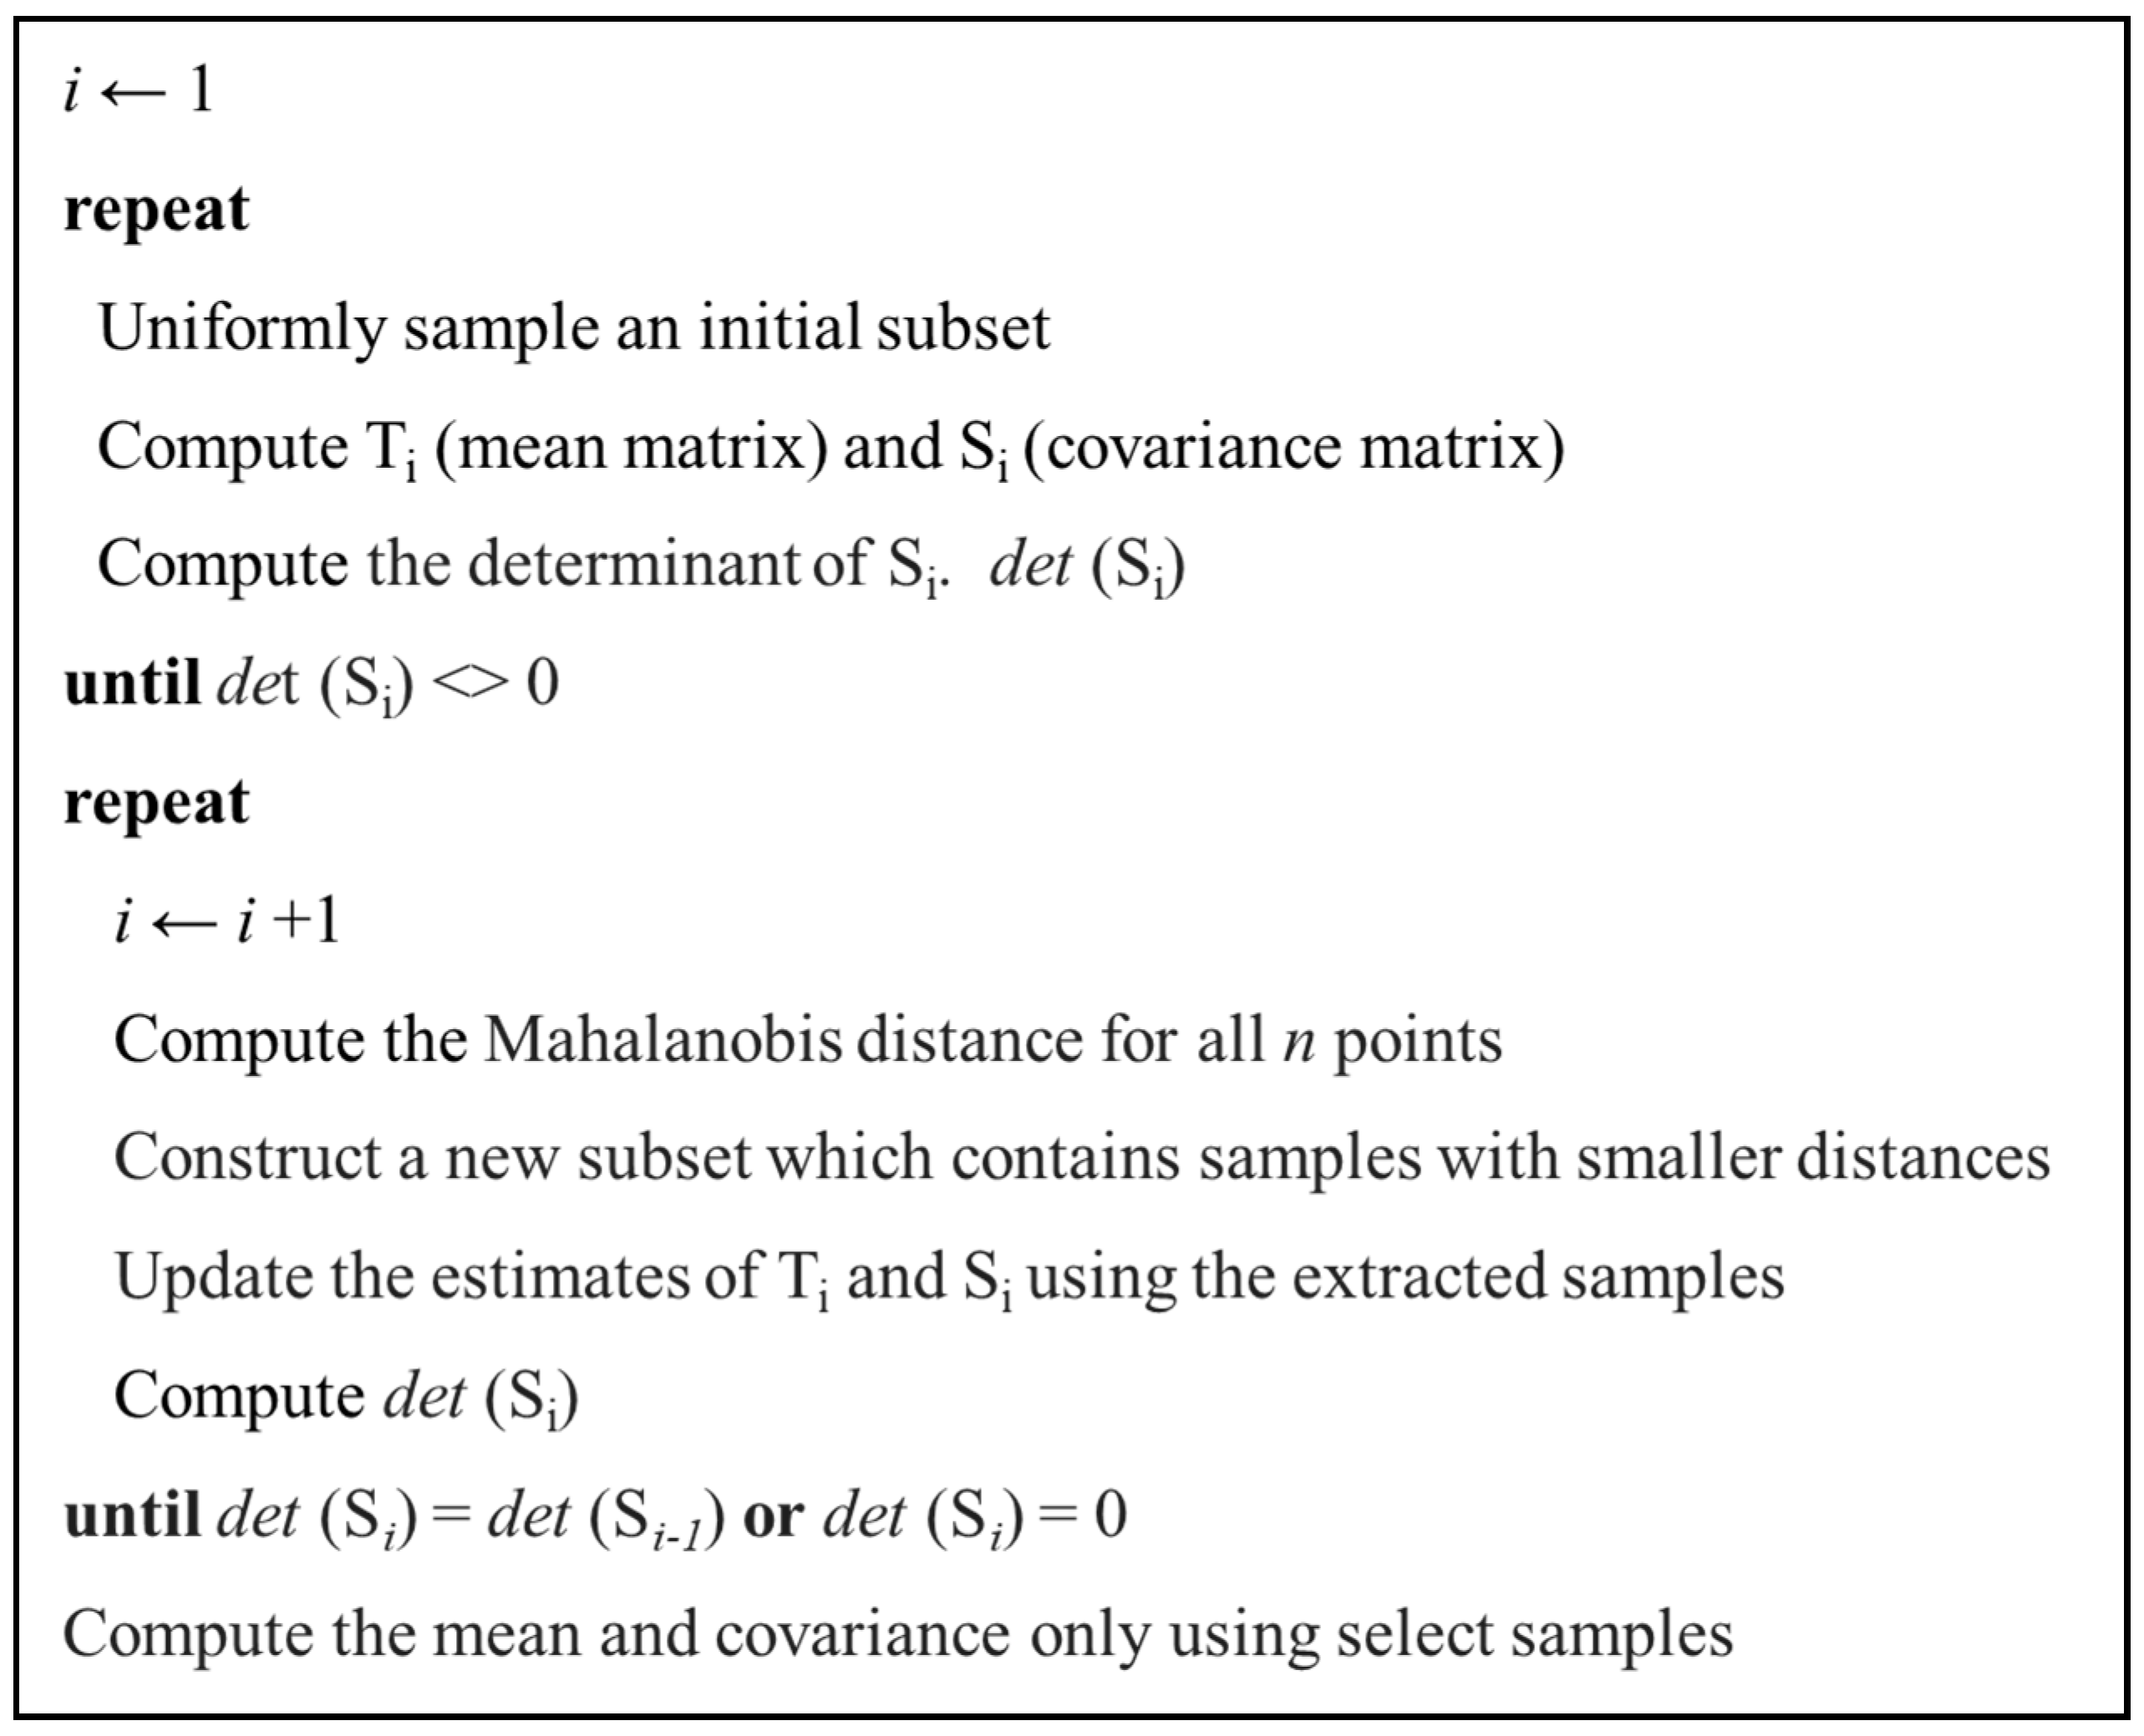
2.2. Partial Least Squares Path Modeling and Robust Partial Least Squares Path Modeling

Traditional and robust PLS were utilized to test the proposed research models. Two models define PLS, i.e., the measurement model and the structural model [34]. The first model examines the instrument’s reliability and validity, and the second model evaluates the relationships among the latent variables. Figure 2 shows the PLS algorithm; a detailed description of the algorithm can be found in [35].
In the PLS procedure, a Pearson correlation matrix is a relevant input, even though Pearson estimates are highly sensitive to unsystematic outliers, which can finally conclude in distorted PLS results. To cope with this shortcoming, Schamberger et al. proposed using a robust correlation coefficient to define a robust PLS [9]. The minimum covariance determinant (MCD) was central to their approach [36]. The MCD estimator is a highly robust estimator of multivariate location and scatter, being the one with the highest asymptotic breakdown point (BP), see Figure 3. The MCD is designed for elliptically symmetric unimodal distributions. The MCD has been used to develop robust multivariate techniques, such as principal component analysis, factor analysis, and multiple regression [37]. In summary, the MCD coefficient estimates the variance-covariance matrix of a sample set based on a subsample of the total observations with the smallest positive determinant. The robust PLS algorithm uses the MCD correlation as an input, maintaining unaltered the subsequent PLS steps, and therefore confronts the outlier issues without removing them from the sample set [9].
All calculations were performed using the statistical programming environment R [38]. In particular, an ad hoc script was built based on the simplePLS function from the SEMinR package [39] to integrate the MCD correlation. MCD estimates were determined by the cov.rob function from the MASS package [40]; Figure 4 shows the MCD algorithm. These modifications affect Steps 2 and 4 of the PLS algorithm. Since the models contained common factors and followed the literature [41], the consistent PLS (PLSc) method was applied. The PLSc method applies a correction for attenuation to consistently estimate factor loadings and path coefficients among common factors [7,42]. The following section shows the results associated with these analyses for the empirical study.

2.3. Statistical Analysis Plan

First, a primary analysis was carried out. This analysis consisted of the description of the characteristics of participants in the study and the preliminary evaluation of data using descriptive statistics. Next, a PLS analysis was carried out [34] which consisted of two broad phases. These phases applied to both the traditional [7] and the robust PLSc method [9]. The first phase was the measurement model analysis of TPB and TAM. Two analyses were carried out in this phase. First, the reliability analysis of the indicators and constructs associated with the models; second, we analyzed the convergent and discriminant validity of these same constructs. The second phase was the structural model analysis of TBP and TAM. This phase evaluated the relationships among the variables, considering the determination coefficients and the strength of the relationships. Finally, a resampling procedure evaluated the statistical significance of the estimates associated with the strength of the relationships.

3. Results

3.1. Primary Analysis

A total of 200 surveys were completed for the study. The majority of the completed surveys were from males (56%), and the average age was 39.9 years old. See Table 2 for more details of the distribution of the variables of interest.
Table 3 shows the descriptive statistics of the items that integrate the measurement models for TPB and TAM.

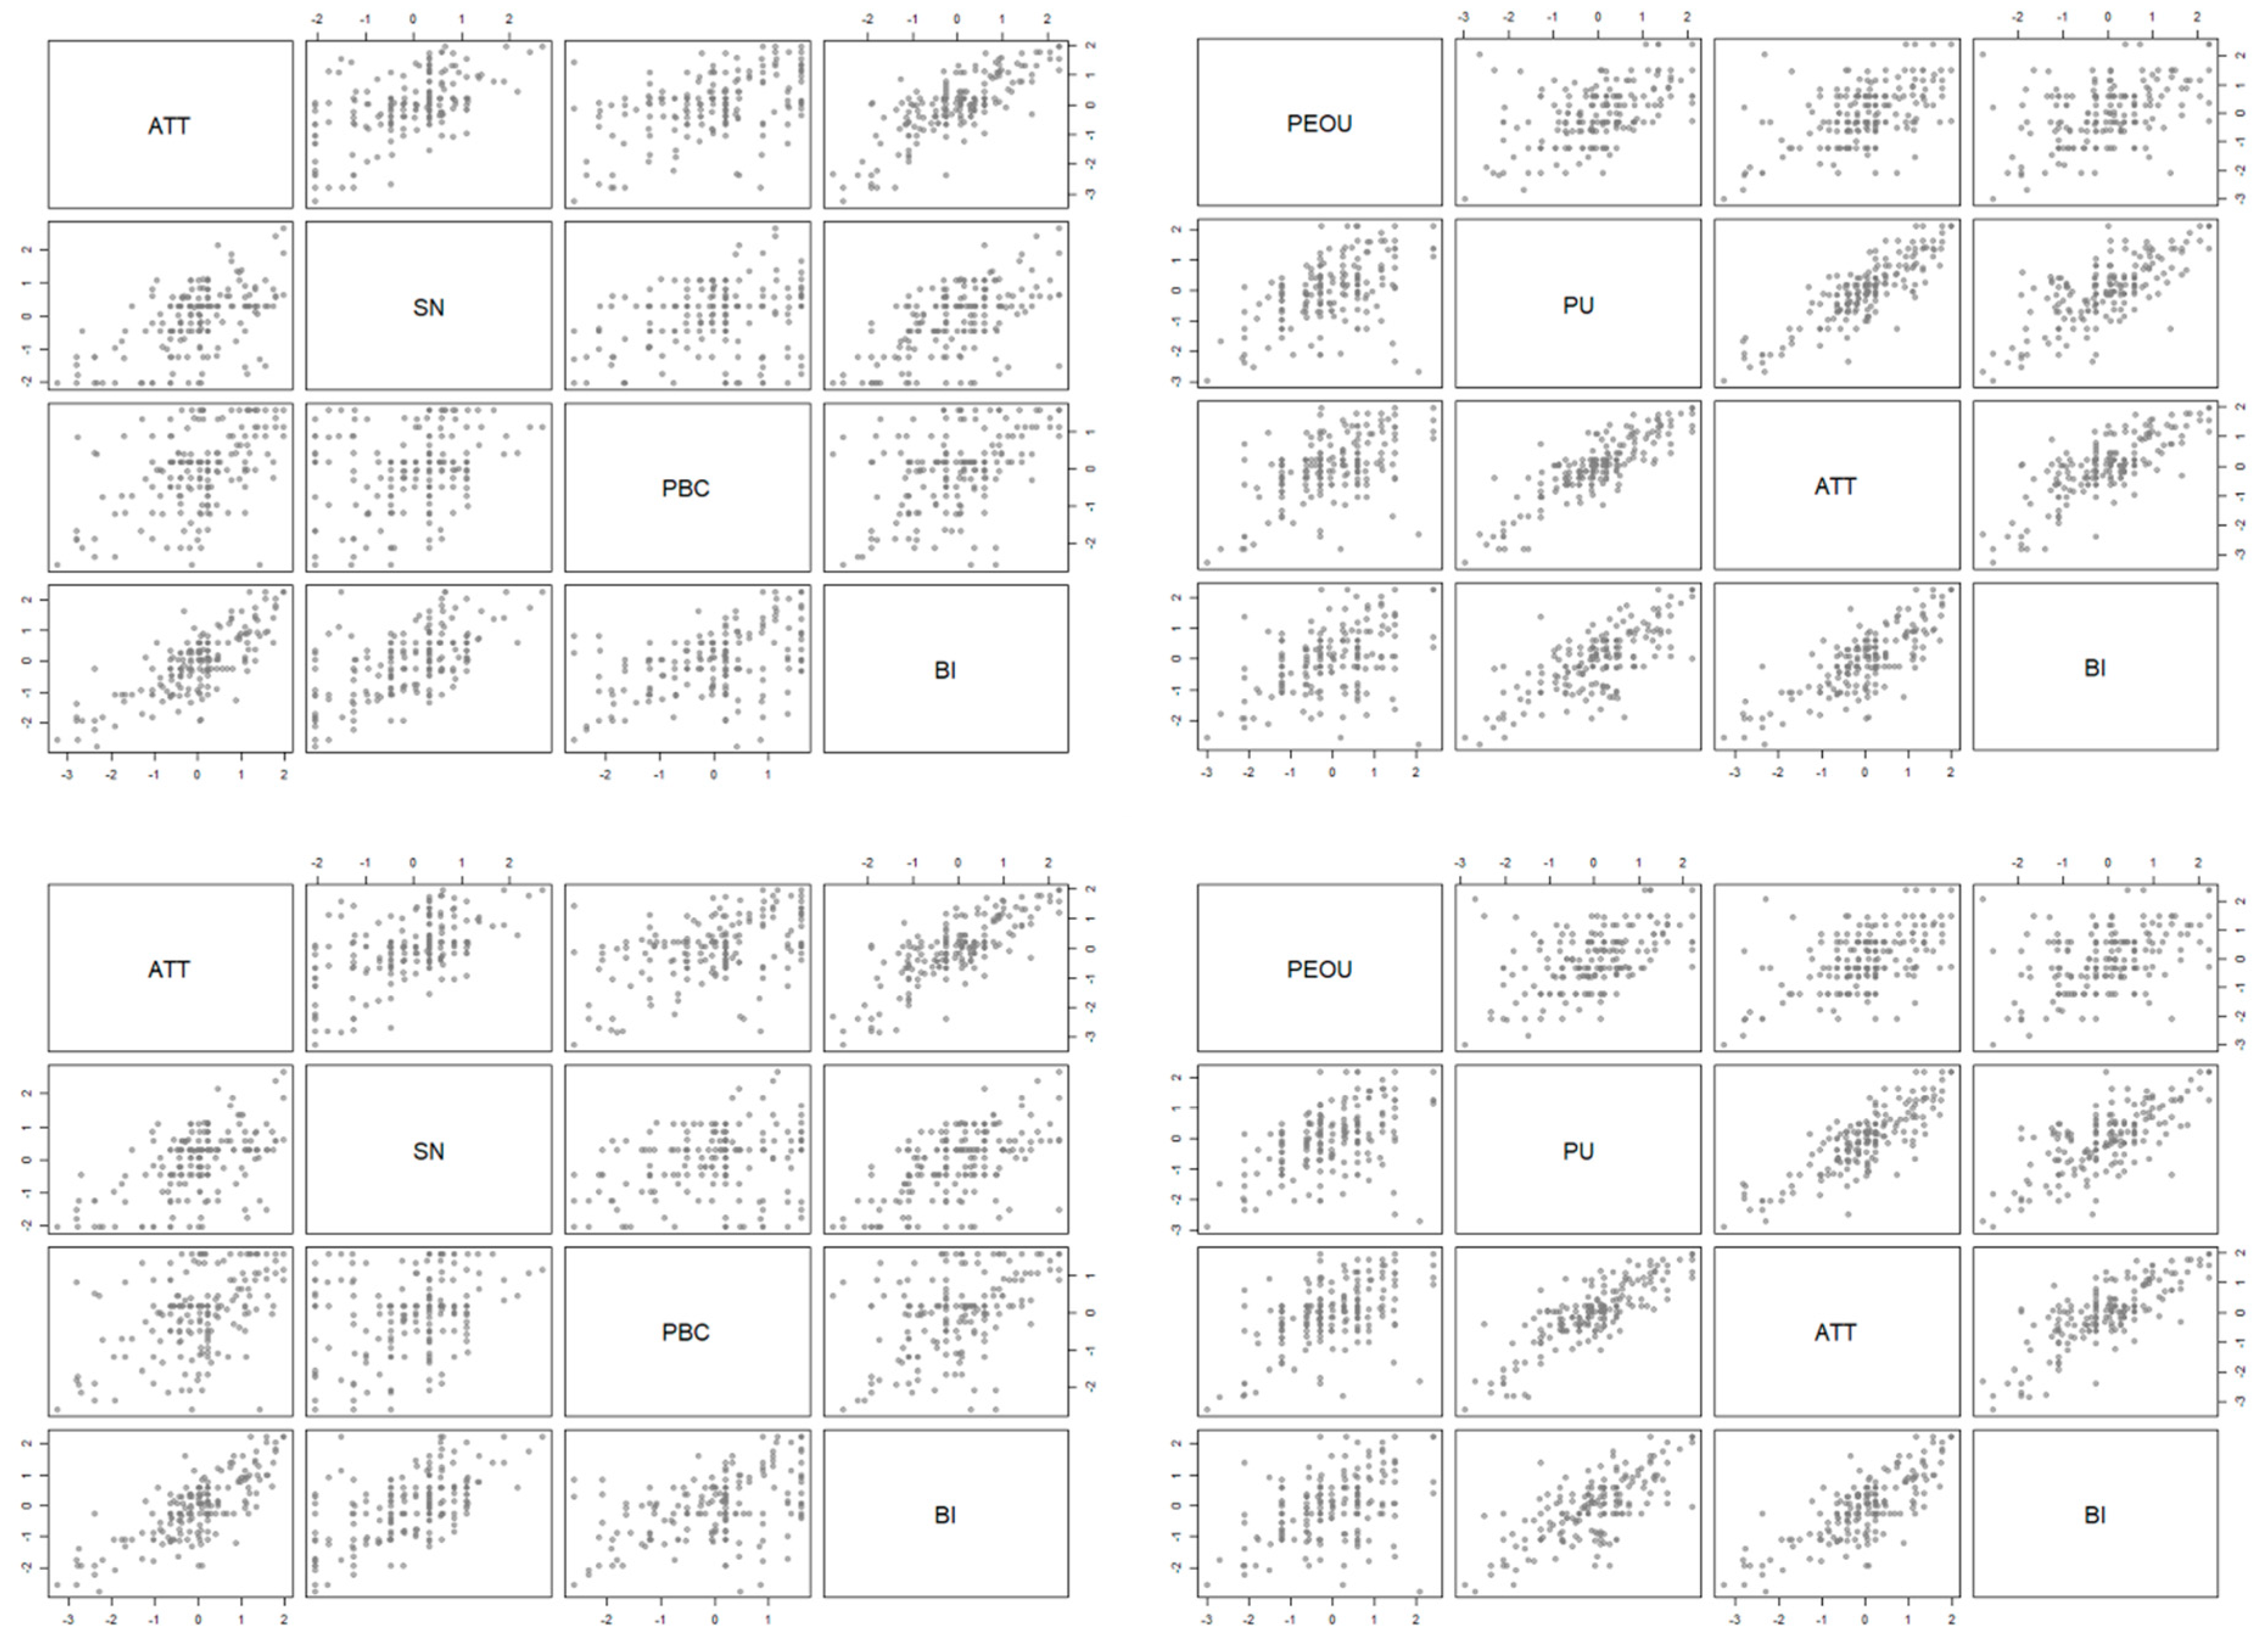
3.2. Partial Least Squares Path Modeling (PLS) Analysis

3.2.1. Measurement Models Analysis

Table 4 indicates the assessment of the measurement models. The table shows the following two indicators: (1) Composite reliability which is a measure of internal consistency reliability that does not assume equal indicator loadings, in their place, it considers indicator loadings in its calculation and values greater than 0.7 are adequate [34] and (2) Average variance extracted (AVE) which is a measure of convergent validity, defined as the degree to which a construct explains the variance of its indicators, values exceeding 0.5 are acceptable [34]. In addition, the discriminant validity assessment using the Fornell–Larcker criterion indicates acceptable values [34].

3.2.2. Structural Models Analysis

To indicate an intermediate result of the structural analysis, Figure 5 shows the plot of the score values for the two models, at the top with traditional PLSc and the bottom with robust PLSc.
The results concerning the analysis of the two research models are indicated in Table 5a,b. The coefficient of determination (R2) indicates the amount of the variance of the dependent variables that is explained by the variables that predict it. The path coefficients (β) express the extent to which the independent variables contribute to the explained variance of the dependent variables. The significance of the β coefficients was calculated using bootstrapping. Bootstrapping is a resampling technique used to determine standard errors of coefficient estimates to evaluate the coefficient’s statistical significance without relying on distributional assumptions. We used 999 bootstrap samples. Both estimation techniques lead to similar results without inconsistencies in interpretation. The analysis using traditional PLSc indicates that the TPB explains 85.8% of the intention to use telemedicine, whereas the TAM explains 81.5%. The analysis using robust PLSc indicates very similar results (84.5% versus 80.8% with TAM). In both methods, the TAM analysis indicates that none of the variables in that model which explain behavioral intention is statistically significant.

4. Discussion

This study was presented as the proper context to justify the use of robust PLSc. In this sense, we must highlight two elements. First, the differences between the results of both techniques are minimal, which rules out bias due to outliers in the models’ estimations. Although all the estimates decrease when robust PLSc is applied instead of traditional PLSc, the variations are minimal. On the one hand, for the TPB model, the determination coefficient of the behavioral intention varies by 1.5%, and the maximum variation in the path coefficient is 1.2%. On the other hand, for the TAM model, the maximum variation in the path coefficients is 9.7%. Moreover, while this makes the following paragraphs of this discussion possible, we believe that this result is partly due to the TPB model’s parsimony and broad application. Second, the robust PLSc approach has a significant challenge related to the extended computation time of the estimates, especially in the bootstrapping process. This problem calls into question the use of this technique beyond exploratory purposes if the sample size is large.
Our results show that the TPB model has significant explanatory power, while the TAM model does not. This outcome indicates that in the sample context, the TPB model is more parsimonious than the TAM model, meaning that we can have significant results with fewer measures. The TAM model does not explain the behavioral intention of using telemedicine. One possible explication is related to the fact that the current study is based on a concept to use technology rather than a demonstration of the technology itself. Since the TAM variables rely on the perceived usefulness and ease of use, the lack of specifications with respect to what the technology will look like could affect these results. Another possible explanation is related to telemedicine being a broader field than just the technology. There are more external variables that affect the behavioral intention to participate in telemedicine. Last but not least, the application of non-consistent PLS methods could be the cause of explanatory power lacking; the literature provides examples of the application of these methods [43,44].
The TPB-based results highlight four points. First, the determination coefficient of the behavioral intention variable (R2 = 0.84), which results from applying robust PLSc, can be described as substantial [2]. This result implies that its predictor variables determine a high variability of the behavioral intention construct. This result must be supported by recent studies about the adoption of telemedicine in emerging countries, however, in general, the explanatory power of these studies has been moderate. This characteristic is evidenced in the following examples. On the basis of a sample of physicians and nurses in public hospitals in Malaysia, a TAM-based model explained 41.5% of the acceptance of telemedicine [45]. In Nigeria, using the data of physicians and nurses, a model based on the unified theory of acceptance and use of technology explained 49.7% of the variation in intention to use telemedicine [46]. On the basis of a sample of Pakistani patients, a TAM model explained a total of 62% of the variance of the intention to use telemedicine [43]. Second, the attitude variable was the most significant predictor of behavioral intention (β = 0.71, robust PLSc). This result is concordant with previous patient-based research [47]. Third, the subjective norms variable was a significative predictor of behavioral intention (β = 0.24, robust PLSc). In previous patient-based studies, the subjective norms factor had a significant effect on the intention to use [43,47], which contrasted with its effect on physician-based studies [48]. Fourth, the perceived behavioral control factor does not affect behavioral intention. This last result is in line with both previous patient-based and physician-based studies [48,49].
Telemedicine has been useful in crisis outbreaks in the past [50]. Today, telemedicine is displaying its potential in the COVID-19 pandemic, for example, e-triage, e-consultations, remote monitoring of the intensive care unit, and patients being attended to remotely by health personnel, including those currently in quarantine [51]. Unfortunately, telemedicine has not been promoted and scaled-up homogeneously in all countries [52]. For example, Italy did not include telemedicine at a fundamental level when the pandemic started. In comparison, France actively fostered the use of telemedicine [50]. COVID-19 is creating a great deal of learning about telemedicine’s effectiveness in times of crisis. However, nation-wide telemedicine programs, especially in developing countries, cannot be designed and implemented overnight [16,17]. According to this research’s results, the attitude toward telemedicine is the most relevant variable to explain the intention of using these services by patients. A practical implication of this study is that communication strategies should focus on showing the benefits of these technologies, initially with vicarious experiences, and then stimulating engagement with these services. This promotion of engagement is associated with patients and also with family members or caregivers, as well as health service providers.
The outcomes of this study can serve as a good starting point for future research about telemedicine usage intention in developing countries. Future research could include larger sample sizes and different population samples. It would be noteworthy to see the difference between a population sample from a country that has many COVID-19 cases and a sample of a country with a low number of cases.
Some limitations must be considered in the present study. First, telemedicine adoption in developing countries, particularly at the COVID-19 pandemic, is an unexplored research area. Thus, the results of this investigation should not be lightly generalized to other settings. Second, this study used a convenience sampling technique appropriate for an initial exploratory research such as this one, but which limits the generalization of the findings. Third, this study used the more traditional versions of the TAM and the TPB. Although only the TPB model provides good explanatory power, these results indicate the necessity of considering other antecedent variables concerning developing countries, such as cultural values, hedonic motivation, self-efficacy, and habit. In this vein, future studies could make comparisons with extended models explicitly developed for telemedicine adoption.

5. Conclusions

This study was aimed at determining which model, TPB or TAM, provided greater explanatory power for the adoption of telemedicine addressing the outlier-associated bias. We carried out an empirical study on a sample of Brazilian adults. From the responses, we tested both the TPB and the TAM models to explain the behavioral intention to use telemedicine.
According to the results of both PLSc and robust PLSc analysis, the TPB provides significant explanatory power. Both estimation techniques lead to equivalent results without inconsistencies in interpretation. Additionally, the TPB structural results show that attitude has the strongest effect on behavioral intention to use telemedicine systems.
Our global findings suggest that statistical notions and methods associated with robustness can be effortlessly implemented in standard techniques used by social scientists. However, the community has not been readily receptive to these improvements. We hope that this study will be useful to advance in that sense.

Author Contributions

Conceptualization, C.R.-R., J.A.-P., and P.R.-C.; methodology, P.R.-C.; software, A.M.-M. and P.R.-C.; validation, C.R.-R. and J.A.-P.; formal analysis, C.R.-R. and J.A.-P.; investigation, C.R.-R. and J.A.-P.; resources, C.R.-R. and J.A.-P.; data curation, A.M.-M. and C.R.-R.; writing—original draft preparation, C.R.-R., J.A.-P., and P.R.-C.; writing—review and editing, C.R.-R. and J.A.-P.; visualization, C.R.-R. and J.A.-P.; supervision, C.R.-R.; project administration, C.R.-R.; funding acquisition, A.M.-M. and J.A.-P. All authors have read and agreed to the published version of the manuscript.

Funding

The APC was partially funded by UCN.

Conflicts of Interest

The authors declare no conflict of interest.

References

  1. Khan, G.F.; Sarstedt, M.; Shiau, W.L.; Hair, J.F.; Ringle, C.M.; Fritze, M.P. Methodological research on partial least squares structural equation modeling (PLS-SEM): An analysis based on social network approaches. Internet Res. 2019, 29, 407–429. [Google Scholar] [CrossRef]
  2. Hair, J.F.J.; Hult, G.T.M.; Ringle, C.; Sarstedt, M. A Primer on Partial Least Squares Structural Equation Modeling (PLS-SEM), 2nd ed.; SAGE Publications: Thousand Oaks, CA, USA, 2016; ISBN 9781452217444. [Google Scholar]
  3. Klesel, M.; Schuberth, F.; Henseler, J.; Niehaves, B. A test for multigroup comparison using partial least squares path modeling. Internet Res. 2019, 29, 464–477. [Google Scholar] [CrossRef]
  4. Becker, J.M.; Rai, A.; Ringle, C.M.; Völckner, F. Discovering unobserved heterogeneity in structural equation models to avert validity threats. MIS Q. Manag. Inf. Syst. 2013, 37, 665–694. [Google Scholar] [CrossRef] [Green Version]
  5. Henseler, J.; Dijkstra, T.K.; Sarstedt, M.; Ringle, C.M.; Diamantopoulos, A.; Straub, D.W.; Ketchen, D.J.; Hair, J.F.; Hult, G.T.M.; Calantone, R.J. Common Beliefs and Reality About PLS: Comments on Rönkkö and Evermann (2013). Organ. Res. Methods 2014, 17, 182–209. [Google Scholar] [CrossRef] [Green Version]
  6. Shmueli, G.; Sarstedt, M.; Hair, J.F.; Cheah, J.H.; Ting, H.; Vaithilingam, S.; Ringle, C.M. Predictive model assessment in PLS-SEM: Guidelines for using PLSpredict. Eur. J. Mark. 2019, 53, 2322–2347. [Google Scholar] [CrossRef]
  7. Dijkstra, T.K.; Henseler, J. Consistent partial least squares path modeling. MIS Q. Manag. Inf. Syst. 2015, 39, 297–316. [Google Scholar] [CrossRef]
  8. Henseler, J. Partial least squares path modeling: Quo vadis? Qual. Quant. 2018, 52, 1–8. [Google Scholar] [CrossRef] [Green Version]
  9. Schamberger, T.; Schuberth, F.; Henseler, J.; Dijkstra, T.K. Robust partial least squares path modeling. Behaviormetrika 2020, 47, 307–334. [Google Scholar] [CrossRef] [Green Version]
  10. Johnson, R.A.; Wichern, D.W. Applied Multivariate Statistical Analysis; Pearson: Harlow, UK, 2018; ISBN 978-0134995397. [Google Scholar]
  11. Niven, E.B.; Deutsch, C.V. Calculating a robust correlation coefficient and quantifying its uncertainty. Comput. Geosci. 2012, 40, 1–9. [Google Scholar] [CrossRef]
  12. Sood, S.; Mbarika, V.; Jugoo, S.; Dookhy, R.; Doarn, C.R.; Prakash, N.; Merrell, R.C. What is telemedicine? A collection of 104 peer-reviewed perspectives and theoretical underpinnings. Telemed. e-Health 2007, 13, 573–590. [Google Scholar] [CrossRef]
  13. Dick, S.; O’Connor, Y.; Thompson, M.J.; O’Donoghue, J.; Hardy, V.; Wu, T.-S.J.; O’Sullivan, T.; Chirambo, G.B.; Heavin, C. Considerations for Improved Mobile Health Evaluation: Retrospective Qualitative Investigation. JMIR mHealth uHealth 2020, 8, e12424. [Google Scholar] [CrossRef] [PubMed]
  14. Harst, L.; Lantzsch, H.; Scheibe, M. Theories predicting end-user acceptance of telemedicine use: Systematic review. J. Med. Internet Res. 2019, 21, e13117. [Google Scholar] [CrossRef] [PubMed] [Green Version]
  15. Ipsos Global Global Views On Healthcare—2018. Available online: https://www.ipsos.com/sites/default/files/Global%20Views%20on%20Healthcare%202018%20-%20Personel%20Health%20Perceptions.pdf (accessed on 20 March 2020).
  16. Bashshur, R.; Doarn, C.R.; Frenk, J.M.; Kvedar, J.C.; Woolliscroft, J.O. Telemedicine and the COVID-19 pandemic, lessons for the future. Telemed. e-Health 2020, 26, 571–573. [Google Scholar] [CrossRef] [PubMed] [Green Version]
  17. Portnoy, J.; Waller, M.; Elliott, T. Telemedicine in the Era of COVID-19. J. Allergy Clin. Immunol. Pract. 2020, 8, 1489–1491. [Google Scholar] [CrossRef]
  18. Adams, J.G.; Walls, R.M. Supporting the Health Care Workforce During the COVID-19 Global Epidemic. JAMA 2020, 323, 1439–1440. [Google Scholar] [CrossRef] [Green Version]
  19. Giudice, A.; Barone, S.; Muraca, D.; Averta, F.; Diodati, F.; Antonelli, A.; Fortunato, L. Can teledentistry improve the monitoring of patients during the Covid-19 dissemination? A descriptive pilot study. Int. J. Environ. Res. Public Health 2020, 17, 3399. [Google Scholar] [CrossRef]
  20. Duffy, S.; Lee, T.H. In-person health care as option B. N. Engl. J. Med. 2018, 378, 104–106. [Google Scholar] [CrossRef]
  21. Anderson, R.M.; Heesterbeek, H.; Klinkenberg, D.; Hollingsworth, T.D. How will country-based mitigation measures influence the course of the COVID-19 epidemic? Lancet 2020, 395, 931–934. [Google Scholar] [CrossRef]
  22. Kim, J.; Park, H.A. Development of a health information technology acceptance model using consumers’ health behavior intention. J. Med. Internet Res. 2012. [Google Scholar] [CrossRef]
  23. Vega-Barbas, M.; Seoane, F.; Pau, I. Characterization of user-centered security in telehealth services. Int. J. Environ. Res. Public Health 2019, 16, 693. [Google Scholar] [CrossRef] [Green Version]
  24. Xie, Q.; Song, W.; Peng, X.; Shabbir, M. Predictors for e-government adoption: Integrating TAM, TPB, trust and perceived risk. Electron. Libr. 2017, 35, 2–20. [Google Scholar] [CrossRef]
  25. Rondan-Cataluña, F.J.; Arenas-Gaitán, J.; Ramírez-Correa, P.E. A comparison of the different versions of popular technology acceptance models a non-linear perspective. Kybernetes 2015, 44, 788–805. [Google Scholar] [CrossRef]
  26. Ramírez-Correa, P.; Rondán-Cataluña, F.J.; Moulaz, M.T.; Arenas-Gaitán, J. Purchase intention of specialty coffee. Sustainability 2020, 12, 1329. [Google Scholar] [CrossRef] [Green Version]
  27. Lin, S.P.; Yang, H.Y. Exploring key factors in the choice of e-health using an asthma care mobile service model. Telemed. e-Health 2009, 15, 884–890. [Google Scholar] [CrossRef] [PubMed]
  28. Zhang, X.; Han, X.; Dang, Y.; Meng, F.; Guo, X.; Lin, J. User acceptance of mobile health services from users’ perspectives: The role of self-efficacy and response-efficacy in technology acceptance. Inform. Health Soc. Care 2017, 42, 194–206. [Google Scholar] [CrossRef] [PubMed]
  29. Saigi-Rubió, F.; Jiménez-Zarco, A.; Torrent-Sellens, J. Determinants of the intention to use telemedicine: Evidence from Primary Care Physicians. Int. J. Technol. Assess. Health Care 2016, 32, 29–36. [Google Scholar] [CrossRef] [PubMed]
  30. Vidal-Alaball, J.; Mateo, G.F.; Domingo, J.L.G.; Gomez, X.M.; Valmaña, G.S.; Ruiz-Comellas, A.; Seguí, F.L.; Cuyàs, F.G. Validation of a short questionnaire to assess healthcare professionals’ perceptions of asynchronous telemedicine services: The Catalan version of the health optimum telemedicine acceptance questionnaire. Int. J. Environ. Res. Public Health 2020, 17, 2202. [Google Scholar] [CrossRef] [Green Version]
  31. Saigí-Rubió, F.; Torrent-Sellens, J.; Jiménez-Zarco, A.I. Drivers of telemedicine use: International evidence from three samples of physicians. IN3 Work. Pap. Ser. 2014. [Google Scholar] [CrossRef] [Green Version]
  32. Jen, W.Y.; Hung, M.C. An empirical study of adopting mobile healthcare service: The family’s perspective on the healthcare needs of their elderly members. Telemed. e-Health 2010, 16, 41–48. [Google Scholar] [CrossRef]
  33. Hill, R.J.; Fishbein, M.; Ajzen, I. Belief, Attitude, Intention and Behavior: An Introduction to Theory and Research.; Addison-Wesley: Reading, MA, USA, 1977; ISBN 9780201020892. [Google Scholar]
  34. Henseler, J.; Hubona, G.; Ray, P.A. Using PLS path modeling in new technology research: Updated guidelines. Ind. Manag. Data Syst. 2016, 116, 2–20. [Google Scholar] [CrossRef]
  35. Sarstedt, M.; Ringle, C.M.; Hair, J.F. Partial Least Squares Structural Equation Modeling. In Handbook of Market Research; Homburg, C., Klarmann, M., Vomberg, A., Eds.; Springer: Cham, Switzerland, 2017; pp. 1–40. [Google Scholar]
  36. Hubert, M.; Debruyne, M.; Rousseeuw, P.J. Minimum covariance determinant and extensions. Wiley Interdiscip. Rev. Comput. Stat. 2018, 10, e1421. [Google Scholar] [CrossRef] [Green Version]
  37. Hubert, M.; Debruyne, M. Minimum covariance determinant. Wiley Interdiscip. Rev. Comput. Stat. 2010, 2, 36–43. [Google Scholar] [CrossRef]
  38. R Core Team R: A Language and Environment for Statistical Computing. Available online: https://www.r-project.org/ (accessed on 9 September 2019).
  39. Ray, S.; Danks, N.P.; Velasquez Estrada, J.M.; Uanhoro, J.; Bejar, A.H.C. Package “SEMinR”. Domain-Specific Language for Building and Estimating Structural Equation Models. Available online: https://CRAN.R-project.org/package=seminr (accessed on 20 December 2019).
  40. Ripley, B.; Venables, B.; Bates, D.; Hornik, K.; Gebhardt, A.; Firth, D. Package “MASS”. Support Functions and Datasets for Venables and Ripley’s MASS. Available online: https://CRAN.R-project.org/package=MASS (accessed on 10 April 2020).
  41. Cepeda-Carrion, G.; Cegarra-Navarro, J.G.; Cillo, V. Tips to use partial least squares structural equation modelling (PLS-SEM) in knowledge management. J. Knowl. Manag. 2019, 23, 67–89. [Google Scholar] [CrossRef]
  42. Dijkstra, T.K.; Schermelleh-Engel, K. Consistent Partial Least Squares for Nonlinear Structural Equation Models. Psychometrika 2014, 79, 585–604. [Google Scholar] [CrossRef]
  43. Kamal, S.A.; Shafiq, M.; Kakria, P. Investigating acceptance of telemedicine services through an extended technology acceptance model (TAM). Technol. Soc. 2020, 60, 101212. [Google Scholar] [CrossRef]
  44. Dünnebeil, S.; Sunyaev, A.; Blohm, I.; Leimeister, J.M.; Krcmar, H. Determinants of physicians’ technology acceptance for e-health in ambulatory care. Int. J. Med. Inform. 2012, 81, 746–760. [Google Scholar] [CrossRef] [Green Version]
  45. Zailani, S.; Gilani, M.S.; Nikbin, D.; Iranmanesh, M. Determinants of telemedicine acceptance in selected public hospitals in Malaysia: Clinical perspective. J. Med. Syst. 2014, 38, 111. [Google Scholar] [CrossRef]
  46. Adenuga, K.I.; Iahad, N.A.; Miskon, S. Towards reinforcing telemedicine adoption amongst clinicians in Nigeria. Int. J. Med. Inform. 2017, 104, 84–96. [Google Scholar] [CrossRef]
  47. Tao, D.; Wang, T.; Wang, T.; Zhang, T.; Zhang, X.; Qu, X. A systematic review and meta-analysis of user acceptance of consumer-oriented health information technologies. Comput. Hum. Behav. 2020, 104, 106147. [Google Scholar] [CrossRef]
  48. Chau, P.Y.K.; Hu, P.J.H. Investigating healthcare professionals’ decisions to accept telemedicine technology: An empirical test of competing theories. Inf. Manag. 2002, 39, 297–311. [Google Scholar] [CrossRef]
  49. Kim, J.; DelliFraine, J.L.; Dansky, K.H.; McCleary, K.J. Physicians’ acceptance of telemedicine technology: An empirical test of competing theories. Int. J. Inf. Syst. Change Manag. 2010, 4, 210–225. [Google Scholar] [CrossRef]
  50. Ohannessian, R.; Duong, T.A.; Odone, A. Global Telemedicine Implementation and Integration Within Health Systems to Fight the COVID-19 Pandemic: A Call to Action. JMIR Public Health Surveill. 2020, 6, e18810. [Google Scholar] [CrossRef] [PubMed]
  51. Hollander, J.E.; Carr, B.G. Virtually Perfect? Telemedicine for Covid-19. N. Engl. J. Med. 2020, 382, 1679–1681. [Google Scholar] [CrossRef] [PubMed]
  52. Smith, A.C.; Thomas, E.; Snoswell, C.L.; Haydon, H.; Mehrotra, A.; Clemensen, J.; Caffery, L.J. Telehealth for global emergencies: Implications for coronavirus disease 2019 (COVID-19). J. Telemed. Telecare 2020, 26, 309–313. [Google Scholar] [CrossRef] [PubMed] [Green Version]
Figure 1. (A) Theory of Planned Behavior (TPB) model; (B) Technology Acceptance Model (TAM) model.
Symmetry 12 01593 g001
Figure 2. Flowchart of the partial least squares path modeling (PLS) algorithm.
Symmetry 12 01593 g002
Figure 3. Compare classical and minimum covariance determinant (MCD) covariances.
Symmetry 12 01593 g003
Figure 4. Pseudocode of the MCD algorithm.
Symmetry 12 01593 g004
Figure 5. The plot of the score values for the two models. Traditional consistent partial least squares path modeling (PLSc) at the top and robust PLSc at the bottom. ATT, attitude; SN, subjective norms; PBC, perceived behavioral control; BI, behavioral intention; PEOU, perceived ease of use; PU, perceived usefulness.
Symmetry 12 01593 g005
Table 1. Questions included in the study questionnaire.
Latent VariableItemDescription
Subjective normsSN1The experts who influence my behavior would think that I should use telemedicine services.
SN2My family would think that I should order the telemedicine service.
SN3My friends would think that I should order the telemedicine service.
Perceived behavioral control PBC1I have the knowledge and ability to operate the telemedicine service.
PBC2I think I can handle the telemedicine service.
PBC3Using the telemedicine service is entirely within my control.
AttitudeATT1Using the telemedicine service is a good idea.
ATT2The telemedicine service increases the healthcare service quality.
ATT3The adoption of telemedicine reduces the risks associated with health
ATT4The telemedicine service is valuable.
Perceived usefulnessPU1The telemedicine service will be beneficial to the care of people.
PU4Using the telemedicine service will reduce the psychological burden of people.
PU3The advantages of the telemedicine service will outweigh the disadvantages.
Perceived ease of usePEOU1Instructions for using equipment in the telemedicine service will be easy to follow.
PEOU2It will be easy to learn how to use the telemedicine service.
PEOU3It will be easy for people to operate the equipment in the telemedicine service.
Behavioral intentionBI1I am glad to present the telemedicine service to my close ones.
BI2I will adopt the telemedicine service.
BI3I will adopt the telemedicine service based on my close ones’ necessities.
Table 2. Distribution of the variables of interest.
VariableN%
Gender
Male11156
Female8944
Total200100
AgeMean 39.9 ± 16.65
Range 18–85 years
Table 3. Descriptive statistics.
ItemAverageSDAsymmetryKurtosis
SN13.681.403−0.0550.020
SN23.521.378−0.462−0.590
SN33.611.421−0.326−0.526
PBC14.241.184−0.174−0.090
PBC24.461.267−0.231−0.064
PBC34.331.216−0.148−0.149
ATT15.001.315−0.7240.836
ATT24.661.358−0.5550.246
ATT34.211.286−0.4560.140
ATT44.981.260−0.6321.260
PU14.971.361−0.6180.591
PU43.961.256−0.0930.367
PU34.461.424−0.314−0.266
PEOU14.521.613−0.530−0.244
PEOU24.981.428−0.6750.347
PEOU34.641.698−0.606−0.211
BI14.231.448−0.3980.088
BI24.601.315−0.3560.241
BI33.991.470−0.280−0.141
Table 4. Assessment of the measurement models.
Model/Latent VariableTraditional PLScRobust PLSc
Composite ReliabilityAVEComposite ReliabilityAVE
TPB
Behavioral intention0.8220.5880.8340.594
Attitude0.9080.6930.9100.694
Subjective norms0.9010.7440.8970.743
Perceived behavioral control0.9060.7470.9120.751
TAM
Behavioral intention0.8240.5890.8340.594
Attitude0.9050.6920.9060.692
Perceived usefulness0.8690.6460.9140.652
Perceived ease of use0.9050.7400.8960.739
Table 5. (a) Structural results (coefficient of determination). (b) Structural results (path coefficients).
(a)
Model/Independent VariableTraditional PLScRobust PLSc
R2R2
TPB
Behavioral intention0.8580.845
TAM
Perceived usefulness0.3360.310
Attitude0.9320.840
Behavioral intention0.8150.808
(b)
Model/RelationshipTraditional PLScRobust PLSc
OriginalBoot MeanBoot SDPerc 0.025Perc 0.975OriginalBoot MeanBoot SDPerc 0.025Perc 0.975
TPB
Attitude -> behavioral intention0.7130.7070.0750.5460.8380.7120.7090.0790.5340.851
Subjective norms -> behavioral intention0.2430.2480.0750.1070.3950.2400.2490.0760.1100.389
Perceived behavioral control -> behavioral intention0.0840.0870.061−0.0340.2060.0800.0840.064−0.0340.216
TAM
Perceived ease of use -> perceived usefulness0.5790.5760.0840.4030.7320.5570.5800.0840.3970.729
Perceived ease of use -> attitude0.0310.0250.075−0.1360.1680.1030.0200.077−0.1340.169
Perceived usefulness -> attitude0.9470.9530.0550.8431.0630.8550.9560.0580.8441.071
Perceived usefulness -> behavioral intention0.0440.2146.813−2.8192.5630.121−0.14010.396−2.2152.743
Attitude -> behavioral intention0.8600.6896.814−1.6343.6910.7871.04310.395−1.8503.092

