Article

The Impact of COVID-19 Pandemic on Air Transport Passenger Markets-Implications for Selected EU Airports Based on Time Series Models Analysis

by
Agnieszka Barczak
1,
Izabela Dembińska
2,
Dorota Rozmus
3 and
Katarzyna Szopik-Depczyńska
4,*
1
Faculty of Economics, West Pomeranian University of Technology in Szczecin, ul. Janickiego 31, 71-270 Szczecin, Poland
2
Faculty of Economics and Engineering of Transport, Maritime University of Szczecin, ul. Pobożnego 11, 70-507 Szczecin, Poland
3
Department of Economic and Financial Analysis, Faculty of Finance, University of Economics in Katowice, Bogucicka 3a, 40-228 Katowice, Poland
4
Institute of Management, University of Szczecin, ul. Cukrowa 8, 71-004 Szczecin, Poland
*
Author to whom correspondence should be addressed.
Sustainability 2022, 14(7), 4345; https://doi.org/10.3390/su14074345
Submission received: 28 February 2022 / Revised: 30 March 2022 / Accepted: 1 April 2022 / Published: 6 April 2022
(This article belongs to the Special Issue Economic and Social Consequences of the COVID-19 Pandemic)

Abstract

:
The COVID-19 pandemic caused a drastic reduction in air traffic passengers, especially during the period when the EU countries introduced a lockdown. Even after the relaunch of airline operators, passenger traffic did not return to the pre-pandemic trend. The aim of the study was to estimate the difference between the demand that was observed during the pandemic, and the demand that was forecast based on the pre-pandemic trend. The calculations were made for airports in selected EU countries. The first method was seasonality indicators, using quarterly data for 2015–2021. In the multiplicative model of seasonal fluctuations, the method of determining the seasonality indicators was used, based on the quotient of empirical values and the value of the trend. The one-name period trend method was used in the next step, then Fourier spectral analysis was applied. In the context of forecasts for the individual quarters of 2020 and 2021, all models indicate a further growing trend in the demand for passenger transport, which could have been observed if the COVID-19 pandemic had not occurred. As a result of the pandemic, the number of passengers handled at airports has significantly decreased. In the third quarter of 2021, freight growth was already noticeable, with the exception of Netherland, where a marked decline was recorded.

1. Introduction

Coronavirus COVID-19 (SARS-CoV-2; formerly called 2019-nCoV) was first identified in Wuhan City, Hubei Province, China [1]. It was initially reported to the WHO on 31 December 2019. On 30 January 2020, the WHO declared the COVID-19 outbreak a global health emergency [2,3]. On 11 March 2020, the WHO declared COVID-19 a global pandemic [4,5,6].
The pandemic has shocked the world. Even though there have been epidemics of infectious diseases in the history of mankind, such as the cholera epidemic, the Spanish flu pandemic, and SARS, the COVID-19 pandemic paralyzed the world. It quickly created global economic and social disruptions through the necessity to impose restrictions on all people without exception. According to estimates made by the International Monetary Fund, the global economy contracted by 4.4% in 2020, the worst decline since the Great Depression in the 1930s [7]. Estimates indicate the virus reduced global economic growth in 2020 to an annualized rate of around −3.2% [8]. The effects are expected to be felt for the next several years. Major advanced economies, comprising 60% of global economic activity, are projected to operate below their potential output level through at least 2024, which indicates lower national and individual economic welfare relative to pre-pandemic levels [8].
The COVID-19 pandemic affected all sectors of the economy. Contact-intensive services, such as tourism, usually relatively insensitive to the economic cycle, were the most affected. At the height of the first wave of the pandemic in the second quarter of 2020, activity in these sectors was 25% below pre-COVID-19 trends. On the other hand, sectors that usually evolve in a procyclical manner were impacted somewhat less, such as industry (−19%) and construction (−15%). Services with high-skilled workers and high scope for remote work like ICT, finance, and real estate contracted even less (less than −10%) [9].
As noted, one of the most sensitive sectors of the economy to the impact of COVID-19 was tourism. The crisis in air transport was a derivative of the crisis in tourism. Over the last few decades, air transport has been struggling with several serious crises, both of an ecological and economic nature, which have left a lasting mark on its activities. We can mention here the attacks on the World Trade Center, problems caused by volcanic ash clouds in Indonesia, and the financial crisis of 2008. At the same time, one should also bear in mind the problems related to the deregulation of the aviation market in the USA and Europe, privatization of the main network air carriers, and competition from low-cost airlines. However, it was COVID-19 that revolutionized the aviation industry in an unprecedented way [10,11,12,13,14,15,16,17,18,19,20,21,22,23].
Across all industries, the aviation sector was probably among the hardest hit [24]. The unprecedented decline in the number of air passengers led to the stoppage of most airlines, and some companies even had to stop their operations and ground their fleet, which led to a reduction in employment, additionally taking into account rotation [25,26,27,28,29]. COVID-19 also caused changes in passenger behavior [30]. Therefore, in the context of the COVID-19 pandemic, air transport was analyzed from different perspectives.
From the perspective of our research, a significant problem was the large-scale flight suspension that took place from March 2020 to May 2020. This was due to the fact that air transport plays a key role in the spread of COVID-19. Initially, flight suspensions had an equal effect on the number of international and domestic flights. May 2020 is probably considered the month with the fewest flights in recent aviation history. After some time, many airlines began restarting domestic flights, mainly due to the perceived successes in fighting the first wave of the pandemic, although the beginning of the summer (holiday) season in Europe was not without significance [31]. In the literature, there are many studies on the research of air suspension during COVID-19. However, the main limitation of these studies is that they are based overwhelmingly on the number of flights, thus disregarding the actual number of passengers. This is covered, for example, in the studies of Nižetić (2020), Strauss et al. (2020) and Budd et al. (2020) [32,33,34]. There are also studies aimed at estimating the demand for passenger transport in air traffic after the pandemic. The main problem in these analyzes is how quickly the market will recover [35,36,37,38,39,40].
The aim of the study was to estimate the difference between the number of passengers handled during the pandemic at the airports of selected EU countries and the demand forecast based on the pre-pandemic trend. The intention was to estimate the amount of air passenger losses caused by the pandemic. The calculations were made for airports in the following EU countries: Spain, France, Italy, Germany, The Netherlands, Portugal, Ireland, Poland, and Greece. The research and analysis were carried out in several stages. In the first step, a review of the literature was carried out to determine whether similar studies had already been conducted. Subsequently, using the quarterly data for 2015–2021, the method of seasonality indicators was applied. In the multiplicative model of seasonal fluctuations, the method of determining the seasonality indicators was used, based on the quotient of empirical values and the value of the trend. In the next step, the one-name periodical trend method was used. Then, Fourier spectral analysis was applied.
Based on the analysis, it was concluded that all the forecasting methods used were very well suited to the real data. This is evidenced by the fact that the values of expired forecasts corresponding to individual methods almost overlap and match the empirical data very well. The exceptions are two of the surveyed countries, i.e., Greece and Poland, where there is a more marked discrepancy between the values resulting from different methods.
The procedure algorithm used determined the structure of the article. The article therefore consists of the following parts: introduction, methodology, analysis, results, and conclusions. The literature review is included in the introduction, which explains the type of problem under study and the nature of the analysis.

2. Materials and Methods

The study used quarterly data for 2015–2021, published by Eurostat. As the data for the last quarter of 2021 had not yet been completed, data up to and including the third quarter were used. For Ireland and Greece, data for the third quarter of 2021 are not available.
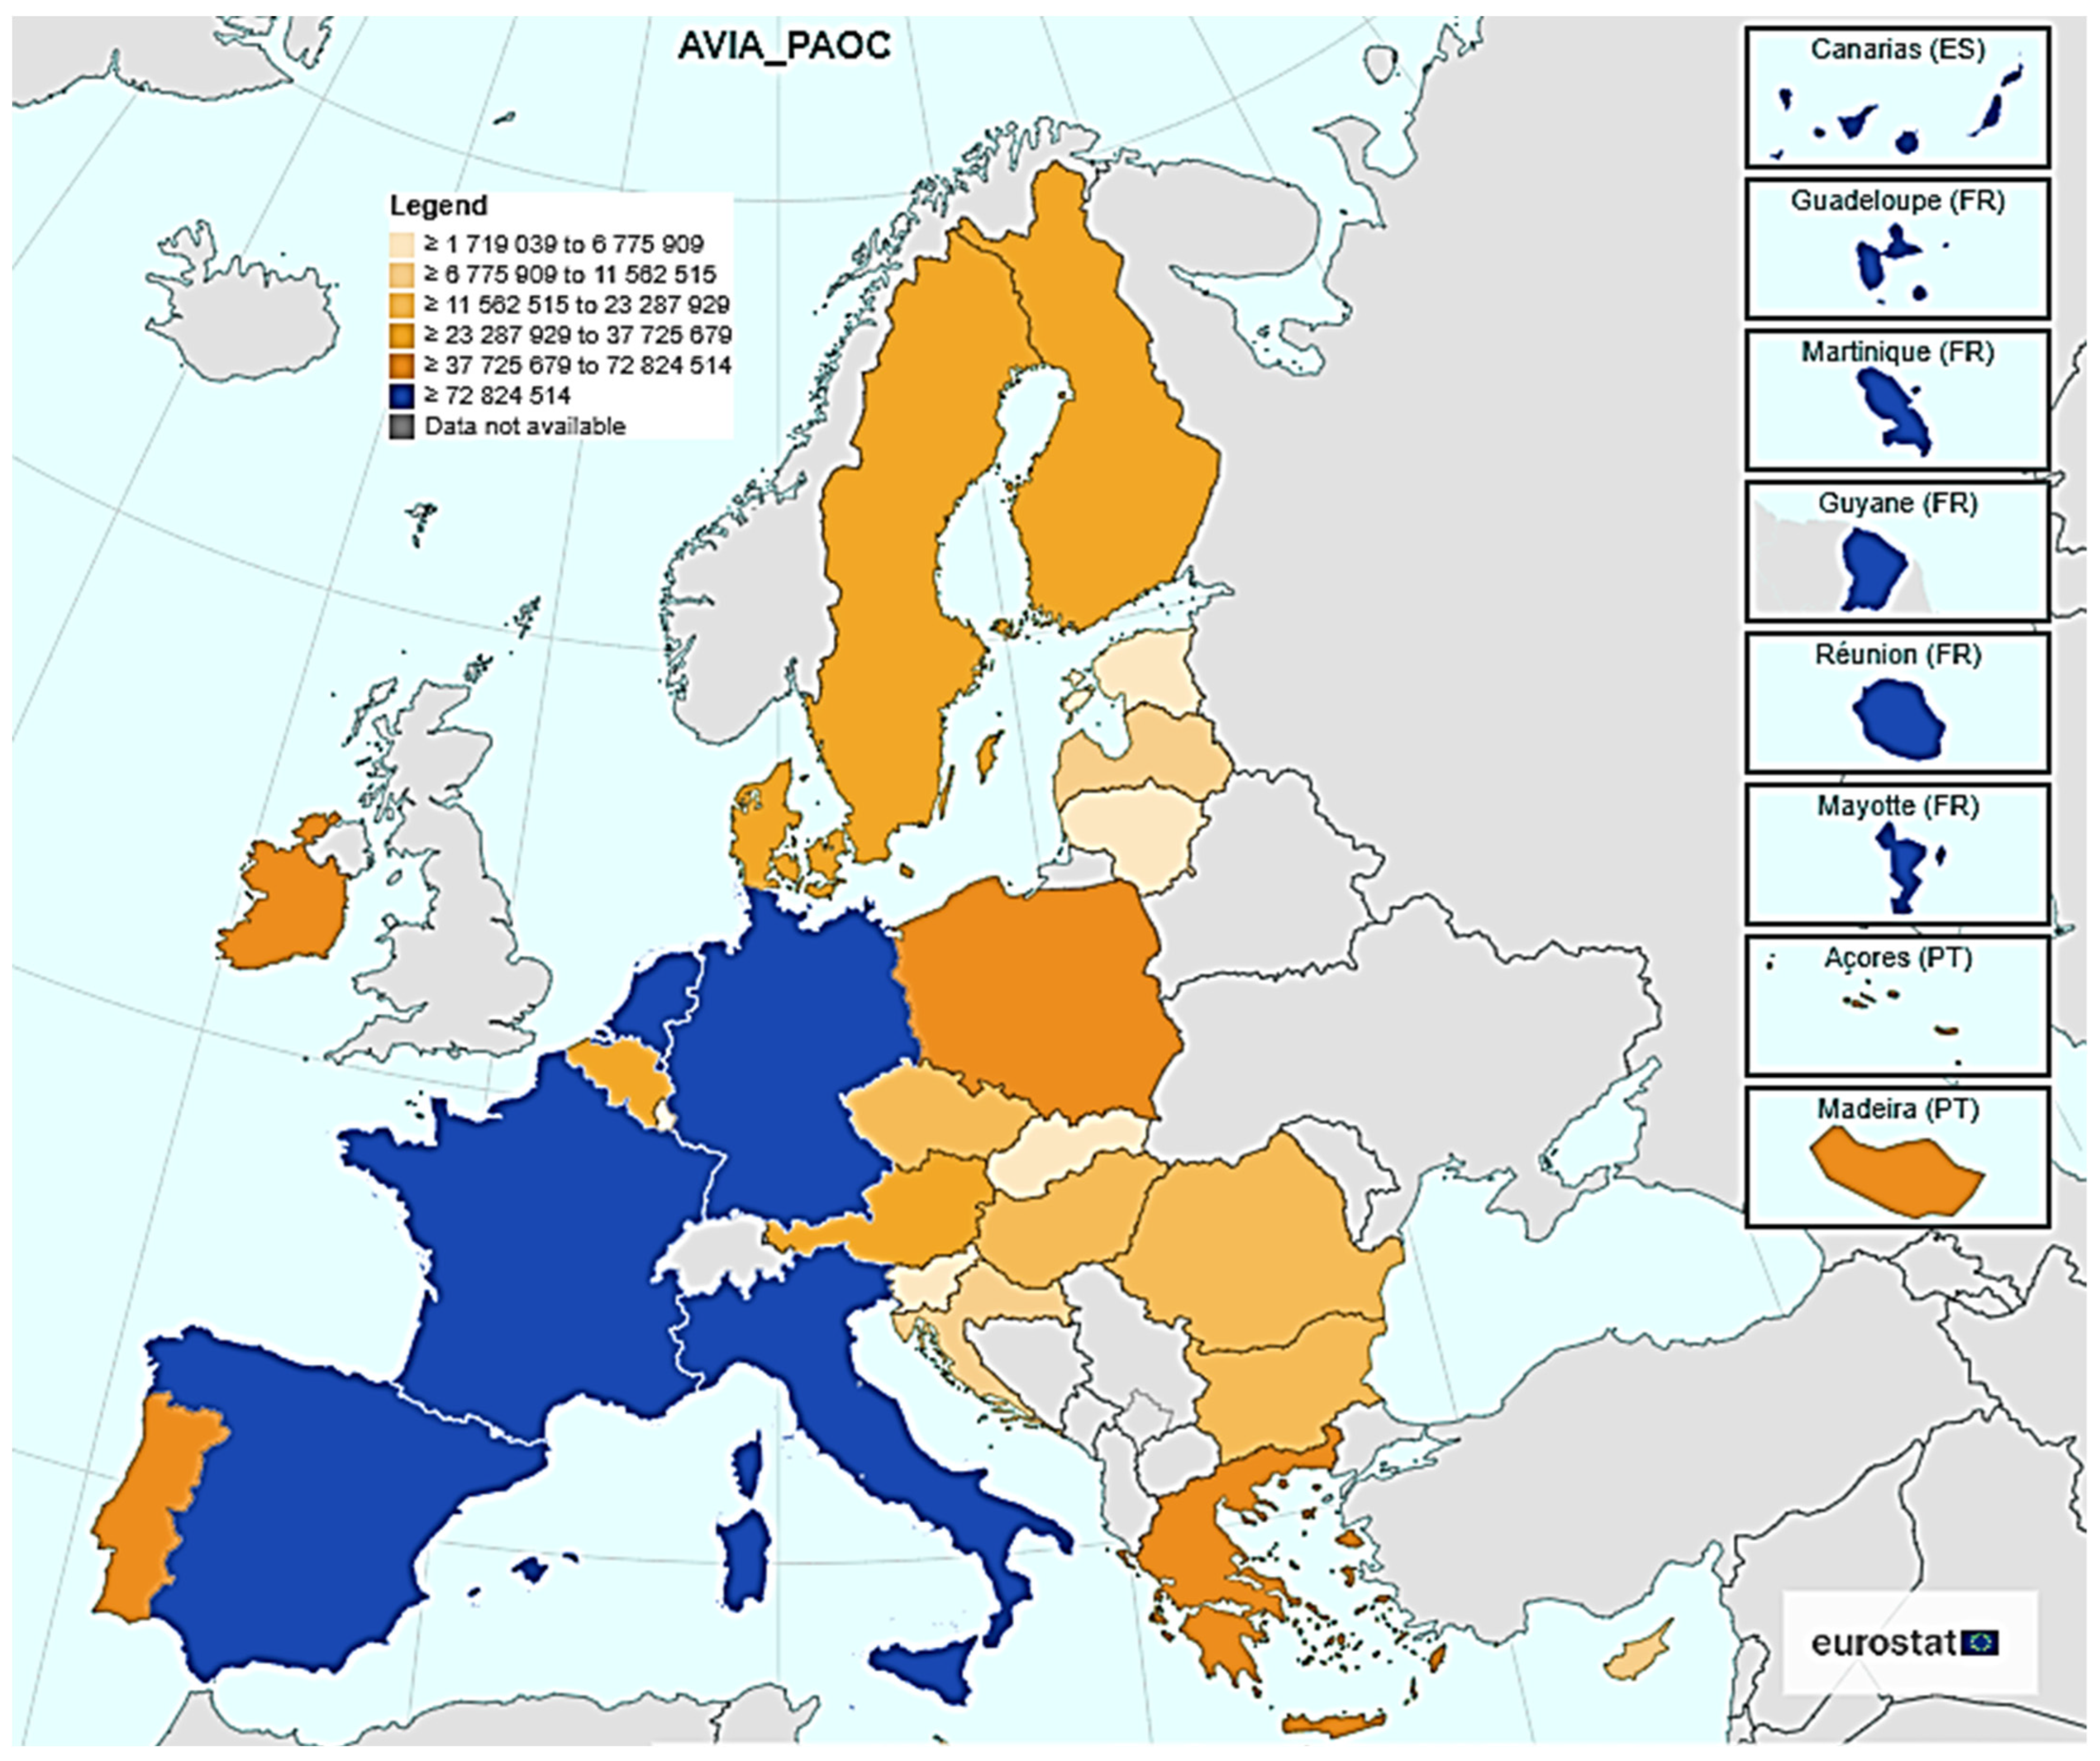
The EU countries (as of January 2022) were selected for the analysis. In the year preceding the outbreak of the COVID-19 pandemic, there was more than 37,725,679 passengers served (arrivals and departures) in these countries. This group includes Spain, France, Italy, Germany, The Netherlands, Portugal, Ireland, Poland, and Greece (Figure 1—blue and dark orange). This choice was because the average number of passengers served in the EU (28 countries in 2013–2020) in 2019 was 40,949,752 people. Therefore, a range containing this mean and a range above the mean were selected for the study.
Comparing the years 2018 and 2019, in 2020 in the analyzed EU countries, there was a significant decrease in the number of passengers handled in air traffic. As shown by the data in Table 1, these declines exceeded 60% in all countries. Comparing 2018 with 2020, the decreases range from 67.56% in Portugal to 77.25% in Ireland. However, comparing the years 2019 with 2020, the decreases range from 69.08% in Greece to 78.21% in Ireland. This shows that for both comparisons, the largest decline was in Ireland. Therefore, it is important to estimate the size of losses in the number of passengers in air traffic suffered by airports because of the pandemic. To this end, air traffic forecasts were first compiled, if a pandemic has not occurred, and then compared with actual air traffic volumes in a pandemic condition.
The study used quarterly Eurostat data on passenger air traffic in nine EU countries, i.e., in Spain, France, Italy, Germany, The Netherlands, Portugal, Ireland, Poland, and Greece for 2015–2021 (as of 31 January 2022, the published data relate to the first three quarters of 2021). Based on the data for 2015–2019, a forecast of passenger traffic for the individual quarters of 2020 and 2021 was prepared and compared with the actual data provided by Eurostat. This made it possible to illustrate the losses calculated in the number of passengers served because of the COVID-19 pandemic at the examined airports. Because air traffic in all countries is characterized by a quarterly seasonality, three forecasting methods were adjusted to take this phenomenon into account. These methods are the method of seasonality indicators, the method of the trends of one-name periods, and the Fourier spectral analysis.
The method of determining the forecast depends on the type of seasonal fluctuations, which may be multiplicative or additive. Multiplication fluctuations occur when, in individual cycle sub-periods, the analyzed phenomenon deviates from the average level or trend by a certain constant relative value. Additive fluctuations refer to a situation in which there are constants in terms of absolute value deviation of the level of the analyzed phenomenon from the average level, or trend, in individual seasonality cycle sub-periods [41]. The analysis of the time series for the analyzed countries revealed seasonal fluctuations of an additive nature.
Seasonality indices of the additive model are calculated from the formula:
O i = ( y i y ^ i ) n
where:
  • O i —seasonality index for the i-th seasonality cycle subperiod.
  • y i —empirical value of the period variable i.
  • y ^ i —the value of the trend of the period i.
  • n —number of homonymous periods.
The seasonality indices of the additive model determined from the Formula (1) should meet the relationship:
i = 1 d O i = 0
where:
  • d —number of sub-periods in the cycle.
If the relation written by the Formula (2) is not fulfilled, the seasonal indicators calculated according to (1) are raw and should be cleaned. For this purpose, the so-called correction factor:
k = i = 1 d O i d
The adjusted (called clean) seasonal indicators are then calculated using the formula:
O k i = O i k
If known, the measures of seasonal fluctuations and the trend function of the studied phenomenon allow for obtaining forecasts. For additive seasonal fluctuations, in order to obtain a forecast for the period t = T, the following formula is applied:
y T P = y ^ T + O k i
where:
  • y T P —forecast for the period t = T .
  • y ^ T —value of the estimated trend function.
Of note, however, due to the forecasting method not being based on a formal model, it is not possible to determine the forecast error [42].
The second method is the one-name period trend method (the description of the method is taken from the work [43,44]). This method is based on the estimation of the parameters of the analytical trend function, with division into individual cycle phases. The forecast is obtained by extrapolating an estimated trend function for each phase of the cycle [45].
The last of the methods used is the harmonic analysis, also known as the spectral method, or the Fourier spectral method. The possibilities of using the harmonic analysis are very wide and relate to issues where the phenomenon of periodicity occurs. The construction of the model consists in summing the so-called harmonics, i.e., the sinusoidal and cosine functions with a given period. The first harmonic has a period equal to the length of the period studied, the second half of the period, etc. In the case of n observations in the time series, the number of total harmonics corresponds to the value n/2. The notation of the periodic component model has the following form:
y t = α 0 + i = 1 n 2 [ α i s i n ( 2 π n i t ) + β i c o s ( 2 π n i t ) ]
where: i—to number harmonic, α 0 ,   α i ,   β i —parameters.
Using the least squares method, the parameters a 0 ,   a i ,   b i which are the evaluations of the parameters of Equation (6), are estimated from the following formulas:
a 0 = 1 n i = 1 n y i
a i = 2 n i = 1 n y t s i n ( 2 π n i t ) ,         i = 1 ,   2 ,   ,   n 2 1
b i = 2 n i = 1 n y t c o s ( 2 π n i t )
For the last harmonic, which has the number n/2, the parameter a n 2 takes the value zero, and the evaluation value of the parameter b n 2 is determined from the formula:
b n 2 = 1 n i = 1 n y t c o s ( π t )
Harmonic analysis focuses on the study of fluctuations around the average level, represented by the parameter a 0 in Equation (6). If there is a clear trend in the studied phenomenon, the harmonic analysis model takes the form:
y t = f ( t ) + i = 1 n 2 [ α i s i n ( 2 π n i t ) + β i c o s ( 2 π n i t ) ]
where f (t) represents the trend function.
The longer the analyzed time series is, the more harmonics that are taken into account. In practice, in the final form of the model, only those harmonics that significantly contribute to explaining the variance of the studied model should be taken into account. For the model (6), the tested variable was the forecasted variable, while for the model (11), the tested variable was the forecasted variable after eliminating the general development tendency. To determine what part of the variance of the studied variable is explained by individual harmonics, the following equation is used:
d i 2 2 s 2   dla   i = 1 ,   2 ,   ,   n 2 1
However, for the last harmonic, the percentage of explaining the variance of the examined variable is calculated according to the formula:
d i 2 s 2   dla   i = n 2
where:   s 2 —is the variance of the studied variable, while d i 2 is determined from the equation:
d i 2 = a i 2 + b i 2   dla     i = 1 ,   2 ,   ,   n 2 .
As the forecasts estimated with the use of the above methods differ in terms of values, it was decided to use a combined forecast. This was a weighted average of individual forecasts derived from competing models [46]. An alternative to the traditional approach is to aggregate information from different forecasting methods by aggregating forecasts. This eliminates the problem of having to select a single method and relying exclusively on its forecasts [47]. A comprehensive overview of combined forecasts can be found in Mancuso and Werner [48].

3. Results and Discussion

For passenger air traffic in each of the countries analyzed, empirical data charts with a quarterly breakdown were created. On this basis, it was possible to make conclusions about the course of seasonal fluctuations. For all countries, the analysis showed that these are series with periodic fluctuations. The real-world data show a development trend with seasonality; therefore, the trend functions for each country were estimated (Table 2). The parameters of all the models set out in the table are statistically significant at the level of significance α = 0.05 .
After separating the trend function, the seasonality indicators for individual countries were determined (Table 3). In all cases, it was necessary to determine a correction factor.
In all countries, the seasonality indicators show a decrease in passenger numbers in the first and fourth quarters and an increase in passenger numbers in the second and third quarters. It is particularly visible in Spain and Greece, where only due to the seasonality in the third quarter the number of passengers increases by 14,961,153 passengers in Spain, and 10,766,726 passengers in Greece (Table 3). This is due to the holiday period in many countries of the world and the attractive tourist locations and development of Spain and Greece.
Based on the above seasonality indicators, Table 4 presents passenger traffic forecasts for particular quarters of 2020 and 2021. The results of the forecasts have been rounded to integers.
Another method used to build forecasts is the method of trends of the one-name periods. Table 5 presents the estimated trend models for individual periods with their adjustment to the real-world data.
Based on the above models, forecasts for individual quarters of the year 2020 and 2021 have been determined (Table 6).
Harmonic analysis models for individual countries contained one or two harmonics (in the case of The Netherlands), which significantly explained the variance of the studied variable. The model forms for individual countries, along with the percentage in which the included harmonics explain the variance of the studied variable, are presented in Table 7. In all models, the trend form was described by a linear function.
Passenger traffic forecasts obtained with the use of estimated harmonic analysis models are summarized in Table 8.
Table 9 includes a combined forecasts designated based on forecasts for individual quarters using method of seasonality indicators, one-name period trend method and harmonic analysis method.
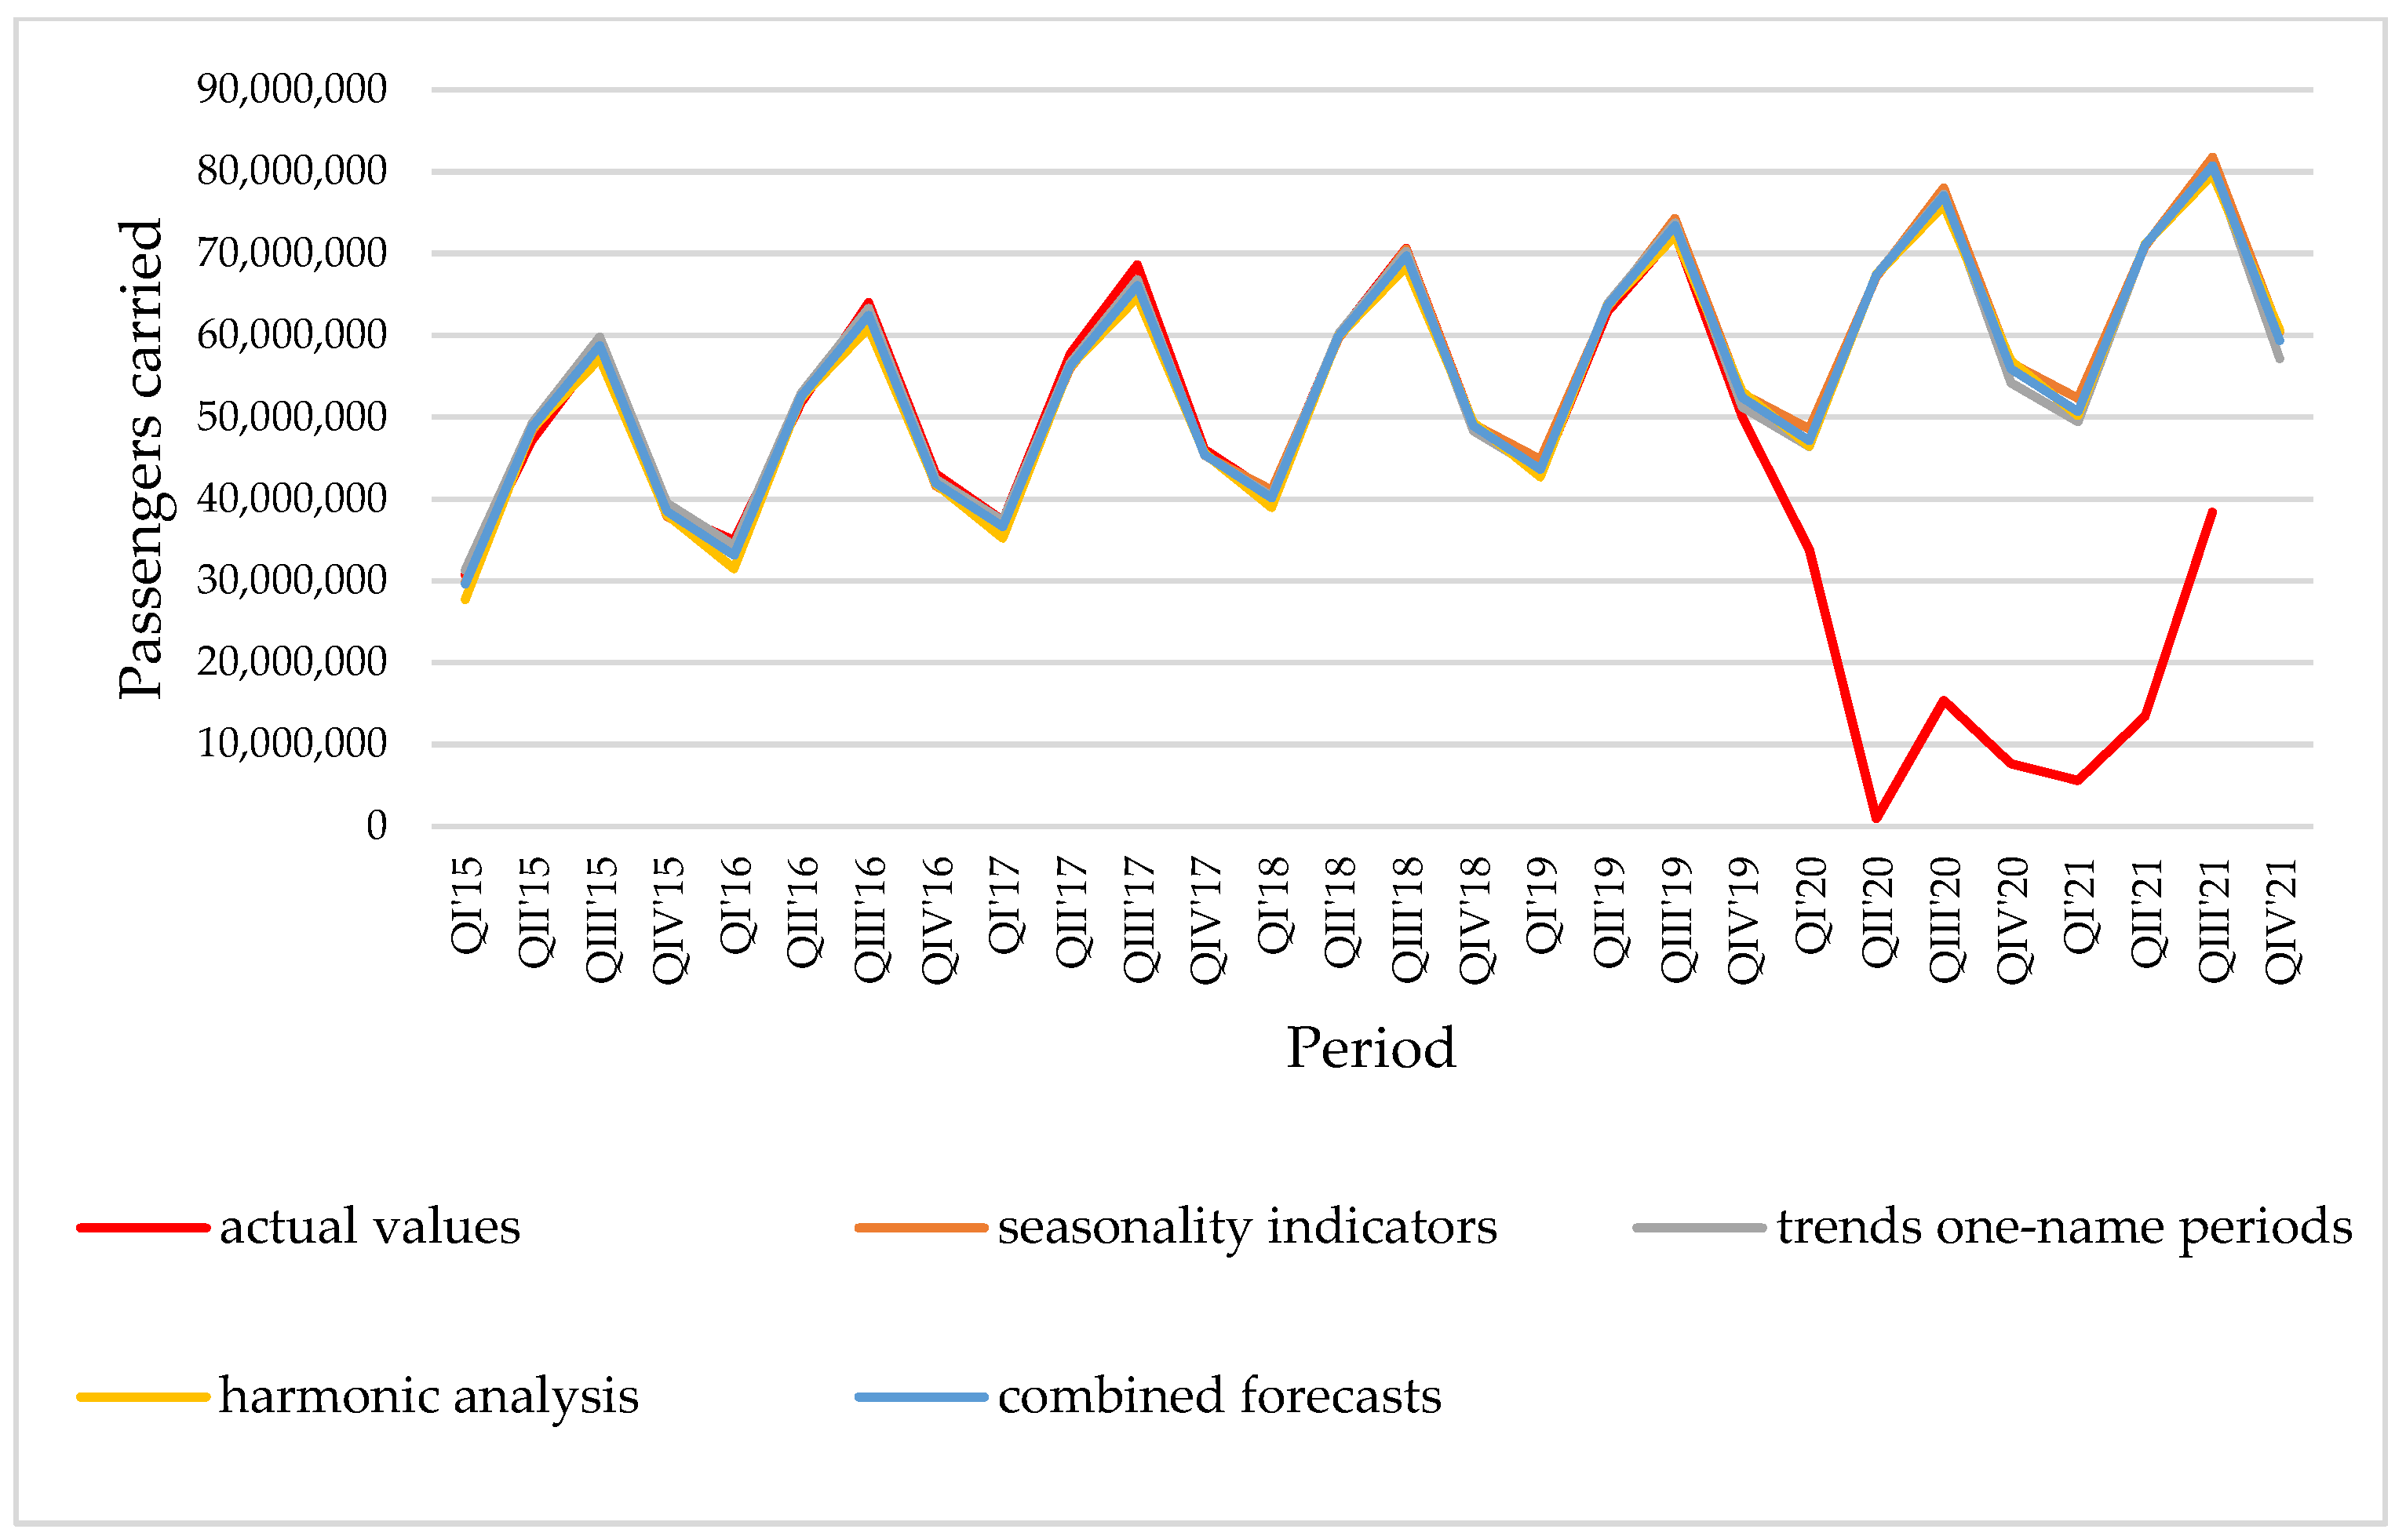
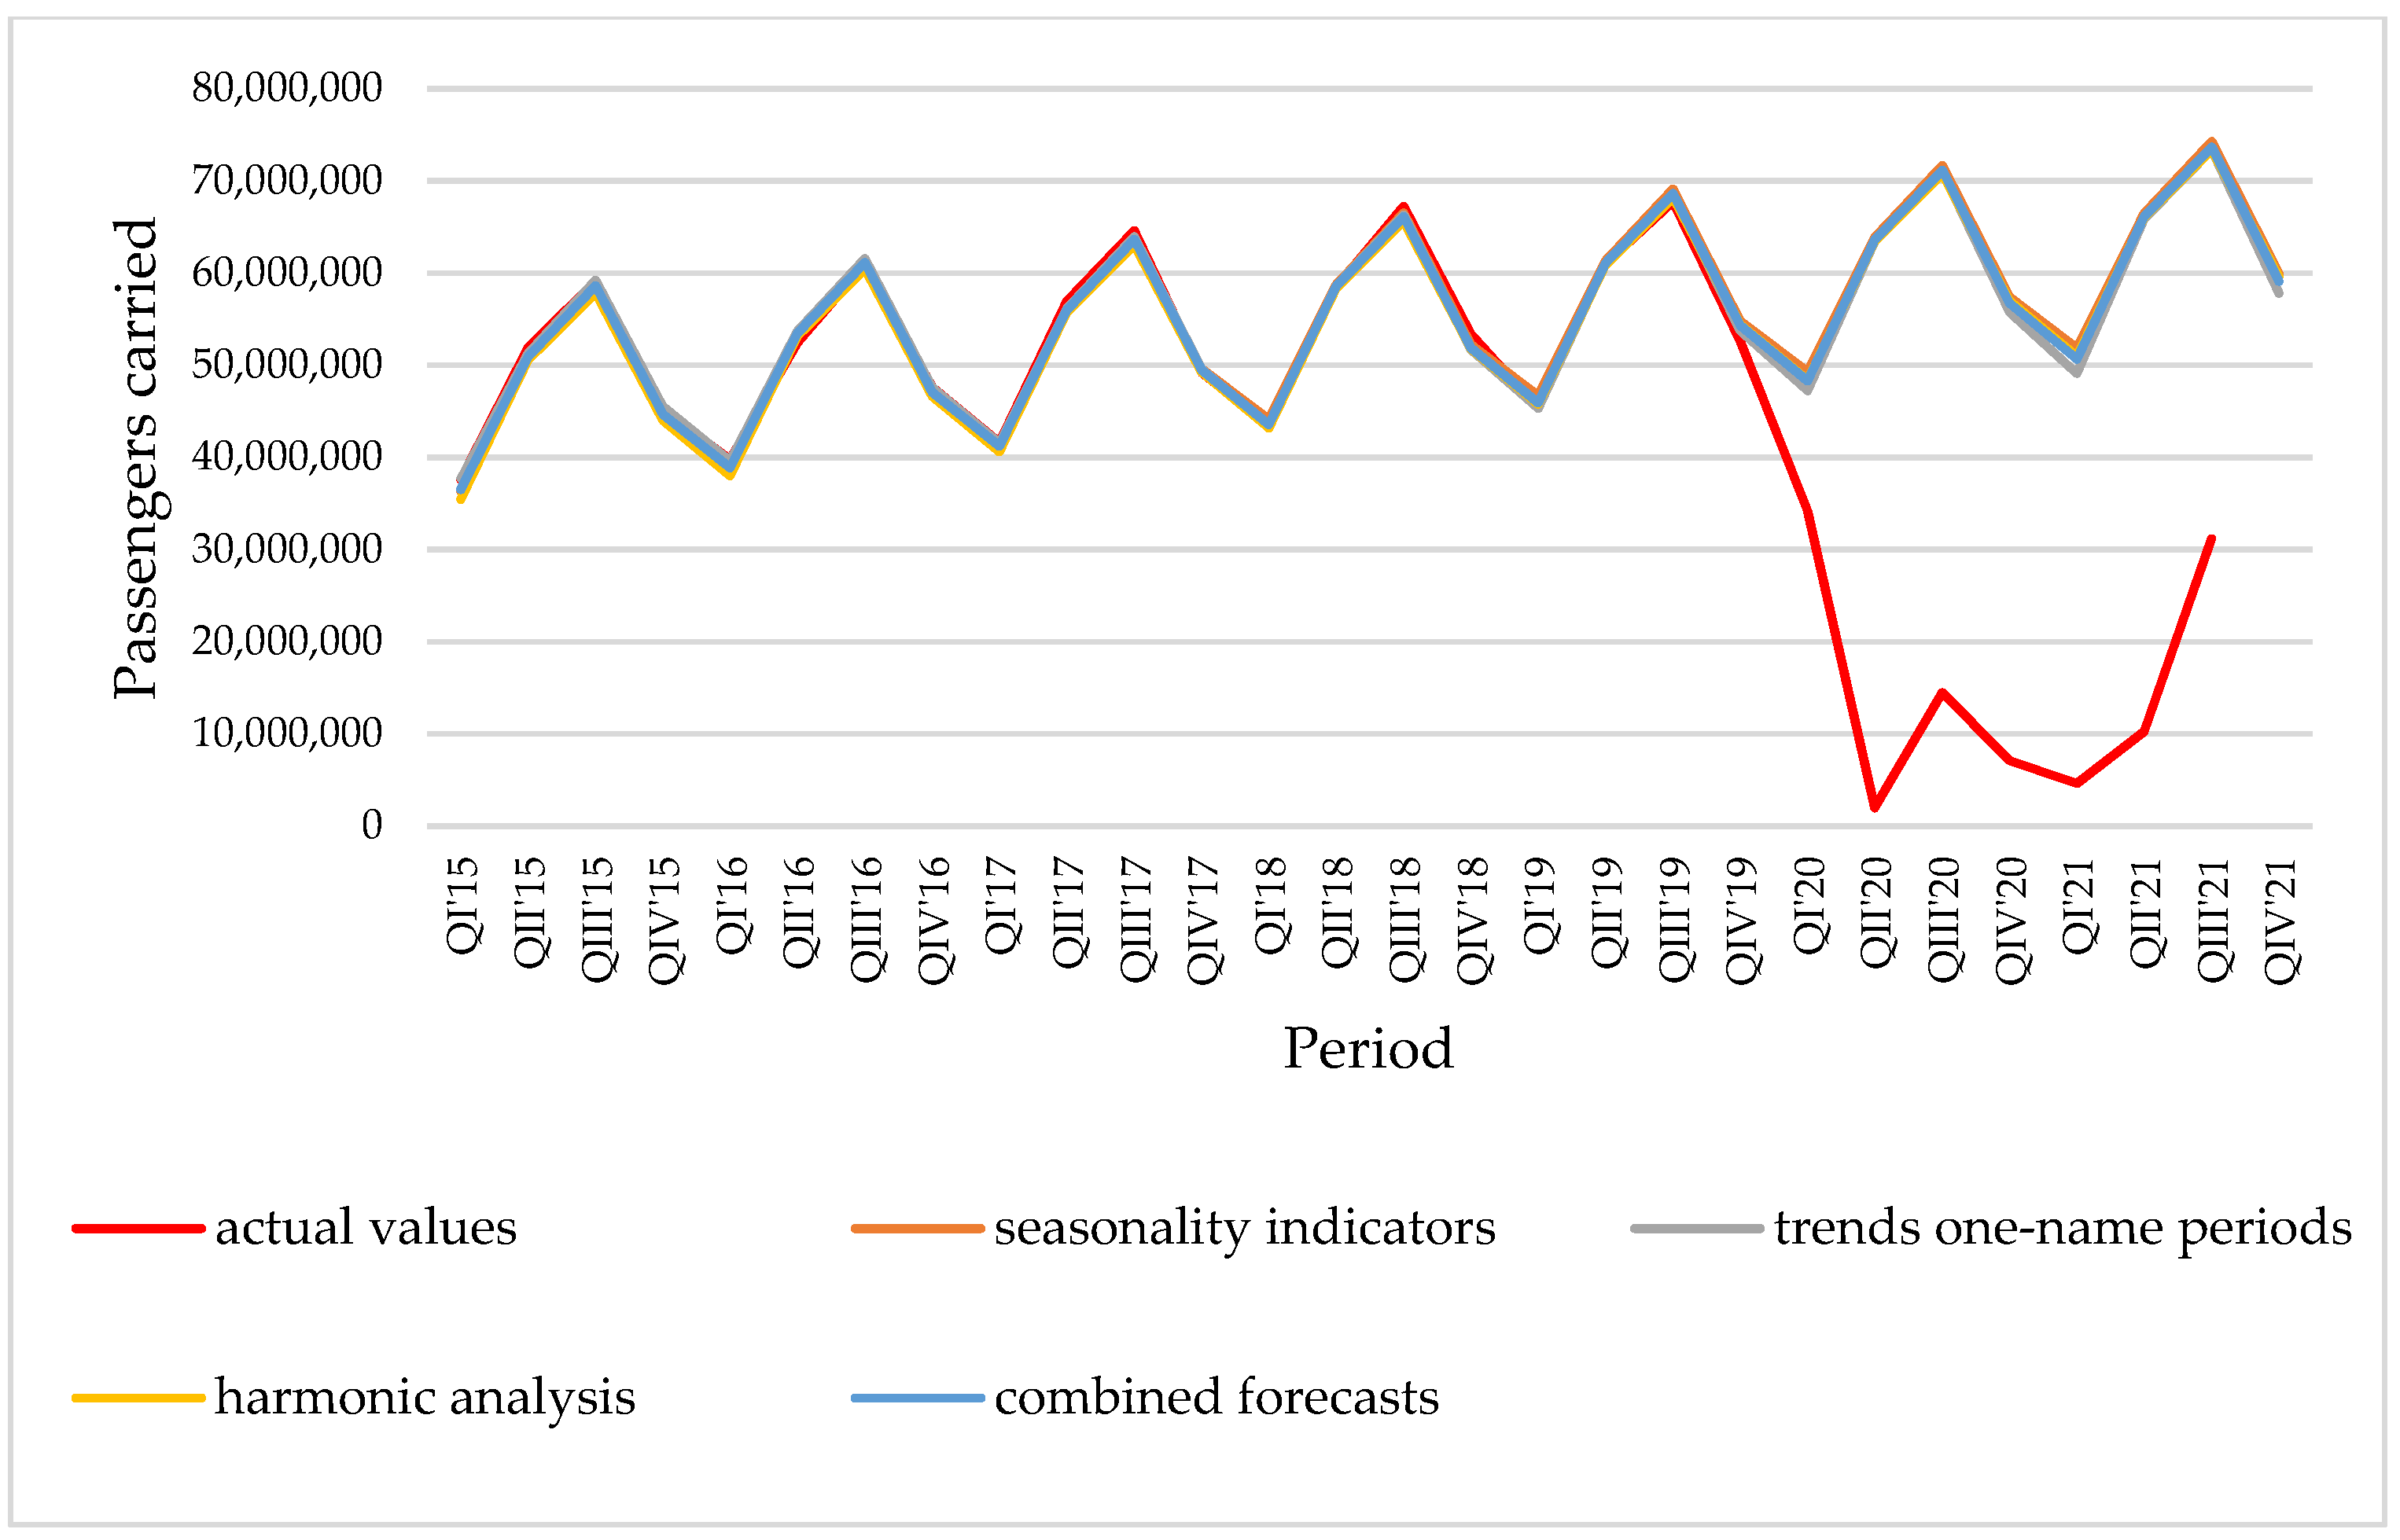
Figure 2, Figure 3, Figure 4, Figure 5, Figure 6, Figure 7, Figure 8, Figure 9 and Figure 10 presents the actual number of passengers at airports in the studied countries and the forecast values resulting from the models used.
In Figure 2, showing the modeling results for Spain, it shows that the empirical and theoretical values resulting from the models used to describe the number of passengers transported coincide to a very large extent. Only the values resulting from the harmonic analysis in the fourth quarters of 2015–2019 indicate a slight underestimation. For the period QIII’17, all the models used slightly underestimated the value of transported passengers. In the period for which the forecasts are built, i.e., QI’20–QIV’21, the greatest deviations are visible for the method of unnamed periods, which clearly forecasts the lowest values among all the methods used, especially for QIV’20 and QI’21.
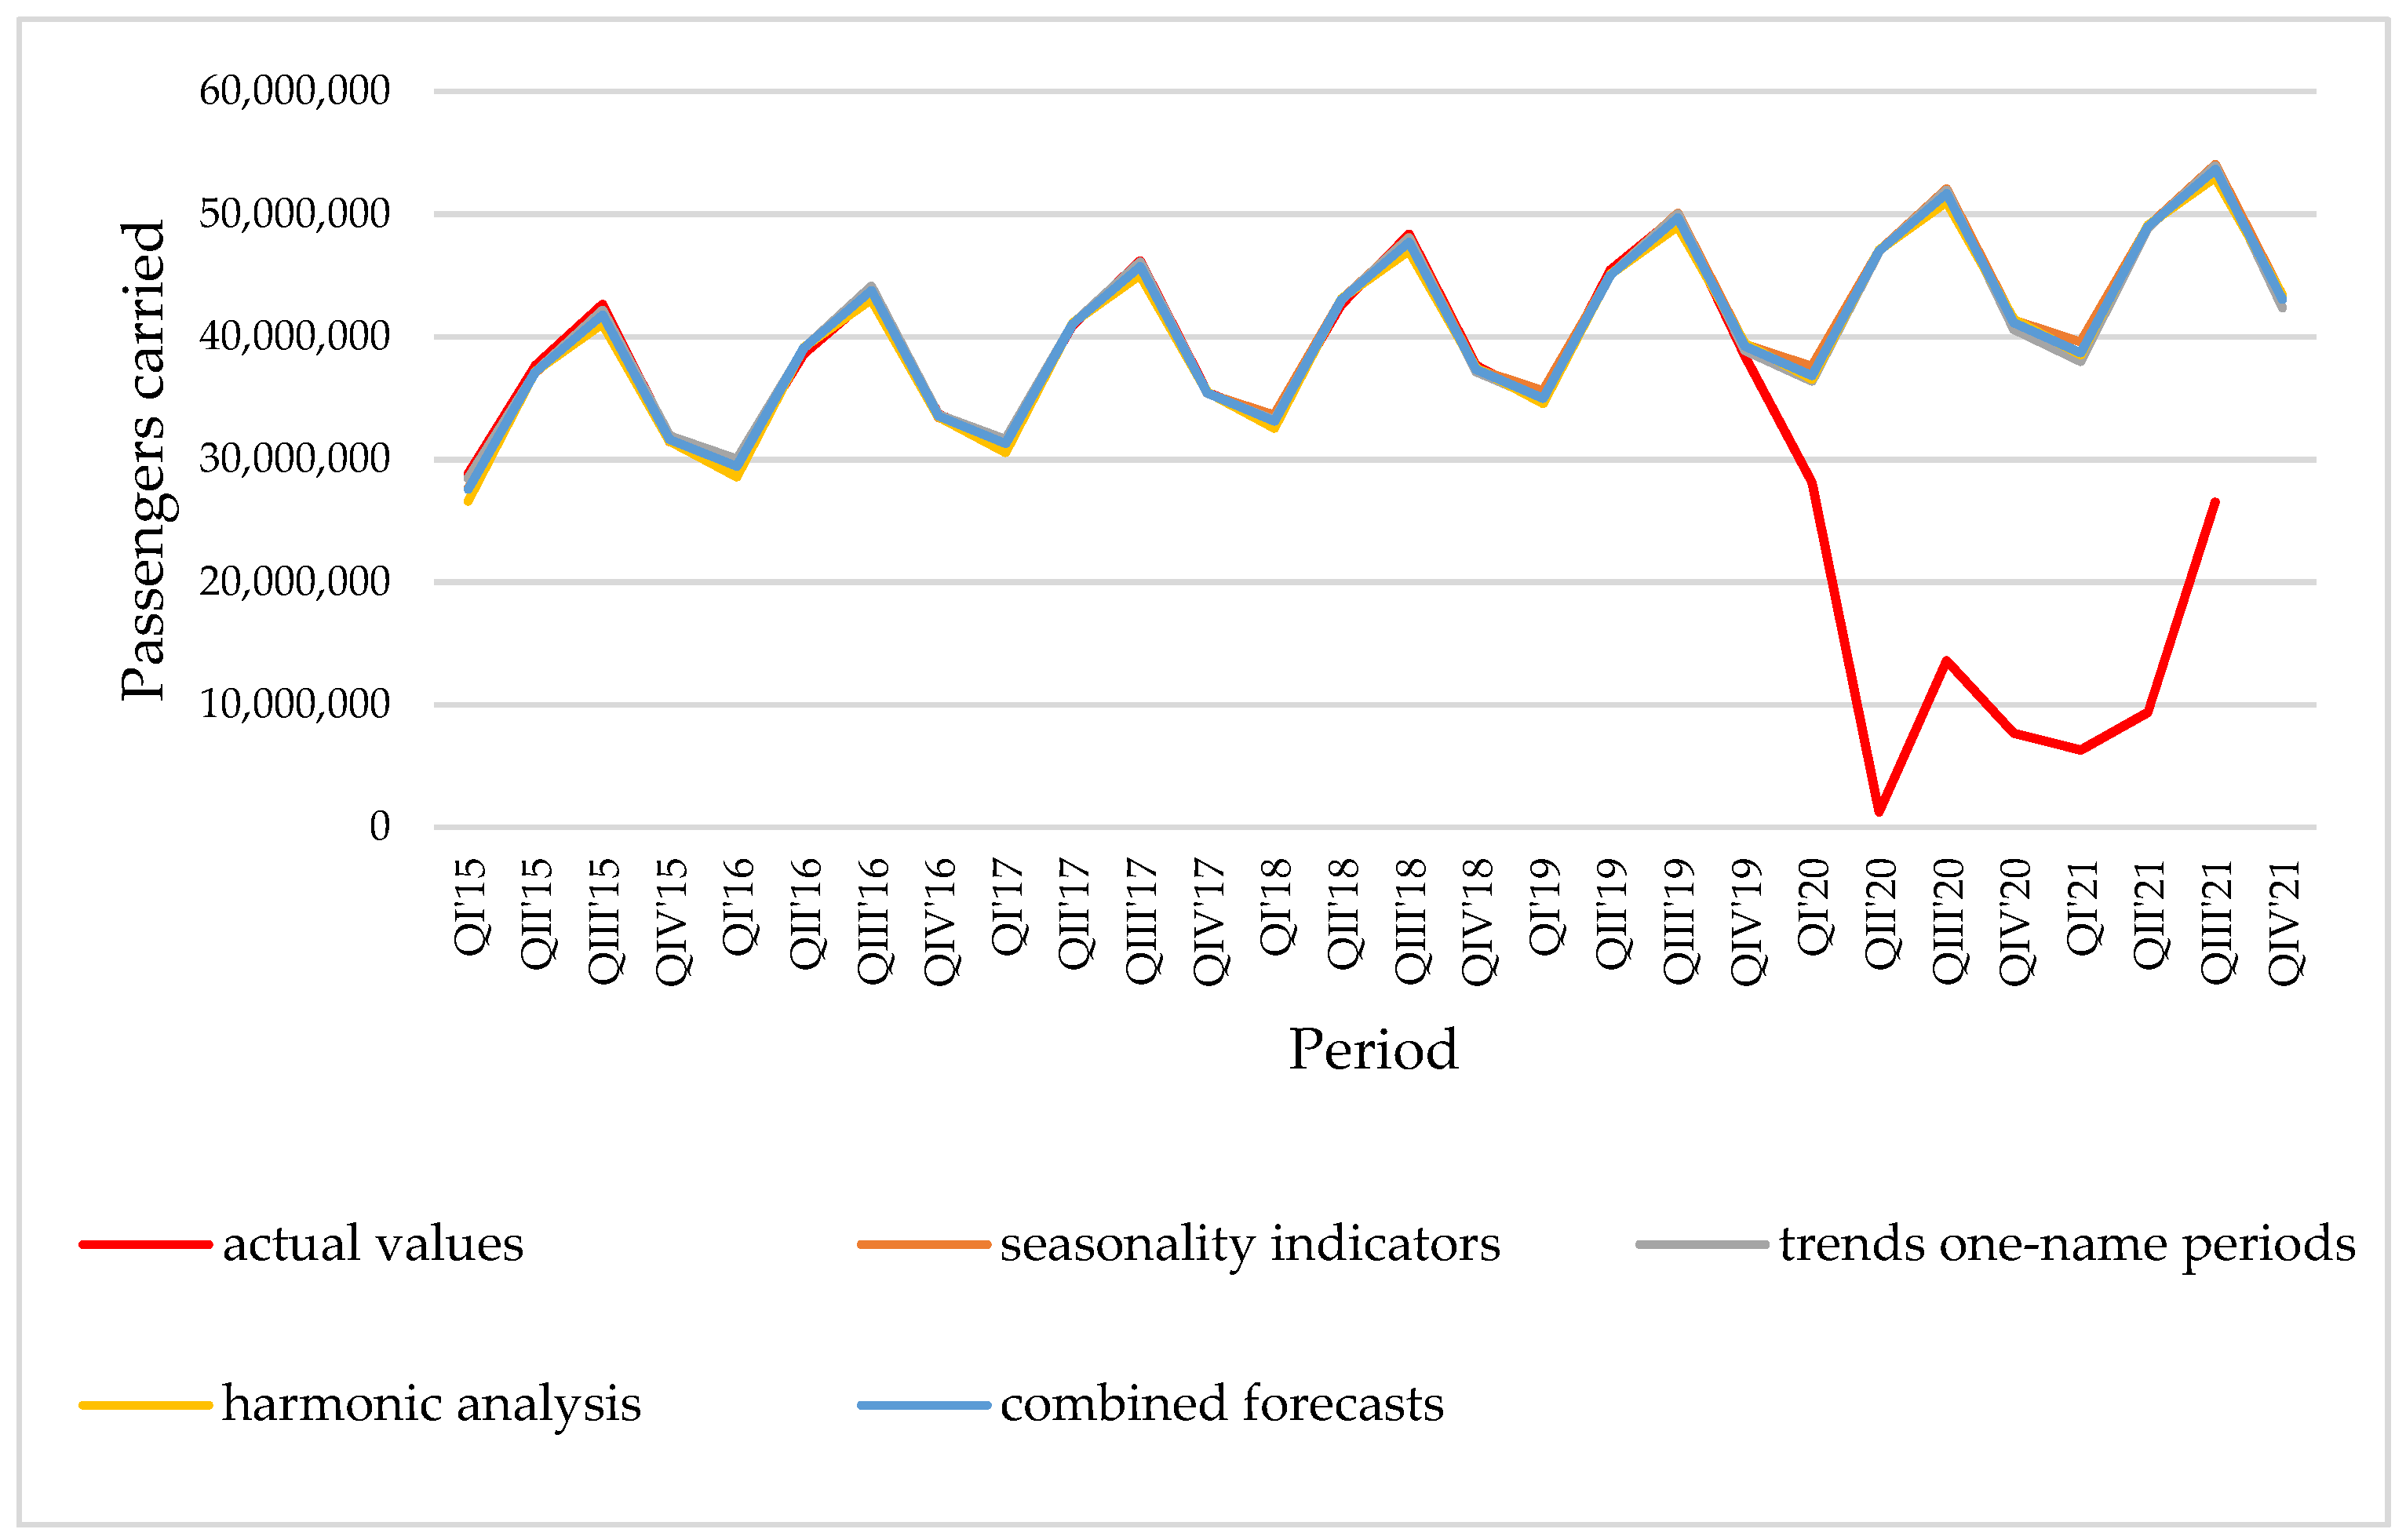
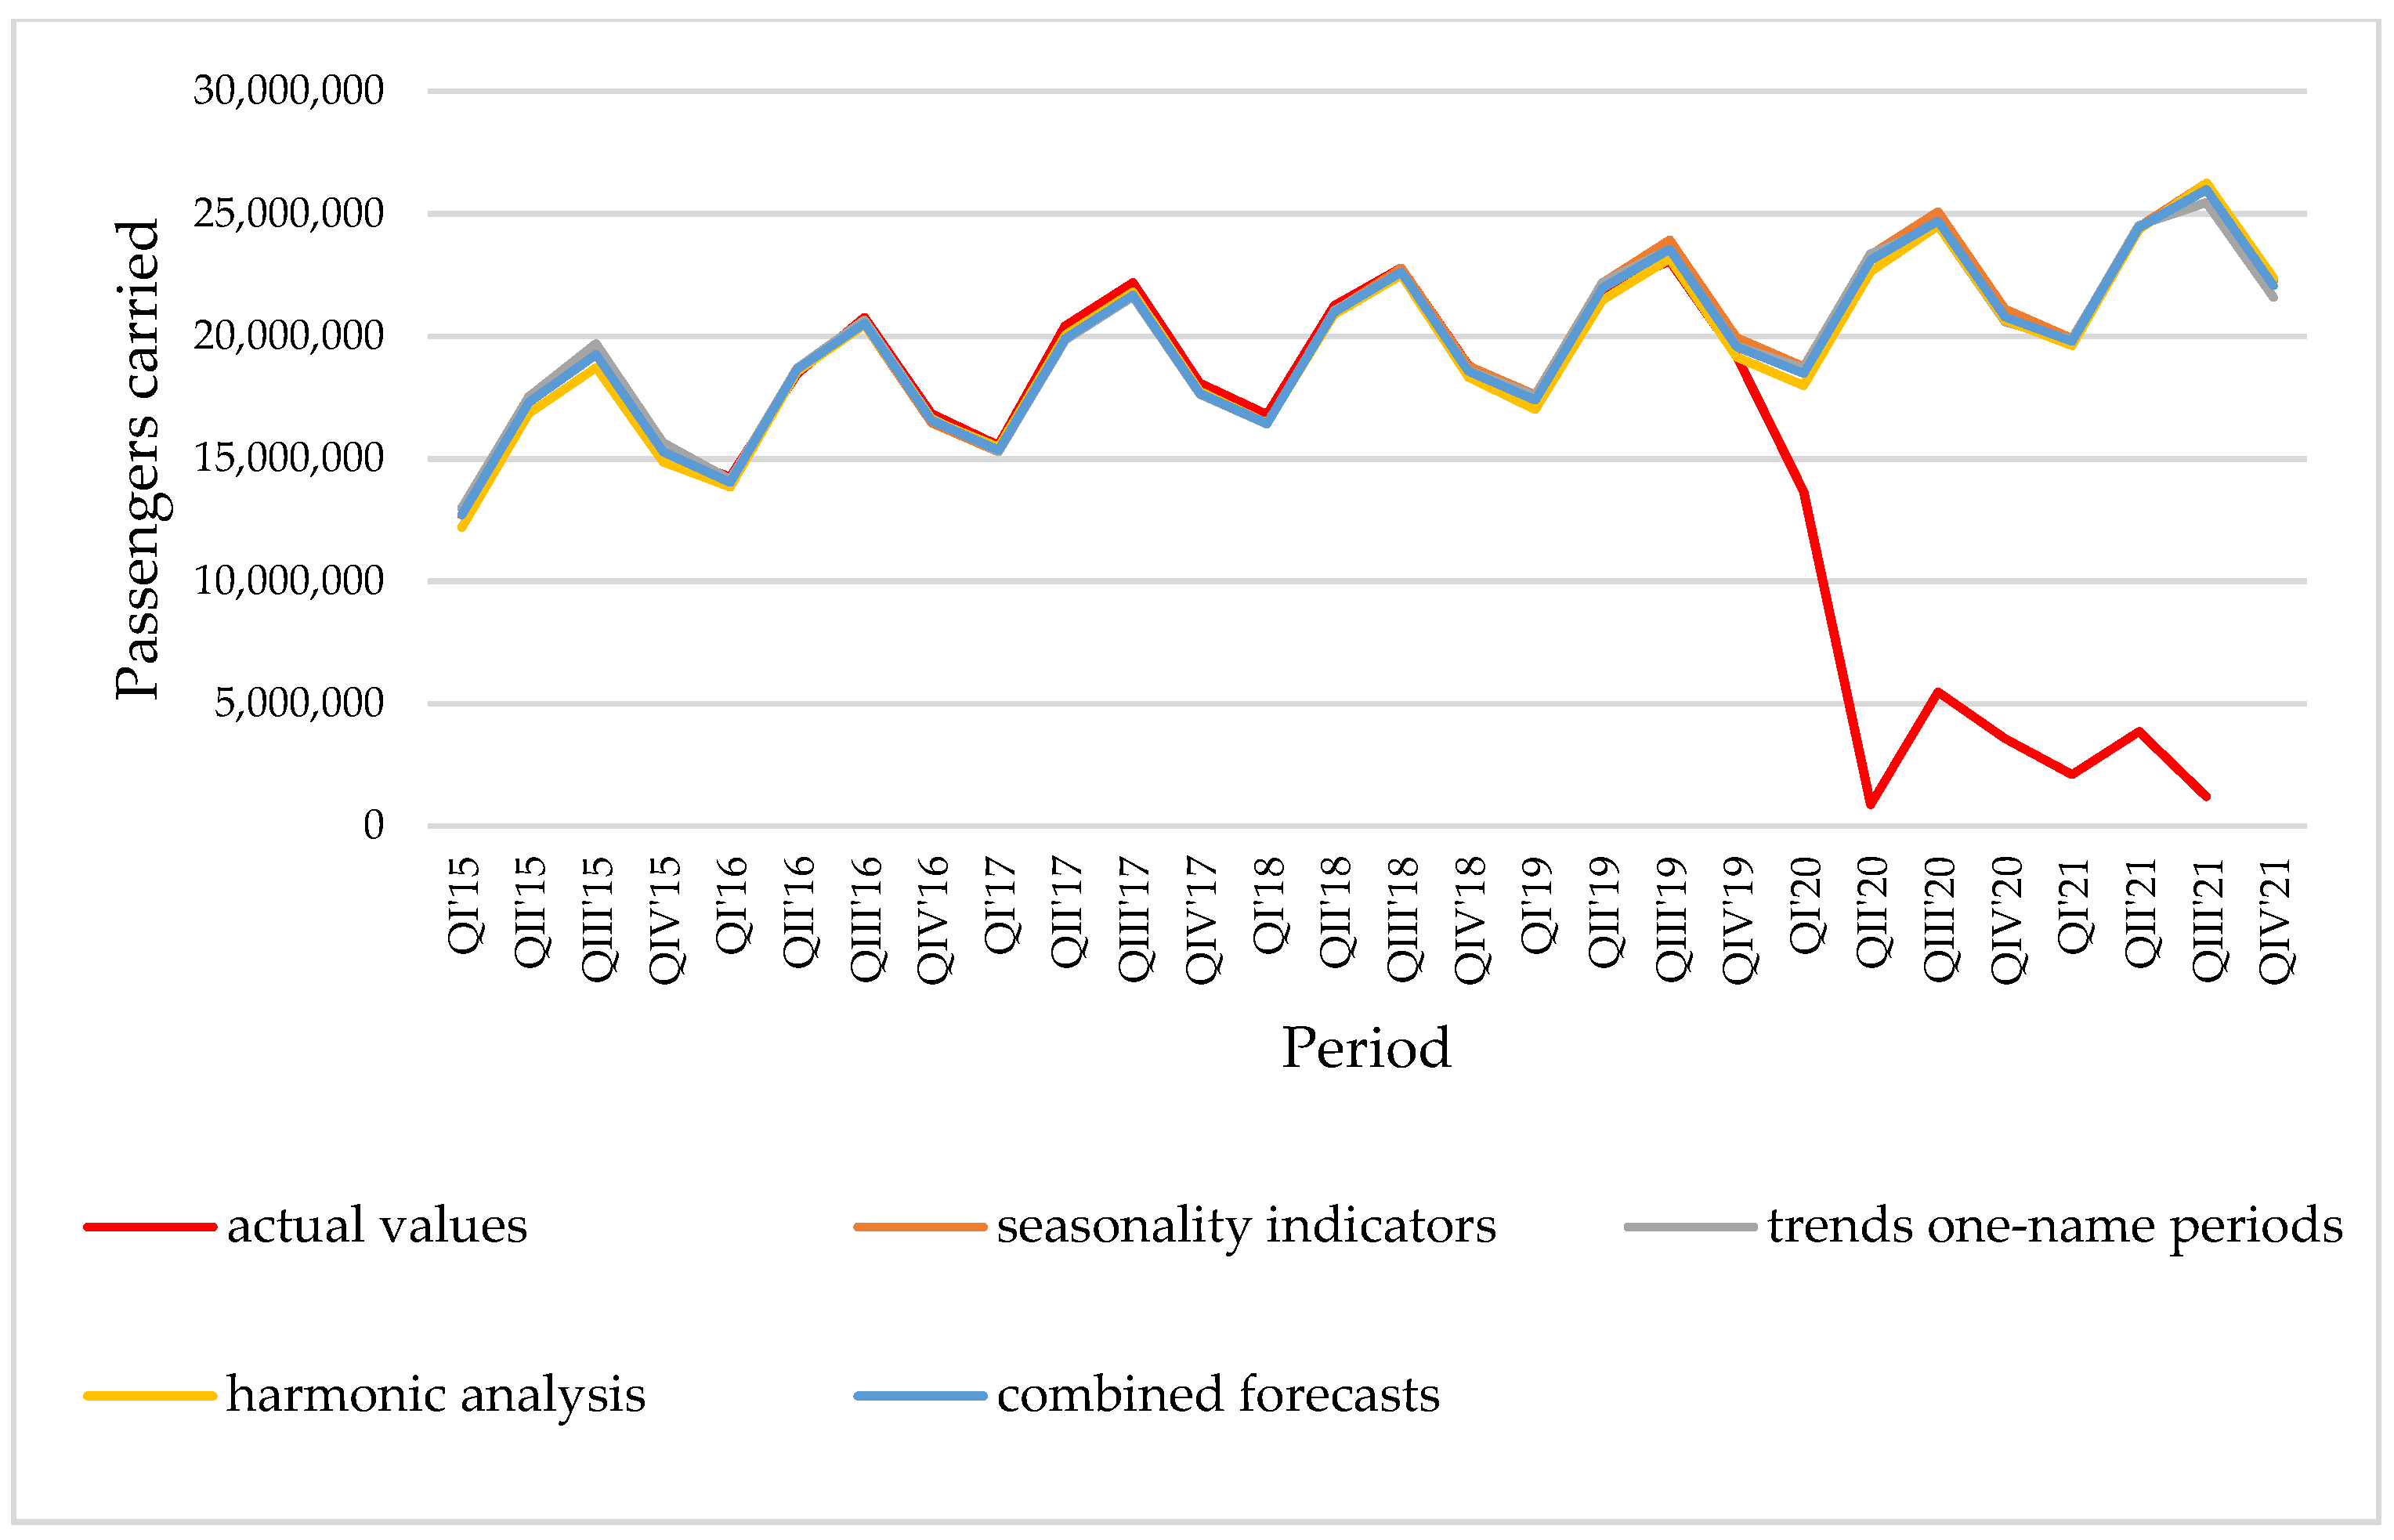
In the case of France, for which the empirical values, theoretical values resulting from the models used, and forecasts are shown in Figure 3, very similar conclusions can be observed as for Spain. Again, the harmonic analysis model does not estimate the number of passengers transported for QI’20–QIV’21, while in the forecast period (QI’20–QIV’21), the lowest values can be observed for the method of unanimous periods.
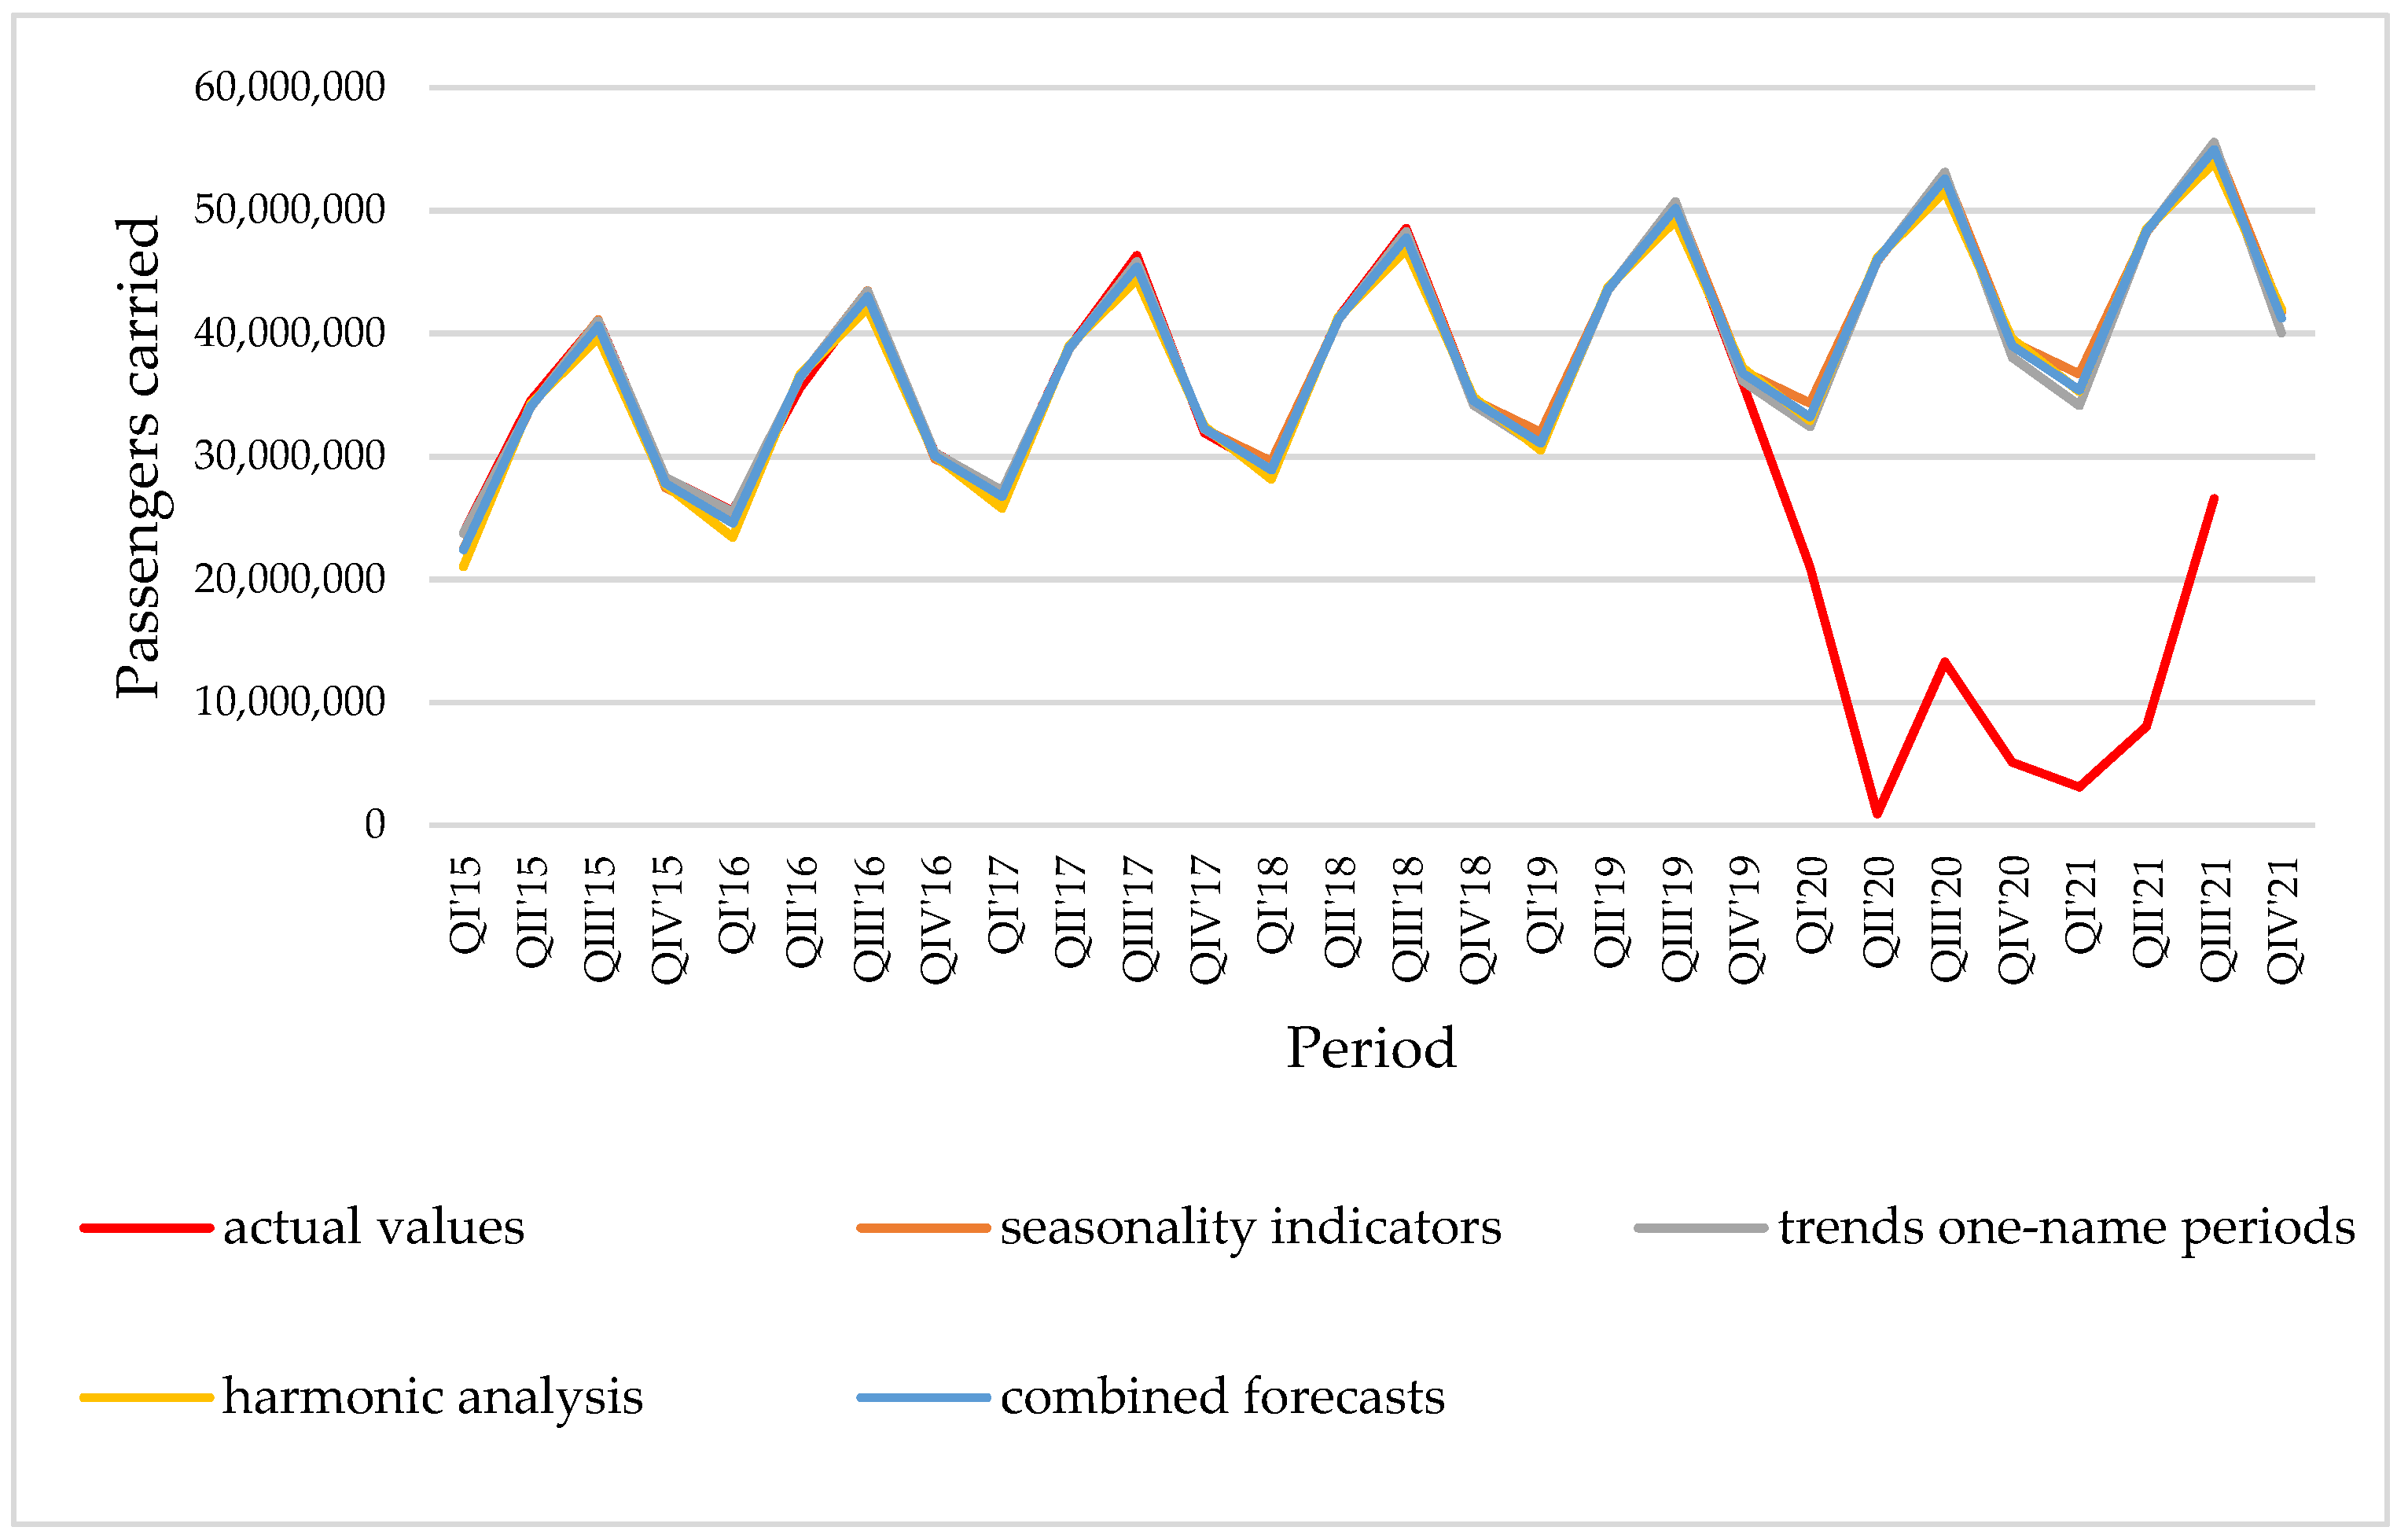
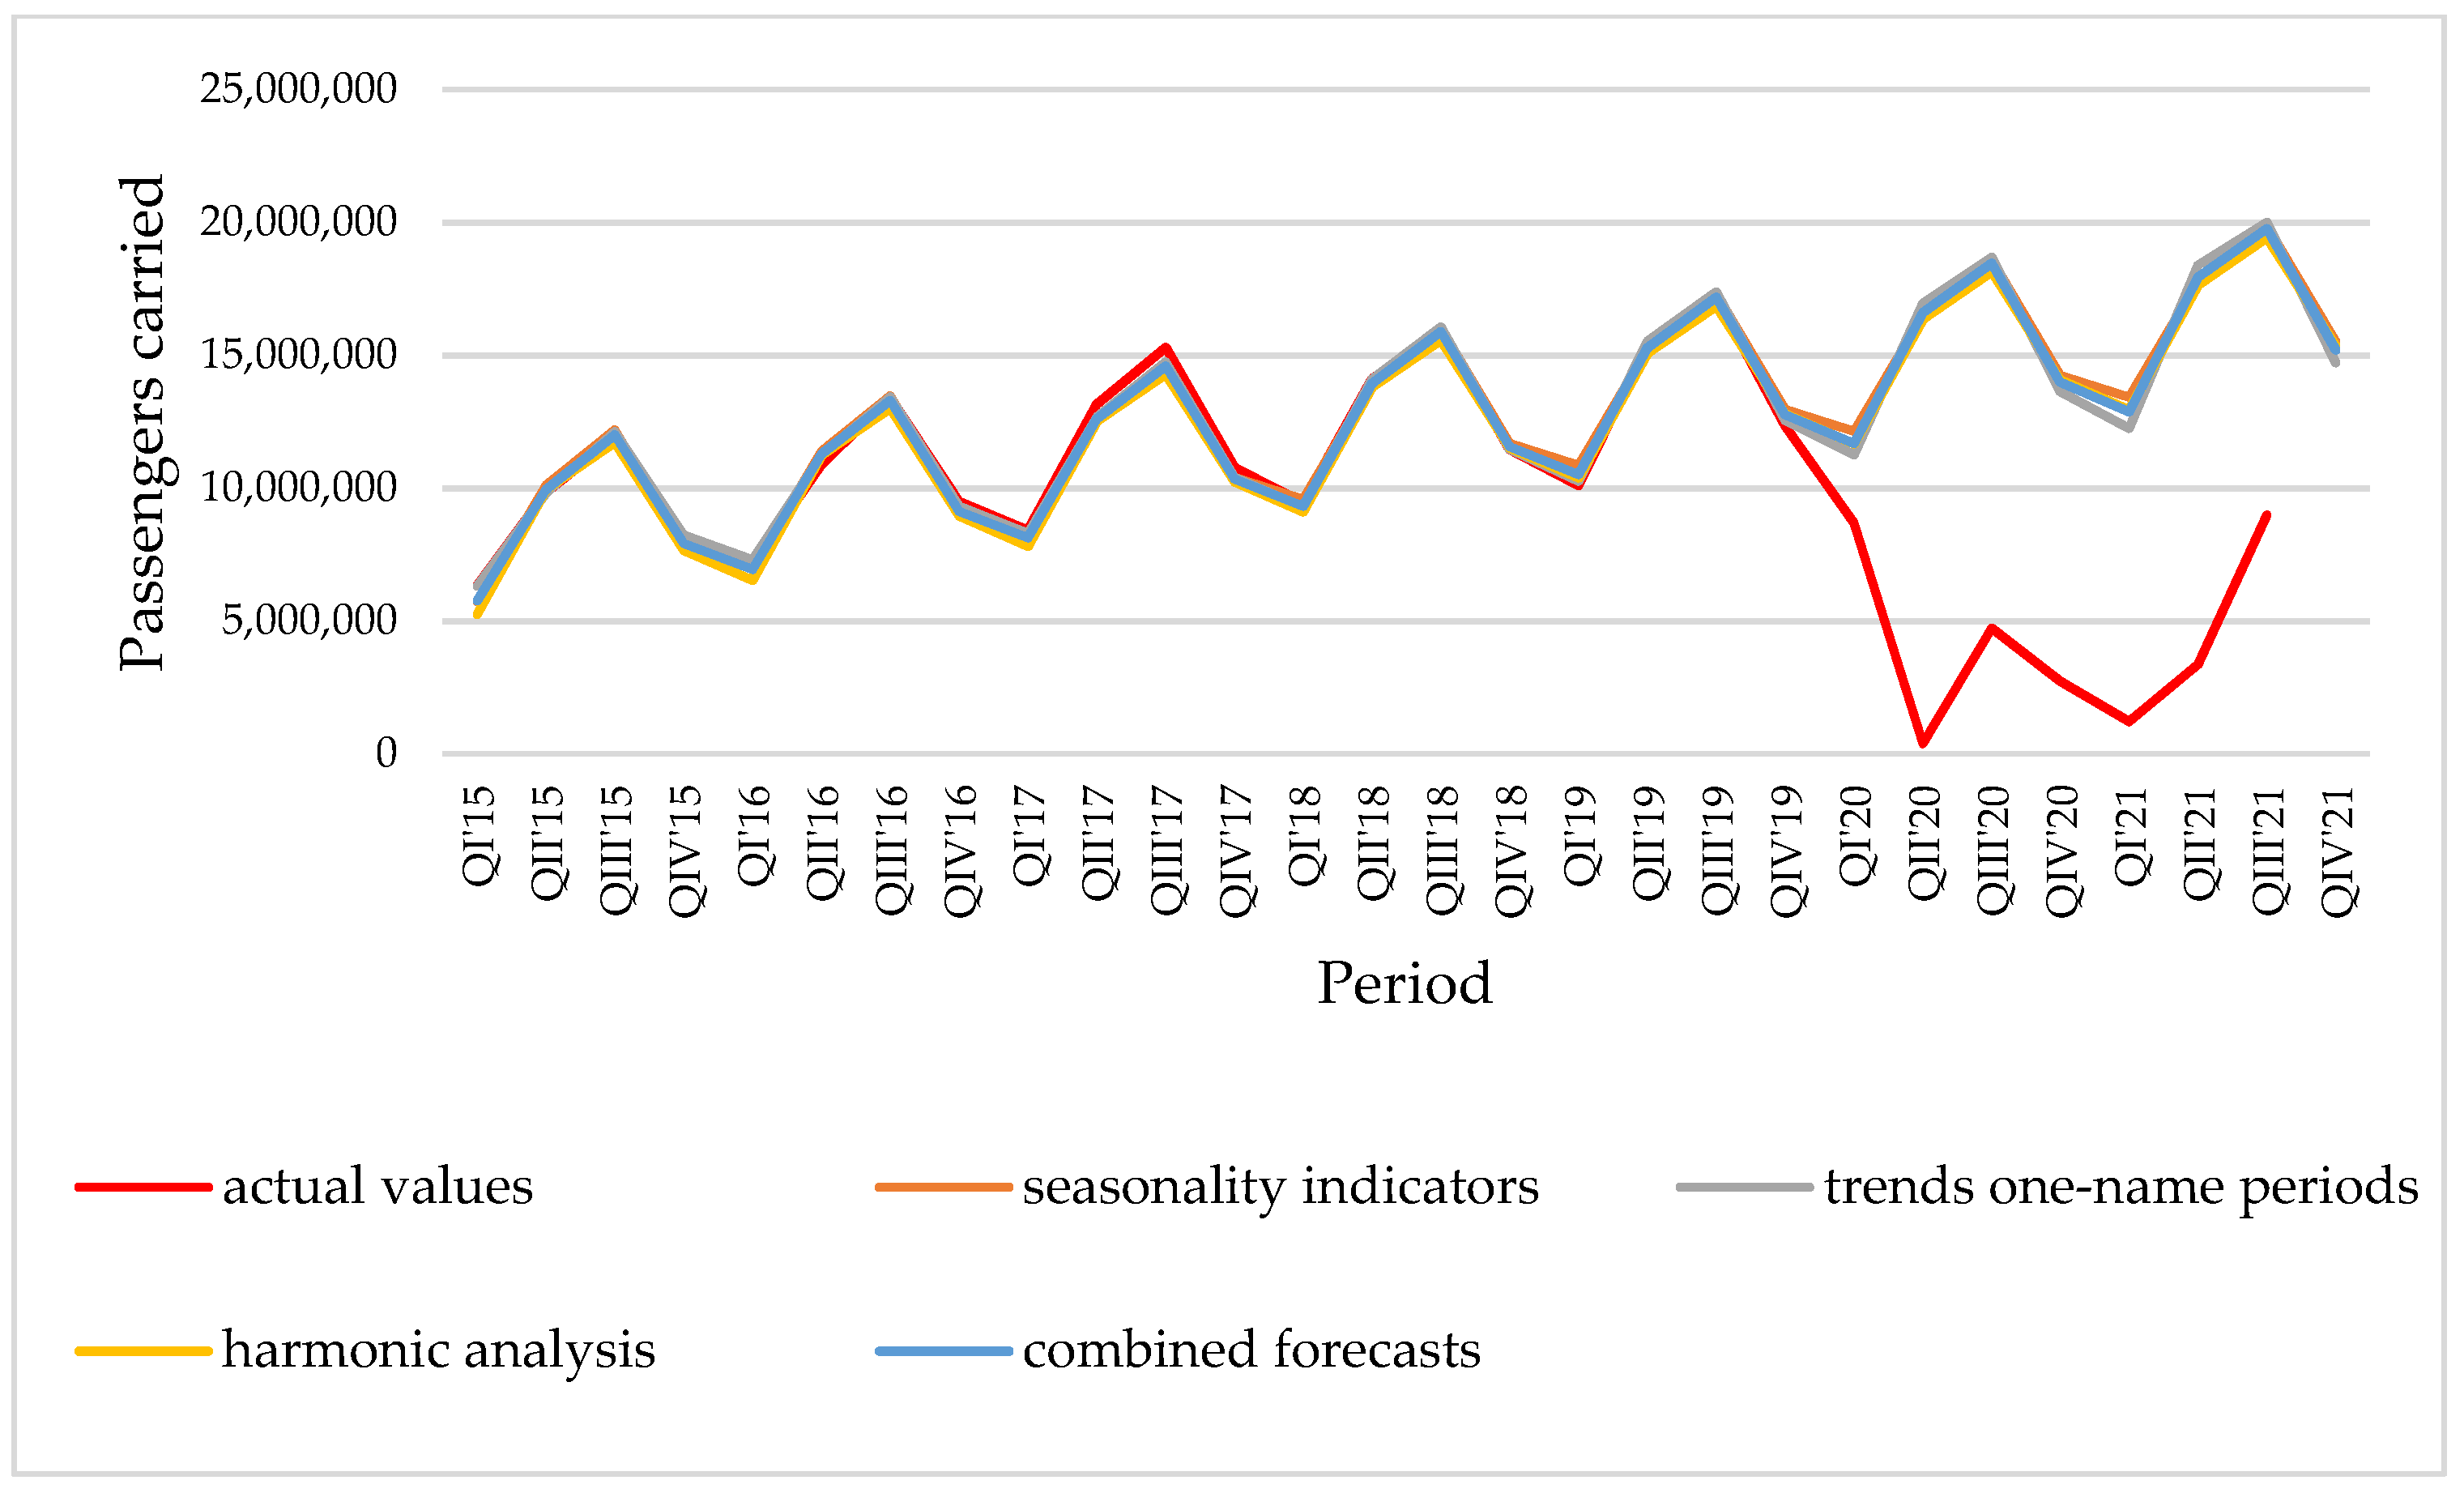
The observed empirical and theoretical values, as well as the forecasted passenger traffic, for Italy (Figure 4) again reveal the underestimation of the values resulting from the harmonic analysis model, especially for the periods QI’16, QI’17, and QI’18. In subsequent periods it is already closer to the empirical values. In the forecast period, however, the lowest values result, as in the above-mentioned cases, from the model of the same named periods.
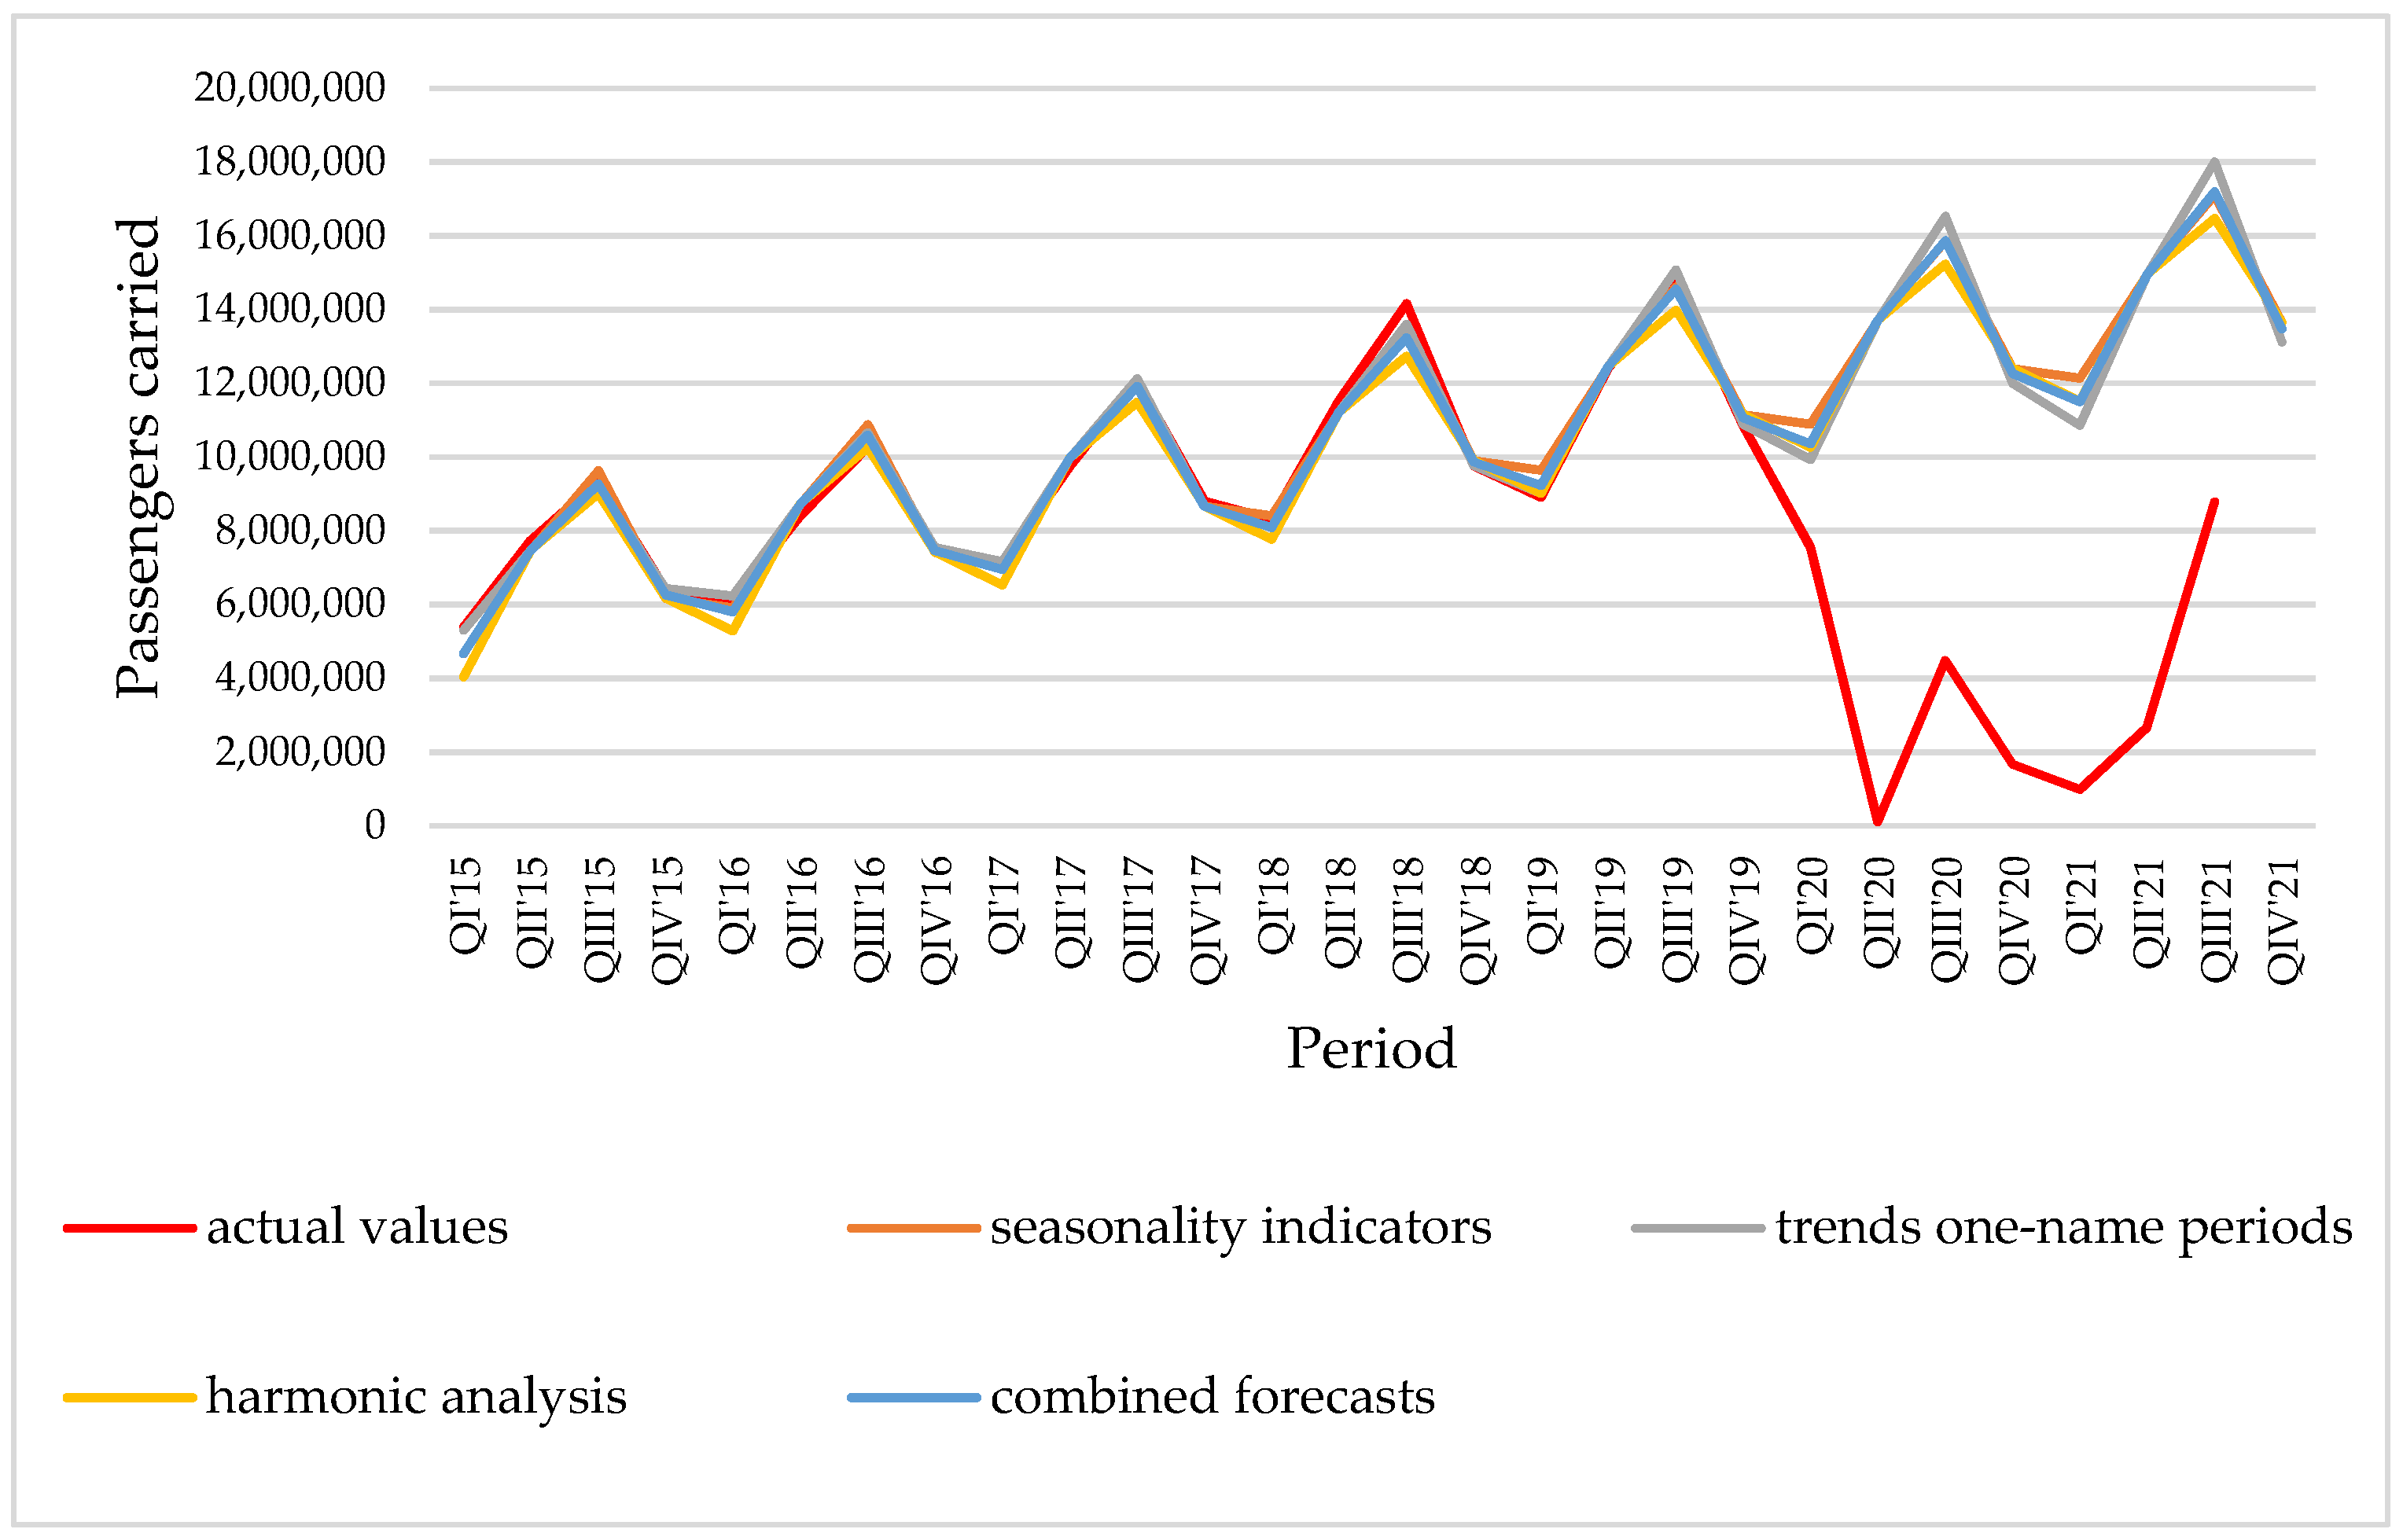
The analysis of the data in Figure 5 shows that for Germany in the period QI’15–QIV’19, all the models give very similar theoretical values for the number of passengers transported. However, in the forecast period QI’20–QIV’21, the differences between the values resulting from different models are slightly larger, especially for QI’21.
The analysis of the models presented in Figure 6 shows that for The Netherlands, the most underestimated values for the number of passengers are from the harmonic analysis model for the periods QI–QIV’15. Moreover, for QIII’17 it is of note that all the models used underestimated the empirical value. In the period forecasted for QI’20–QIII’20, the lowest values result from the harmonic analysis model; while for QII’21–QIII’21 the lowest values of the forecasted number of passengers again result from the model of identical periods.
Interesting conclusions can be drawn by observing the modeling results presented in Figure 7 for Portugal. What is most visible is the fact that in QIV’17, all theoretical values of the number of passengers transported are lower than the real values. On the other hand, for QI’19, all models overestimated the actual value of the number of passengers transported. In the forecast period, i.e., QI’20–QIV’21, the greatest discrepancies resulting from the models used are visible in QI’21.
The analysis of the charts for Ireland (Figure 8) shows a clear overestimation of the number of passengers transported in QI’16. In the forecast period, i.e., QI’20–QIV’21, the greatest discrepancies resulting from the models used are visible in QI’21.
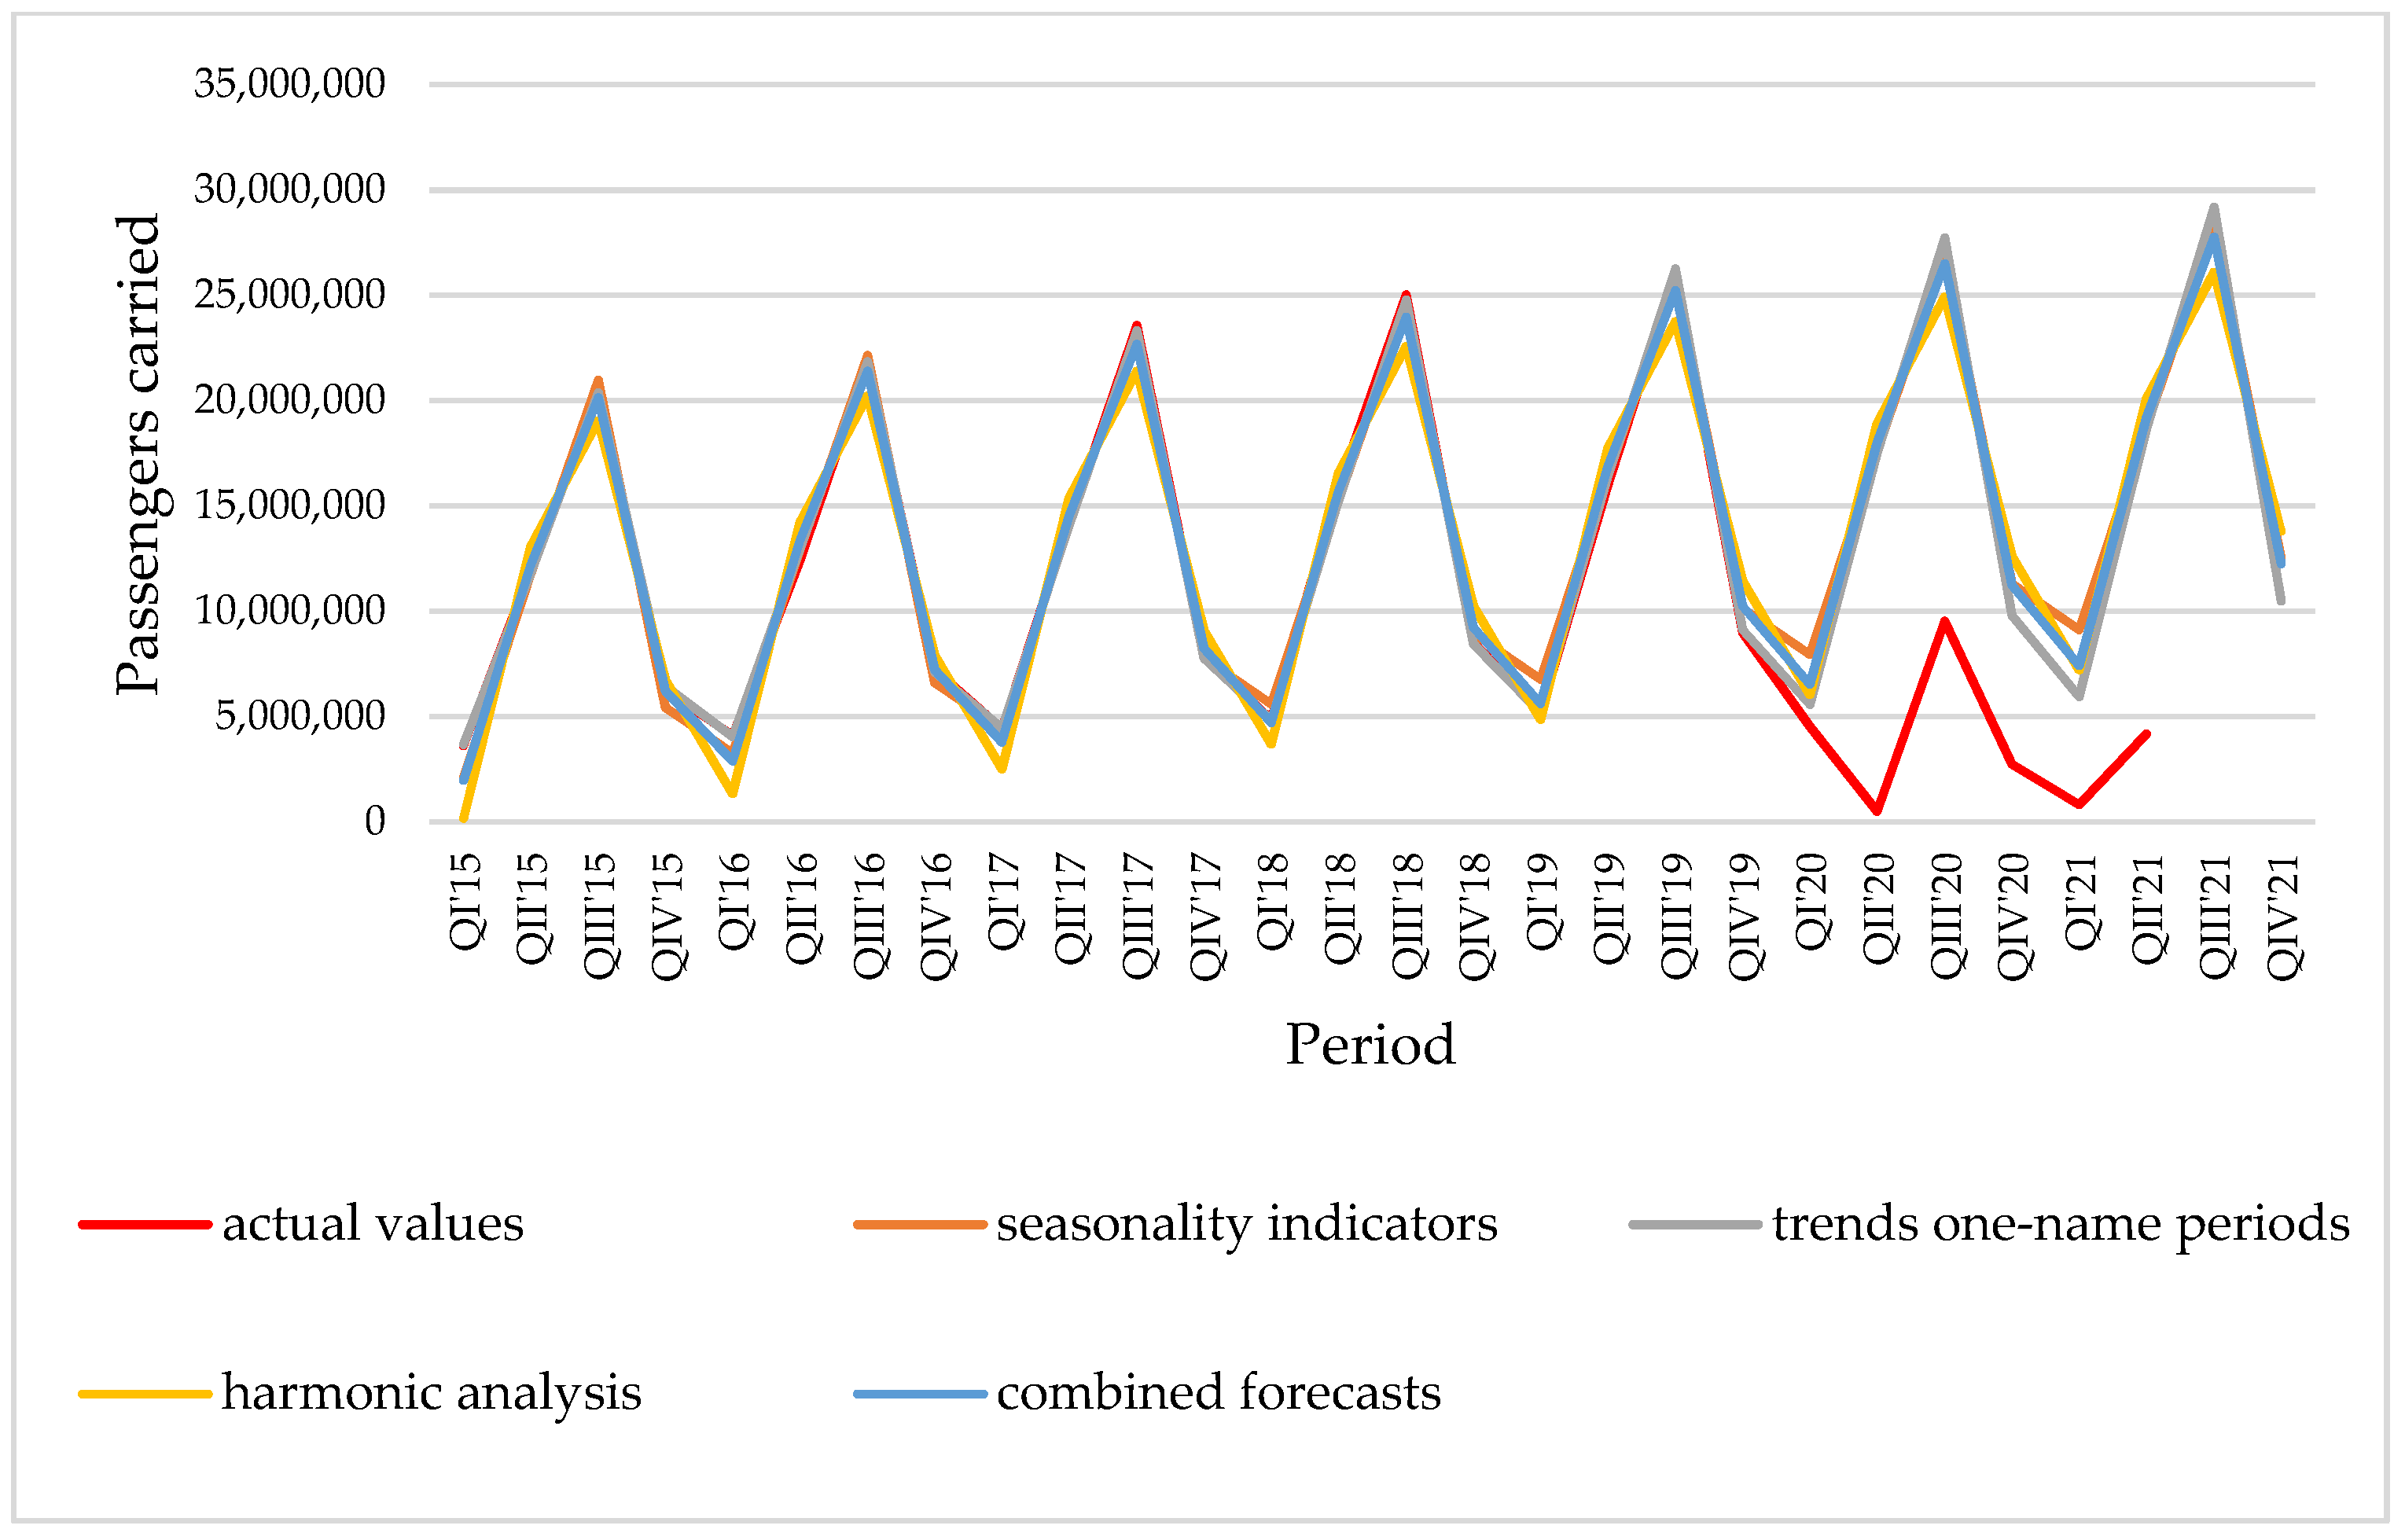
Poland is the case of the country in which the models used show the greatest discrepancies when it comes to indicating the actual value of the number of transported passengers. Even greater differences can be seen in the values over the forecasted period (Figure 9). In the period QI’15–QIII ‘18, and for QIII ‘19, the most underestimated number of transported passengers results from the harmonic analysis model. The period of the greatest differences was QIII’18, for which all the models underestimated the real value of passengers. In the forecast period (QI’20-Q’IV21), the greatest fluctuations in the number of passengers transported are revealed by the model of unanimous periods, in which the periods of the greatest drops, i.e., for QI’20 and QI’21, forecasts values clearly lower than other the models (and thus influences the value of the combined forecast by lowering it), and for the periods of the highest increases, i.e., QIII’20 and QIII’21, it forecasts the highest values among the models used.
A characteristic feature of Greece (Figure 10) is that the transition between the first and third quarters is very smooth (there is very little fluctuation in the second quarter). The harmonic analysis model was the worst at mapping this real development, while the other models managed to smoothly move from the value of the first quarter to the value of the third quarter, without showing a breakdown in the second quarter. In the forecast period, there are significant differences in the values of the number of transported passengers indicated by various models. For the periods of the greatest declines, i.e., QI’20 and QI’21, the lowest values result from the model of identical periods. However, at the same time, the same model shows the highest values in the periods of the greatest increases, i.e., Q’III20 and QIII’21.
In view of the forecasts for the individual quarters of 2020 and 2021, all models indicate a further upward trend, which could have been observed if the COVID-19 pandemic had not occurred. In fact, as a result of the pandemic, the number of passengers handled at the airports of the studied EU countries has significantly decreased. This was not surprising as it was the expected natural effect of the lockdown and other pandemic restrictions. The situation began to improve in the third quarter of 2021, which is visible as a reflection of the successive liberalization of pandemic restrictions. The only exception was The Netherlands, where a significant drop in the number of passengers handled was recorded. Unfortunately, data for the third quarter of 2021 are missing for Ireland and Greece.

4. Conclusions

The problem of the impact of the pandemic on transport has inspired many analyzes. The aim of our study was to estimate the difference between the number of passengers handled during the pandemic at the airports of selected EU countries and the demand forecast based on the pre-pandemic trend. The intention was to estimate the amount of air passenger losses caused by the pandemic. Countries such as Spain, Germany, France, and Italy have the greatest difference between the forecast and actual number of air passengers. The smallest difference was noted for Portugal and Greece. Liberalization of restrictions and the introduction of rules for air traffic during the pandemic in the surveyed countries resulted in an improvement in the situation of air transport in the third quarter of 2021, which was visible in the form of an increase in the number of passengers served. The only exception was The Netherlands, where a significant drop in the number of passengers was recorded.
Due to the decrease in the number of passengers, and thus the decrease in the number of flights, there were financial consequences for airports, along with their gastronomic and commercial infrastructure, which had implications in terms of employment. Thus, the interruption of air traffic and significant drops in the number of passengers compared to the period before the pandemic had negative economic effects not only for entities from the aviation industry, but also for entire supply chains associated with this industry. The loss of staff during a temporary stop and limitation of the aviation sector activity may lead to a very long period of rebuilding the teams of employees in the phase of rebuilding the volume of passenger transport. It should be noted, however, that it is not possible to estimate the exact losses due to the lack of access to data on the revenues of these entities per passenger. This was a limitation in our research. Therefore, the article focused on the presentation of the dynamics of the demand for passenger transport before the pandemic, and on the forecast of demand in the absence of the pandemic. A positive consequence of the reduction in the number of air transport flights is the reduction in the negative environmental impact. This is a holistic way of thinking—reducing the negative impact on the environment by airplanes and ports and reducing the negative impact on the journey to and from airports, mainly carried out by road transport.
Apart from those already indicated in the research, there were also other limitations. One such limitation was the fact that in the case of Ireland and Greece, no data was available for the third quarter of 2021.
The performed analysis can serve as the basis for another research. It is worth continuing the forecasts for the coming years to see when the situation will normalize, and when air traffic will enter the pre-pandemic trends.
Our analyzes can also be compared with other modes of transport, e.g., with rail transport, to find out in which mode the drops in serviced passengers were greater, i.e., which branch of transport turned out to be more sensitive to the pandemic.

Author Contributions

Conceptualization, A.B., I.D. and D.R.; methodology, A.B. and D.R.; software, A.B. and D.R.; validation, A.B., I.D., D.R. and K.S.-D.; formal analysis, A.B., I.D., D.R. and K.S.-D.; investigation, A.B., I.D., D.R. and K.S.-D.; resources, A.B., I.D., D.R. and K.S.-D.; data curation, A.B. and D.R.; writing—original draft preparation, A.B., I.D., D.R. and K.S.-D.; writing—review and editing, A.B., I.D., D.R. and K.S.-D.; visualization, A.B., I.D., D.R. and K.S.-D.; supervision, I.D. and K.S.-D. All authors have read and agreed to the published version of the manuscript.

Funding

This research received no external funding.

Institutional Review Board Statement

Not applicable.

Informed Consent Statement

Not applicable.

Data Availability Statement

Not applicable.

Conflicts of Interest

The authors declare no conflict of interest.

References

  1. Coronavirus Disease 2019 (COVID-19). Available online: https://emedicine.medscape.com/article/2500114-overview#a1 (accessed on 15 January 2022).
  2. Gallegos, A. WHO Declares Public Health Emergency for Novel Coronavirus. 2020. Available online: https://www.medscape.com/viewarticle/924596 (accessed on 15 January 2022).
  3. Ramzy, A.; McNeil, D.G. WHO Declares Global Emergency as Wuhan Coronavirus Spreads. The New York Times. 2020. Available online: https://www.nytimes.com/2020/01/30/health/coronavirus-world-health-organization.html (accessed on 15 January 2022).
  4. Cucinotta, D.; Vanelli, M. WHO Declares COVID-19 a Pandemic. Acta Biomed. 2020, 91, 157–160. [Google Scholar] [CrossRef] [PubMed]
  5. Thompson, R. Pandemic potential of 2019-nCoV. Lancet Infect Dis. 2020, 20, 280. [Google Scholar] [CrossRef] [Green Version]
  6. Kupferschmidt, K.; Cohen, J. Will novel virus go pandemic or be contained? Science 2020, 367, 610–611. [Google Scholar] [CrossRef] [PubMed] [Green Version]
  7. Jones, L.; Palumbo, D.; Brown, D. Coronavirus: How the Pandemic Has Changed the World Economy. Available online: https://www.bbc.com/news/business-51706225 (accessed on 15 January 2022).
  8. Jackson, J.K.; Weiss, M.A.; Schwarzenberg, A.B.; Nelson, R.M.; Sutter, K.M.; Sutherland, M.D. Global Economic Effects of COVID-19. Congressional Research Service. 2021. Available online: https://crsreports.congress.gov/search/#/?termsToSearch=Global%20Economic%20Effects%20of%20COVID-19&orderBy=Relevance (accessed on 15 January 2022).
  9. Canton, E.; Colasanti, F.; Durán, J.; Garrone, M.; Hobza, A.; Simons, W.; Vandeplas, A. The Sectoral Impact of the COVID-19 Crisis. European Commission, Brussels. 3 March 2021. Available online: https://ec.europa.eu/info/publications/sectoral-impact-covid-19-crisis-unprecedented-and-atypical-crisis_en (accessed on 15 January 2022).
  10. Itoa, H.; Lee, D. Assessing the impact of the September 11 terrorist attacks on U.S. airline demand. J. Econ. Bus. 2005, 57, 75–95. [Google Scholar] [CrossRef] [PubMed]
  11. Williams, G. Will Europe’s charter carriers be replaced by ‘no-frills’ scheduled airlines? J. Air Transp. Manag. 2001, 7, 277–286. [Google Scholar] [CrossRef]
  12. Alderighi, M.; Cento, A. European airlines conduct after September 11. J. Air Transp. Manag. 2004, 10, 97–107. [Google Scholar] [CrossRef]
  13. Lechner, P.; Tupper, A.; Guffanti, M.; Loughlin, S.; Casadevall, T. Volcanic Ash and Aviation—The Challenges of Real-Time, Global Communication of a Natural Hazard. In Observing the Volcano World. Advances in Volcanology; An Official Book Series of the International Association of Volcanology and Chemistry of the Earth’s Interior—IAVCEI, Barcelona, Spain; Fearnley, C.J., Bird, D.K., Haynes, K., McGuire, W.J., Jolly, G., Eds.; Springer: Cham, Switzerland, 2017. [Google Scholar] [CrossRef] [Green Version]
  14. Macário, R.; Van de Voorde, E. The Impact of the Economic Crisis on the Eu Air Transport Sector; Directorate General for Internal Policies Policy Department B: Structural and Cohesion Policies Transport and Tourism; European Parliament’s Committee on Transport and Tourism: Brussels, Belgium, 2009; Available online: http://www.europarl.europa.eu/studies (accessed on 21 January 2022).
  15. Franke, M.; John, F. What comes next after recession?—Airline industry scenarios and potential end games. J. Air Transp. Manag. 2011, 17, 19–26. [Google Scholar] [CrossRef]
  16. McGowan, F.; Seabright, P.; Breyer, S.; Encaoua, D. Deregulating European Airlines. Econ. Policy 1992, 4, 283–344. [Google Scholar] [CrossRef]
  17. Air transport liberalization in the European union: An assessment. Reg. Stud. 1997, 31, 807–812. [CrossRef]
  18. Button, K. Deregulation and Liberalization of European Air Transport Markets, Innovation. Eur. J. Soc. Sci. Res. 2001, 14, 255–275. [Google Scholar] [CrossRef]
  19. Dembińska-Cyran, I. Ekspansja tanich linii lotniczych w Polsce stymulatorem rozwoju regionalnych portów lotniczych. Zeszyty Naukowe. Probl. Transp. Logistyki 2006, 5, 43–51. [Google Scholar]
  20. De Neufville, R. Low-Cost Airports for Low-Cost Airlines: Flexible Design to Manage the Risks. Transp. Plan. Technol. 2008, 31, 35–68. [Google Scholar] [CrossRef] [Green Version]
  21. Upham, P.; Thomas, C.; Gillingwater, D.; Raper, D. Environmental capacity and airport operations: Current issues and future prospects. J. Air Transp. Manag. 2003, 9, 145–151. [Google Scholar] [CrossRef]
  22. Linden, E. Pandemics and environmental shocks: What aviation managers should learn from COVID-19 long-term planning. J. Air Transp. Manag. 2020, 90, 101944. [Google Scholar] [CrossRef]
  23. Henke, I.; Esposito, M.; della Corte, V.; del Gaudio, G.; Pagliara, F. Airport Efficiency Analysis in Europe Including User Satisfaction: A Non-Parametric Analysis with DEA Approach. Sustainability 2022, 14, 283. [Google Scholar] [CrossRef]
  24. Suau-Sanchez, P.; Voltes-Dorta, A.; Cuguero-Escofet, N. An early assessment of the impact of COVID-19 on air transport: Just another crisis or the end of aviation as we know it? J. Transp. Geogr. 2020, 86, 102749. [Google Scholar] [CrossRef]
  25. Sun, X.; Wandelt, S.; Zhang, A. How did COVID-19 impact air transportation? A first peek through the lens of complex networks. J. Air Transp. Manag. 2020, 89, 101928. [Google Scholar] [CrossRef]
  26. Christidis, P.; Christodoulou, A. The predictive capacity of air travel patterns during the global spread of the COVID-19 pandemic: Risk, uncertainty and randomness. Int. J. Environ. Res. Public Health 2020, 17, 3356. [Google Scholar] [CrossRef]
  27. Iacus, S.M.; Natale, F.; Santamaria, C.; Spyratos, S.; Vespe, M. Estimating and projecting air passenger traffic during the COVID-19 coronavirus outbreak and its socio-economic impact. Saf. Sci. 2020, 129, 104791. [Google Scholar] [CrossRef]
  28. Sobieralski, J.B. COVID-19 and airline employment: Insights from historical uncertainty shocks to the industry. Transp. Res. Interdiscip. Perspect. 2020, 5, 100123. [Google Scholar] [CrossRef]
  29. Amankwah-Amoah, J.; Khan, Z.; Osabutey, E.L.C. COVID-19 and business renewal: Lessons and insights from the global airline industry. Int. Bus. Rev. 2021, 30, 101802. [Google Scholar] [CrossRef]
  30. Linfeng, Z.; Hangjun, Y.; Kun, W.; Lei, B.; Xian, Z. The impact of COVID-19 on airline passenger travel behavior: An exploratory analysis on the Chinese aviation market. J. Air Transp. Manag. 2021, 95, 102084. [Google Scholar] [CrossRef]
  31. Sun, X.; Wandelt, S.; Zheng, C.; Zhang, A. COVID-19 pandemic and air transportation: Successfully navigating the paper hurricane. J. Air Transp. Manag. 2021, 94, 102062. [Google Scholar] [CrossRef]
  32. Nižetić, S. Impact of coronavirus (COVID-19) pandemic on air transport mobility, energy, and environment: A case study. Int. J. Energy Res. 2020, 44, 10953–10961. [Google Scholar] [CrossRef]
  33. Strauss, A.T.; Cartier, D.; Gunning, B.A.; Boyarsky, B.J.; Snyder, J.; Segev, D.L.; Roush, M.; Massie, A.B. Impact of the COVID-19 pandemic on commercial airlines in the United States and implications for the kidney transplant community. Am. J. Transplant. 2020, 20, 3123–3130. [Google Scholar] [CrossRef]
  34. Budd, L.; Ison, S.; Adrienne, N. European airline response to the COVID-19 pandemic—Contraction, consolidation and future considerations for airline business and management. Res. Transp. Bus. Manag. 2020, 37, 100578. [Google Scholar] [CrossRef]
  35. Gallego, I.; Font, X. Changes in air passenger demand as a result of the COVID-19 crisis: Using Big Data to inform tourism policy. J. Sustain. Tour. 2020, 29, 1470–1489. [Google Scholar] [CrossRef]
  36. Lew, A.A.; Cheer, J.M.; Haywood, M.; Brouder, P.; Salazar, N.B. Visions of travel and tourism after the global COVID-19 transformation of 2020. Tour. Geogr. 2020, 22, 455–466. [Google Scholar] [CrossRef]
  37. Gudmundsson, S.V.; Cattaneo, M.; Redondi, R. Forecasting temporal world recovery in air transport markets in the presence of large economic shocks: The case of COVID-19. J. Air Transp. Manag. 2021, 91, 102007. [Google Scholar] [CrossRef]
  38. Xu, S.; Chan, H.K.; Zhang, T. Forecasting the demand of the aviation industry using hybrid time series SARIMA-SVR approach. Transp. Res. Part E Logist. Transp. Rev. 2019, 122, 169–180. [Google Scholar] [CrossRef]
  39. The Impact of COVID-19 on the Airport Business—And the Path to Recovery. 1 November 2021. Available online: https://aci.aero/2021/11/01/the-impact-of-covid-19-on-the-airport-business-and-the-path-to-recovery-3/ (accessed on 15 January 2022).
  40. Bouwer, J.; Saxon, S.; Wittkamp, N. Back to the Future? Airline Sector Poised for Change Post-COVID-19. 2 April 2021. Available online: https://www.mckinsey.com/industries/travel-logistics-and-infrastructure/our-insights/back-to-the-future-airline-sector-poised-for-change-post-covid-19 (accessed on 15 January 2022).
  41. Sobczyk, M. Statystyka. Aspekty Praktyczne i Teoretyczne; Wydawnictwo UMCS: Lublin, Poland, 2006; pp. 231–232. [Google Scholar]
  42. Jóźwiak, J.; Podgórski, J. Statystyka od Podstaw; PWE: Warszawa, Poland, 2009; pp. 441–442. [Google Scholar]
  43. Barczak, A. COVID-19 Pandemic—Financial Consequences for Polish Airports—Selected Aspects. Aerospace 2021, 8, 353. [Google Scholar] [CrossRef]
  44. Barczak, A. Metoda trendów jednoimiennych okresów jako narzędzie prognozowania ruchu pasażerskiego na przykładzie Portu Lotniczego Gdańsk. In Wybrane Zagadnienia Logistyki Stosowanej; Feliks, J., Ed.; AGH University of Science and Technology Publisher: Cracow, Poland, 2016; pp. 13–24. [Google Scholar]
  45. Zeliaś, A.; Pawełek, B.; Wanat, S. Prognozowanie Ekonomiczne. Teoria, Przykłady, Zadania; PWN: Warszawa, Poland, 2003; p. 88. [Google Scholar]
  46. Perzyńska, J. Prognozy kombinowane w testowaniu obejmowania modeli ekonometrycznych—Przykład empiryczny. Folia Pomer. Univ. Technol. Stetin. Oecon. 2017, 3373, 47. [Google Scholar] [CrossRef]
  47. Winkler, R.L.; Makridakis, S. The Combination of Forecasts. J. R. Stat. Soc. Ser. A Gen. 1983, 146, 150–157. [Google Scholar] [CrossRef]
  48. Mancuso, A.C.B.; Werner, L. Review of combining forecasts approaches. Indep. J. Manag. Prod. 2013, 4, 248–277. [Google Scholar] [CrossRef] [Green Version]
Figure 1. Number of air passengers served in the EU in 2018.
Sustainability 14 04345 g001
Figure 2. Actual values of the carried passengers and theoretical values obtained by the models used for Spain.
Sustainability 14 04345 g002
Figure 3. Actual values of the carried passengers and theoretical values obtained by the models used for France.
Sustainability 14 04345 g003
Figure 4. Actual values of the carried passengers and theoretical values obtained by the models used for Italy.
Sustainability 14 04345 g004
Figure 5. Actual values of the carried passengers and theoretical values obtained by the models used for Germany.
Sustainability 14 04345 g005
Figure 6. Actual values of the carried passengers and theoretical values obtained by the models used for The Netherlands.
Sustainability 14 04345 g006
Figure 7. Actual values of the carried passengers and theoretical values obtained by the models used for Portugal.
Sustainability 14 04345 g007
Figure 8. Actual values of the carried passengers and theoretical values obtained by the models used for Ireland.
Sustainability 14 04345 g008
Figure 9. Actual values of the carried passengers and theoretical values obtained by the models used for Poland.
Sustainability 14 04345 g009
Figure 10. Actual values of the carried passengers and theoretical values obtained by the models used for Greece.
Sustainability 14 04345 g010
Table 1. The dynamics of changes in the number of passengers year on year.
Country2020/20182020/2019
Spain−73.80%−74.68%
France−68.69%−69.94%
Italy−73.65%−74.85%
Germany−74.02%−74.51%
The Netherlands−70.37%−70.94%
Portugal−67.56%−69.92%
Ireland−77.25%−78.21%
Poland−68.41%−70.55%
Greece−68.04%−69.08%
Table 2. Estimated functions of trends.
CountryTrend Function
Spain y ^ t = 937,234.8617 t + 41,520,155.4526
France y ^ t = 497,110.1932 t + 33,328,474.1211
Italy y ^ t = 593,684.2361 t + 29,789,801.0211
Germany y ^ t = 646,412.9090 t + 46,022,640.1053
The Netherlands y ^ t = 289,128.2173 t + 15,562,449.0648
Portugal y ^ t = 320,842.7165 t + 9,126,921.8263
Ireland y ^ t = 141,802.2053 t + 7,046,327.5947
Poland y ^ t = 311,216.2053 t + 6,210,694.1947
Greece y ^ t = 293,258.0827 t + 9,328,682.8316
Table 3. Seasonality indicators.
CountrySeasonality Indicator
Quarter IQuarter IIQuarter IIIQuarter IV
Spain−12,621,7065,052,60414,961,153−7,392,051
France−6,160,1172,747,1287,299,200−3,886,212
Italy−7,911,5203,046,0719,554,917−4,689,467
Germany−10,314,5803,650,9731,081,324−4,149,638
The Netherlands−2,879,5081,402,4612,880,635−1,403,588
Portugal−2,752,9391,301,1113,062,901−1,611,072
Ireland−1,747,359850,8251,833,166−936,632
Poland−1,851,980641,9632,493,419−1,283,402
Greece−7,527,5101,819,26810,766,726−5,058,483
Table 4. Forecasts for individual quarters of the year 2020 and 2021—the method of seasonality indicators.
CountryForecasts 2020
Quarter IQuarter IIQuarter IIIQuarter IV
Spain52,872,80248,580,38167,191,92678,037,711
France37,607,67247,012,02752,061,20941,372,907
Italy34,345,65045,896,92552,999,45539,348,756
Germany49,282,73263,894,69771,703,38357,386,912
The Netherlands18,754,63423,325,73125,093,03321,097,938
Portugal12,147,67916,522,57218,605,20614,252,075
Ireland8,276,81511,016,80112,140,9449,512,949
Poland10,894,25513,699,41415,862,08612,396,481
Greece7,959,59217,599,62926,840,34511,308,393
CountryForecasts 2021
Quarter IQuarter IIQuarter IIIQuarter IV
Spain56,621,74152,329,32170,940,86681,786,650
France39,596,11249,000,46854,049,64943,361,347
Italy36,720,38748,271,66255,374,19241,723,493
Germany51,868,38366,480,34874,289,03459,972,563
The Netherlands19,911,14624,482,24426,249,54622,254,451
Portugal13,431,05017,805,94319,888,57715,535,445
Ireland8,844,02311,584,01012,708,15310,080,157
Poland12,139,12014,944,27917,106,95013,641,345
Greece9,132,62418,772,66128,013,37812,481,426
Table 5. Trend models for one-name periods.
PeriodTrend Model Coefficient   of   Determination   R 2 Coefficient   of   Variation   V s
Spain
Quarter I y ^ t = 3,022,025.6 t + 28,267,486.0 0.98881.36%
Quarter II y ^ t = 3,644,856.2 t + 45,610,539.2 0.93062.78%
Quarter III y ^ t = 3,488,440.1 t + 56,325,572.1 0.93492.18%
Quarter IV y ^ t = 2,940,591.1 t + 36,553,149.7 0.95342.26%
France
Quarter I y ^ t = 1,582,425.4 t + 26,895,073.0 0.98770.88%
Quarter II y ^ t = 1,964,961.6 t + 35,151,819.8 0.97781.14%
Quarter III y ^ t = 1,958,508.8 t + 40,220,360.0 0.97301.12%
Quarter IV y ^ t = 1,737,005.7 t + 30,196,567.3 0.98341.01%
Italy
Quarter I y ^ t = 1,731,340.9 t + 22,027,416.1 0.99920.29%
Quarter II y ^ t = 2,379,490.1 t + 31,634,243.7 0.98471.21%
Quarter III y ^ t = 2,420,050.8 t + 38,615,092.0 0.99050.82%
Quarter IV y ^ t = 1,957,128.1 t + 26,353,160.5 0.99280.82%
Germany
Quarter I y ^ t = 1,903,953.3 t + 35,813,916.7 0.99920.21%
Quarter II y ^ t = 2,436,081.5 t + 48,829,497.3 0.95581.48%
Quarter III y ^ t = 2,355,857.7 t + 56,878,854.5 0.95601.25%
Quarter IV y ^ t = 2,043,145.5 t + 43,500,520.1 0.90672.09%
The Netherlands
Quarter I y ^ t = 1,140,271.0 t + 11,864,282.0 0.96252.33%
Quarter II y ^ t = 1,168,395.7 t + 16,351,005.3 0.95761.96%
Quarter III y ^ t = 960,167.0 t + 18,742,993.2 0.92292.03%
Quarter IV y ^ t = 988,096.9 t + 14,664,109.1 0.93932.25%
Portugal
Quarter I y ^ t = 987,823.0 t + 5,334,097.4 0.98772.10%
Quarter II y ^ t = 1,428,824.1 t + 8,385,987.5 0.98062.50%
Quarter III y ^ t = 1,314,096.4 t + 10,812,804.0 0.97692.17%
Quarter IV y ^ t = 1,078,527.9 t + 7,166,378.3 0.97402.68%
Ireland
Quarter I y ^ t = 428,918.8 t + 5,288,431.8 0.94282.54%
Quarter II y ^ t = 601,209.8 t + 7,511,545.4 0.99560.68%
Quarter III y ^ t = 601,028.4 t + 8,636,232.6 0.99080.88%
Quarter IV y ^ t = 424,270.6 t + 6,538,510.4 0.96481.64%
Poland
Quarter I y ^ t = 925,997.2 t + 4,381,668.8 0.99022.03%
Quarter II y ^ t = 1,245,889.2 t + 6,227,152.0 0.97932.88%
Quarter III y ^ t = 1,470,371.5 t + 7,716,376.7 0.97293.20%
Quarter IV y ^ t = 1,114,877.2 t + 5,317,254.6 0.99780.96%
Greece
Quarter I y ^ t = 380,102.9 t + 3,300,185.9 0.99550.91%
Quarter II y ^ t = 1,146,527.7 t + 10,640,948.5 0.93183.48%
Quarter III y ^ t = 1,468,689.0 t + 18,915,181.2 0.98951.02%
Quarter IV y ^ t = 674,650.9 t + 5,765,343.7 0.97961.98%
where R 2 —Coefficient of determination, V s —Coefficient of variation.
Table 6. Forecasts for individual quarters of the year 2020 and 2021—the one-name period trend method.
CountryForecasts 2020
Quarter IQuarter IIQuarter IIIQuarter IV
Spain46,399,64067,479,67677,256,21354,196,696
France36,389,62546,941,58951,971,41340,618,602
Italy32,415,46245,911,18453,135,39738,095,929
Germany47,237,63763,445,98671,014,00155,759,393
The Netherlands18,705,90823,361,38024,503,99520,592,691
Portugal11,261,03516,958,93218,697,38213,637,546
Ireland7,861,94511,118,80412,242,4039,084,134
Poland9,937,65213,702,48716,538,60612,006,518
Greece5,580,80317,520,11527,727,3159,813,249
CountryForecasts 2021
Quarter IQuarter IIQuarter IIIQuarter IV
Spain49,421,66571,124,53380,744,65357,137,287
France37,972,05148,906,55153,929,92242,355,607
Italy34,146,80248,290,67455,555,44840,053,057
Germany49,141,59065,882,06873,369,85857,802,539
The Netherlands19,846,17924,529,77525,464,16221,580,787
Portugal12,248,85818,387,75620,011,47914,716,074
Ireland8,290,86311,720,01412,843,43195,084,05
Poland10,863,64914,948,37618,008,97713,121,395
Greece5,960,90618,666,64229,196,00410,487,900
Table 7. Models estimated using harmonic analysis.
CountryModel% Explained Variance
Spain y ^ t = 937,234.8617 t + 41,520,155.4526 + 6,222,327 s i n ( 2 π 20 5 t )
13,701,340 cos ( 2 π 20 5 t )
97.1%
France y ^ t = 497,110.1932 t + 33,328,474.1211 + 3,316,670   s i n ( 2 π 20 5 t )
6,729,658 cos ( 2 π 20 5 t )
97.4%
Italy y ^ t = 593,684.2361 t + 29,789,801.0211 + 3,876,810   s i n ( 2 π 20 5 t )
8,734,278 cos ( 2 π 20 5 t )
98.5%
Germany y ^ t = 646,412.9090 t + 46,022,640.1053
+ 3,900,306 sin ( 2 π 20 5 t ) 10,563,913 cos ( 2 π 20 5 t )
93.6%
The Netherlands y ^ t = 289,128.2173 t + 15,562,449.0648 + 155,872   sin ( 2 π 20 t )
474,157 c o s ( 2 π 20 t ) + 1,403,025   s i n ( 2 π 20 5 t ) 2,880,071 c o s ( 2 π 20 5 t )
94.4%
Portugal y ^ t = 320,842.7165 t + 9,126,921.8263 + 1,456,072   s i n ( 2 π 20 5 t )   2,907,921   c o s ( 2 π 20 5 t ) 93.9%
Ireland y ^ t = 141,802.2053 t + 7,046,327.5947
+ 893,728 sin ( 2 π 20 5 t ) 1,790,263 cos ( 2 π 20 5 t )
93.4%
Poland y ^ t = 311,216.2053 t + 6,210,694.1947
+ 962,683 sin ( 2 π 20 5 t ) 2,172,699   c o s ( 2 π 20 5 t )
91.5%
Greece y ^ t = 293,258.0827 t + 9,328,682.8316
+ 3,438,876 sin ( 2 π 20 5 t ) 9,147,119 cos ( 2 π 20 5 t )
92.9%
Table 8. Forecasts for individual quarters of the year 2020 and 2021—harmonic analysis method.
CountryForecasts 2020
Quarter IQuarter IIQuarter IIIQuarter IV
Spain46,473,42367,424,41575,930,75256,854,230
France36,541,02047,084,45850,994,55741,445,338
Italy32,929,20846,133,98051,585,13239,567,729
Germany48,386,98663,497,61770,807,63756,989,832
The Netherlands17,990,78522,634,38324,511,35920,656,774
Portugal11,671,85516,356,71018,129,38214,086,213
Ireland8,092,10910,917,90211,956,2399,414,050
Poland10,262,31913,708,91715,230,15012,405,984
Greece6,046,72618,925,97824,927,47912,634,743
CountryForecasts 2021
Quarter IQuarter IIQuarter IIIQuarter IV
Spain50,222,36271,173,35479,679,69260,603,169
France38,529,46049,072,89952,982,99843,433,779
Italy35,303,94548,508,71753,959,86941,942,466
Germany50,972,63766,083,26873,393,28859,575,483
The Netherlands19,623,17524,349,55126,254,62022,370,692
Portugal12,955,22617,640,08119,412,75315,369,584
Ireland8,659,31811,485,11112,523,4489,981,259
Poland11,507,18414,953,78216,475,01513,650,849
Greece7,219,75820,099,01126,100,51213,807,775
Table 9. Combined forecasts for 2020–2021.
CountryForecasts 2020
Quarter IQuarter IIQuarter IIIQuarter IV
Spain47,151,14867,365,33977,074,89255,890,889
France36,846,10547,012,69251,675,72441,145,615
Italy33,230,10645,980,69652,573,32839,004,138
Germany48,302,45163,612,76671,175,02756,712,045
The Netherlands18,483,77623,107,16524,702,79620,782,468
Portugal11,693,52316,612,73818,477,32313,991,944
Ireland8,076,95611,017,83612,113,1959,337,044
Poland10,364,74213,703,60615,876,94712,269,661
Greece6,529,04018,015,24126,498,38011,252,129
CountryForecasts 2021
Quarter IQuarter IIQuarter IIIQuarter IV
Spain50,657,78371,079,58480,736,99859,370,379
France38,699,20848,993,30653,654,18843,050,245
Italy35,390,37848,357,01854,963,17041,239,672
Germany50,660,87066,148,56073,684,08459,116,862
The Netherlands19,793,50024,453,85725,989,44322,068,644
Portugal12,878,37817,944,59419,770,93615,207,034
Ireland8,598,06811,596,37812,691,6779,856,607
Poland11,503,31814,948,81317,196,98113,471,196
Greece7,437,76319,179,43827,769,96412,259,034
Publisher’s Note: MDPI stays neutral with regard to jurisdictional claims in published maps and institutional affiliations.

