
A Model of Stress Change under the First COVID-19 Pandemic among the General Public in Japanese Major Cities and Rural Areas


1
Research Center for Social Systems, Ina Campus, Shinshu University, 8304, Minamiminowa-Village, Kamiina-County, Nagano 399-4598, Japan
2
Tonich Engineering Consultant, 3-20 Banzaicho Kita-ku, Osaka City, Osaka 530-0028, Japan
3
Research Center for Social Systems, Nagano Campus, Shinshu University,4-17-1, Wakasato, Nagano City, Nagano 380-8553, Japan
*
Author to whom correspondence should be addressed.
Sustainability 2021, 13(3), 1207; https://doi.org/10.3390/su13031207
Submission received: 2 December 2020
/
Revised: 19 January 2021
/
Accepted: 20 January 2021
/
Published: 24 January 2021
(This article belongs to the Special Issue Working during the COVID-19 Global Pandemic)
Abstract
:Research on stress related to the COVID-19 pandemic has been dominated by the cases of healthcare workers, students, patients, and their stress during the COVID-19 pandemic. This study examined the relationship between the amount of stress change under the COVID-19 pandemic and demographic factors (age, sex, occupation, etc.) in residents of a large city and a rural area of Japan. A total of 1331 valid responses were received in June 2020 from residents of Tokyo, Osaka, and Nagano registered with a private research firm. We were able to identify 15 statistically significant variables out of 36 explanatory variables, which explained the significant increase in stress compared to the pre-pandemic period. Multiple-factor analysis showed that the relationship with people is a more significant explanatory variable for the level of increase in stress than the difference in environment between big cities (Tokyo, Osaka) and rural areas (Nagano), the type of housing, and the decrease in income compared to the pre-pandemic period.
1. Introduction
As of 29 October 2020, there were a total of 44.5 million confirmed cases of COVID-19 and 1.17 million deaths due to COVID-19 reported globally. In Japan, the cumulative number of cases had reached 99,804, with 1748 deaths [1,2]. In a statement at the opening of a meeting, the Director-General Tedros of the World Health Organisation (WHO) stressed that the new coronavirus situation ‘is a once-in-a-century crisis, and the effects will remain for decades’ [3]. At the time as when our study was under preparation, studies of the spread of COVID-19 and the stress caused by self-isolation mainly involved Chinese healthcare workers and patients [4,5,6,7]. In addition, some studies of university students in the new semester and local residents in China were reported [8,9], but the results were limited to China. Most research on sustainability under COVID-19 and stress among individuals has been related to sensitivity prevention [10,11] and to stress within workplaces or occupations (medical institutions and educational settings) [12,13,14,15,16]. Studies have also examined stress in new jobs, such as remote work [17,18]. While we were conducting our research, the first analyses of the stress caused by COVID-19 on a number of specific groups or attributes were reported, such as health care workers [19,20,21,22,23,24,25], adults looking after children [26,27,28], pregnant women [29,30], university students [31], elderly people [32], scientists [33], people with illnesses [34,35,36,37], and civil servants [37,38]. As subsequent studies have also focused on the analysis of stress in the medical profession, an analysis of relative levels of stress in a group with diverse occupations (including students and unemployed) has yet to be reported. The few studies of stress in the general population [39,40,41,42,43,44,45], rather than in individual populations, have indicated that women and people with social isolation were more stressed during the first pandemic of COVID-19. We assume that there are two unresolved issues with the studies described above: one is that high or low stress in one group does not indicate the most supportive group in society as a whole, and the other is that they did not investigate the change in stress compared to before self-isolation, so the effects of people who were already highly stressed before the COVID-19 pandemic cannot be excluded.
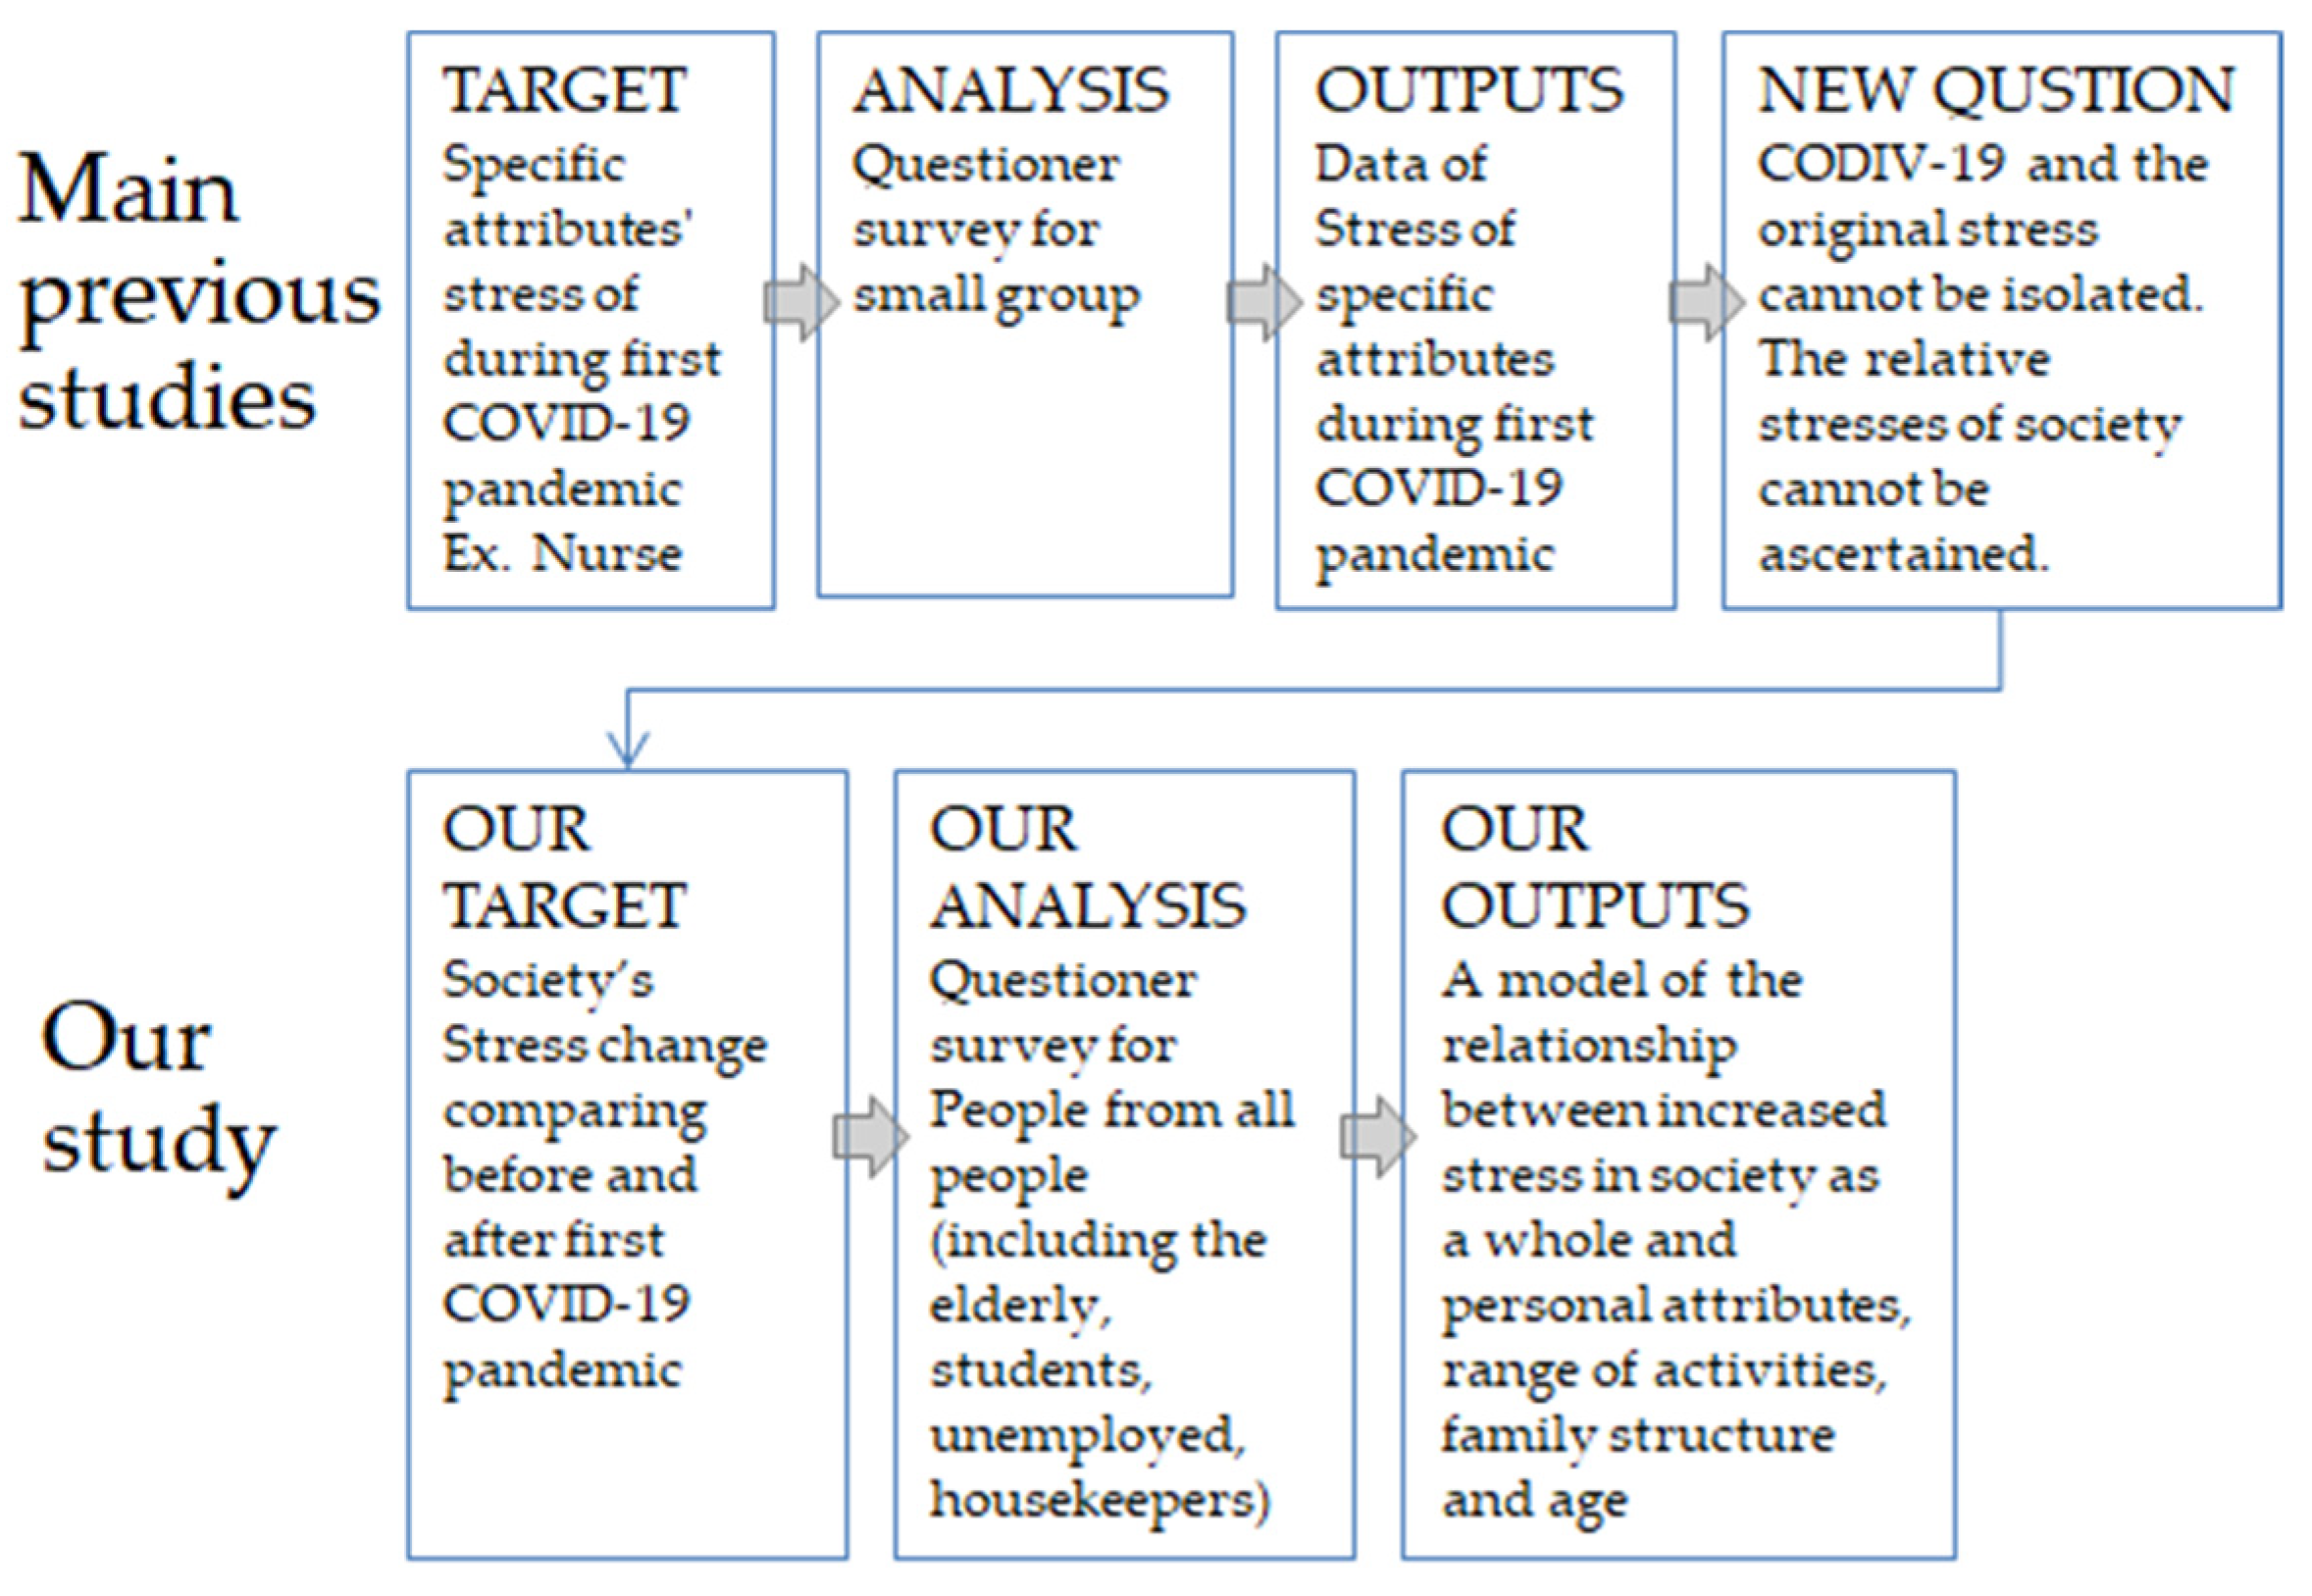
Few studies have compared pre- and post-restriction findings in general society [46,47]. Therefore, it is important to comprehensively analyse the relationship between the amount of change (increase or decrease) in stress compared to before the self-isolation and the occupation, age, area of residence, range of activities, and community of people with various other attributes. In this study, we examined the relationship between the amount of stress change due to the COVID-19 pandemic and demographics (age, sex, occupation, etc.) in residents of a large city and a rural area in Japan (Figure 1). Japanese regulations for the COVID-19 pandemic were weaker than in other countries, entailing the declaration of a state of emergency with no penalties. In addition, many conditions conducive to the spread of infection were present in Japan, including a high population density and a highly aged population. Despite these disadvantages, Japan initially showed one of the lowest death tolls among developed nations. The present study also compared situations between major cities (Tokyo and Osaka), in which a state of emergency was declared and ‘requests to refrain from going out of the house for non-essential reasons’ and ‘requests to restrict the use of amusement facilities’ were implemented for two months, and an area with rich nature and low population density (Nagano).
2. Materials and Methods
2.1. Study Design and Participants
Sampling targets were mainly residents of Tokyo, Osaka, and Nagano, Japan. We asked Asmark Inc. to continue requesting responses from the three main data collection target regions until the target of 300 people from each region was reached, where the questionnaire responses were forwarded. Asmark Inc. has 16 million registered users and specialises in providing market research services in accordance with the international standard JIS Y20252 (ISO 20252). In June 2020, a total of 1707 people answered the web survey questionnaire. Incomplete responses and responses in which the same value was entered for all items related to the target variable, the amount of change in stress, were excluded, yielding a valid response rate of 66.3% (1131 people). The sample size was more than 16 times greater than the total number of survey items (62: the number of questions for the objective variable of this study, amount of change in stress, vigour, and health (mean value) (mean value) = 26, and that for the explanatory variables = 36). The sample size of related studies that included multiple population attributes was also generally around 1000 people.
2.2. Ethical Considerations
The procedures for this study were reviewed and approved by the Institutional Review Board of the Faculty of Economics and Law of Shinshu University (10 June 2020). Informed consent, including permission to publish the study results, was obtained by clicking on the consent button at the beginning of the questionnaire. Those who did not consent or who stopped answering during the survey were free to quit the survey.
2.3. Variable Definitions
2.3.1. Explanatory Variables
A web questionnaire program with the following information (36 explanatory variables) was developed with the co-authors. The explanatory variables were as follows: relationships (availability of support in case of trouble, frequency of conversation) with family and neighbours; satisfaction with work and family; most restricted public facilities; most restricted private facilities; changes in daily activities compared to the situation before the COVID-19 pandemic; changes in daily activities due to COVID-19 (times/week); has the respondent (and family) done any walking or jogging during the COVID-19 pandemic; habits of walking/jogging outdoors; sex, age, number of family members who live with the respondent, environment the respondent grew up in; house the respondent lived in the longest during childhood; type of current residence; number of years the respondent has lived in the current residence; history of moving house; occupation; status of income compared to the situation before the COVID-19 pandemic; and ownership of a private car.
2.3.2. Objective Variables Evaluated Using the Brief Job Stress Questionnaire of the Japanese Ministry of Health, Labour and Welfare
The objective variable was the amount of change in stress during the COVID-19 pandemic compared to the pre-pandemic period, based on the general stress assessment questions in Japan. The above reference had 57 items in the Stress Check, which were divided into three categories: work stress, stress reactions, and stress-relieving factors. In this study, we focused on two factors, stress response and stress-mitigating factors. Cronbach’s alpha (the reliability coefficient) of the stress questionnaire of the Ministry of Health, Labour and Welfare of Japan is reported to be greater than 0.8. In Japan, the state of emergency declared by the government lasted from 7 April to 25 May, which we defined as the period during the pandemic before self-isolation. We assumed that respondents considered the period from autumn 2019 to January, February, and March 2020 to be pre-pandemic when they answered the questionnaire. Stress, vigour, and health scoring questions were prepared using the Brief Job Stress Questionnaire of the Japanese Ministry of Health, Labour and Welfare Stress Check in 2015. The questionnaire of the Japanese Ministry of Health used as a reference includes questions on work-related stress, but for the purposes of this paper, questions on the amount of change in general stress compared to before the self-isolation were developed and used in reference to the parts of the questionnaire relating to general stress, liveliness and physical health. This is a simple clinical tool for analysing subjective anxiety. Our questionnaire had a total of 26 questions, scored on a 5-point scale to evaluate symptom status. Our modified standard scoring was as follows: 1 = much less than before; 3 = no difference; and 5 = much more than before. Questions 1 to 3 are vigour indicators, Questions 4 to 18 are stress indicators, and Questions 18 to 26 are health indicators (please refer to the questionnaire items for the objective variable in the appendix). A higher mean score for vigour indicates a more positive mental state. On the other hand, higher mean scores for stress and health indicate higher levels of stress and poor health, respectively. A score >3 indicates an increase in the value from before the COVID pandemic, whereas a score ≤3 indicates a decrease from before the COVID pandemic. Since the score for stress change was used as the objective variable in this analysis, the scores for health and vigour were considered collinear if they correlated strongly with the stress score, and in that case could not be used as objective variables. Cronbach’s alpha for the study group for this tool was 0.955.
2.4. Statistical Analysis
In this study, in order to examine the relationship between the amount of stress change and the 36 explanatory variables, the following three steps were used: (1) correlation analysis, (2) consideration of the amount of stress change for each significant explanatory variable, and (3) explanatory modelling of the overall amount of stress change. For the final model, explanatory variables for which both the correlation analysis and the analysis of differences per response (categorical variables only) were significant were used.
Categorical data are expressed as frequencies and percentages, and continuous data are expressed as mean ± standard deviation (SD). Comparisons between two groups were performed using two independent-sample t-tests, and comparisons between multiple groups were performed using single-factor analysis of variance. Correlations among quantitative data (amount of change in self-assessments of vigour, stress, and health using the Japanese Ministry of Health, Labour and Welfare Stress Check) were analysed using Pearson’s correlation analysis, and multiple linear regression analysis was used for multivariate analysis. All statistical analyses were performed using R version 4.0.2, with two-tailed p < 0.05 being considered significant.
3. Results
3.1. Characteristics of Participants
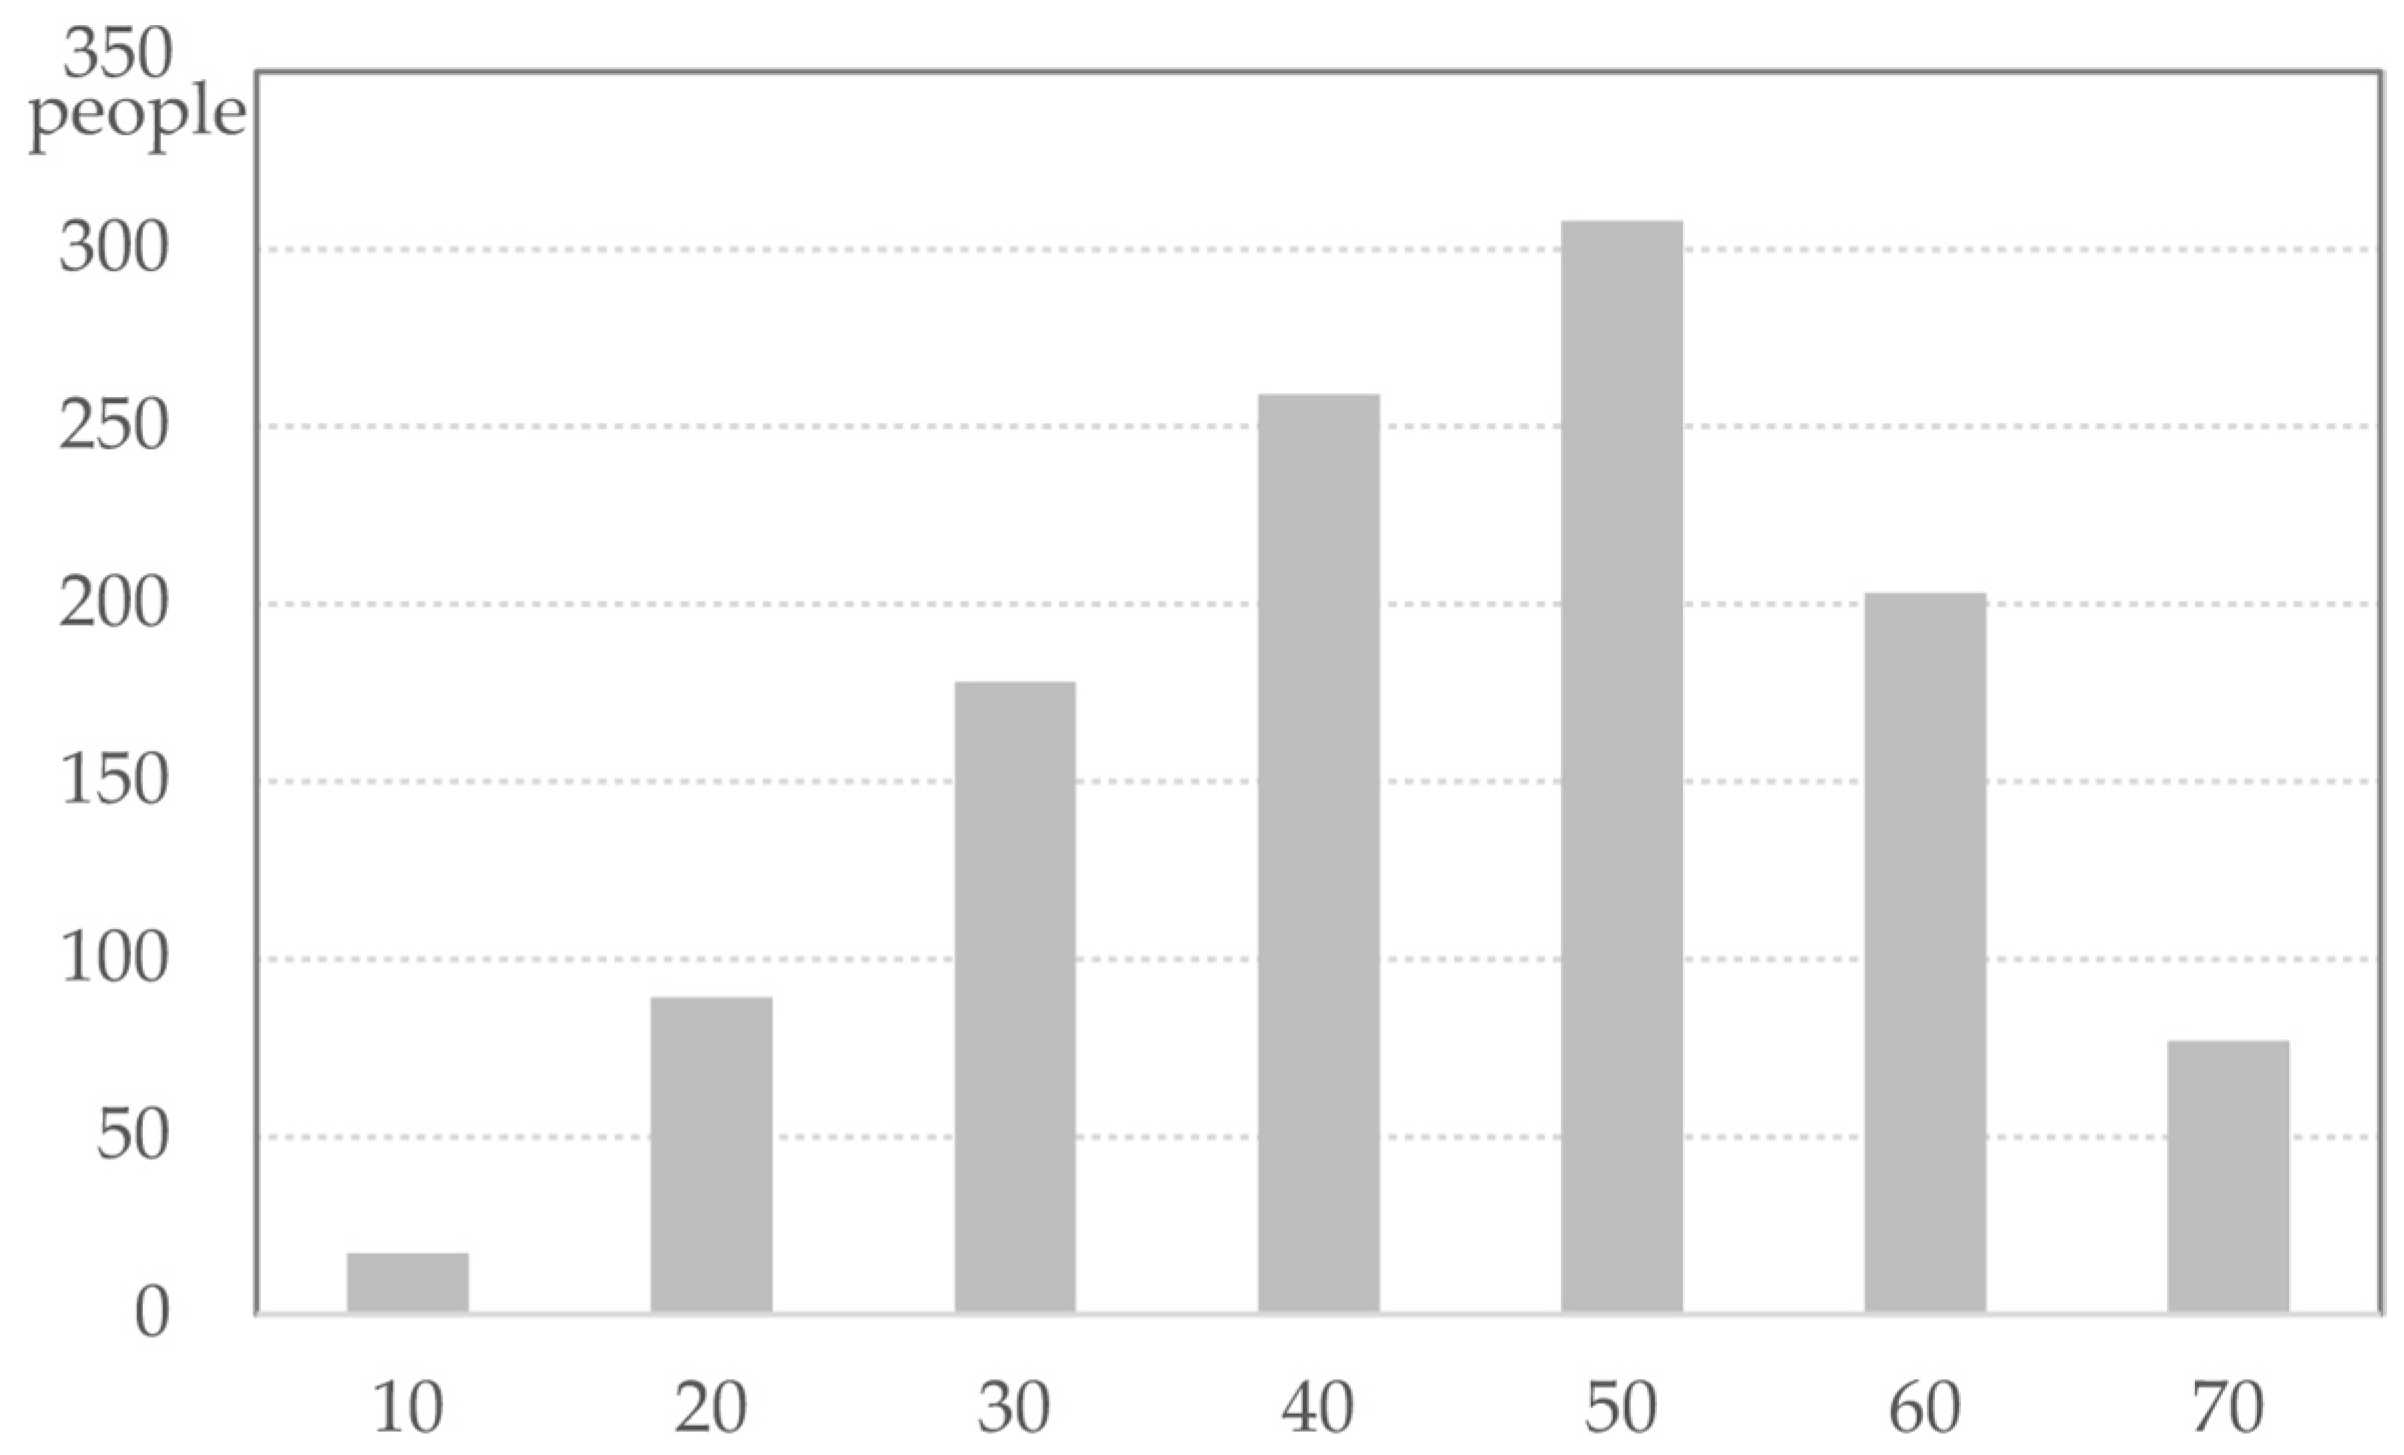
Figure 2 and Figure 3 show the most important characteristics of this study group. The age of the respondents was normally distributed, and their occupations were more diverse than those of previous studies (nurses and teachers), indicating that the study covers a diverse group of people.
Of the 1131 persons who participated in the survey, 645 were male (57.0%), 482 were female (42.6%), and 4 were indeterminate (0.4%). Age ranged from 21 to 48 years (32.71 ± 6.52 years), with years of working ranging from 2 to 32 years (8.45 ± 3.86 years).
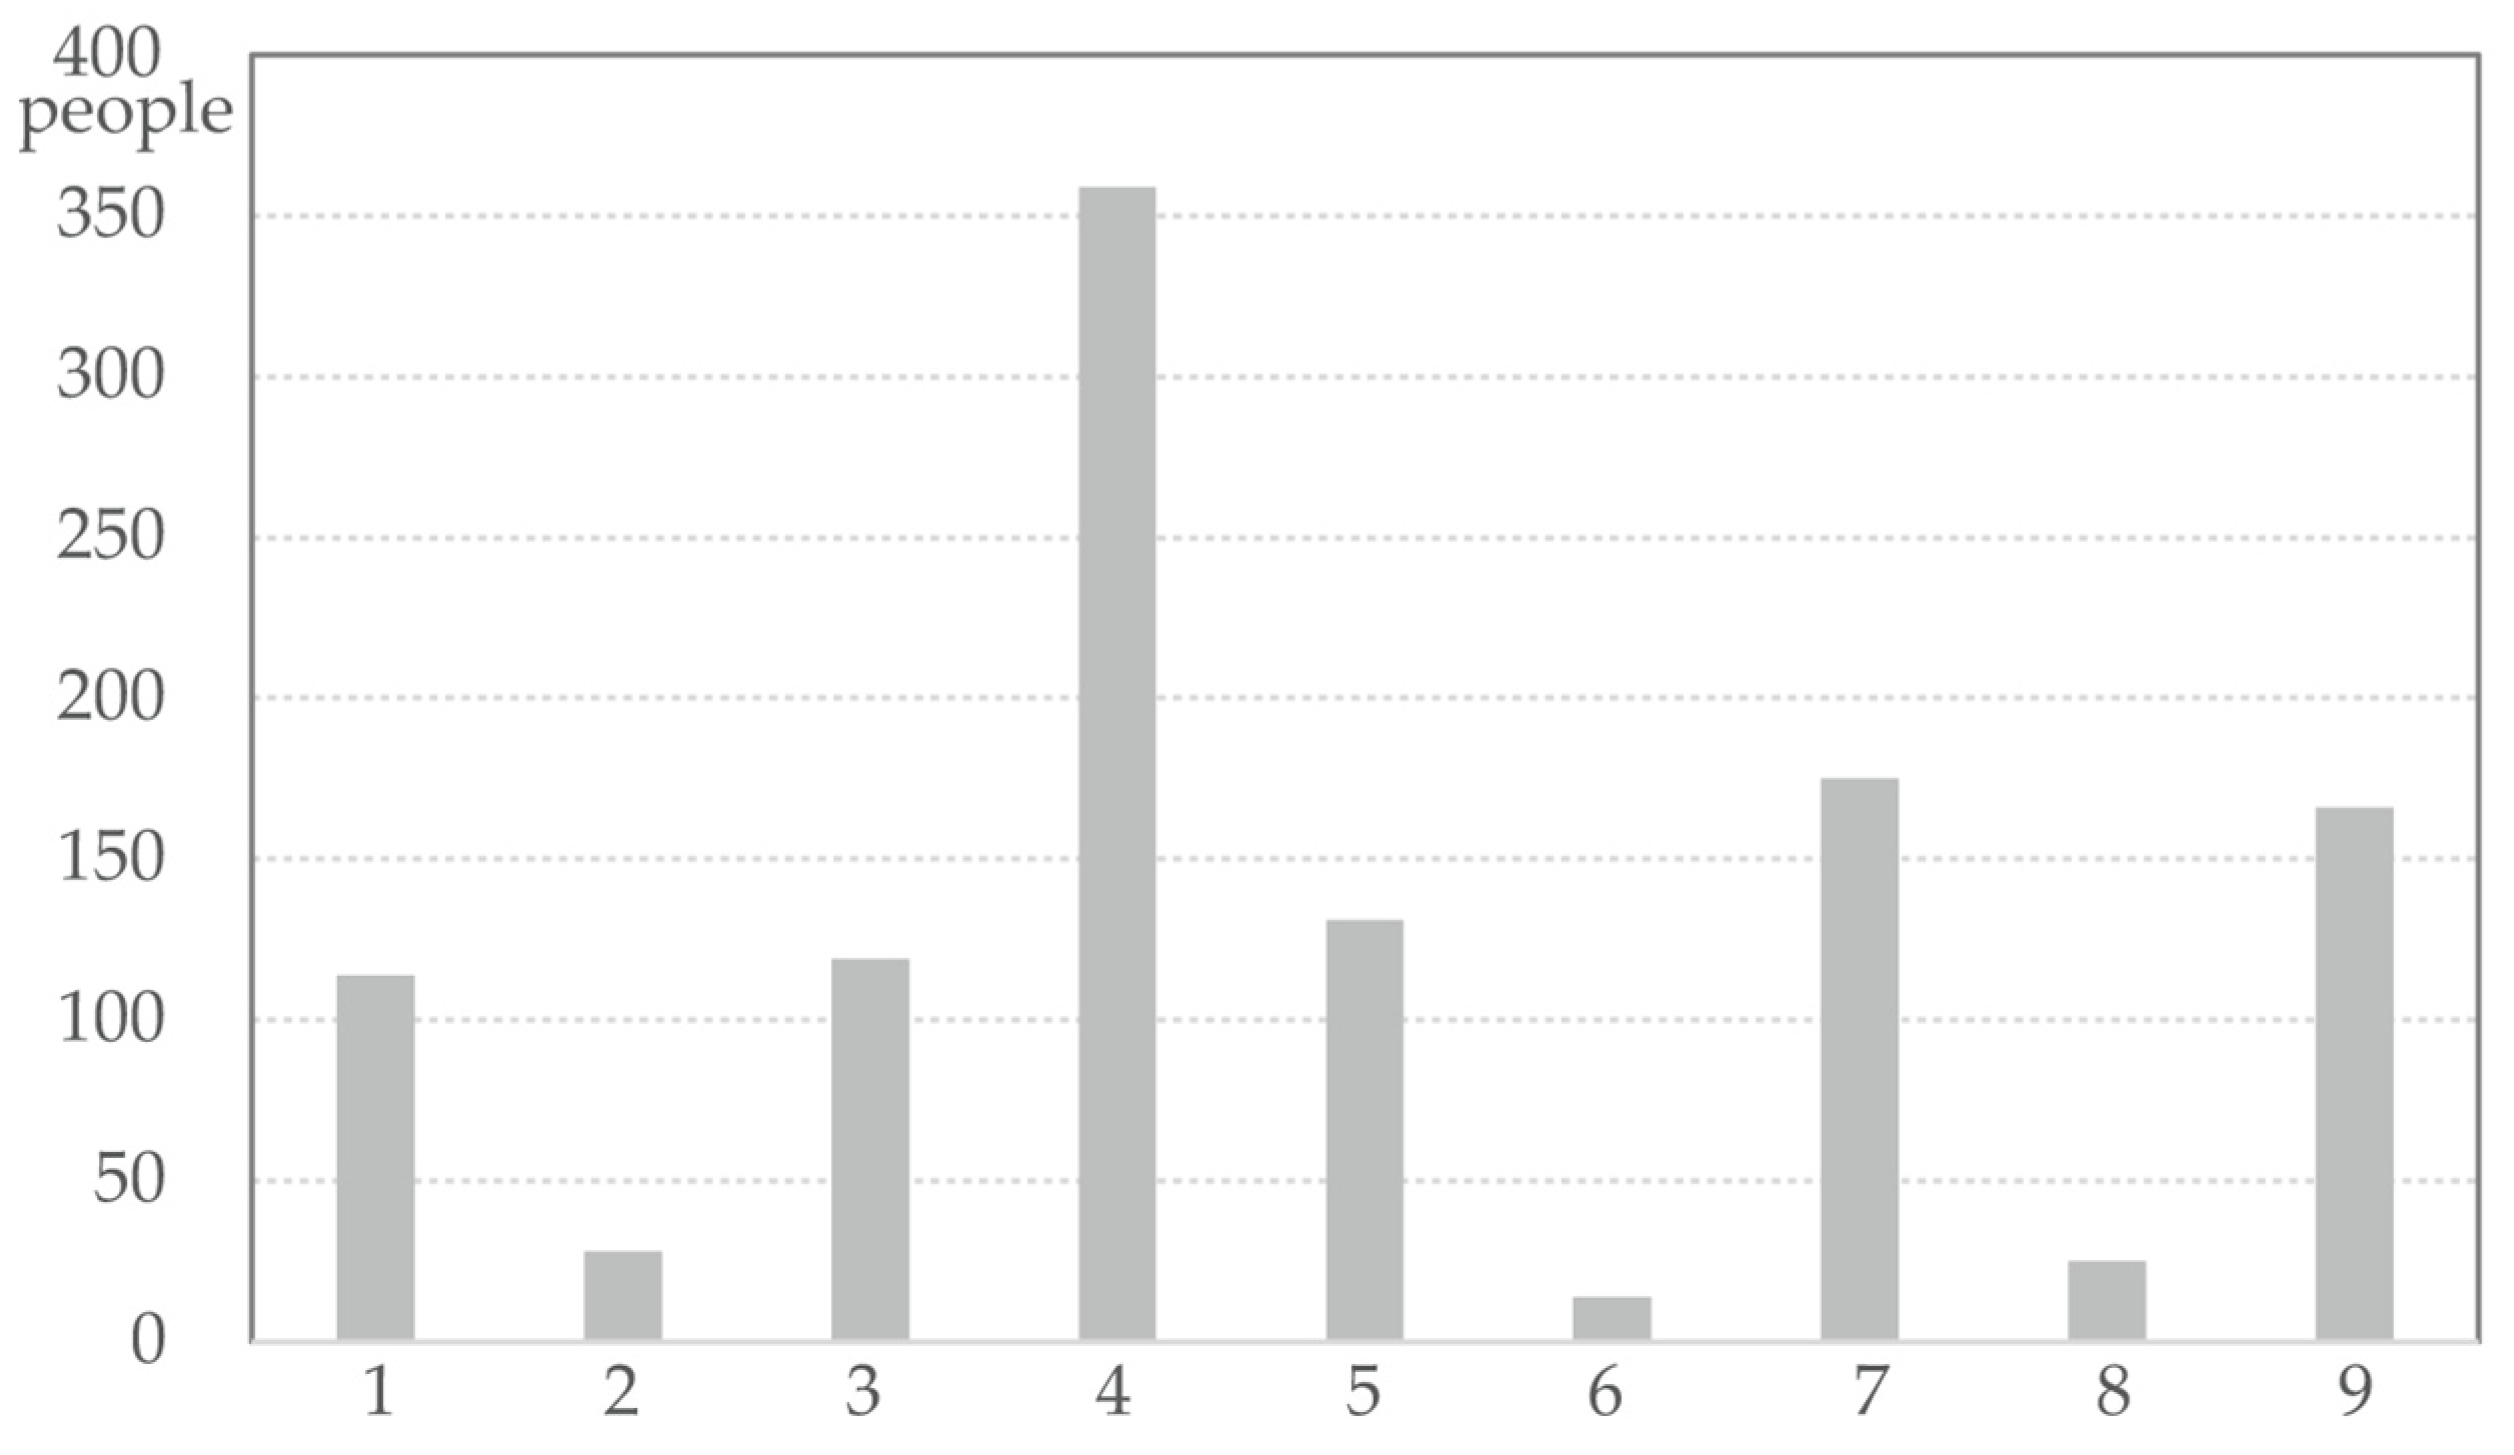
The place of residence was Tokyo (1) for 396 participants (35.0%), Osaka (2) for 390 participants (34.5%), Nagano (3) for 314 participants (27.8%), and other (4) in 31 participants (2.7%). Overall, 221 people (19.5%) lived alone, while 910 (80.5%) lived with their family or others. The occupations of participants were as follows: corporate manager/board member/director (1), 114 (10.1%); civil servant (2), 28 (2.5%); self-employed (3), 117 (10.3%); company employee (4), 361 (31.9%), part-time employment (5), 131 (11.6%), temporary employment (6), 14 (1.2%), unemployed (7), 175 (15.5%), student (8), 25 (2.2%); and domestic duties (9), 166 (14.7%). The type of current residence was as follows: detached house, 563 (49.8%); low-rise apartment (1st–3rd floor), 175 (15.5%); middle-rise apartment (4th–10th floor); 237 (21.0%); and high-rise apartment (≥10th floor), 156 (13.8%). Private car ownership was as follows: yes, 713 (63.0%); no, 418 (37.0%).
3.2. Comparisons of Stress, Vigour, and Health Change Average Scores
Of the 1707 people who answered the web survey questionnaire, the 1131 valid responses showed a mean stress average score of 3.26 ± 0.64. Compared to the situation before the first COVID-19 pandemic, stress was increased in 809 residents (71.5% of respondents), unchanged in 82 residents (7.3% of respondents), and decreased in 240 residents (21.2% of respondents). The average stress change in these three subgroups was as follows. The average stress change in the group with increased stress was 3.535 ± 0.441; the average stress change in the group with no change in stress was 3 ± 0; and the average stress change in the group with decreased stress was 2.426 ± 0.546.
3.3. Correlations among Stress, Vigour, and Health Scores
Pearson correlation analysis found the mean stress score to be significantly correlated with the mean vigour and health scores (r = −0.596 and 0.685, respectively). The correlation analysis showed a strong negative correlation between changes in the levels of stress and vigour, and a strong positive correlation between changes in the levels of stress and health. Since the change in stress score was the objective variable in the current analysis, vigour and health scores as explanatory variables were removed from multiple regression analysis to eliminate the issue of collinearity.
3.4. Correlation Analysis of Amount of Stress Change and All Explanatory Variables
The results of the correlation analysis between the objective variable, stress change average, and the data of the 36 explanatory variables are shown in Table 1. The explanatory variables in bold are those for which statistically significant correlations were found (Table 1). The explanatory variables with the largest correlation coefficients were, in order, 1. Satisfaction with your work (including housework and study), 2. Satisfaction with your family life, 3. Daily activity change compared to the situation before the COVID-19 pandemic, and 4. Public facilities with the most restricted access under the COVID-19 pandemic. Occupation and age were also found to be significantly correlated with average stress change. There was no significant correlation between the amount of stress change and gender (women were more stressed), as found in previous studies.
3.5. Differences per Response Analysis Amount of Stress Change and Categorical Explanatory Variables
Table 2 shows a comparison of the amount of stress change for each significant explanatory variable. The explanatory variables in bold are the variables for which statistically significant differences in stress level were found (Table 2). For Satisfaction with your family life, which was the most strongly correlated with the objective variable, the more dissatisfied the respondents were, the more stress they experienced compared to before the self-isolation: Satisfied (1): 2.93 ± 0.73, Not satisfied at all (4): 3.74 ± 0.72. For Satisfaction with your work (including housework and study), which was the second most strongly correlated with the objective variable, the more dissatisfied the respondents were, the more stress they experienced compared to before the self-isolation: Satisfied (1): 2.76 ± 0.80, Not satisfied at all (4): 3.54 ± 0.69. For Daily activity change compared to the situation before the COVID-19 pandemic, which was the third most strongly correlated with the objective variable, the more a person’s range of activities decreased, the more stress they experienced compared to before the self-isolation: No difference (0): 3.11 ± 0.59, I seldom went out from my house (100): 3.37 ± 0.79. In the fourth most strongly correlated with the objective variable is "The public facilities which did you feel inconvenience the restricted access under the COVID-19 pandemic", the amount of increased stress was greater for those who had more trouble using health and medical facilities: None (0): 3.19 ± 0.65, Nursing facilities (9): 3.56 ± 0.76.
As for occupation, the amount of stress tended to increase more for those who were considered less financially independent. In addition, the occupations corporate manager/board member/director, civil servant, and self-employed, which have rarely been discussed in previous studies, also tended to show increased amounts of stress.
3.6. Multiple-Factor Analysis of the Comparison of Stress Change Scores
Multiple regression analysis was performed to select explanatory variables by forward–backward stepwise regression to create a significant model. The explanatory variables in bold are the variables for which statistically significant changes in stress level were found (Table 3).
When the mean stress change score was used as a dependent variable, a single-factor analysis of the stress load utilised 15 significant questions (as in Table 2) as independent variables for multiple linear regression analysis. The results show that it is the level of satisfaction, such as Satisfaction with family life, Satisfaction with work, and Reliability of local acquaintances/neighbours, that has a significant effect on the amount of change in the stress of different people. The results also show that stress is lower among people who live alone or with a partner who is not a parent, sibling, or child.
These results indicate that relationships are a more important factor than gender, which has been reported in previous studies. It was surprising to find that the relationship with people is the main explanatory variable for the level of increase in stress, more than the difference in environment between big cities (Tokyo, Osaka) and rural areas (Nagano), the type of housing, and the decrease in income compared to the pre-pandemic period. This model can explain 17.1% of the change in stress, as shown in Table 3.
4. Discussion
In this study, we analysed the relationship between the amount of change (increase or decrease) in stress compared to before the self-isolation and occupation, age, area of residence, range of activities, and community of people with various other attributes. We were able to identify 15 statistically significant variables out of 36 explanatory variables, captured as the amount of increase or decrease in stress compared to pre-pandemic COVID-19, in a population composed of diverse people. We developed an explanatory model for the increase and decrease in stress using the significant variables. The most important results indicate that personal relationships are a more important factor than gender, which has been reported in previous studies. This shows that the relationship with people is the main explanatory variable, for the amount of stress showed a greater increase than that associated with the difference in environment between big cities (Tokyo, Osaka) and rural areas (Nagano), the type of housing, and the decrease in income compared to the pre-pandemic period.
Previous studies have shown that nurses, sick people, teachers, and women are more stressed. In this study, where the objective variable was the amount of change in stress compared to before the self-isolation, the results show that the significant increase according to gender was not as significant as for other variables. In addition, it was possible to identify the amount of increase in stress in certain occupations (corporate manager/board member/director, civil servant, self-employed, domestic duties) that have not been mentioned in earlier studies.
Regarding the contributions of these findings to society, we have shown that it is important to improve trust in families and communities to reduce stress. This is because it is more difficult to change other explanatory variables such as gender, region of residence, occupation, and family structure.
Several limitations of this study should be acknowledged. First, the stress, vigour, and health scores in this study were based on respondents’ self-scoring of increases or decreases compared to pre-restraint levels, and they are not absolute values. Another issue is the low contribution of the explanatory contribution of the increase or decrease in stress from multiple analyses. This may be due to the fact that the mean values of vigour and health, which are highly correlated with stress, were not included as explanatory variables. In the future, it will be necessary to conduct analyses using objectively measures holistic scores of stress, vigour, and health.
5. Conclusions
In this summary, we analysed the relationship between the amount of change (increase or decrease) in stress compared to before the self-isolation and occupation, age, area of residence, range of activities, and community of people with various other attributes. Our results show that human relationships are a more important factor than gender, which has been reported in previous studies. We also found that the relationship with people (family or neighbours) shows a stronger correlation than residential location (big cities or rural areas). In the future, we believe that further similar comparisons among different cities around the world and a more detailed analysis on a regional basis are necessary.
Author Contributions
M.U. conceived the study and created and performed the literature search strategy. K.K. and M.U. built a data extraction file. K.K. performed data extraction. M.F. and M.U. analysed the data. M.U. supervised the process. All authors contributed extensively to this work, interpreted the data, contributed substantially to the writing and revision of the manuscript, and read and approved the final version of the manuscript. All authors have read and agreed to the published version of the manuscript.
Funding
This work was supported by funds from the Special Project of Shinshu University Research Centre of the Social System and discretionary research expenses of the Dean of the Faculty of Agriculture.
Institutional Review Board Statement
The study was conducted according to the guidelines of the Declaration of Helsinki, and approved by the Human Ethics Sub-Committee of Faculty of Economics and Law, Shinshu university, date of approval; 10 June 2021.
Informed Consent Statement
Informed consent was obtained from all subjects involved in the study.
Data Availability Statement
The data are not publicly available due to this data was obtained under conditions that are not intended to be published.
Acknowledgments
The authors thank the research participants for their participation in the study and Shotaro Maruhashi, Yasuhito Hayashi, and Yuki Arai.
Conflicts of Interest
The authors declare no conflict of interest.
References
- Johns Hopkins University. COVID-19 Dashboard by the Center for Systems Science and Engineering (CSSE) at Johns Hopkins University. Available online: https://coronavirus.jhu.edu/map.html (accessed on 29 October 2020).
- NHK (Japan Broadcasting Corporation). Number of Infected People in Japan (NHK summary). Available online: https://www3.nhk.or.jp/news/special/coronavirus/data-all/ (accessed on 29 October 2020).
- Economic Times. Impact of Coronavirus will be Felt for Decades to Come: WHO Chief Tedros Adhanom Ghebreyesus. Available online: https://economictimes.indiatimes.com/news/international/world-news/impact-of-coronavirus-will-be-felt-for-decades-to-come-who-chief-tedros-adhanom-ghebreyesus/articleshow/77287640.cms?from=mdr (accessed on 22 July 2020).
- Zhi, X.; Lu, L.; Pu, Y.; Meng, A.; Zhao, Y.; Cheng, F.; Jiang, J.; Xu, J.L.; Zeng, Y. Investigation and Analysis of Psychological Stress and Professional Identity of Nursing Students during COVID-19 Pandemic. IJEB 2020, 58, 426–432. [Google Scholar]
- Mo, Y.; Deng, L.; Zhang, L.; Lang, Q.; Liao, C.; Wang, N.; Qin, M.; Huang, H. Work stress among Chinese nurses to support Wuhan in fighting against COVID-19 epidemic. J. Nurs. Manag. 2020, 28, 1002–1009. [Google Scholar] [CrossRef] [Green Version]
- Lai, J.; Ma, S.; Wang, Y.; Cai, Z.; Hu, J.; Wei, N.; Wu, J.; Du, H.; Chen, T.; Li, R.; et al. Factors associated with mental health outcomes among health care workers exposed to coronavirus disease 2019. JAMA Netw. Open 2020, 3, e203976. [Google Scholar] [CrossRef]
- Xiao, S.; Luo, D.; Xiao, Y. Survivors of COVID-19 are at high risk of posttraumatic stress disorder. Glob. Health Res. Policy 2020, 5, 1–3. [Google Scholar] [CrossRef]
- Wang, C.; Zhao, H. The impact of COVID-19 on anxiety in Chinese university students. Front. Psychol. 2020, 11, 1168. [Google Scholar] [CrossRef]
- Yuan, S.; Liao, Z.; Huang, H.; Jiang, B.; Zhang, X.; Wang, Y.; Zhao, M. Comparison of the Indicators of Psychological Stress in the Population of Hubei Province and Non-endemic Provinces in China during Two Weeks during the Coronavirus Disease 2019 (COVID-19) Outbreak in February 2020. Med. Sci. Monit. 2020, 26, e923767-1. [Google Scholar] [CrossRef] [PubMed]
- Baxter, D.; Casady, C.B. A Coronavirus (COVID-19) Triage Framework for (Sub)national Public–Private Partnership (PPP) Programs. Sustainability 2020, 12, 5253. [Google Scholar] [CrossRef]
- Cirrincione, L.; Plescia, F.; Ledda, C.; Rapisarda, V.; Martorana, D.; Moldovan, R.E.; Theodoridou, K.; Cannizzaro, E. COVID-19 Pandemic: Prevention and Protection Measures to be Adopted at the Workplace. Sustainability 2020, 12, 3603. [Google Scholar] [CrossRef]
- Buselli, R.; Baldanzi, S.; Corsi, M.; Chiumiento, M.; Del Lupo, E.; Carmassi, C.; Dell’Osso, L.; Cristaudo, A. Psychological Care of Health Workers during the COVID-19 Outbreak in Italy: Preliminary Report of an Occupational Health Department (AOUP) Responsible for Monitoring Hospital Staff Condition. Sustainability 2020, 12, 5039. [Google Scholar] [CrossRef]
- Vagni, M.; Maiorano, T.; Giostra, V.; Pajardi, D. Hardiness, Stress and Secondary Trauma in Italian Healthcare and Emergency Workers during the COVID-19 Pandemic. Sustainability 2020, 12, 5592. [Google Scholar] [CrossRef]
- Obrad, C. Constraints and Consequences of Online Teaching. Sustainability 2020, 12, 6982. [Google Scholar] [CrossRef]
- Capone, V.; Caso, D.; Donizzetti, A.R.; Procentese, F. University Student Mental Well-Being during COVID-19 Outbreak: What Are the Relationships between Information Seeking, Perceived Risk and Personal Resources Related to the Academic Context? Sustainability 2020, 12, 7039. [Google Scholar] [CrossRef]
- Szromek, A.R.; Wolniak, R. Job Satisfaction and Problems among Academic Staff in Higher Education. Sustainability 2020, 12, 4865. [Google Scholar] [CrossRef]
- Espino-Díaz, L.; Fernandez-Caminero, G.; Hernandez-Lloret, C.M.; Gonzalez-Gonzalez, H.; Alvarez-Castillo, J.L. Analyzing the Impact of COVID-19 on Education Professionals. Toward a Paradigm Shift: ICT and Neuroeducation as a Binomial of Action. Sustainability 2020, 12, 5646. [Google Scholar] [CrossRef]
- Molino, M.; Ingusci, E.; Signore, F.; Manuti, A.; Giancaspro, M.L.; Russo, V.; Zito, M.; Cortese, C.G. Wellbeing Costs of Technology use during Covid-19 Remote Working: An Investigation using the Italian Translation of the Technostress Creators Scale. Sustainability 2020, 12, 5911. [Google Scholar] [CrossRef]
- Shiwaku, H.; Doi, S.; Miyajima, M.; Matsumoto, Y.; Fujino, J.; Hirai, N.; Jitoku, D.; Takagi, S.; Tamura, T.; Maruo, T.; et al. Novel brief screening scale, Tokyo Metropolitan Distress Scale for Pandemic (TMDP), for assessing mental and social stress of medical personnel in COVID-19 pandemic. Psychiatry Clin. Neurosci. 2020, 75, 24–25. [Google Scholar] [CrossRef] [PubMed]
- Grover, R.; Dua, P.; Juneja, S.; Chauhan, L.; Agarwal, P.; Khurana, A. “Depression, Anxiety and Stress” in a Cohort of Registered Practicing Ophthalmic Surgeons, Post Lockdown during COVID-19 Pandemic in India. Ophthalmic Epidemiol. 2020, 1–8. [Google Scholar] [CrossRef]
- Mo, Y.; Deng, L.; Zhang, L.; Lang, Q.; Pang, H.; Liao, C.; Wang, N.; Tao, P.; Huang, H. Anxiety of Nurses to support Wuhan in fighting against COVID-19 Epidemic and its Correlation with Work Stress and Social Support. J. Clin. Nurs. 2020. [Google Scholar] [CrossRef]
- Alan, H.; Gumus, E.; AK, H.S. “I’m a hero, but…”: An evaluation of depression, anxiety, and stress levels of frontline healthcare professionals during COVID-19 pandemic in Turkey. Perspect. Psychiatr. Care 2020. [Google Scholar] [CrossRef]
- Song, M. Psychological stress responses to COVID-19 and adaptive strategies in China. World Dev. 2020, 136, 105107. [Google Scholar] [CrossRef]
- Liao, C.; Guo, L.; Zhang, C.; Zhang, M.; Jiang, W.; Zhong, Y.; Lin, Q.; Liu, Y. Emergency Stress Management Among Nurses: A Lesson from the COVID-19 Outbreak in China-A Cross-Sectional Study. J. Clin. Nurs. 2020. [Google Scholar] [CrossRef]
- Murat, M.; Köse, S.; Savaşer, S. Determination of stress, depression and burnout levels of front-line nurses during the COVID-19 pandemic. Int. J. Ment. Health Nurs. 2020. [CrossRef]
- Miller, J.J.; Cooley, M.E.; Mihalec-Adkins, B.P. Examining the Impact of COVID-19 on Parental Stress: A Study of Foster Parents. Child Adolesc. Soc. Work J. 2020, 1–10. [Google Scholar] [CrossRef]
- Xu, Y.; Wu, Q.; Jedwab, M.; Levkoff, S.E. Understanding the Relationships between Parenting Stress and Mental Health with Grandparent Kinship Caregivers’ Risky Parenting Behaviors in the Time of COVID-19. J. Fam. Violence 2020, 1–13. [Google Scholar] [CrossRef]
- Cusinato, M.; Iannattone, S.; Spoto, A.; Poli, M.; Moretti, C.; Gatta, M.; Miscioscia, M. Stress, Resilience, and Well-Being in Italian Children and Their Parents during the COVID-19 Pandemic. Int. J. Environ. Res. Public Health 2020, 17, 8297. [Google Scholar] [CrossRef]
- Abdoli, A. The COVID-19 stress may influence on the sex ratio at birth. J. Matern. Fetal Neonatal Med. 2020, 11, 1–6. [Google Scholar] [CrossRef]
- Medina-Jimenez, V.; Bermudez-Rojas, M.D.L.L.; Murillo-Bargas, H.; Rivera-Camarillo, A.C.; Muñoz-Acosta, J.; Ramirez-Abarca, T.G.; Esparza-Valencia, D.M.; Angeles-Torres, A.C.; Lara-Avila, L.; Hernandez-Muñoz, V.A.; et al. The impact of the COVID-19 pandemic on depression and stress levels in pregnant women: A national survey during the COVID-19 pandemic in Mexico. J. Matern. Fetal Neonatal Med. 2020, 17, 1–3. [Google Scholar] [CrossRef]
- Rodríguez-Hidalgo, A.J.; Pantaleón, Y.; Dios, I.; Falla, D. Fear of COVID-19, Stress, and Anxiety in University Undergraduate Students: A Predictive Model for Depression. Front. Psychol. 2020, 11, 3041. [Google Scholar] [CrossRef]
- Jiang, D. Perceived Stress and Daily Well-Being During the COVID-19 Outbreak: The Moderating Role of Age. Front. Psychol. 2020, 11, 1–6. [Google Scholar] [CrossRef]
- Procentese, F.; Capone, V.; Caso, D.; Donizzetti, A.R.; Gatti, F. Academic Community in the Face of Emergency Situations: Sense of Responsible Togetherness and Sense of Belonging as Protective Factors against Academic Stress during COVID-19 Outbreak. Sustainability 2020, 12, 9718. [Google Scholar] [CrossRef]
- Ballivian, J.; Alcaide, M.L.; Cecchini, D.; Jones, D.L.; Abbamonte, J.M.; Cassetti, I. Impact of COVID–19-Related Stress and Lockdown on Mental Health Among People Living with HIV in Argentina. JAIDS J. Acquir. Immune Defic. Syndr. 2020, 85, 475–482. [Google Scholar] [PubMed]
- Rosengard, J.L.; Donato, J.; Ferastraoaru, V.; Zhao, D.; Molinero, I.; Boro, A.; Gursky, J.; Correa, D.J.; Galanopoulou, A.S.; Hung, C.; et al. Seizure control, stress, and access to care during the COVID-19 pandemic in New York City: The patient perspective. Epilepsia 2020, 62, 41–50. [Google Scholar] [CrossRef] [PubMed]
- Lahav, Y. Psychological distress related to COVID-19–the contribution of continuous traumatic stress. J. Affect. Disord. 2020, 277, 129–137. [Google Scholar] [CrossRef] [PubMed]
- Mazza, M.; Attanasio, M.; Pino, M.C.; Masedu, F.; Tiberti, S.; Sarlo, M.; Valenti, M. Moral Decision-Making, Stress, and Social Cognition in Frontline Workers vs. Population Groups During the COVID-19 Pandemic: An Explorative Study. Front. Psychol. 2020, 11, 3228. [Google Scholar] [CrossRef]
- Dahmen, J.; Bäker, L.; Breuer, F.; Homrighausen, K.; Pommerenke, C.; Stiepak, J.K.; Poloczek, S. COVID-19 Stress test for ensuring emergency healthcare: Strategy and response of emergency medical services in Berlin. Der Anaesthesist 2020. [CrossRef]
- Silva, L.R.B.; Seguro, C.S.; De Oliveira, C.G.A.; Santos, P.O.S.; De Oliveira, J.C.M.; Filho, L.F.M.D.S.; Júnior, C.A.D.P.; Gentil, P.; Rebelo, A.C.S. Physical inactivity is associated with increased levels of anxiety, depression and stress in Brazilians during the COVID-19 pandemic: A cross-sectional study. Front. Psychiatry 2020, 11, 1257. [Google Scholar] [CrossRef] [PubMed]
- Jiang, W.; Ren, Z.; Yu, L.; Tan, Y.; Shi, C. A network analysis of post-traumatic stress disorder symptoms and correlates during the CoViD-19 pandemic. Front. Psychiatry 2020, 11, 568037. [Google Scholar] [CrossRef]
- Ferreira, R.J.; Cannon, C.; Buttell, F. COVID-19: Immediate Predictors of Individual Resilience. Sustainability 2020, 12, 6495. [Google Scholar] [CrossRef]
- Pumberger, M.; Schömig, F.; Haffer, H.; Mehl, J.; Duda, G.N. Stress test: Translational research during COVID-19 pandemic. J. Cachex Sarcopenia Muscle 2020, 11, 1385–1387. [Google Scholar] [CrossRef]
- Bodecka, M.; Nowakowska, I.; Zajenkowska, A.; Rajchert, J.; Kaźmierczak, I.; Jelonkiewicz, I. Gender as a moderator between Present-Hedonistic time perspective and depressive symptoms or stress during COVID-19 lock-down. Personal. Individ. Differ. 2020, 168, 110395. [Google Scholar] [CrossRef]
- Boyraz, G.; Legros, D.N.; Tigershtrom, A. COVID-19 and traumatic stress: The role of perceived vulnerability, COVID-19-related worries, and social isolation. J. Anxiety Disord. 2020, 76, 102307. [Google Scholar] [CrossRef] [PubMed]
- Liu, S.; Lithopoulos, A.; Zhang, C.-Q.; Garcia-Barrera, M.A.; Rhodes, R.E. Personality and perceived stress during COVID-19 pandemic: Testing the mediating role of perceived threat and efficacy. Personal. Individ. Differ. 2020, 168, 110351. [Google Scholar] [CrossRef] [PubMed]
- Quittkat, H.L.; Düsing, R.; Holtmann, F.-J.; Buhlmann, U.; Svaldi, J.; Vocks, S. Perceived impact of Covid-19 across different mental disorders: A study on disorder-specific symptoms, psychosocial stress and behavior. Front. Psychol. 2020, 11, 586246. [Google Scholar] [CrossRef] [PubMed]
- Van Gorp, M.; Maurice-Stam, H.; Teunissen, L.C.; van de Peppel-van der Meer, W.; Huussen, M.; Schouten-van Meeteren, A.Y.; Grootenhuis, M.A. No increase in psychosocial stress of Dutch children with cancer and their caregivers during the first months of the COVID-19 pandemic. Pediatric Blood Cancer 2020, 68, e28827. [Google Scholar]
Figure 1.
Diagram of theoretical model of existing studies and our research.

Figure 2.
Age distribution of research subjects.

Figure 3.
Occupations of research subjects. Occupation: 1. Corporate manager/board member/director, 2. Civil Servant, 3. Self-employed, 4. Company employee, 5. Part time job, 6. Temporary employment, 7. Unemployed, 8. Student, 9. Domestic duties.
Figure 3.
Occupations of research subjects. Occupation: 1. Corporate manager/board member/director, 2. Civil Servant, 3. Self-employed, 4. Company employee, 5. Part time job, 6. Temporary employment, 7. Unemployed, 8. Student, 9. Domestic duties.


Table 1.
Correlation analysis of the amount of stress change and all explanatory variables.
| Questions | Answer Classification | Correlation (r) | p-Value | |
|---|---|---|---|---|
| How comfortable are you communicating with local acquaintances/neighbours? | Very much/Always (1) | 0.122 | <0.001 | |
| Sufficiently/Frequently (2) | ||||
| To some extent/Occasionally (3) | ||||
| Not at all/Never (4) | ||||
| How comfortable are you communicating with your spouse, family, friends, etc.? | Very much/Always (1) | 0.086 | 0.004 | |
| Sufficiently/Frequently (2) | ||||
| To some extent/Occasionally (3) | ||||
| Not at all/Never (4) | ||||
| How reliable are the local acquaintances/neighbours? | Very much/Always (1) | 0.130 | <0.001 | |
| Sufficiently/Frequently (2) | ||||
| To some extent/Occasionally (3) | ||||
| Not at all/Never (4) | ||||
| How reliable are your spouse, family, friends, etc.? | Very much/Always (1) | 0.098 | <0.001 | |
| Sufficiently/Frequently (2) | ||||
| To some extent/Occasionally (3) | ||||
| Not at all/Never (4) | ||||
| Satisfaction with your work (including housework and study) | Satisfied (1) | 0.311 | <0.001 | |
| Somewhat satisfied (2) | ||||
| Not very satisfied (3) | ||||
| Not satisfied at all (4) | ||||
| Satisfaction with your family life | Satisfied (1) | 0.317 | <0.001 | |
| Somewhat satisfied (2) | ||||
| Not very satisfied (3) | ||||
| Not satisfied at all (4) | ||||
| There were public facilities whose use you don’t want to be restricted | Yes (1) | 0.085 | 0.004 | |
| No (0) | ||||
| Which public facilities did you feel inconvenience the restricted access under the COVID-19 pandemic? | None (1) | 0.103 | <0.001 | |
| Schools or nurseries (2) | ||||
| Libraries (3) | ||||
| Parks (4) | ||||
| Community centres (5) | ||||
| SPA (6) | ||||
| Sport facilities (7) | ||||
| Hospitals (8) | ||||
| Nursing facilities (9) | ||||
| Others (10) | ||||
| There were private facilities whose use you don’t want to be restricted | Yes (1) | 0.075 | 0.012 | |
| No (0) | ||||
| Which private facilities did you feel inconvenience the restricted access under the COVID-19 pandemic? | None (1) | 0.063 | 0.033 | |
| Restaurants (2) | ||||
| Supermarkets (3) | ||||
| Department stores (4) | ||||
| Hotels (5) | ||||
| Nursing homes (6) | ||||
| Sport facilities (7) | ||||
| SPA/Massage shops (8) | ||||
| Bookstores (9) | ||||
| Bars (10) | ||||
| Casinos (11) | ||||
| Others (12) | ||||
| To what extent have your daily activities changed compared to before the COVID-19 pandemic? | No difference (0) | 0.139 | <0.001 | |
| Reduced by 30% (30) | ||||
| Reduced by 50% (50) | ||||
| Reduced by 80% (80) | ||||
| I seldom left my house (100) | ||||
| The number of times per week you went out of your house | Shopping, lunch, dinner, etc. (Before COVID-19 pandemic) | 0.027 | 0.373 | |
| Shopping, lunch, dinner, etc. (During COVID-19 pandemic) | −0.015 | 0.618 | ||
| Exercise (walking, jogging, etc.) (Before COVID-19 pandemic) | −0.006 | 0.838 | ||
| Exercise (walking, jogging, etc.) (During COVID-19 pandemic) | −0.046 | 0.122 | ||
| Have you (and your family) done any walking, jogging on weekdays/holidays during the COVID-19 pandemic? | Yes (1) | −0.056 | 0.061 | |
| No (0) | ||||
| Your habits of walking/jogging outdoors | I had done it before the COVID-19 lockdown (pandemic) (1) | 0.010 | 0.738 | |
| I started during the COVID-19 lockdown (pandemic) (2) | ||||
| I do not have such habits (3) | ||||
| Sex | Male (1) | 0.052 | 0.083 | |
| Female (2) | ||||
| Others (3) | ||||
| Age | 0.087 | 0.004 | ||
| Number of family members who live with you (including yourself) | 0.017 | 0.575 | ||
| No family living in the same house | Yes (1) | −0.059 | 0.047 | |
| No (0) | ||||
| Living with spouse | Yes (1) | 0.020 | 0.509 | |
| No (0) | ||||
| Living with child/children | Yes (1) | <0.001 | 0.990 | |
| No (0) | ||||
| Living with parents (including spouse’s parents) | Yes (1) | 0.022 | 0.463 | |
| No (0) | ||||
| Living with grandparents (including spouse’s grandparents) | Yes (1) | 0.017 | 0.575 | |
| No (0) | ||||
| Living with brother or sister (including in-laws) | Yes (1) | −0.057 | 0.057 | |
| No (0) | ||||
| Living with others | Yes (1) | −0.059 | 0.046 | |
| No (0) | ||||
| Environment you grew up in | Mountainous area (1) | 0.007 | 0.811 | |
| Rural area (2) | ||||
| Suburbs (3) | ||||
| City (4) | ||||
| House you lived in the longest during childhood | Detached house (1) | 0.038 | 0.197 | |
| Low-rise apartments (1st–3rd floor) (2) | ||||
| Mid-rise apartments (4th–10th floor) (3) | ||||
| High-rise apartments (10th floor or higher) (4) | ||||
| Type of current residence | Detached house (1) | −0.011 | 0.719 | |
| Low-rise apartments (1st–3rd floor) (2) | ||||
| Mid-rise apartments (4th–10th floor) (3) | ||||
| High-rise apartments (10th floor or higher) (4) | ||||
| Number of years you lived in the current residence | 0.097 | 0.001 | ||
| About the place of your residence | I live where I was born (1) | 0.009 | 0.765 | |
| I moved once, now I live in where I was born (2) | ||||
| I live in another place than where I was born (3) | ||||
| Occupation | Corporate manager/board member/director (1) | 0.066 | 0.025 | |
| Civil servant (2) | ||||
| Self-employed (3) | ||||
| Company employee (4) | ||||
| Part time job (5) | ||||
| Temporary employment (6) | ||||
| Unemployed (7) | ||||
| Student (8) | ||||
| Domestic Duties (9) | ||||
| Status of income compared to the situation before the COVID-19 lockdown (pandemic) | Largely increased (1) | 0.068 | 0.023 | |
| Increased to some extent (2) | ||||
| No difference (3) | ||||
| Decreased to some extent (4) | ||||
| Largely decreased (5) | ||||
| No income (6) | ||||
| Do you have a car? | Yes (1) | 0.013 | 0.653 | |
| No (0) | ||||
| Prefectures | Tokyo (1) | 0.048 | 0.106 | |
| Osaka (2) | ||||
| Nagano (3) | ||||
| Other (4) | ||||
Note: The explanatory variables in bold are the variables for which statistically significant correlations were found.
Table 2.
The amount of stress change for each significant explanatory variable.
| Question | Answer Classification | Number (%) | Stress average Points | F- Value | t- Value | p- Value |
|---|---|---|---|---|---|---|
| How comfortable are you communicating with local acquaintances/neighbours? | Very much/Always (1) | 27 (2.4) | 3.03 ±0.85 | 17.180 | - | <0.001 |
| Sufficiently/Frequently (2) | 129 (11.4) | 3.10 ±0.63 | ||||
| To some extent/Occasionally (3) | 621 (54.9) | 3.26 ±0.57 | ||||
| Not at all/Never (4) | 354 (31.4) | 3.35 ±0.73 | ||||
| How comfortable are you communicating with your spouse, family, friends, etc.? | Very much/Always (1) | 308 (27.2) | 3.21 ±0.67 | 8.449 | - | 0.004 |
| Sufficiently/Frequently (2) | 449 (39.7) | 3.23 ±0.58 | ||||
| To some extent/Occasionally (3) | 336 (29.7) | 3.32 ±0.67 | ||||
| Not at all/Never (4) | 38 (3.4) | 3.47 ±0.76 | ||||
| How reliable are your local acquaintances/neighbours? | Very much/Always (1) | 17 (1.5) | 3.07 ±0.90 | 19.458 | - | <0.001 |
| Sufficiently/Frequently (2) | 99 (8.8) | 3.03 ±0.75 | ||||
| To some extent/Occasionally (3) | 556 (49.2) | 3.25 ±0.55 | ||||
| Not at all/Never (4) | 459 (40.6) | 3.34 ±0.68 | ||||
| How reliable are your spouse, family, friends, etc.? | Very much/Always (1) | 334 (29.5) | 3.21 ±0.65 | 10.912 | - | 0.001 |
| Sufficiently/Frequently (2) | 401 (35.5) | 3.21 ±0.62 | ||||
| To some extent/Occasionally (3) | 335 (29.6) | 3.33 ±0.62 | ||||
| Not at all/Never (4) | 61 (5.4) | 3.45 ±0.72 | ||||
| Satisfaction with your work (including housework and study) | Satisfied (1) | 62 (5.5) | 2.76 ±0.80 | 121.05 | - | <0.001 |
| Somewhat satisfied (2) | 493 (43.6) | 3.12 ±0.57 | ||||
| Not very satisfied (3) | 379 (33.5) | 3.38 ±0.57 | ||||
| Not satisfied at all (4) | 197 (17.4) | 3.54 ±0.69 | ||||
| Satisfaction with your family life | Satisfied (1) | 149 (13,2) | 2.93±0.73 | 126.36 | - | <0.001 |
| Somewhat satisfied (2) | 567 (50.1) | 3.19 ±0.54 | ||||
| Not very satisfied (3) | 308 (27.2) | 3.38 ±0.62 | ||||
| Not satisfied at all (4) | 107 (9.5) | 3.74 ±0.72 | ||||
| There were public facilities whose use you don’t want to be restricted | Yes (1) | 746 (66.0) | 3.30 ±0.63 | - | 2.843 | 0.005 |
| No (0) | 385 (34.0) | 3.19 ±0.65 | ||||
| Which public facilities did you feel inconvenience the restricted access under the COVID-19 pandemic? | None (1) | 385 (34.0) | 3.19 ±0.65 | 12.104 | - | 0.001 |
| Schools or nurseries (2) | 132 (11.7) | 3.19 ±0.74 | ||||
| Libraries (3) | 185 (16.4) | 3.29 ±0.61 | ||||
| Parks (4) | 36 (3.2) | 3.33 ±0.57 | ||||
| Community centres (5) | 24 (2.1) | 3.21 ±0.34 | ||||
| SPA (6) | 88 (7.8) | 3.38 ±0.54 | ||||
| Sport facilities (7) | 84 (7.4) | 3.20 ±0.62 | ||||
| Hospitals (8) | 140 (12.4) | 3.41 ±0.59 | ||||
| Nursing facilities (9) | 17 (1.5) | 3.56 ±0.76 | ||||
| Others (10) | 40 (3.5) | 3.25 ±0.72 | ||||
| There were private facilities whose use you don’t want to be restricted. | Yes (1) | 900 (79.6) | 3.29 ±0.65 | - | 2.725 | 0.007 |
| No (0) | 231 (20.4) | 3.17 ±0.58 | ||||
| Which private facilities did you feel inconvenience the restricted access under the COVID-19 pandemic? | None (1) | 231 (20.4) | 3.17 ±0.58 | 4.570 | - | 0.033 |
| Restaurants (2) | 175 (15.5) | 3.22 ±0.59 | ||||
| Supermarkets (3) | 226 (20.0) | 3.32 ±0.79 | ||||
| Department stores (4) | 61 (5.4) | 3.18 ±0.63 | ||||
| Hotels (5) | 14 (1.2) | 3.57 ±0.60 | ||||
| Nursing homes (6) | 9 (0.8) | 3.46 ±0.64 | ||||
| Sport facilities (7) | 71 (6.3) | 3.31 ±0.47 | ||||
| SPA/Massage shops (8) | 96 (8.5) | 3.32 ±0.55 | ||||
| Bookstores (9) | 36 (3.2) | 3.13 ±0.77 | ||||
| Bars (10) | 109(9.6) | 3.28 ±0.48 | ||||
| Casinos (11) | 64 (5.7) | 3.41 ±0.76 | ||||
| Others (12) | 39 (3.4) | 3.27 ±0.71 | ||||
| To what extent has your daily activity changed compared to the situation before the COVID-19 pandemic? | No difference (0) | 198 (17.5) | 3.11 ±0.59 | 22.231 | - | <0.001 |
| Reduced by 30% (30) | 220 (19.5) | 3.22 ±0.55 | ||||
| Reduced by 50% (50) | 271 (24.0) | 3.24 ±0.58 | ||||
| Reduced by 80% (80) | 289 (25.6) | 3.35 ±0.68 | ||||
| I seldom went out from my house (100) | 153 (13.5) | 3.37 ±0.79 | ||||
| Age | - | - | - | - | - | - |
| No family living in the same house | Yes (1) | 221 (19.5) | 3.18 ±0.66 | - | −1.930 | 0.055 |
| No (0) | 910 (80.5) | 3.28 ±0.63 | ||||
| Living with others | Yes (1) | 18 (1.6) | 2.96 ±0.66 | - | −1.812 | 0.086 |
| No (0) | 1113 (98.4) | 3.27 ±0.65 | ||||
| Number of years you have lived in your current residence | - | - | - | - | - | - |
| Occupation | Corporate manager/board member/director (1) | 114 (10.1) | 3.26 ±0.62 | 5.006 | - | 0.025 |
| Civil servant (2) | 28 (2.5) | 3.37 ±0.83 | ||||
| Self-employed (3) | 119 (10.5) | 3.26 ±0.53 | ||||
| Company employee (4) | 359 (31.7) | 3.18 ±0.68 | ||||
| Part time job (5) | 131 (11.6) | 3.23 ±0.72 | ||||
| Temporary employment (6) | 14 (1.2) | 3.26 ±0.61 | ||||
| Unemployed (7) | 175 (15.5) | 3.38 ±0.45 | ||||
| Student (8) | 25 (2.2) | 2.98 ±0.75 | ||||
| Domestic duties (9) | 166 (14.7) | 3.37 ±0.66 | ||||
| Status of income compared to the situation before the COVID-19 lockdown (pandemic) | Largely increased (1) | 5 (0.4) | 2.31 ±1.32 | 5.232 | - | 0.022 |
| Increased to some extent (2) | 25 (2.2) | 3.36 ±0.79 | ||||
| No difference (3) | 735 (65.0) | 3.24 ±0.61 | ||||
| Decreased to some extent (4) | 221 (19.5) | 3.26 ±0.64 | ||||
| Largely decreased (5) | 102 (9.0) | 3.37 ±0.65 | ||||
| No income (6) | 43 (3.8) | 3.35 ±0.75 |
Note: For the answers to each question and the mean of stress, a t-test was performed for two choices, and analysis of variance for three or more choices. The explanatory variables in bold are the variables for which statistically significant were found. No additional analysis was conducted for quantitative data (age, years of residence). Numbers in parentheses in the answers are the variables used in the analysis.
Table 3.
Multiple-factor analysis of the amount of change in stress in the COVID-19 pandemic.
| Dependent Variable | Regression Coefficient | SE | t-Value | p-Value |
|---|---|---|---|---|
| Constant | 1.790 | 0.126 | 14.200 | <0.001 |
| Satisfaction with your family life (Satisfied = 1, Somewhat satisfied = 2, Not very satisfied = 3, Not satisfied at all = 4) | 0.153 | 0.025 | 6.122 | <0.001 |
| Satisfaction with your work (including housework and study) (Satisfied = 1, Somewhat satisfied = 2, Not very satisfied = 3, Not satisfied at all = 4) | 0.150 | 0.025 | 6.090 | <0.001 |
| To what extent have your daily activities changed compared to before the COVID-19 lockdown (pandemic)? (No difference = 0, Reduced by 30% = 30, Reduced by 50% = 50, Reduced by 80% = 80, I seldom went out from my house = 100) | 0.002 | 0.001 | 3.914 | <0.001 |
| How reliable are local acquaintances/neighbours when you are in trouble? (Very much/Always = 1, Sufficiently/Frequently = 2, To some extent/Occasionally = 3, Not at all/Never = 4) | 0.084 | 0.026 | 3.283 | 0.001 |
| Age (real number provided) | 0.004 | 0.001 | 3.065 | 0.002 |
| Which public facilities did you feel inconvenience the restricted access under the COVID-19 pandemic? (None = 1, Schools or nurseries = 2, Libraries = 3, Parks = 4, Community centres = 5, SPA = 6, Sport facilities = 7, Hospitals = 8, Nursing facilities = 9, Others = 10) | 0.015 | 0.006 | 2.394 | 0.017 |
| Occupation (Corporate manager/board member/director = 1, Civil servant = 2, Self-employed = 3, Company employee = 4, Part time job = 5, Temporary employment = 6, Unemployed = 7, Student = 8, Domestic duties = 9) | 0.017 | 0.007 | 2.368 | 0.018 |
Note: R2 = 0.173, adjusted R2 = 0.166, F = 30.13, p < 0.001. The explanatory variables in bold are the variables for which statistically significant changes in stress level were found.
Publisher’s Note: MDPI stays neutral with regard to jurisdictional claims in published maps and institutional affiliations. |
© 2021 by the authors. Licensee MDPI, Basel, Switzerland. This article is an open access article distributed under the terms and conditions of the Creative Commons Attribution (CC BY) license (http://creativecommons.org/licenses/by/4.0/).
Share and Cite
MDPI and ACS Style
Uehara, M.; Fujii, M.; Kobayashi, K. A Model of Stress Change under the First COVID-19 Pandemic among the General Public in Japanese Major Cities and Rural Areas. Sustainability 2021, 13, 1207. https://doi.org/10.3390/su13031207
AMA Style
Uehara M, Fujii M, Kobayashi K. A Model of Stress Change under the First COVID-19 Pandemic among the General Public in Japanese Major Cities and Rural Areas. Sustainability. 2021; 13(3):1207. https://doi.org/10.3390/su13031207
Chicago/Turabian StyleUehara, Misato, Makoto Fujii, and Kazuki Kobayashi. 2021. "A Model of Stress Change under the First COVID-19 Pandemic among the General Public in Japanese Major Cities and Rural Areas" Sustainability 13, no. 3: 1207. https://doi.org/10.3390/su13031207
Note that from the first issue of 2016, this journal uses article numbers instead of page numbers. See further details here.