
Manuscript accepted on :18-11-2021
Published online on: 20-12-2021
Plagiarism Check: Yes
Reviewed by: Dr. Raj Kumar Gupta
Second Review by: Dr. Luis del Carpio
Final Approval by: Dr. Francesca Gorini
Thyazen Alhakimi1,6* , Toto Subroto2,3, Muhammad Yusuf2,3, Wyanda Arnafia5, Ani Melani Maskoen4 , Suwendar4,Gilang Gumilar7,8 and Isa Anshori9
1Biotechnology Program, Postgraduate School, Universitas Padjadjaran, Jl. Dipati Ukur 35, Bandung 40132, Indonesia
2Department of Chemistry, Faculty of Mathematics and Natural Sciences, Universitas Padjadjaran, Sumedang 45363, Indonesia
3Research Center of Molecular Biotechnology and Bioinformatics, Universitas Padjadjaran, Bandung 40132, Indonesia
4Faculty of Medicine, Universitas Padjadjaran, Sumedang 45363, Indonesia
5Research and Development Division, Tekad Mandiri Citra Inc., Bandung 40292, Indonesia
6Department of pharmacy, Faculty of Mathematics and Natural Sciences, Universitas Islam Bandung, Bandung 40116, Indonesia
7Welding and Fabrication Engineering Technology Department, Institut Teknologi Sains Bandung, Bekasi 17530, Indonesia
8Advanced Functional Materials (AFM) Laboratory, Engineering Physics Department, Institut Teknologi Bandung, Bandung 40132, Indonesia
9Lab-on-Chip Group, Biomedical Engineering Department, Bandung Institute of Technology, Bandung 40312, Indonesia
Corresponding Author E-mail: thyazen16001@mail.unpad.ac.id
DOI : https://dx.doi.org/10.13005/bpj/2300
Abstract
SARS disease reappeared at the end of 2019 with a new name as Coronavirus Disease 2019 (COVID-19) caused by a new virus called SARS-CoV-2. This virus has spread throughout the world until recently and caused massive deaths and losses. The nucleic acid test in the form of real-time reverse transcriptase-polymerase chain reaction (RT-PCR) is very important to diagnose COVID-19 in patients, but this method has several drawbacks such as operators who have to be trained, the diagnosis results appear in a relatively long time, and the examination price relatively expensive. This research was conducted to produce immunoglobulin Y (IgY) extracted from chicken egg yolk targeting the S-protein receptor-binding domain (RBD) on SARS-CoV-2 as a component of the surface plasmon resonance (SPR) SARS-CoV-2 antigen detection kit. This research was started by extracting IgY from hyperimmune chicken egg yolks with the polyethylene glycol (PEG) precipitation method and continued with dialysis. The extracted IgY was further purified using thiophilic adsorption chromatography and concentrated by using Amicon® Ultra-15 ultrafiltration. The IgY activity against SARS-CoV-2 RBD was tested qualitatively using the agar gel precipitation test (AGPT) technique and the total protein content was determined using the Lowry method. IgY was tested for its affinity against SARS-CoV-2 RBD using SPR. The IgY concentration obtained was 11 mg/mL. The AGPT result showed the presence of IgY activity against SARS-CoV-2 RBD isolated from egg yolk and chicken serum after 8 weeks after the first vaccination of chickens. The SDS-PAGE results showed a very clear band of IgY characters. The obtained IgY showed adequate interaction with commercial SARS-CoV-2 RBD on an SPR device. The purified IgY was able to bind with protein-S RBD and showed a fairly good affinity for the SARS-CoV-2 antigen sample. The results of these observations indicate that IgY anti-S-protein SARS-CoV-2 can be produced and purified from chicken egg yolk and can be used as a diagnostic component to detect SARS-CoV-2 antigen, especially on SPR.
Keywords
Antibody (IgY); Covid-19; SARS-CoV-2; IgY anti- SARS-CoV-2; Surface Plasmon Resonance (SPR); SARS-CoV-2 RBD
Download this article as:| Copy the following to cite this article: Alhakimi T, Subroto T, Yusuf M, Arnafia W, Maskoen A .M, Suwendar S, Gumilar G, Anshori I. Development of Sars-Cov-2 Antigen Detection Kit Based on Immunoglobulin Y (Igy) Using Surface Plasmon Resonance (Spr). |
| Copy the following to cite this URL: Alhakimi T, Subroto T, Yusuf M, Arnafia W, Maskoen A. M, Suwendar S, Gumilar G, Anshori I. Development of Sars-Cov-2 Antigen Detection Kit Based on Immunoglobulin Y (Igy) Using Surface Plasmon Resonance (Spr). Available from: https://bit.ly/32jO2eq |
Introduction
Severe Acute Respiratory Syndrome Coronavirus (SARS-CoV) is a virus that causes Acute Respiratory Distress Syndrome (ARDS). SARS-CoV was first identified in 2002 in China, spread throughout the world, and infected 8,000 people with the death of 800 people. SARS-CoV is believed to have evolved from the bat coronavirus, which then infects ferrets as intermediate hosts and is now developed to infect humans (Cui et al., 2019; De Wit et al., 2016; Mairesse et al., 2020). At the end of 2019, SARS reemerged under Covid-19 (Corona Virus Disease 2019), caused by the SARS-CoV-2 virus. Until December 5, 2020, this virus had infected more than 66,230,912 million cases, with more than 1,524,457 deaths worldwide. To control this outbreak’s spread, developing a sensitive and selective detection tool to detect this virus raised huge concerns.
Polymerase Chain Reaction (PCR) is a technique or method of propagating DNA enzymatically without using an organism. Through this technique, DNA will be produced in large quantities in a relatively short time, making it easier compared with various other techniques that use DNA. PCR is mostly used in biochemistry and molecular biology because it is relatively available and requires a small number of samples (Saiki, 1989; Xu et al., 2020). PCR is considered one of the most reliable methods in detecting this type of disease and remains a reference and standard to give a definitive diagnosis of COVID-19 disease. One of the limitations of PCR is that prior information about the targeted sequences is essential to generate primers that will produce its selective amplification. DNA polymerases have a possibility of error that can cause mutations in the generated PCR fragments.
Moreover, even the smallest amounts of contaminating DNA could be amplified in PCR, which gives misleading and ambiguous results (Smith & Osborn, 2009). This method requires special lab equipment, a long experimental time, and limited skilled technicians in many developing countries such as Indonesia. PCR is also considered an expensive test and requires many imported reagents (Smith & Osborn, 2009). Therefore, the need for an alternative test suitable for domestic cases with high accuracy and affordability is critical. We argue that one of the alternative tests is surface plasmon resonance (SPR).
SPR is a spectroscopic analysis method used for the quick and uncomplicated quantitative determination of layer thicknesses in the nanometer range (Liang et al. (2013); Shawky et al. (2010)). Surface plasmon resonance spectroscopy is used in materials, bio-science, and biochemistry to measure the adsorption of substances using chip laboratory techniques. SPR can be used for direct measurements of small molecules, understanding drug-membrane protein interactions, and evaluating antibody-antigen interaction to extract its affinity, selectivity, and kinetic measurements (Liang et al., 2013; Shawky et al., 2010). A company has also developed an SPR kit for Covid-19 samples (BioNavis: Pharmaceuticals).
SPR has advantages over many techniques, including PCR. SPR tests can observe the binding on the molecular level, label-free detection, a minimum number of samples to run an experiment, and the ability to reuse sensor chips several times. SPR is useful for testing samples in many matrices, including analyzing the serum samples (Gonzales et al., 2019; Shawky et al., 2010).
To perform the SPR tests, specific antibodies are required. Such antibodies used in SPR must be pure and specific to avoid non-specific binding. One of the specific antibodies is monoclonal antibodies (mAb). Detection compounds in SPR are generally monoclonal antibodies (mAb) obtained from hybridoma techniques. According to Albert (1985), monoclonal antibodies have some drawbacks, such as time-consuming, very expensive, antigen fragments cannot be good antigen candidates, monoclonal antibodies cannot recognize the original antigen, and hybridoma is prone to contaminations.
On the other hand, hybridoma is well developed for mice and rats, but not for another animal like chicken, which almost 99% of the cells can not survive in the fusion processes (Albert, 1985; Greunke et al., 2008; Lane & Koprowski, 1982). For these reasons, the most suitable alternative is Polyclonal Antibodies, especially Immunoglobulin Y (IgY). IgY can be extracted from the SPF (Specific Pathogen Free) chicken egg yolk. One of the easiest and effective ways to get useful IgY antibodies is to produce them from chicken. Antibody IgY products have a selective binding and affinity of up to 90%. IgY is a type of immunoglobulin, the main antibody in the blood of birds, reptiles, and lungfish. IgY can be found in high concentrations in egg yolk. IgY is a type of protein formed by the avian immune system in reaction with certain foreign substances to recognize them specifically. Because chickens can produce eggs every day, and immunized chicken egg yolks contain high concentrations of IgY, chicken has become popular as a special source of the IgY antibody for researches (Larsson et al., 1993; Vaise Malekshahi et al., 2011).
IgY is the main antibody in chickens to defend against various infections and pathogens (Vaise Malekshahi et al., 2011; Warr et al., 1995). IgY has advantages over mammalian IgG, which has a week or no reaction with rheumatoid factors, A and G protein (Deisenhofer, 1981). Besides, IgY can recognize more epitopes and production more efficiently and can be harvested from egg yolks and chicken blood serum. IgY-based SPR detection has also been successfully developed to detect soft-shelled turtle systemic spherical septicemia in turtles (Baloch et al., 2015).
The end of the Covid-19 outbreak cannot yet be predicted. However, preparedness in designing and manufacturing IgY for rapid detection devices is critically important to be developed to better prepare for disease outbreaks. The development of SPR using IgY that can faster the detection of SARS-CoV-2 is deemed necessary. In this paper, we produced IgY from the chicken that can be further used as a detection kit component to diagnose SARS-CoV-2. IgY anti-S Protein is obtained by isolation from egg yolk and then purified for diagnostic needs. Our developed IgY is expected to be a tool for the early detection of SARS-CoV-2 as an alternative to PCR test so that the detection of SARS-CoV-2 can be faster and affordable.
Materials and methods
Tools and Materials
The tools used in this research are general glassware used in the Research Laboratory of the Department of Chemistry (UNPAD), Schott bottle, vortex, Surface Plasmon Resonance (SPR) (NanoSPR6 instrument Germany), AGPT gel, Sterilization chamber, Autoclave sterilizer HVE-50 (Hirayama, Japan), incubator (Memmert, Germany), magnetic stirrer with heater (China), SevenExcellent pH meter (Mettler Toledo, USA), Genesys UV-Vis spectrophotometer 10S (Thermo Scientific, USA), pipette micro (Eppendorf, Germany), SDS-PAGE (Bio-Rad, USA), MX-305 centrifuge (Tomy Tech., USA), NanoDrop 2000c Spectrophotometer (Thermo Scientific, USA), Amicon Ultra-15 Centrifugal Filter 3,000 MWCO (Merck), and ÄKTA Start (GE Healthcare, Switzerland).
RBD of SARS-CoV-2 antigen (GenCcript-China), Tween-20, Triton X-100, potassium chloride (KCl), sodium chloride (NaCl), disodium hydrogen phosphate dehydrate (Na2HPO4.2H2O), sodium dihydrogen phosphate monohydrate (NaH2PO4.H2O), dipotassium hydrogen phosphate (K2HPO4), potassium dihydrogen phosphate (KH2PO4), hydrochloric acid (HCl), sodium hydroxide (NaOH), sodium dodecyl sulfate (SDS), sodium tetraborate decahydrate (Na2[B4O5(OH)4]·8H2O), Tris, sucrose, and coomassie brilliant blue were also obtained from Merck, USA, methanol (CH3OH), acetic acid (CH3COOH), distilled water, sucrose, and coomassie brilliant blue.
Chicken Immunization
The cage size is 35 cm x 35 cm x 37.5 cm per bird. The house temperature ranges from 23-25°C with humidity around 55–60%. The lighting system uses lights with a light-dark cycle, light for 14 hours and dark for 10 hours. Air circulation uses an inlet to suck air and exhaust to remove air. The cooling system is supported by using an Air Conditioner (AC). Chickens are fed and drank ad-libitum (CCAC Guidelines on the Care and Use of Farm Animals in Research, Teaching and Testing, n.d.; Nih et al., 2011).
The used vaccine is commercial RBD of SARS-CoV-2 antigen (GenCcript-China), with 0.5 mL dose/chicken with an adjuvant (complete Freund’s adjuvant for the first injection) intramuscular in musculus pectoralis. Furthermore, boosting is given every 14 days (with the same dose of the vaccine, and incomplete Freund’s adjuvant). Chicken serum and eggs are taken before the first vaccination and seven days after each boosting (Administering Complete Freund’s Adjuvant (CFA) and Other Adjuvants, n.d.; CCAC Guidelines on the Care and Use of Farm Animals in Research, Teaching and Testing, n.d.).
Precipitation and purification of anti- SARS-CoV-2 IgY
The yolk was transferred to a filter paper. The yolk skin was cut with a lancet. A twice volume of PBS was mixed with the yolk, 3.5 % PEG 6000 of the total volume was added and vortexed, followed by 10 min rolling on a rolling mixer, watery phase containing IgY and other proteins. The tubes are centrifuged at 4°C for 20 min (10,000 rpm). The supernatant was poured through a folded filter and transferred to a new tube. An 8.5% gram of PEG 6000 was added to the tube, vortexed, and rolled on a rolling mixer. The tubes are centrifuged at 4°C for 20 min (10,000 rpm). The pellet was carefully dissolved in 1 ml PBS using a glass stick and the vortexer. PBS was added to a final volume of 10 ml. The solution was mixed with 12% PEG 6000 (w/v, 1.2 gram) and treated as step 3 (vortex, rolling mixer). The tubes are centrifuged at 4°C for 20 min (10,000 rpm), the pellet is carefully dissolved in 800 μl PBS (glass stick and vortex). The extract was transferred to a dialysis capsule. The extract was dialyzed overnight in 0.1 % saline (1,600 ml) and gently stirred using a magnetic stirrer. The next morning, the saline was replaced with PBS and dialyzed for another three hours. After that, the IgY-extract was pulled from the dialysis capsule by a pipette and transferred to 2 ml tubes. The final volume is around 2 ml (Poetri & Soejoedono, 2006; Vaise Malekshahi et al., 2011).
IgY anti-SARS-CoV-2 was purified using Fast Thiophilic gel chromatography. Thiophilic matrix is manually packed inside the column Chromatography using a buffer (20 mM phosphate buffer, 0.5M sodium sulfate, pH 7.5). The taken matrix was approximately 5 mL of slurry (matrix suspended in solvent), then it was solidified in the column to 4–4.5 mL as a column volume (CV). The volume of the obtained compressed matrix is 4 mL. After the matrix is solidified, the column is installed in a washed Thiophilic gel chromatography system (washed using aquabides water)(Constantinoiu et al., 2007; Sulk et al., 1992).
The dialysis sample in the previous stage was diluted with sample buffer (0.55 M sodium sulfate, 20mM sodium phosphate, pH 7.5) nine times the sample volume (1:9). The system was balanced with an Equilibrium buffer as much as five times the column volume (CV), then the sample was fed into the system as much as 10mL. The system was eluted with a balancing buffer ten times CV. Then the IgY bound to the resin was released by elution using an elution buffer (20mM sodium phosphate pH 7.5) twelve times the CV in a concentration gradient (percentage from 0 – 100%). Elution was continued with three times CV elution buffer with a percentage of 100%. Then the system is regenerated using a regeneration buffer (20mM sodium phosphate, 30% propanol, pH 7.5). Fractionation starts from the sample entry-stage tile, the column regeneration stage. The fraction was set as much as 3 mL/fraction with a 1 mL/min flow rate. Chromatogram will be Observed. The fraction with a UV absorbance (280 nm), which appeared as a peak, was taken for further characterization. The system is washed with distilled water. The thiophilic resin used was washed with distilled water and stored in 20% ethanol at 4°C.
IgY anti- SARS-CoV-2 concentration
To increase the concentration of our samples, (Amicon® Ultra-30 Centrifugal Filter) is used to concentrate the obtained IgY anti- SARS-CoV-2 from column chromatography. Amicon® is used for washing out the remaining salts of elution buffer, centrifuging 3 mL of IgY anti- SARS-CoV-2 in 4 mL of Amicon column using 7.500 g for 30 minutes at 4 °C. The IgY was in the filter while the smaller component passed through the membrane with the solution. The filtrate was removed, and IgY was collected in the filter and was added 10 mM Tris-Cl to the original volume. The centrifugation step was repeated; the concentrated IgY anti- SARS-CoV-2 was collected (Sulk et al., 1992).
Determination of Protein Levels
The sample was diluted 50 times with PBS. The 1 mL of the phenol was added and then incubated at room temperature for exactly 30 minutes. The same procedure was carried out with different concentrations (50x, 100x, 200x, 300x, 400x, 500x) and the blank solution (PBS). Then the standard curve was made to determine the concentration of each sample by testing the absorbance of 700 nm visible light in a visible spectrophotometer (Stålberg & Larsson, 2009). The absorbance value of each sample and blank was measured, then the total protein concentration of the sample was calculated.
Agar Gel Precipitation Test
Agar gel is made by dissolving 0.4 g agarose and 1.2 g PEG 6,000, in 20 ml PBS 0.5 M pH 7.4 and 20 ml distilled water pH 7.4. This solution is bathed in boiling water until it dissolves and the color of the mixture becomes clear. To be in the form of liquid, it is poured with a pipette as much as 3 ml into a 35mm diameter Petri dish and waited for it to harden. Then, the holes were made on top of the agar using a gel puncher. The middle hole was filled with 25 μl of SARS-CoV-2 antigen while the surrounding hole was filled with 25 μl of sample purified egg yolk. Petri dish is placed on wet filter paper to keep moisture. The reaction was read after 18–48 hours. The interaction between the IgY and RBD SARS-CoV-2 is indicated by the presence of a precipitation line between the antigen well and the egg yolk (Darmawi, 2007).
Anti-SARS-CoV-2 IgY Affinity Test using Surface Plasmon Resonance
Biomolecular interactions of S-protein with IgY anti-S-protein will be investigated using the NanoSPR6 instrument (Germany), equipped with a manual flow injection system. The instrument detects changes in the refractive index as micro-refractive-index (mRIU), which is proportional to the quantity of analyte interacting with the surface. A metal film thickness of 50 nm was chosen, with a dense CMD chip of 50 nm diameter. The running buffer contained 7.8 mM NaH2PO4, 8 mM Na2HPO4, 137 mM NaCl, 0.1 mM CaCl2, 3 mM KCl, 1.5 mM KH2PO4 and 0.02% (v/v) Tween 20, pH 7.8 (Kolomenskii et al., 1997). A healthy saliva sample was used for dilution, and the chip surface was equilibrated with a phosphate buffer with a flow rate of 25 mL/min at 25 °C. For different protein concentrations (10–200 ng/mL), equilibrium dissociation constant (KD) and maximum binding capacity (Rmax) was determined by evaluating its adsorption models.
Result and discussion
Immunizing chickens with a specific antigen, which is RBD of the S-protein in the SARS-CoV-2 (GenScript) vaccine, can produce IgY specific against the SARS-CoV-2 antigen. In addition, IgY can be isolated from egg yolk using the precipitation method (Amro et al., 2018; Poetri & Soejoedono, 2006). The specific IgY anti-SARS-CoV-2 isolation in this study was performed by veterinarians from the company of Tekad Mandiri Citra (Bandung, Indonesia). Isolation of anti-SARS-CoV-2 IgY from egg yolks in this method is considered an easy, fast, non-invasive way (Rizkiantino et al., 2020).
Extraction of IgY from Egg Yolk
IgY extraction from egg yolk was carried out by several PEG6000 precipitations from different concentrations 3.5%, 8.5%, and 12% (w/v) in 3.5% PEG precipitation, lipids and vitellins were separated by precipitation while IgY as a water-soluble fraction was present in the supernatant (Polson et al., 1980). PEG disrupts the interaction between water and lipids, the protein with the highest hydrophobicity level was settled, and when the PEG 3.5% was added, the protein produces hydrophobic aggregates. Thus, IgY that has not been aggregated can be separated from compounds (lipids and vitellins) which can precipitate with the addition of PEG 0–3.5%. In the second precipitation, the supernatant contains PEG 3.5% then PEG 8.5. % (w/v) was added so that the supernatant contained 12% PEG. When the PEG level is 12%, IgY is aggregated in the form of pellets (Polson et al., 1980). Thus, IgY can be separated from the other proteins that can only precipitate in the 13–100% PEG6000 solution. The pellets containing IgY were resuspended in 12% PEG6000 (w/v) to precipitate again. The last precipitation separates IgY from other proteins which still in the supernatant with IgY. In this process, IgY has aggregated again in the form of pellets. The pellets were resuspended again, and the dialysis process will be performed in the cellophane membrane (cut-off = 14 kDa). In this process, the dissolved PEG and other molecules with molecular weight values below 14 kDa will leave the cellophane membrane to produce a pure IgY.
According to Table 1, the IgY result is shown to increase with time. IgY result started to be zero in the first week; this value continuously increased tile reached the stagnant value at week Eight. We used Amicon® Ultra-30 Centrifugal Filter to increase the concentration of the IgY sample because the IgY produced is expected to have a size of more than 30 kDa. According to our results, this method significantly concentrated the IgY sample, as shown in table 1.
Table 1: Describe the IgY amount extracted from the egg yolk on different dates and the AGPT
| Week | Egg Date | Total Protein (mg/ml) | AGPT |
| 0 | 19-05-2020 | 10.2 | Negatif |
| 4 | 15-06-2020 | 17.5 | Negatif |
| 8 | 13-07-2020 | 31.982 | Positif |
| 12 | 15-08-2020 | 30.2 | Positif |
| 16 | 07-09-2020 | 28.326 | Positif |
| 20 | 04-10-2020 | 29.884 | Positif |
Immunoglobulin Y (IgY) in eggs was identified using (AGPT) as a qualitative test. Hens begin to produce at the age of 4.5–5.0 months, or around 18–20 weeks. The eggs that are collected are the first eggs produced from these chickens. The presence of IgY can be detected by a precipitation line between the antigen well and the egg yolk antibody well. IgY was not detected in the first week to the fourth week after the last immunization. After repeating the immunization (booster), IgY was detected in egg yolk one week later or in the fifth week after the last immunization. This booster uses the principle of the primary and secondary immune responses. Early exposure to SARS-CoV-2 antigen stimulates primary immunity, which ends with the production of that antigen. Subsequent (second) exposure to the A antigen produces a faster and greater response. From table1., First tile fourth week after immunization, maybe IgY anti-SARS-CoV-2 has been formed but has not been transferred to chicken eggs, because this the first tile fourth-week eggs are tested with AGPT the result is negative. The booster is used to stimulate a secondary immune response that is faster and higher. So, after the booster is done, the fifth-week chicken eggs are positive for the AGPT test, with the appearance of a precipitation line between the antigen well and the antibody well Figure 1.
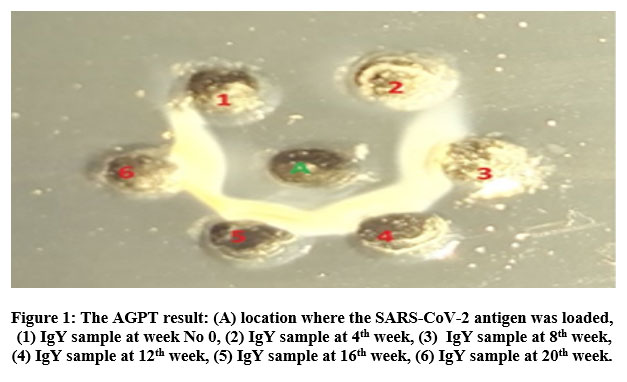 |
Figure 1: The AGPT result: (A) location where the SARS-CoV-2 antigen was loaded, (1) IgY sample at week No 0, (2) IgY sample at 4th week, (3) IgY sample at 8th week, (4) IgY sample at 12th week, (5) IgY sample at 16th week, (6) IgY sample at 20th week. |
IgY Purification using thiophilic adsorption chromatography
Thiophilic adsorption chromatography is one of the purifications of chromatographic technology, which relies on the salt content, specific functional group, different adsorption affinity against immunoglobulin and α2-macroglobulin. The term “thiophilic” refers to the affinity for sulfone groups located close to the thioether groups (Porath et al., 1985). KAT has been proven to be an easy and economical method for purifying various types of protein, especially immunoglobulins. With the KAT purification method, IgY is adsorbed on the matrix in the presence of salt in the solvent. The presence of salt strongly influences this interaction. Protein (IgY) is dissolved in a water solvent with hydrophilic sites on the surface in its normal phase. This hydrophilic site interacts directly with water molecules, while the hydrophobic sites will be in the inner part of the protein structure and do not interact directly with water molecules. Salt in a certain concentration can interfere with the hydrogen bonds between water and the dissolved protein so that the inner hydrophobic site gets to the surface of the protein. The analyte was eluted in the solvent and adsorbed on the matrix due to its hydrophobic effect on the sulfone groups located close to the thioethers in the matrix structure. Thus, compounds that do not have this interaction will elute.
The analyte adsorbed on the matrix can be released by reducing or eliminating the salt concentration in the solvent. Thus, the thiophilic interaction is weakened because the hydrophobic site of the analyte will re-enter the inner part of the structure, and the analyte can be eluted. After running the FPLC, the chromatogram obtained in Figure 1 shows that after inserting the sample into the FPLC system, there is a protein in the 4–8 fractions marked by the first UV peak. In this stage, IgY is adsorbed on the thiophilic matrix of the column due to hydrophobic interactions. The presence of high concentrations of salt molecules (0.5M sodium sulfate) in the mobile phase disrupts the hydrogen bonds between water and IgY, causing hydrophobic sites in the part of the IgY structure to open to the surface, causing adsorption to the matrix. The salt can interfere with the interaction of water with IgY. Meanwhile, other proteins that do not have hydrophobic interactions will elute and separate.
The elution method was carried out by adding a concentration gradient from the elution buffer (20mM phosphate buffer pH 7.5) in bottle B (the elution buffer is a mixture of buffers from bottle A and bottle B), this mixture starts from 100% of the solution flowing from bottles A and 0 The% solution from bottle B and undergoes gradient changes tile 0% of flowing from bottle A and 100% of the solution flowing from bottle B. The addition of elution buffer that contains no salt (sodium sulfate) can cause the weakening of the hydrophobic interactions between the bound proteins. IgY in the matrix is due to the absence of a salt molecule that interferes with the hydrogen bonding between water and protein so that the hydrophobic site of the protein returns inward and the hydrophilic site appears to the surface of IgY will be eluted.
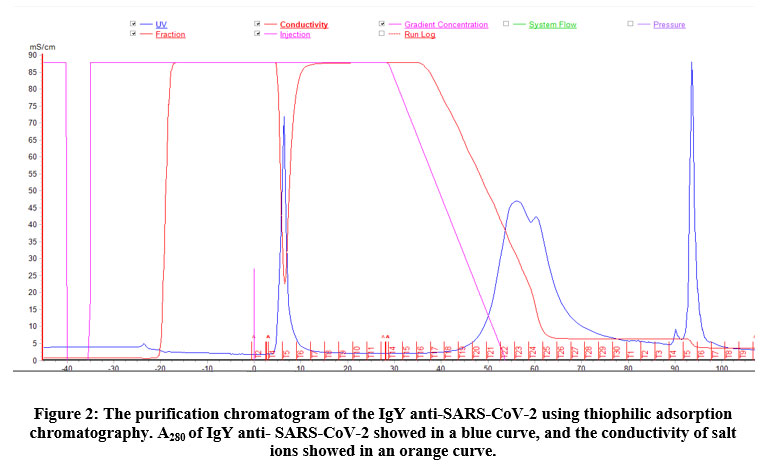 |
Figure 2: The purification chromatogram of the IgY anti-SARS-CoV-2 using thiophilic adsorption chromatography. A280 of IgY anti- SARS-CoV-2 showed in a blue curve, and the conductivity of salt ions showed in an orange curve. |
Based on the chromatogram in Figure 2, UV light absorbance 280 nm appeared in fraction 4th, which shows that the elution process of analyte compounds (IgY) occurs in the fraction under three peaks; these fractions have been automatically collected in a test tube. Theoretically, IgY will be released after elution using a buffer with a low salt concentration, so the fraction from 14 tile 16, 20 tile 27, and 5 tile 7, are estimated to contain IgY based on the chromatogram peak. The higher UV absorbance value shows the higher the protein concentration in the fraction. The highest IgY concentrations were in the 5th and 23rd fractions with absorbance values of 341.4 mAU and 341.9 mAU, respectively, which eluted when the amount of solution from bottle B (% B) was 78% and 84%, respectively, with conductivity values of 27.4 mS/cm and 23.4 mS/cm. The column undergoes a regeneration process using a regeneration buffer (20mM phosphate buffer, 30% n-propanol, pH 7.5). After purification, IgY anti-SARS-CoV-2 concentration was determined by Bradford protein assay. The IgY undergoes further concentration for using Amicon. The IgY anti-SARS-CoV-2 concentration reached 12,394 mg/ml, as shown in Table 2.
Table 2 concludes that the IgY sample volume had significantly decreased when it concentrated using Amicon with the size of 30kDa, thus implying that the purification and precipitation of the IgY from the egg yolk produce IgY with a high amount of impurities and some of these impurities eluted from the filter of the Amicon used. We used the Amicon with 30kDa because the IgY molecules have sizes of more than 30kDa. After the IgY undergoes purification by thiophilic chromatography, the SDS-PAGE has been done to ensure that the peeks in the chromatogram indicate the presence of IgY in the selected frictions. From Figure 3, The SDS-PAGE shows the IgY anti- SARS-CoV-2 in different steps of precipitation, purification, and concentration. The IgY molecular weight was 27 and 65 kDa for light and heavy chains, respectively. The result showed that the pure IgY heavy chain was 65 kDa while the light chains were 27 kDa as expected size. A clear IgY band appears in lanes 4 and 5 compared to lane 3. These bands are believed to be IgY anti- SARS-CoV-2.
Table 2: The concentration of IgY anti- SARS-CoV-2 after purification steps.
| Concentration (mg mL-1) | |
| IgY sample Volume (Before concentrating) | 22 ml |
| IgY sample Volume (after concentration) | 0.742 ml |
| Toal Protein: (before thiophilic purification); | 22.7 mg / ml |
| Toal Protein: after concentrating with Amicon | 12,394 mg / ml |
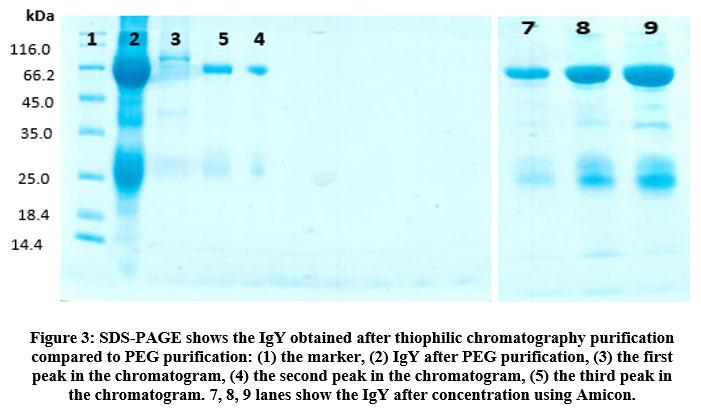 |
Figure 3: SDS-PAGE shows the IgY obtained after thiophilic chromatography purification compared to PEG purification: |
Figure 3 lane 1 shows the marker to explain other bands’ size in the samples. Lane number 2 shows some impurities (believed to be proteins). These impurities have to be removed because they can interfere with the IgY interaction with RBD of SARS-CoV-2. The thiophilic chromatography purification process is essential to eliminate part of these impurities. Lane 3, which indicates the IgY under the 1st peak in the chromatogram, shows a small amount of IgY because most of the IgY did not elute yet and still bind to the column’s stationary phase. While the 2nd and 3rd peaks shown in lanes 4 and 5, respectively, indicate better values of IgY bands because the number of salts in the liquid phase started to be decreased, this will break the bonds between the IgY and the stationary phase and the IgY was eluted. 7, 8, 9 lanes show the IgY after concentration using Amicon, the clear bands show the high concentration of IgY and indeed indicate the success of our concentration proses
Anti-SARS-CoV-2/IgY Affinity Test with Surface Plasmon Resonance
We evaluated the SARS-CoV-2/IgY interaction using surface plasmon resonance on a NanoSPR6. Therefore, IgY was covalently bound to the SPR sensor chip, and RBD SARS-CoV-2 antigen was injected to immobilize IgY. Interaction of RBD SARS-CoV-2 antigen with the immobilized IgY was then evaluated through the adsorption model. To evaluate the kinetic data of the interaction of IgY with RBD SARS-CoV-2 antigen, varying concentrations of analyte (150 ng/ml, 300 ng/ml, 400 ng/ml, and 500 ng/ml of RBD SARS-CoV-2 antigen) were injected into the immobilized IgY on SPR sensor chip as shown in figure 4.
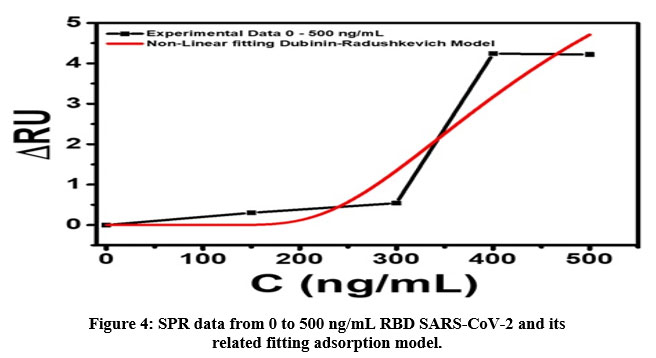 |
Figure 4: SPR data from 0 to 500 ng/mL RBD SARS-CoV-2 and its related fitting adsorption model. |
SPR experiments carried out were influenced by the degree of temperature so that the interaction showed chemisorption between IgY and RBD. Refractive units increase with higher RBD concentrations. This interaction can be well analyzed using the Dubinin-Radushkevich model. From the equation of this method, the binding energy and detection limit between IgY and RBD are obtained. Since the laser is in the SPR apparatus, it is suspected to affect the reaction and binding temperatures, so the laser array temperature (local heating) must be considered in calculations and analysis. The error in this model appears to be small, and the obtained RU is higher at higher concentrations. Evaluation on higher concentrations is necessary to investigate the saturation value of IgY to capture RBD carefully.
Conclusion
This study shows that Anti-SARS-CoV-2 IgY can be isolated from chickens’ egg yolks vaccinated with SARS-CoV-2 RBD antigen. Anti-SARS-CoV-2 IgY can be purified by PEG6000 precipitation process and thiophilic adsorption chromatography. We have also tested the binding response between Anti-SARS-CoV-2 IgY and SARS-CoV-2 RBD antigen using surface plasmon resonance. It opens up further application of surface plasmon resonance based on IgY anti-SARS-CoV-2 to detect SARS-CoV-2 RBD.
Acknowledgement
The authors would like to thank all staff and colleagues in the Research Center of Molecular Biotechnology and Bioinformatics for contributing to this research.
Declarations
Author contribution statement
Thyazen Abdo: Performed the experiments and wrote the paper.
Isa Anshori, Toto Subroto, Muhammad Yusuf, Ani Melani Maskoen, Suwendar, and Gilang Gumilar: Conceived and designed the experiments and analyzed and interpreted the data.
Wyanda Arnafia: Contributed reagents, materials, analysis tools, or data.
Conflict of interest statement
The authors declare no conflict of interest.
Funding statement
This work was supported by a National Research Grant.
References
- Administering Complete Freund’s Adjuvant (CFA) and other Adjuvants. (n.d.). Retrieved January 3, 2021, from http://www.iacuc.emory.edu/policies/index.html
CrossRef - Albert, W. H. W. (1985). Monoclonal antibodies: advantages and disadvantages in production of test systems. In New Technologies in Clinical Laboratory Science (pp. 83–96). Springer Netherlands. https://doi.org/10.1007/978-94-009-4928-7_11
CrossRef - Amro, W. A., Al-Qaisi, W., & Al-Razem, F. (2018). Production and purification of IgY antibodies from chicken egg yolk. Journal of Genetic Engineering and Biotechnology, 16(1), 99–103. https://doi.org/10.1016/j.jgeb.2017.10.003
CrossRef - Baloch, A. R., Zhang, X.-Y., & Schade, R. (2015). IgY Technology in aquaculture – a review. Reviews in Aquaculture, 7(3), 153–160. https://doi.org/10.1111/raq.12059
CrossRef - BioNavis: Pharmaceuticals. (n.d.). Retrieved January 3, 2021, from http://www.bionavis.com/en/life-science/applications/pharmaceuticals/
- CCAC Guidelines on the Care and Use of Farm Animals in Research, Teaching and Testing. (n.d.). Retrieved January 3, 2021, from https://norecopa.no/3r-guide/ccac-guidelines-on-the-care-and-use-of-farm-animals-in-research-teaching-and-testing
- Constantinoiu, C. C., Molloy, J. B., Jorgensen, W. K., & Coleman, G. T. (2007). Purification of immunoglobulins from chicken sera by thiophilic gel chromatography. Poultry Science, 86(9), 1910–1914. https://doi.org/10.1093/ps/86.9.1910
CrossRef - Cui, J., Li, F., & Shi, Z.-L. (2019). Origin and evolution of pathogenic coronaviruses. Nature Reviews Microbiology, 17(3), 181–192. https://doi.org/10.1038/s41579-018-0118-9
CrossRef - (2007). Antigen ekskretori/sekretori stadium L3 ascaridia galli sebagai pemicu pembentukan imunoglobin yolk (IgY) pada ayam petelur. http://repository.ipb.ac.id/handle/123456789/40553
- De Wit, E., Van Doremalen, N., Falzarano, D., & Munster, V. J. (2016). SARS and MERS: Recent insights into emerging coronaviruses. In Nature Reviews Microbiology (Vol. 14, Issue 8, pp. 523–534). Nature Publishing Group. https://doi.org/10.1038/nrmicro.2016.81
CrossRef - Deisenhofer, J. (1981). Crystallographic Refinement and Atomic Models of a Human Fc Fragment and Its Complex with Fragment B of Protein A from Staphylococcus aureus at 2.9- and 2.8-Å Resolution. Biochemistry, 20(9), 2361–2370. https://doi.org/10.1021/bi00512a001
CrossRef - Gonzales, W. V., Mobashsher, A. T., & Abbosh, A. (2019). The progress of glucose monitoring—A review of invasive to minimally and non-invasive techniques, devices and sensors. Sensors (Switzerland), 19(4). https://doi.org/10.3390/s19040800
CrossRef - Greunke, K., Braren, I., Alpers, I., Blank, S., Sodenkamp, J., Bredehorst, R., & Spillner, E. (2008). Recombinant IgY for improvement of immunoglobulin-based analytical applications. Clinical Biochemistry, 41(14–15), 1237–1244. https://doi.org/10.1016/j.clinbiochem.2008.07.004
CrossRef - Kolomenskii, A. A., Gershon, P. D., & Schuessler, H. A. (1997). Sensitivity and detection limit of concentration and adsorption measurements by laser-induced surface-plasmon resonance. Applied Optics, 36(25), 6539. https://doi.org/10.1364/ao.36.006539
CrossRef - Lane, D., & Koprowski, H. (1982). Molecular recognition and the future of monoclonal antibodies. Nature, 296(5854), 200–202. https://doi.org/10.1038/296200a0
CrossRef - Larsson, A., Bålöw, R. M., Lindahl, T. L., & Forsberg, P. O. (1993). Chicken antibodies: taking advantage of evolution–a review. Poultry Science, 72(10), 1807–1812. https://doi.org/10.3382/ps.0721807
CrossRef - Liang, H., Tuppurainen, J. P., Lehtinen, J., Viitala, T., & Yliperttula, M. (2013). Non-labeled monitoring of targeted liposome interactions with a model receptor surface: Effect of flow rate and water content. European Journal of Pharmaceutical Sciences, 50(3–4), 492–501. https://doi.org/10.1016/j.ejps.2013.08.011
CrossRef - Mairesse, A., Favresse, J., Eucher, C., Elsen, M., Tré-Hardy, M., Haventith, C., Gruson, D., Dogné, J. M., Douxfils, J., & Göbbels, P. (2020). High clinical performance and quantitative assessment of antibody kinetics using a dual recognition assay for the detection of SARS-CoV-2 IgM and IgG antibodies. Clinical Biochemistry, 86, 23–27. https://doi.org/10.1016/j.clinbiochem.2020.08.009
CrossRef - Nih, Od, Oer, & Olaw. (2011). GUIDE LABORATORY ANIMALS FOR THE CARE AND USE OF Eighth Edition Committee for the Update of the Guide for the Care and Use of Laboratory Animals Institute for Laboratory Animal Research Division on Earth and Life Studies. http://www.nap.edu.
- Poetri, O. N., & Soejoedono, R. D. (2006). PRODUKSI ANTIBODI KUNING TELUR (IgY) ANTI STREPTOCOCCUS MUTANS SEBAGAI ANTI KARIES GIGI. Jurnal Ilmu Pertanian Indonesia, 11(3), 6–10. https://journal.ipb.ac.id/index.php/JIPI/article/view/13906
- Polson, A., von Wechmar, M. B., & van Regenmortel, M. H. V. (1980). Isolation of viral igy antibodies from yolks of immunized hens. Immunological Investigations, 9(5), 475–493. https://doi.org/10.3109/08820138009066010
CrossRef - Porath, J., Maisano, F., & Belew, M. (1985). Thiophilic adsorption – a new method for protein fractionation. FEBS Letters, 185(2), 306–310. https://doi.org/10.1016/0014-5793(85)80928-5
CrossRef - Rizkiantino, R., Wibawan, I. W. T., Pasaribu, F. H., Soejoedono, R. D., Poetri, O. N., Arnafia, W., Sasi, K. D., & Reisinta, D. (2020). THE POTENTIAL OF ADJUVANT AGAINST PRODUCTION OF ANTISTREPTOCOCCAL IMMUNOGLOBULIN Y (IGY) IN AQUACULTURE. Jurnal Kedokteran Hewan – Indonesian Journal of Veterinary Sciences, 14(3), 66–72. https://doi.org/10.21157/j.ked.hewan.v14i3.16911
CrossRef - Saiki, R. K. (1989). The Design and Optimization of the PCR. In PCR Technology (pp. 7–16). Palgrave Macmillan UK. https://doi.org/10.1007/978-1-349-20235-5_1
CrossRef - Shawky, S. M., Bald, D., & Azzazy, H. M. E. (2010). Direct detection of unamplified hepatitis C virus RNA using unmodified gold nanoparticles. Clinical Biochemistry, 43(13–14), 1163–1168. https://doi.org/10.1016/j.clinbiochem.2010.07.001
CrossRef - Smith, C. J., & Osborn, A. M. (2009). Advantages and limitations of quantitative PCR (Q-PCR)-based approaches in microbial ecology. FEMS Microbiology Ecology, 67(1), 6–20. https://doi.org/10.1111/j.1574-6941.2008.00629.x
CrossRef - Stålberg, J., & Larsson, A. (2009). Upsala Journal of Medical Sciences Extraction of IgY from egg yolk using a novel aqueous two-phase system and comparison with other extraction methods. https://doi.org/10.3109/2000-1967-162
CrossRef - Sulk, B., Birkenmeier, G., & Kopperschläger, G. (1992). Application of phase partitioning and thiophilic adsorption chromatography to the purification of monoclonal antibodies from cell culture fluid. Journal of Immunological Methods, 149(2), 165–171. https://doi.org/10.1016/0022-1759(92)90247-Q
CrossRef - Vaise Malekshahi, Z., Mousavi Gargari Seyed, L., & Shirazi Mohamad, H. (2011). Comparison of IgY extraction methods. Clinical Biochemistry, 44(13), S138. https://doi.org/10.1016/j.clinbiochem.2011.08.334
CrossRef - Warr, G. W., Magor, K. E., & Higgins, D. A. (1995). IgY: clues to the origins of modern antibodies. Immunology Today, 16(8), 392–398. https://doi.org/10.1016/0167-5699(95)80008-5
CrossRef - World Health Organization. (n.d.). WHO Coronavirus Disease (COVID-19) Dashboard. Retrieved January 3, 2021, from https://covid19.who.int/
- Xu, J., Wang, J., Zhong, Z., Su, X., Yang, K., Chen, Z., Zhang, D., Li, T., Wang, Y., Zhang, S., Ge, S., Zhang, J., & Xia, N. (2020). Room-temperature-storable PCR mixes for SARS-CoV-2 detection. Journal of Cleaner Production, 84, 73–78. https://doi.org/10.1016/j.clinbiochem.2020.06.013
CrossRef
Abbreviation
| SARS | Severe Acute Respiratory Syndrome |
| ELISA | Enzyme-Linked Immunosorbent Assay |
| AGPT | Agar Gel Precipitation Test |
| SARS-CoV-2 | Severe Acute Respiratory Syndrome Coronavirus 2 |
| SPR | Surface Plasmon Resonance |
| PCR | Polymerase chain reaction |
| RBD | Receptor-Binding Domain |
| AGPT | Agar Gel Precipitation Test |

