
Food Supply Chain Sustainability Strategy for Fresh Retailer and Multi-Output Random Fresh Suppliers after COVID-19
School of Public Policy & Management, Tsinghua University, Beijing 100084, China
Sustainability 2023, 15(1), 546; https://doi.org/10.3390/su15010546
Submission received: 3 November 2022
/
Revised: 23 December 2022
/
Accepted: 24 December 2022
/
Published: 28 December 2022
(This article belongs to the Special Issue Sustainability in Agri-Food Supply Chain: From Farm to Fork)
Abstract
:Feeding people sustainably during the COVID-19 pandemic remains a challenge, as food productivity is declining and there is a risk of chain breakage at any time. To maintain the core function of supplying food to end consumers, a new framework must be developed to investigate the strategies for coordinating a new supply chain comprised of multiple suppliers with random output. Thus, in both decentralized and centralized systems, this paper constructs a supply chain model of a retailer procuring from multiple suppliers and characterizes each party’s optimal decisions. These results show that: (1) the optimal order quantity, profit of each part, and overall profit of the supply chain in the concentrated situation are better than those in the decentralized situation, and the transmission mechanism is slightly different from the classic newsboy model; (2) a supply chain coordination contract consisting of price discounts and compensation is designed, which can realize the coordination of a retailer and multiple suppliers with random yield in the endogenous price situation. These results imply that managers can develop sustainable food supply chains during uncertain times by ordering from these multi-suppliers with random yield. This paper adds to the literature on random yield assembly systems by taking into account that multiple suppliers have random component distributions.
1. Introduction
The food supply chain plays a significant role in decreasing hunger, malnutrition, and food insecurity [1,2]. However, the COVID-19 outbreak has obstructed all stages of the agri-food supply chain (AFSC), including the production stage, transportation stage, and access to markets [3]. These small and medium enterprises (SMEs) in the AFSC are considered more vulnerable [4]. This pandemic has disrupted the AFSC in the following ways: shortage of farm workers, limitation of food accessibility, restriction in the transportation of farm commodities, shutdown of food production facilities, uncertainty of food quality and safety, restriction of food trade policies, delays in food product transportation, etc. [5]. A decrease in food production rate is one of the effects on the food supply chain [6,7]. The reduction in food production rate leads to a reduction in food production capacity [8,9]. Due to the mobility restriction, agricultural production in Southeast Asia is estimated to fall by 3.11% (around 17.03 million tons) in the first quarter of 2020 [10]. Furthermore, fresh agricultural products are affected by weather and their lifecycles, increasing the risk of uncertainty and disruption to agricultural supply. Several food organizations have been prompted to rethink their strategies for their long-term strategies, such as expanding procurement sources [11].
As a result of the above mentioned, understanding how to coordinate multiple suppliers with random output and investigating supply chain operational strategies is critical for maintaining the core function of supplying food to end consumers [12]. Improving the sustainability of fresh agricultural product supply chains is a key issue faced by fresh retailers and multiple suppliers with random output. With rapid development and applications of information communication technologies, firms are increasingly adopting online sales channels to market remanufactured products in order to facilitate the sustainable operations of supply chains [13]. Kechagias et al. [14] found that a cybersecurity systemic approach could help a maritime company assess its current status, collect evidence and objectively determine security gaps, and achieve mitigation of cyber risks. Gayialis et al. [15] found that blockchain technology could significantly reduce counterfeiting in the wine supply chain.
Furthermore, some studies have looked into how uncertainty affects the food supply chain. Achmad et al. [16] proposed an integrated framework that combines the agent-based modeling and robust optimization approach to solve food supply chain problems under uncertainties involving normal and pandemic conditions. Perdana et al. [17] studied three scenarios of the food supply chain during COVID-19, which considered food consumption, food production, and food distribution cost uncertainty. Feng et al. [18] investigated the effect of random component yields on pricing and production decisions in a decentralized assembly system using pull and push contracts. Nevertheless, one gap of the study is use of the minimum of the multiple suppliers for determining the final product quantity instead of the sum of the multiple suppliers.
To fill the gap of previous studies, this paper proposes a new framework to explore the strategies and coordination of a fresh supply chain consisting of multiple suppliers with random output. We try to address the following questions. First, what are the optimal price and quantity decisions in the fresh supply chain consisting of a retailer and multiple suppliers with random output? Second, how can such supply chains consisting of multiple suppliers be coordinated, and what type of contract should be employed in a situation where the demand depends on the price and product freshness?
To answer the preceding questions, we establish mathematical models for centralized, decentralized, and contractual fresh supply chains. We explore and characterize the optimal decisions of the retailer and multiple suppliers in the fresh supply chain under different fresh supply chain structures. In addition, we design and investigate a new contract mechanism to coordinate this situation, where demand depends on price and product freshness. This can allow the food supply chain to continue to operate and maintain its core function of supplying food to end consumers.
We contribute to the current literature in the following two aspects. First, we enriched the literature on sustainable agri-food food supply chain by considering random yields from multiple suppliers after COVID-19. Second, the new contract mechanism of a price-discount sharing mechanism together with a compensation scheme can coordinate the multiple suppliers with random output and the retailer in the situation where the demand depends on the price and product freshness.
The rest of the article is structured as follows. Section 2 provides a critical literature review and highlights the limitations of the existing literature and the motivation for the present study. Section 3 provides our problem formulation and the assumptions of this study. In Section 4, we analyze the optimal decisions in the centralized system, and the decentralized system is characterized. Then, we compare the optimal decisions of both the centralized system and the decentralized system and propose an incentive scheme that can motivate all the multiple suppliers and retailers to adopt coordinated decisions. In Section 5, we discuss the findings. In Section 6, we summarize the remarks, the limitations and the future study directions. The technical proofs are relegated to Appendix A to smooth out the flow of the presentation.
2. Literature Review
The literature on AFSC research in the COVID-19 era is increasing, and our research involves three areas of literature: AFSC resilience, multiple purchasing strategies, and supply chain coordination strategies.
Due to the COVID-19 increased supply chain volatility, resilience in agri-food supply chains (AFSCs) is becoming increasingly important. To achieve operational excellence during the pandemic, firms often need to proactively develop capabilities to build supply chain resilience [19]. AFSCs are incredibly complex systems involving myriad bio-geophysical, social, economic, and political drivers. AFSCs’ resilience must consider more than the traditional phases of resisting and recovering from disruption and also include anticipation and post-disruption learning [12]. With the rapid development and applications of information communication technologies, some technologies, such as the blockchain traceability system, are critical for improving AFSC resilience. Ali et al. [20] discovered that many SMEs in Australia proactively implemented measures to improve their anticipation capability (social distancing, masking, sanitization, and use of digital technologies), resulting in tangibly lower reported losses. Zhao et al. [21] found that collaboration was one of the key factors contributing to resilience in a systematic literature review of agri-food supply chains.
Sourcing is affected by farmers’ difficulties in the procurement of seeds, sowing, unavailability of labor, and harvesting [22]. Multiple purchasing strategies are critical to manage supply risks. It is necessary to develop the optimum food supply chain strategy by determining the optimal food hub location and food network to maintain food security which is robust against disruptions and uncertainties [16]. Kumar et al. [23] studied the influence of competition and supply uncertainty on optimal multi-sourcing. Yan et al. [24] investigated the effect of downstream firm competition and supply risk on optimal multi-sourcing. Fang and Shou [25] also investigated the effect of downstream firm competition and supply risk on optimal multi-sourcing. In contrast to these studies, we focus on studying the optimal purchase volume, retail price decision and coordination contract under multiple suppliers with random yields.
The remaining papers extensively displayed coordination contracts, showing that appropriate coordination strategy can effectively improve supply chain performance [26]. Zhao et al. [27] found that a modified revenue-sharing contract could coordinate the supply chain composed of a manufacturer and a retailer under generic random demand. Pourmohammad-Zia et al. [28] thought that a vendor-managed inventory and cost-sharing collaboration scheme could enhance the performance of the chain. Lin et al. [29] found that supply chain contracts together with the food safety mechanism can drastically improve food safety, consumer confidence, and the resulting profits of a food supply chain. Yang and Qian [30] coordination strategy can improve the retailers’ anti-epidemic efforts and social welfare level within the reasonable marginal revenue range of anti-epidemic efforts. As reverse logistics becomes increasingly important in the globalized world, GyengeBalázs et al. [31] laid the foundations for the development of reverse logistics integration with logistics partners.
In summary, this paper focuses on establishing a single-period, two-echelon fresh supply chain composed of multi-suppliers and a single fresh retailer in the context of the pandemic, and analyzing the sum of multi-suppliers with random yields, and on designing a coordination contract under an endogenously determined retail price. Therefore, the main contributions of our work are as follows. We add to the literature on random yield assembly systems by taking into account the suppliers’ random component yields and fill gaps in the existing literature. Furthermore, we design a new contract mechanism consisting of a price-discount sharing mechanism and a compensation scheme, increasing the number of papers on coordination contracts.
3. Model Description and Assumptions
3.1. Model Description
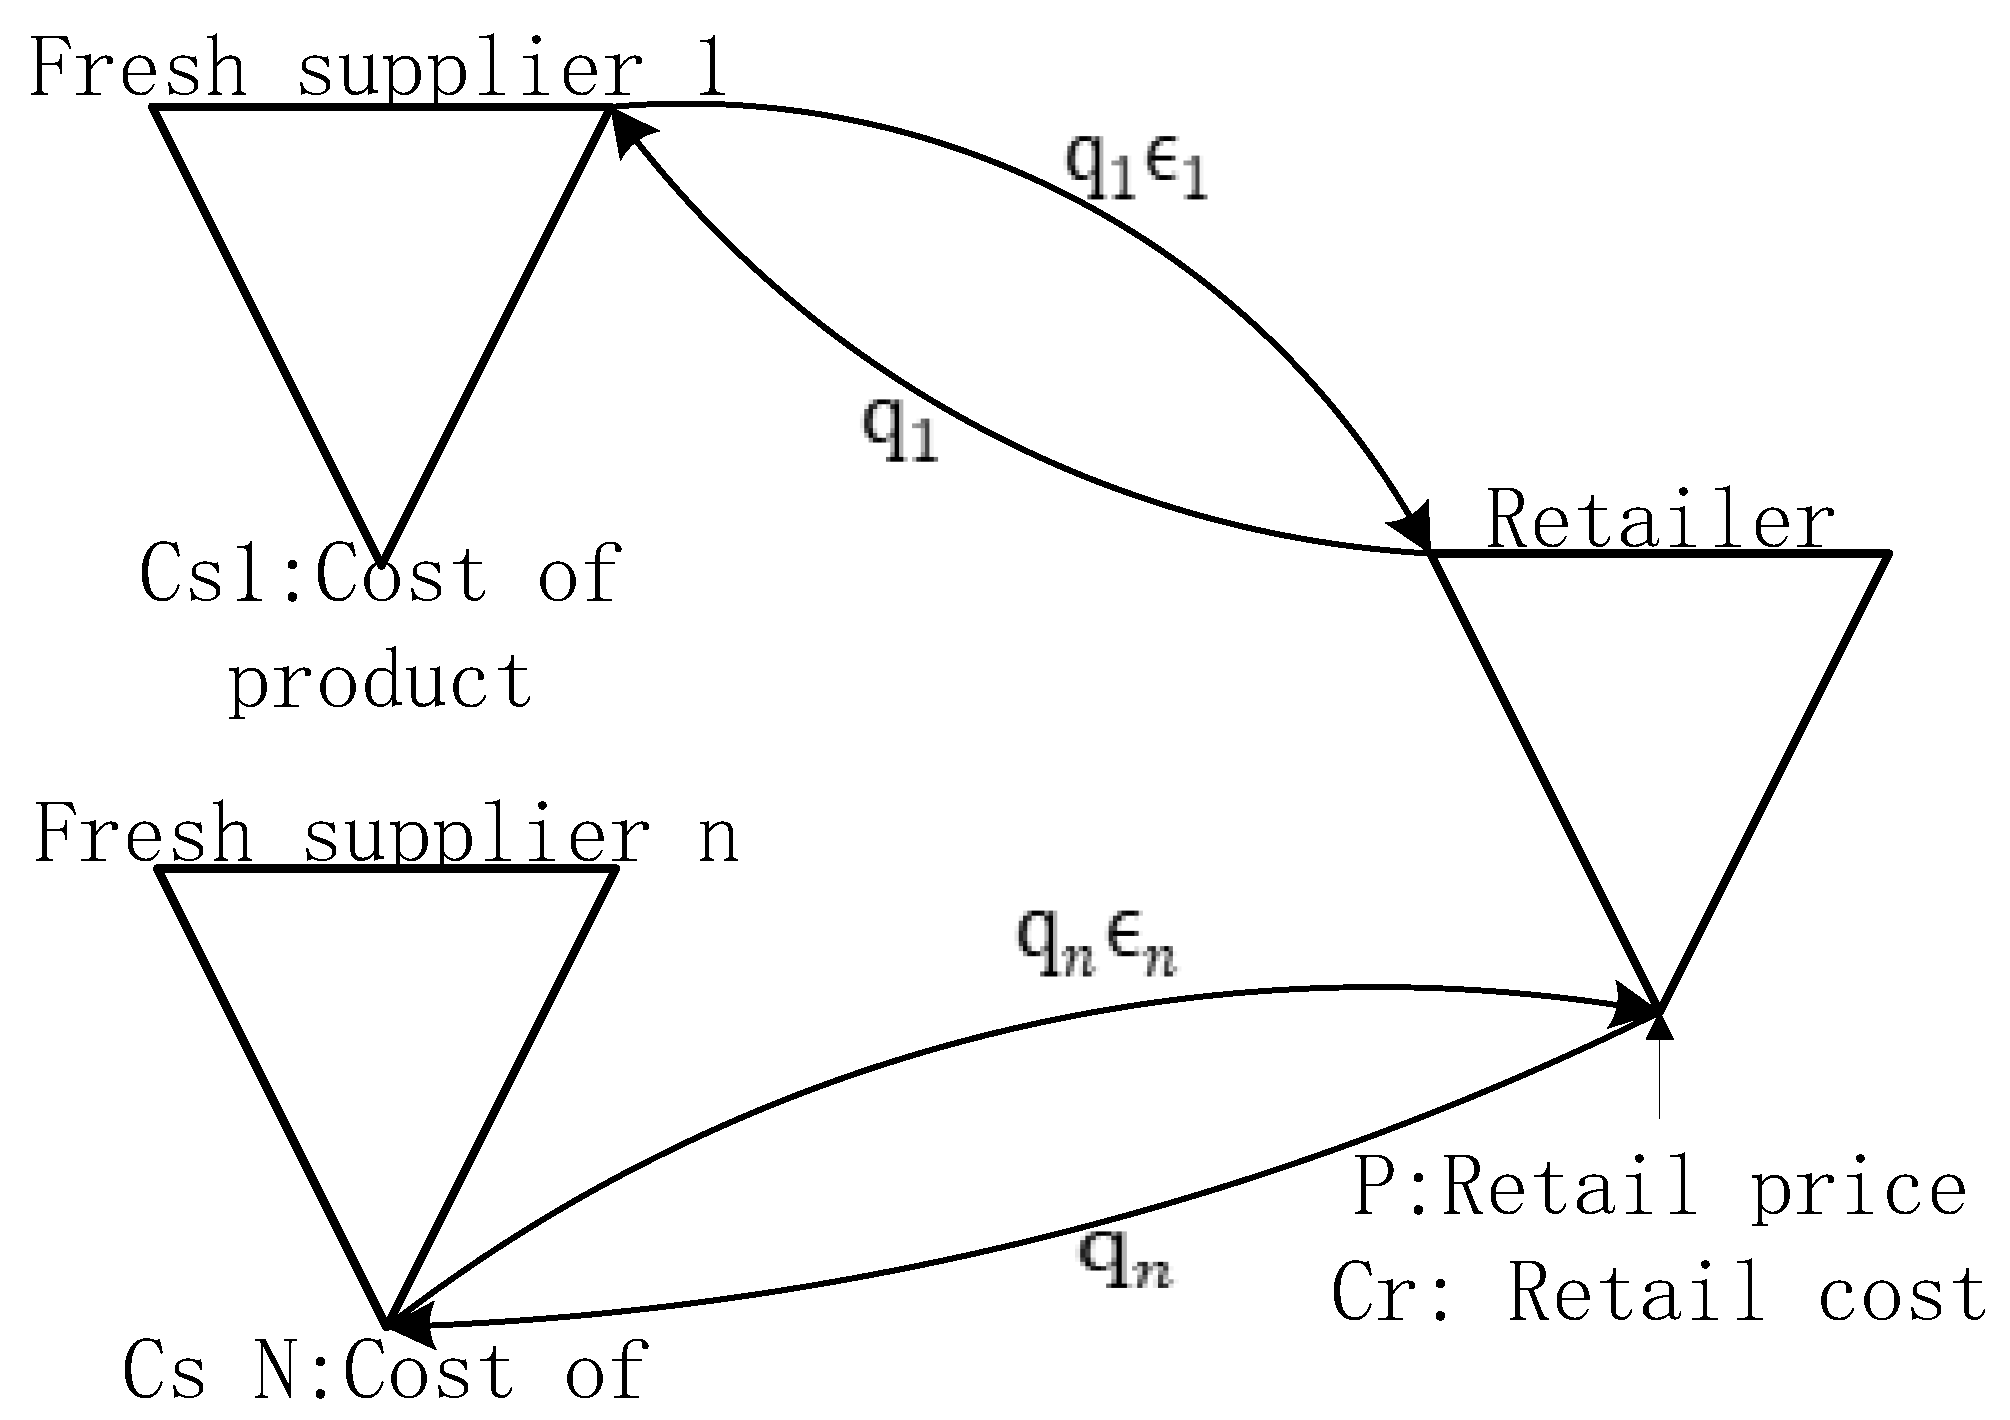
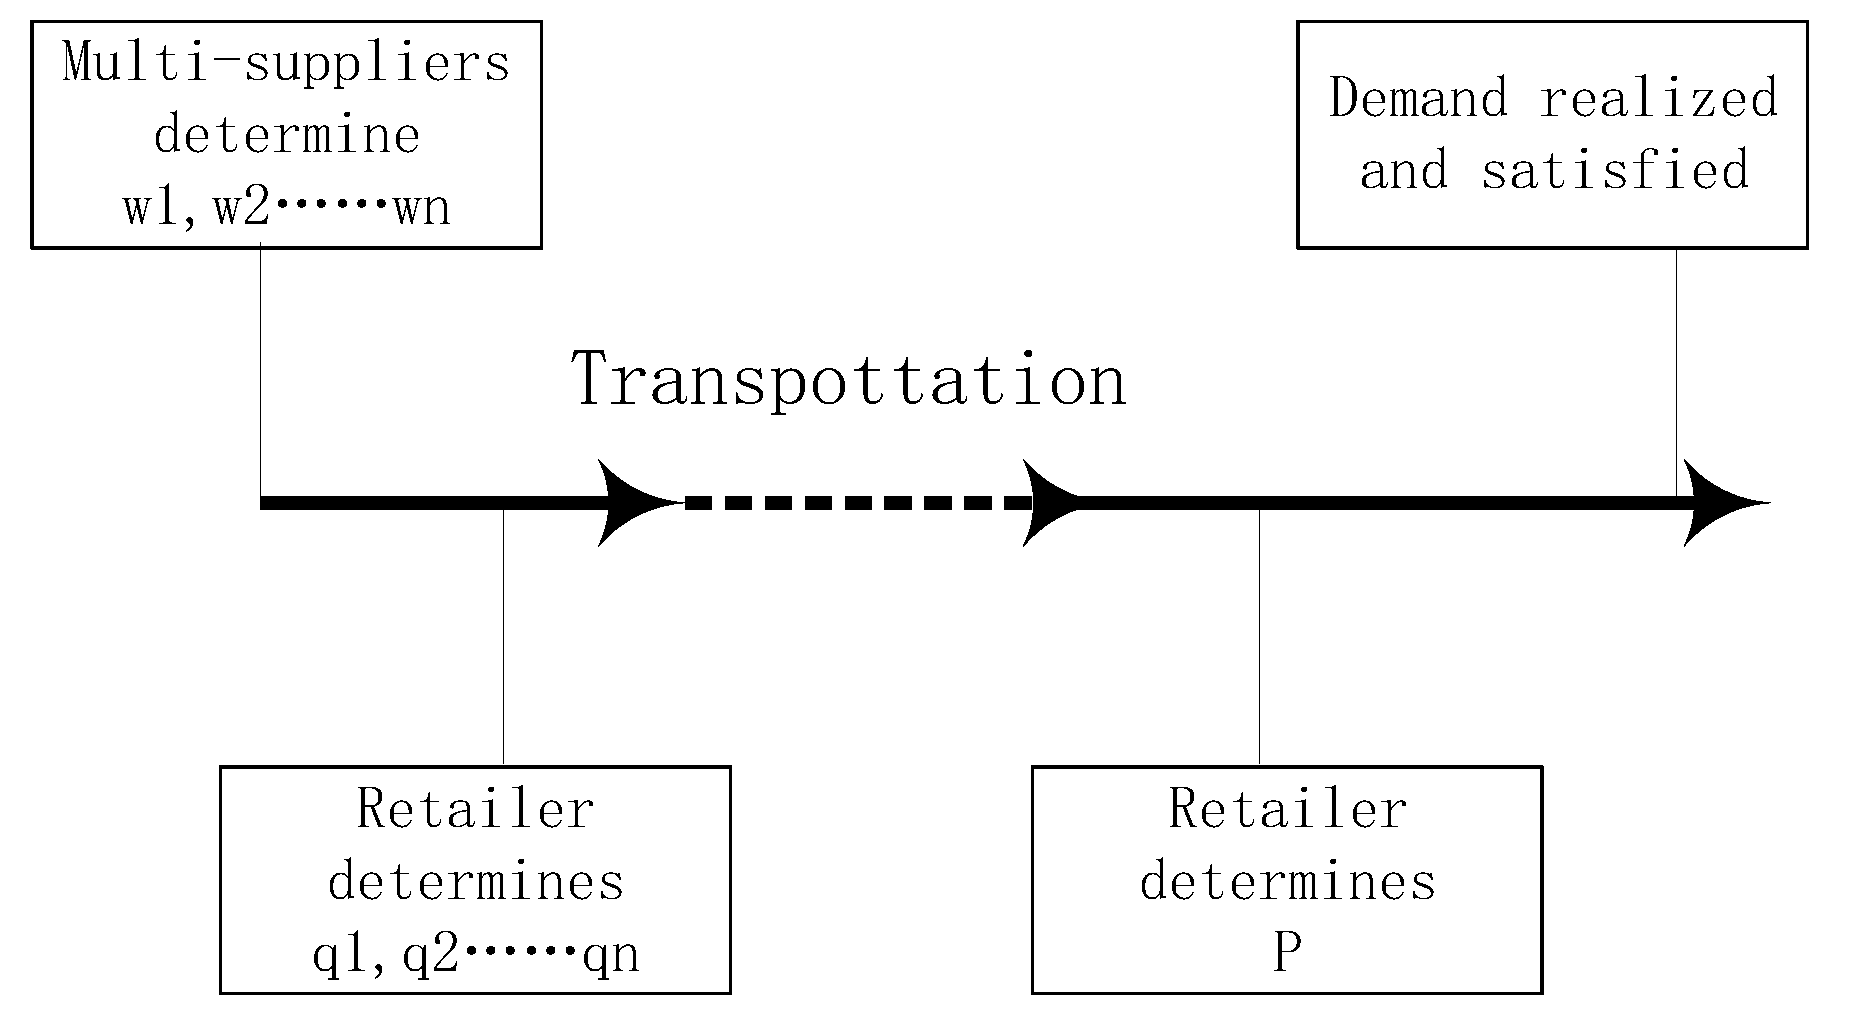
We study a single-period, two-echelon fresh supply chain composed of multi-suppliers who produce fresh, short lifecycle products with random yield and a single fresh retailer who orders from these multi-suppliers to meet the market demand. The final product of the retailer is the sum of the yields of N suppliers. The model is shown in Figure 1. The lead time of the fresh products is usually long. Consequently, the retailer has no additional opportunity to replenish inventory once the season begins. So, both the retailer and these multi-suppliers make decisions prior to the selling season. The timeline of events is shown in Figure 2.
3.2. Model Assumption
- (1)
- The market demand for the product depends on its freshness, price, and market size [32]. In general, we can use a multiplicative demand function when the market has a constant price elasticity, namely, [33], where represents market size, b represents price elasticity, , represents the freshness of the fresh product, and .
- (2)
- The retailer procures from the N suppliers in quantities at the wholesale prices , which are set by N suppliers, and the cost of selling the fresh product is .
- (3)
- Each of the N suppliers produces the product at a unit production cost . Due to the effect of the weather, the yield of each supplier is random, namely, , where is a random variable that represents the supply reliability factor. The PDF and CDF are , respectively. The expected value of is , supposing is an independent and identical distribution.
- (4)
- Suppose that the order quantities of each supplier are the same number, namely, , and . The set , where the density function and CDF are respectively. The expected value of is . Let , and suppose the is increasing in . In addition, is the generalized failure rate of the demand distribution for .
For ease of reference, we list the notations we use in this paper in Table 1.
4. Optimal Decisions in the Centralized Situation and Decentralized Situation
4.1. Optimal Decisions in the Centralized Situation
Under centralized decision making, the producer and the distributor make decisions to optimize the integrated supply chain’s objective. In addition, they face the product cost and the selling cost ; the expected sales are . The expected profit of the integrated supply chain can then be formulated in the following way:
Based on the model of [34], we can define and call it the ‘‘stocking factor’’, and . Suppose the unit product cost of N suppliers is the same, namely, ; we can rewrite as follows:
Theorem 1.
For any given qfc, D(pc, θ) and , there exists a unique optimal selling price for a distributor who sells to the target market as follows:
where is the unique solution to . The proofs of our main results, together with all necessary lemmas, are relegated to Appendix A.
After determining the optimal retail price, we need to determine the optimal order quantity of the fresh agricultural products. By substituting Equation (3) into Equation (2), we can rewrite the distributor’s expected profit function as follows:
The first order of is
Therefore, we can obtain the optimal order quantity by setting Formula (5) equal to 0:
The second-order differential of is as follows:
As the second-order differential of , the is the only optimal order quantity and maximizes the profit of the integrated supply chain.
From the formulation of in Equation (6), we obtain the following insights. First, the optimal order quantity of fresh agricultural products decreases with an increase in the number of fresh suppliers. Second, the retailer always orders less if the product is perishable (instead of ordering more to make up for the quantity lost during transportation) because for perishable product. Third, the relationship between the optimal order quantity of fresh agricultural products and supply uncertainty is affected by the cumulative distribution function of the sum of the random supply factors.
By substituting Equation (6) into Equation (3), the optimal retail price can be written as follows:
By substituting Equations (6) and (8) into Equation (2), the optimal profit of the integrated supply chain can be expressed as:
The formulation of in Equation (9) gives us some insights. First, the profit of the supply chain increases with the increase in the freshness of agricultural products because the increase in freshness will increase the expected retail volume and increase the retail price. Second, the relationship between profit and supply uncertainty is affected by the cumulative distribution function of the sum of the random supply factors.
4.2. Optimal Decisions in the Decentralized Situation
In this section, we characterize the optimal decisions of the suppliers and the retailer in the decentralized situation through the method of reverse ordering. First, given any order quantities and a random variable, we calculate the optimal selling price. Then, we derive the optimal order quantity for any wholesale price. Finally, the optimal wholesale price can be obtained by considering its impact on the retailer’s decisions.
4.2.1. Optimal Decisions of the Retailer
The decisions of the distributor include the optimal order quantity and optimal retail price, and they are obtained in reverse order. First, the retailer maximizes her own profit by setting an optimal selling price, which is given as:
We assume that the wholesale prices of these suppliers are the same, namely, , and the retailer’s profit function can be rewritten as:
The formulation of Equation (16) is similar to the traditional newsvendor problem; the wholesale price vanishes in the centralized system. We can obtain the optimal selling price by maximizing Equation (11). Then, the optimal order quantity can be derived from:
As the formulations of Equations (11) and (12) are similar to those of Equations (2) and (4) in the centralized situation, the difference between them is that the is substituted by . Therefore, we can obtain the optimal selling price, optimal order quantities, and optimal price as follows:
4.2.2. Optimal Decisions of the Suppliers
As these suppliers are homogenous, we can consider the to be representative. Additionally, the supplier determines the input by considering the order quantities and determines the wholesale price by considering the actual yield. Then, the supplier maximizes her own profit, which is given as:
By substituting Equation (14) into Equation (16), the profit of the supplier can be expressed as:
The optimal wholesale price can be derived from the first order of , which is equal to 0:
The second-order differential of is as follows:
By substituting Equation (19) into Equation (20), the formulation of Equation (20) can be rewritten as follows:
As the second-order differential of , the is the only optimal order quantity and maximizes the profit of the integrated supply chain.
The optimal quantities, the optimal price, and the optimal profit of the retailer can be derived by substituting Equation (19) into Equations (13)–(15).
The optimal profit of the supplier can be obtained by substituting Equations (19) and (23) into Equation (16):
As there are N suppliers, the total profit of the N suppliers is as follows:
The sum of the profit of the retailer and N suppliers can be given as:
As the formulations of and in the decentralized situation are similar to the formulations of and in the centralized situation, the impacts of the number of suppliers, the freshness, and the random yield on the optimal order quantities and the optimal profit in the centralized situation are suitable for the decentralized situation.
4.3. Comparisons
By contrasting the centralized supply chain and the decentralized supply chain with regard to the optimal retail price, optimal order quantities, and optimal profit, we can obtain the following proposition:
- (1)
- . Proof, =;
- (2)
- . Proof. , and . Therefore, .
- (3)
- . The proofs of our main results, together with all necessary lemmas, are relegated to Appendix B.
Proposition 1 indicates that the optimal retail price of the decentralized situation is higher than that of the centralized situation. However, the total profit of the decentralized situation is less than that of the centralized situation, which is similar to the results of the classic newsboy model. However, the transmission mechanism of our model is different from that of the classic newsboy model. The demand in our model is a function of the retail price, and the price elasticity of a fresh product is greater than one. Although, the double marginal effects increase retail prices and decrease optimal quantities. However, the increase in profit due to the price increase cannot compensate for the decrease in profit due to the expected decrease in sales. In the classic newsboy model, the retail price is constant, and the double marginal effects decrease the optimal quantities, so the profit of the supply chain decreases.
4.4. Supply Chain Coordination
Coordination between the two parties should cause the optimal decisions of the centralized system to be adopted. In addition, it is also well known that the parties will accept such a contract only when they do not need to sacrifice their own profit (in contrast to situations with no contract).
From Proposition 1, we know that , and from the formulation of , it is known that coordination between the two parties can be achieved when the wholesale price is equal to the product cost, namely, . The expected profit of the producer will be equal to zero, which would not be acceptable to the producer. This coordination is not feasible.
In addition, because the retail price of fresh products is endogenous, we need to design the contract without a constant wholesale price and buy-back rate. Based on the coordination contract designed by Cai et al. [35] and Bernstein and Federgruen [36], we propose a new incentive contract that includes two parts.
One part is linear price-discount sharing:
where is the unit product cost for quantity, , and , is the net profit share of each supplier, and represents the retailer’s net profit share.
The other part is a compensation contract:
where and represents each manufacturer’s compensation for unsold fresh produce.
Thus, we can rewrite the profit function of the retailer as follows:
Under the condition of a coordination contract, both the retailer and the supplier will need their profit to be greater than that in a decentralized situation. Thus, satisfies the following conditions:
From Equations (31) and (32), we can obtain the choice of , namely, , which depends on the bargaining powers of the two parties.
4.5. Numerical Examples
In this section, we performed a set of numerical experiments to generate additional insights from our analysis. We conducted research to determine the effects of random yield and supplier number due to a lack of coordination between the producer and the distributor.
Set the fresh agricultural product’s production cost and elasticity parameter value (see Table 2). On the one hand, the proportion of sales cost to production cost can be derived from empirical research on the circulation of fresh agricultural products from the place of origin to the consumer, which is 68.6%, 65.7%, and 62.5%. The proportion in this section is the mean of the three values, namely 65.6%. On the other hand, the price elasticity of pork, poultry, vegetables, and fruits is , and . Similarly, the price elasticity of fresh products is the mean of price elasticity of the four fresh products, namely .
Setting the random factor’s parameter value for the yield of fresh agricultural products (see Table 2), we used the normal distribution for the yield random, namely , where , . From the property of normal distribution, it is well known that .
4.5.1. Impact of Supply Uncertainty
As the random variable follows a normal distribution, the degree of uncertainty varies with the number of suppliers. To analyze the impact of supply uncertainty, we set the number of suppliers at five, namely .
Observe from Table 3 that: (1) The optimal order quantity is increasing in both concentrated and decentralized situations because the retailer needs more orders in response to supply uncertainty. (2) As the supply uncertainty of fresh produce increases, the profit of fresh produce suppliers, retailers, and supply chains increases. (3) The overall profit of the fresh product supply chain under the discounted price-sharing contract is greater than the overall profit of the fresh product supply chain under the simple wholesale price contract. Moreover, their profit margin increases as the uncertainty of the supply of fresh produce increases. The observations (3) imply that supply chain coordination has more advantages when supply uncertainty increases.
4.5.2. Impact of the Number of Suppliers
The uncertainty will increase as the number of suppliers increases, and the profit of the supplier, the retailer, and the supply chain should increase as a result of the analysis of the impact of the supply uncertainty. However, Table 4 shows that the observers do not present the expected results. (1) The optimal order quantity in both concentrated and dispersed situations is declining. (2) The overall profit of fresh produce suppliers, retailers, and supply chains is declining. The increase in the number of suppliers makes the cost of procurement and sales greater, and the increase in uncertainty is offset by the loss of profits from the increase in the number of suppliers. (3) The overall profit of the fresh product supply chain under the discounted price-sharing contract is greater than the overall profit of the fresh product supply chain under the simple wholesale price contract. Moreover, their profit margin decreases as the number of suppliers increases. The observations (3) imply that supply chain coordination has fewer advantages when the number of suppliers increases.
5. Discussion
The key feature of fresh product supply chains during COVID-19 is that the pandemic has caused uncertainty in demand and supply and increased the complexity of the food supply chain [37]. An important issue confronted by the distributor is the amount of resources that should be invested to maintain a steady supply of fresh product. The current paper conducts a thorough investigation into this issue.
Our findings show that there is a significant relationship between the overall profit of the fresh product supply chain and the number of suppliers. The increase in the number of suppliers makes the cost of procurement and sales greater, and the profit margin decreases as the number of suppliers increases. According to Perdana et al. [17], the total logistics cost will increase as the number of red zones increases, because each location will need to build regional food hubs and fulfill food needs independently. In the COVID-19 era, digital food services could also reduce food loss and waste, enable a traceability system, meet customer nutrition needs, and provide a quick response to impending economic crises [1]. Therefore, the fresh food supply chain can reduce the number of suppliers by using digital technology such as e-commerce and the Internet of Things (IoT).
Our study offers a supply chain contract that can coordinate a retailer and multi-suppliers with random yields under an endogenously determined retail price. This contract consists of a linear price-discount sharing contract and a compensation contract that extends these contracts with a constant per-unit wholesale price and a constant buy-back rate. They cannot achieve coordination for any problem under an endogenously determined retail price [36]. Cai et al. [35] offered the contracts with a price-discount sharing and a compensation contract that could coordinate a producer and a distributor in a situation where the demand depends on the price and the product freshness. Achmad et al. [16] also proposed an integrated framework for solving food supply chain problems under uncertainty, which included agent-based modeling and a robust optimization approach. Digital food services could be adopted to optimize the fresh food supply chain. E-commerce and the Internet of Things (IoT) not only improve food security but also enhance food safety [38].
6. Conclusions
This paper constructed a supply chain model consisting of retailers and multiple suppliers with random yields, and studied member decisions in decentralized and centralized situations. The result findings imply managers can develop sustainable food supply chains during uncertain times by ordering from these multi-suppliers with random yield. Each part of the food supply chain can receive enough income to keep their production sustainable through the supply chain coordination contract, which consists of price discounts and compensation contracts.
However, there are some limitations to this paper that point to potential areas for future research. First, this paper considered the situation where the relationships between the suppliers with random yield are mutually independent. Other types of relationships, however, can exist between multiple suppliers with varying yields. As a result, future research could consider a cooperative that is responsible for assembling multi-suppliers. Second, the premise of the model assumes information symmetry among supply chain participants. When there is information asymmetry and multiple selling periods between the retailer and multiple suppliers, the coordination and decisions of the members in the supply chain become complicated. Therefore, future research could consider solving the information asymmetry model by using the asymmetric information game model more.
Funding
This research received no external funding.
Institutional Review Board Statement
Not applicable.
Informed Consent Statement
Not applicable.
Data Availability Statement
Not applicable.
Conflicts of Interest
The authors declare no conflict of interest.
Appendix A
Proof of m∗ is the unique solution:
The first-order differential of is as follows:
We set:
Therefore, the first-order differential of is as follows:
From Assumption (4), we can obtain so because:
So, there is exit only making maximize . In addition, is the only solution .
Appendix B
Proof of
As and , we can obtain:
Therefore, we can set:
The first-order differential of is:
so is strictly increasing with because:
References
- Sarfarazi, M.; Jafari, S.M.; Rajabzadeh, G.; Galanakis, C.M. Evaluation of microwave-assisted extraction technology for separation of bioactive components of saffron (Crocus sativus L.). Ind. Crop. Prod. 2020, 145, 111978. [Google Scholar] [CrossRef]
- Devereux, S.; Bene, C.; Hoddinott, J. Conceptualising COVID-19’s impacts on household food security. Food Secur. 2020, 12, 769–772. [Google Scholar] [CrossRef] [PubMed]
- Torero, M. Without food, there can be no exit from the pandemic. Nature 2020, 580, 588–589. [Google Scholar] [CrossRef] [PubMed] [Green Version]
- Ali, I.; Golgeci, I. Managing climate risks through social capital in agrifood supply chains. Supply Chain. Manag. Int. J. 2021, 26, 1–16. [Google Scholar] [CrossRef]
- Alabi, M.O.; Ngwenyama, O. Food security and disruptions of the global food supply chains during COVID-19: Building smarter food supply chains for post COVID-19 era. Br. Food J. 2022, 125, 167–185. [Google Scholar] [CrossRef]
- Mahajan, K.; Tomar, S. COVID-19 and supply chain disruption: Evidence from food markets in india. Am. J. Agric. Econ. 2021, 103, 35–52. [Google Scholar] [CrossRef]
- Udmale, P.; Pal, I.; Szabo, S.; Pramanik, M.; Large, A. Global food security in the context of COVID-19: A scenario-based exploratory analysis. Progress in Disaster Science 2020, 7, 100120. [Google Scholar] [CrossRef]
- Butu, A.; Bruma, I.S.; Tanasa, L.; Rodino, S.; Dinu Vasiliu, C.; Dobos, S.; Butu, M. The impact of COVID-19 crisis upon the consumer buying behavior of fresh vegetables directly from local producers. Case study: The quarantined area of suceava county, romania. Int. J. Environ. Res. Public Health 2020, 17, 5485. [Google Scholar] [CrossRef]
- O’Hara, S.; Toussaint, E.C. Food access in crisis: Food security and COVID-19. Ecol. Econ. 2021, 180, 106859. [Google Scholar] [CrossRef]
- Gregorioa, G.B.; Ancog, R.C. Assessing the impact of the COVID-19 pandemic on agricultural production in southeast asia: Toward transformative change in agricultural food systems. Asian J. Agric. Dev. 2020, 17, 1–13. [Google Scholar] [CrossRef]
- Rejeb, A.; Rejeb, K.; Appolloni, A.; Iranmanesh, M.; Treiblmaier, H.; Jagtap, S. Exploring food supply chain trends in the COVID-19 era: A bibliometric review. Sustainability 2022, 14, 12437. [Google Scholar] [CrossRef]
- Stone, J.; Rahimifard, S. Resilience in agri-food supply chains: A critical analysis of the literature and synthesis of a novel framework. Supply Chain. Manag. Int. J. 2018, 23, 207–238. [Google Scholar] [CrossRef] [Green Version]
- Han, X.; Chen, Q. Sustainable supply chain management: Dual sales channel adoption, product portfolio and carbon emissions. J. Clean. Prod. 2021, 281, 125127. [Google Scholar] [CrossRef]
- Kechagias, E.P.; Chatzistelios, G.; Papadopoulos, G.A.; Apostolou, P. Digital transformation of the maritime industry: A cybersecurity systemic approach. Int. J. Crit. Infrastruct. Prot. 2022, 37, 100526. [Google Scholar] [CrossRef]
- Gayialis, S.P.; Kechagias, E.P.; Papadopoulos, G.A.; Kanakis, E. A smart-contract enabled blockchain traceability system against wine supply chain counterfeiting. In IFIP International Conference on Advances in Production Management Systems; Kim, D.Y., Ed.; Springer: Cham, Switzerland, 2022; pp. 477–484. [Google Scholar]
- Achmad, A.L.H.; Chaerani, D.; Perdana, T. Designing a food supply chain strategy during COVID-19 pandemic using an integrated agent-based modelling and robust optimization. Heliyon 2021, 7, e08448. [Google Scholar] [CrossRef]
- Perdana, T.; Chaerani, D.; Achmad, A.L.H.; Hermiatin, F.R. Scenarios for handling the impact of COVID-19 based on food supply network through regional food hubs under uncertainty. Heliyon 2020, 6, e05128. [Google Scholar] [CrossRef]
- Feng, Y.; Li, G.; Sethi, S.P. Pull and push contracts in a decentralised assembly system with random component yields. Int. J. Prod. Res. 2018, 56, 7405–7425. [Google Scholar] [CrossRef]
- Sundarakani, B.; Pereira, V.; Ishizaka, A. Robust facility location decisions for resilient sustainable supply chain performance in the face of disruptions. Int. J. Logist. Manag. 2021, 32, 357–385. [Google Scholar] [CrossRef]
- Kherchi, I. Threats and opportunities for global food companies identifying social and environmental issues in food value chain to create shared value. Econ. -Innov. Econ. Res. 2020, 8, 61–72. [Google Scholar] [CrossRef]
- Zhao, G.; Liu, S.; Lopez, C. A literature review on risk sources and resilience factors in agri-food supply chains. Collab. A Data-Rich World 2017, 506, 739–752. [Google Scholar]
- Van Hoek, R. Research opportunities for a more resilient post-COVID-19 supply chain-closing the gap between research findings and industry practice. Int. J. Oper. Prod. Manag. 2020, 40, 341–355. [Google Scholar]
- Kumar, M.; Basu, P.; Avittathur, B. Pricing and sourcing strategies for competing retailers in supply chains under disruption risk. Eur. J. Oper. Res. 2018, 265, 533–543. [Google Scholar] [CrossRef]
- Yan, X.; Wang, Y.; Hong, Z. Comparison of bertrand and cournot competitions under random yield. Int. J. Prod. Res. 2016, 54, 3256–3276. [Google Scholar] [CrossRef]
- Fang, Y.; Shou, B. Managing supply uncertainty under supply chain cournot competition. Eur. J. Oper. Res. 2015, 243, 156–176. [Google Scholar] [CrossRef]
- Chen, Z.; Su, S.-I.I. Social welfare maximization with the least subsidy: Photovoltaic supply chain equilibrium and coordination with fairness concern. Renew. Energy 2019, 132, 1332–1347. [Google Scholar] [CrossRef]
- Zhao, X.; Li, N.; Song, L. Coordination of a socially responsible two-stage supply chain under random demand. Asia-Pac. J. Oper. Res. 2019, 36, 1950029. [Google Scholar] [CrossRef]
- Pourmohammad-Zia, N.; Karimi, B.; Rezaei, J. Food supply chain coordination for growing items: A trade-off between market coverage and cost-efficiency. Int. J. Prod. Econ. 2021, 242, 108289. [Google Scholar] [CrossRef]
- Lin, D.-Y.; Juan, C.-J.; Chang, C.-C. Managing food safety with pricing, contracts and coordination in supply chains. IEEE Access 2019, 7, 150892–150909. [Google Scholar] [CrossRef]
- Yang, S.; Qian, W. Effect of government subsidies on supply chain decision-making and coordination in the context of COVID-19. Rairo-Oper. Res. 2021, 55, 1885–1907. [Google Scholar] [CrossRef]
- GyengeBalázs; Mészáros, Z.; Péterfi, C.A. Process measurement and analysis in a retail chain to improve reverse logistics efficiency. Oper. Res. Eng. Sci. Theory Appl. 2022, 5, 152–175. [Google Scholar]
- Akcay, Y.; Natarajan, H.P.; Xu, S.H. Joint dynamic pricing of multiple perishable products under consumer choice. Manag. Sci. 2010, 56, 1345–1361. [Google Scholar] [CrossRef] [Green Version]
- McAfee, R.P.; te Velde, V. Dynamic pricing with constant demand elasticity. Prod. Oper. Manag. 2008, 17, 432–438. [Google Scholar] [CrossRef] [Green Version]
- Petruzzi, N.C.; Dada, M. Pricing and the newsvendor problem: A review with extensions. Oper. Res. 1999, 47, 183–194. [Google Scholar] [CrossRef]
- Cai, X.; Chen, J.; Xiao, Y.; Xu, X. Optimization and coordination of fresh product supply chains with freshness-keeping effort. Prod. Oper. Manag. 2010, 19, 261–278. [Google Scholar] [CrossRef]
- Bernstein, F.; Federgruen, A. Decentralized supply chains with competing retailers under demand uncertainty. Manag. Sci. 2005, 51, 18–29. [Google Scholar] [CrossRef] [Green Version]
- Chen, Y.-H.; Chen, M.-X.; Mishra, A.K. Subsidies under uncertainty: Modeling of input- and output-oriented policies. Econ. Model. 2020, 85, 39–56. [Google Scholar] [CrossRef]
- Deng, Q.; Zinoviadou, K.G.; Galanakis, C.M.; Orlien, V.; Grimi, N.; Vorobiev, E.; Lebovka, N.; Barba, F.J. The effects of conventional and non-conventional processing on glucosinolates and its derived forms, isothiocyanates: Extraction, degradation, and applications. Food Eng. Rev. 2015, 7, 357–381. [Google Scholar] [CrossRef]
Figure 1.
A single retailer and N suppliers.

Figure 2.
Timeline of events under consideration.


Table 1.
List of Notations.
| Symbol | Description |
|---|---|
| The retailer’s selling price | |
| The retailer’s order quantity | |
| The supplier’s wholesale price | |
| The unit production cost of the producer | |
| The unit selling cost of the retailer | |
| The market demand for the fresh product | |
| The price elasticity of the fresh product | |
| The freshness of the fresh product | |
| A random variable for the yield | |
| z | |
| The PDF function of the random variable z | |
| The CDF function of the random variable z | |
Table 2.
Model parameter values.
| Parameter | ||||||
|---|---|---|---|---|---|---|
| Value | 1000 | 1.108 | 0.52 | 0.8 | 0.1 |
Table 3.
Impact of supply uncertainty.
| 8 | 67.073 | 2645.675 | 5.084 | 2057.482 | 200.549 | 2063.626 | 582.048 | 387.645 |
| 7 | 66.437 | 2620.575 | 5.036 | 2037.962 | 198.646 | 2044.049 | 576.527 | 383.967 |
| 6 | 65.564 | 2586.118 | 4.970 | 2011.165 | 196.034 | 2017.172 | 568.946 | 378.918 |
| 5 | 64.713 | 2552.568 | 4.905 | 1985.074 | 193.491 | 1991.003 | 561.565 | 374.003 |
| 4 | 63.402 | 2500.873 | 4.806 | 1944.872 | 189.572 | 1950.681 | 550.192 | 366.428 |
| 3 | 61.429 | 2423.043 | 4.656 | 1884.345 | 183.673 | 1889.973 | 533.069 | 355.024 |
| 2 | 57.848 | 2281.780 | 4.385 | 1774.489 | 172.965 | 1779.789 | 501.992 | 334.327 |
| 1 | 48.377 | 1908.211 | 3.667 | 1483.973 | 144.647 | 1488.405 | 419.807 | 279.591 |
Table 4.
Impact of the number of suppliers.
| n | ||||||||
|---|---|---|---|---|---|---|---|---|
| 8 | 39.631 | 2546.835 | 3.004 | 1980.616 | 193.056 | 2173.672 | 1986.531 | 373.163 |
| 7 | 45.291 | 2562.670 | 3.433 | 1992.931 | 194.257 | 2187.187 | 1998.883 | 375.483 |
| 6 | 52.838 | 2582.179 | 4.005 | 2008.102 | 195.736 | 2203.838 | 2014.100 | 378.341 |
| 5 | 63.402 | 2606.474 | 4.806 | 2026.996 | 197.577 | 2224.573 | 2033.050 | 381.901 |
| 4 | 79.261 | 2638.523 | 6.008 | 2051.919 | 200.007 | 2251.926 | 2058.048 | 386.597 |
| 3 | 105.675 | 2683.142 | 8.010 | 2086.619 | 203.389 | 2290.008 | 2092.851 | 393.134 |
| 2 | 158.495 | 2753.286 | 12.014 | 2141.168 | 208.706 | 2349.874 | 2147.563 | 403.412 |
| 1 | 317.098 | 2895.570 | 24.037 | 2251.819 | 219.491 | 2471.310 | 2258.544 | 424.259 |
Disclaimer/Publisher’s Note: The statements, opinions and data contained in all publications are solely those of the individual author(s) and contributor(s) and not of MDPI and/or the editor(s). MDPI and/or the editor(s) disclaim responsibility for any injury to people or property resulting from any ideas, methods, instructions or products referred to in the content. |
© 2022 by the author. Licensee MDPI, Basel, Switzerland. This article is an open access article distributed under the terms and conditions of the Creative Commons Attribution (CC BY) license (https://creativecommons.org/licenses/by/4.0/).
Share and Cite
MDPI and ACS Style
Wang, L. Food Supply Chain Sustainability Strategy for Fresh Retailer and Multi-Output Random Fresh Suppliers after COVID-19. Sustainability 2023, 15, 546. https://doi.org/10.3390/su15010546
AMA Style
Wang L. Food Supply Chain Sustainability Strategy for Fresh Retailer and Multi-Output Random Fresh Suppliers after COVID-19. Sustainability. 2023; 15(1):546. https://doi.org/10.3390/su15010546
Chicago/Turabian StyleWang, Lijie. 2023. "Food Supply Chain Sustainability Strategy for Fresh Retailer and Multi-Output Random Fresh Suppliers after COVID-19" Sustainability 15, no. 1: 546. https://doi.org/10.3390/su15010546
Note that from the first issue of 2016, this journal uses article numbers instead of page numbers. See further details here.