
Validation of the T-Lymphocyte Subset Index (TLSI) as a Score to Predict Mortality in Unvaccinated Hospitalized COVID-19 Patients
 , , , and
  add
Show full author list
add
Show full author list
Abstract
:
1. Introduction
2. Materials and Methods
2.1. Patients, Laboratory Parameters, and Data Collection
2.2. Statistical Analysis
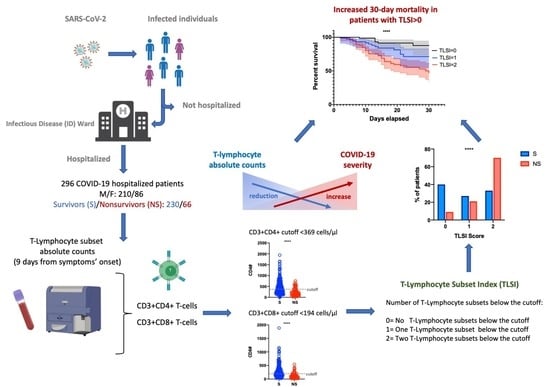
3. Results
3.1. Study Population
3.2. Laboratory Findings
3.3. Multiple Logistic Regression Analysis
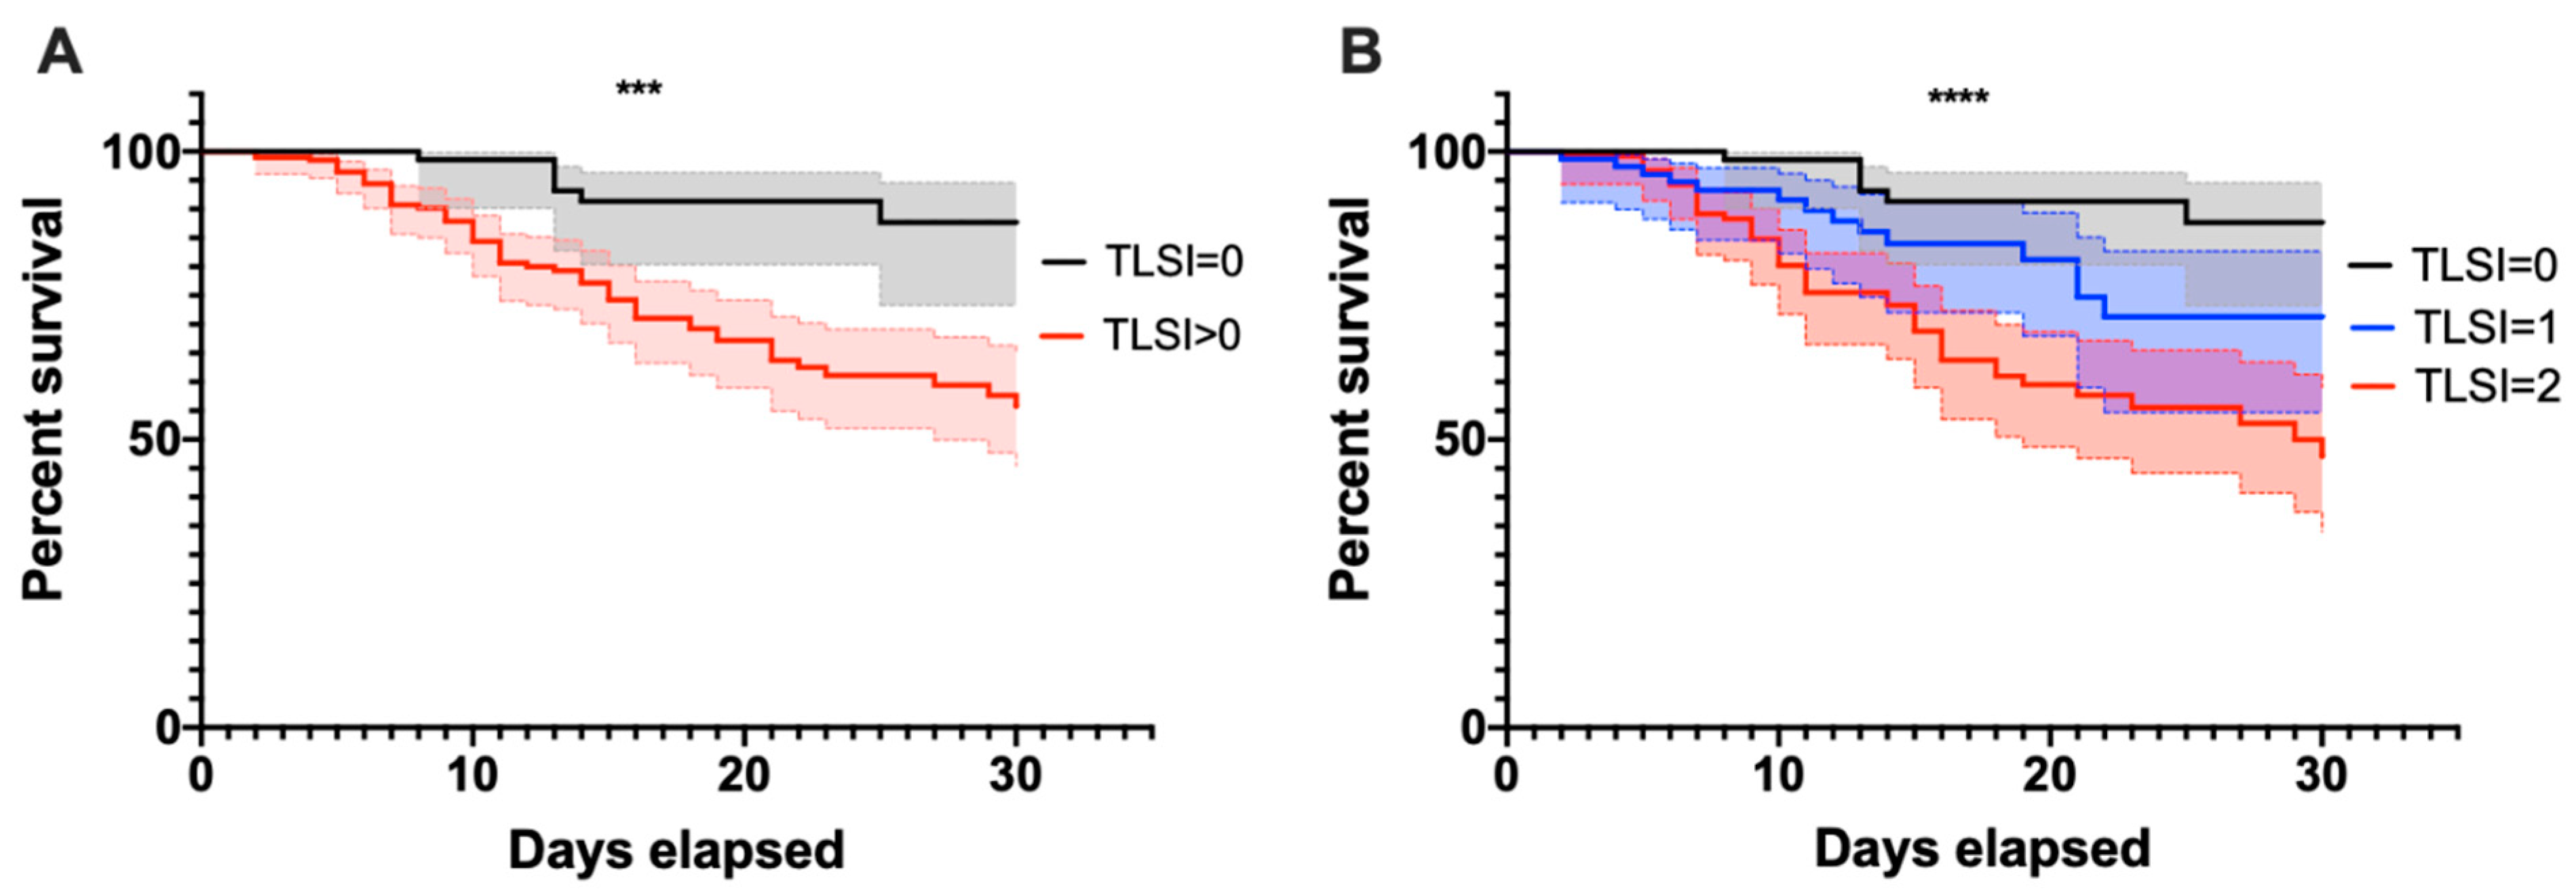
3.4. Survival Curves
4. Discussion
5. Conclusions
Supplementary Materials
Author Contributions
Funding
Institutional Review Board Statement
Informed Consent Statement
Data Availability Statement
Acknowledgments
Conflicts of Interest
References
- Roberts, D.L.; Rossman, J.S.; Jarić, I. Dating First Cases of COVID-19. PLoS Pathog. 2021, 17, e1009620. [Google Scholar] [CrossRef] [PubMed]
- Li, Q.; Guan, X.; Wu, P.; Wang, X.; Zhou, L.; Tong, Y.; Ren, R.; Leung, K.S.M.; Lau, E.H.Y.; Wong, J.Y.; et al. Early Transmission Dynamics in Wuhan, China, of Novel Coronavirus-Infected Pneumonia. N. Engl. J. Med. 2020, 382, 1199–1207. [Google Scholar] [CrossRef] [PubMed]
- Wang, L.; Wang, Y.; Ye, D.; Liu, Q. Review of the 2019 Novel Coronavirus (SARS-CoV-2) Based on Current Evidence. Int. J. Antimicrob. Agents 2020, 55, 105948. [Google Scholar] [CrossRef] [PubMed]
- Struyf, T.; Deeks, J.J.; Dinnes, J.; Takwoingi, Y.; Davenport, C.; Leeflang, M.M.; Spijker, R.; Hooft, L.; Emperador, D.; Domen, J.; et al. Signs and Symptoms to Determine If a Patient Presenting in Primary Care or Hospital Outpatient Settings Has COVID-19. Cochrane Database Syst. Rev. 2022, 5, CD013665. [Google Scholar] [CrossRef]
- Osuchowski, M.F.; Winkler, M.S.; Skirecki, T.; Cajander, S.; Shankar-Hari, M.; Lachmann, G.; Monneret, G.; Venet, F.; Bauer, M.; Brunkhorst, F.M.; et al. The COVID-19 Puzzle: Deciphering Pathophysiology and Phenotypes of a New Disease Entity. Lancet Respir. Med. 2021, 9, 622–642. [Google Scholar] [CrossRef]
- Iannetta, M.; Buccisano, F.; Fraboni, D.; Malagnino, V.; Campogiani, L.; Teti, E.; Spalliera, I.; Rossi, B.; Di Lorenzo, A.; Palmieri, R.; et al. Baseline T-Lymphocyte Subset Absolute Counts Can Predict Both Outcome and Severity in SARS-CoV-2 Infected Patients: A Single Center Study. Sci. Rep. 2021, 11, 12762. [Google Scholar] [CrossRef]
- Liu, R.; Wang, Y.; Li, J.; Han, H.; Xia, Z.; Liu, F.; Wu, K.; Yang, L.; Liu, X.; Zhu, C. Decreased T Cell Populations Contribute to the Increased Severity of COVID-19. Clin. Chim. Acta 2020, 508, 110–114. [Google Scholar] [CrossRef]
- Wang, F.; Nie, J.; Wang, H.; Zhao, Q.; Xiong, Y.; Deng, L.; Song, S.; Ma, Z.; Mo, P.; Zhang, Y. Characteristics of Peripheral Lymphocyte Subset Alteration in COVID-19 Pneumonia. J. Infect. Dis. 2020, 221, 1762–1769. [Google Scholar] [CrossRef] [Green Version]
- Chen, R.; Sang, L.; Jiang, M.; Yang, Z.; Jia, N.; Fu, W.; Xie, J.; Guan, W.; Liang, W.; Ni, Z.; et al. Longitudinal Hematologic and Immunologic Variations Associated with the Progression of COVID-19 Patients in China. J. Allergy Clin. Immunol. 2020, 146, 89–100. [Google Scholar] [CrossRef]
- Luo, M.; Liu, J.; Jiang, W.; Yue, S.; Liu, H.; Wei, S. IL-6 and CD8+ T Cell Counts Combined Are an Early Predictor of in-Hospital Mortality of Patients with COVID-19. JCI Insight 2020, 5, e139024. [Google Scholar] [CrossRef]
- Liu, J.; Li, S.; Liu, J.; Liang, B.; Wang, X.; Wang, H.; Li, W.; Tong, Q.; Yi, J.; Zhao, L.; et al. Longitudinal Characteristics of Lymphocyte Responses and Cytokine Profiles in the Peripheral Blood of SARS-CoV-2 Infected Patients. eBioMedicine 2020, 55, 102763. [Google Scholar] [CrossRef] [PubMed]
- Zhang, J.; Wang, Z.; Wang, X.; Hu, Z.; Yang, C.; Lei, P. Risk Factors for Mortality of COVID-19 Patient Based on Clinical Course: A Single Center Retrospective Case-Control Study. Front. Immunol. 2021, 12, 581469. [Google Scholar] [CrossRef] [PubMed]
- Dadras, O.; SeyedAlinaghi, S.; Karimi, A.; Shamsabadi, A.; Qaderi, K.; Ramezani, M.; Mirghaderi, S.P.; Mahdiabadi, S.; Vahedi, F.; Saeidi, S.; et al. COVID-19 Mortality and Its Predictors in the Elderly: A Systematic Review. Health Sci. Rep. 2022, 5, e657. [Google Scholar] [CrossRef]
- COVID-19 and Obesity: The 2021 Atlas. Available online: https://www.worldobesity.org/resources/resource-library/covid-19-and-obesity-the-2021-atlas (accessed on 29 June 2022).
- Steenblock, C.; Schwarz, P.E.H.; Ludwig, B.; Linkermann, A.; Zimmet, P.; Kulebyakin, K.; Tkachuk, V.A.; Markov, A.G.; Lehnert, H.; de Angelis, M.H.; et al. COVID-19 and Metabolic Disease: Mechanisms and Clinical Management. Lancet Diabetes Endocrinol. 2021, 9, 786–798. [Google Scholar] [CrossRef]
- Forsblom, E.; Helanne, H.; Kortela, E.; Silén, S.; Meretoja, A.; Järvinen, A. Inflammation Parameters Predict Fatal Outcome in Male COVID-19 Patients in a Low Case-Fatality Area—A Population-Based Registry Study. Infect. Dis. 2022, 54, 558–571. [Google Scholar] [CrossRef] [PubMed]
- Sarkar, S.; Khanna, P.; Singh, A.K. The Impact of Neutrophil-Lymphocyte Count Ratio in COVID-19: A Systematic Review and Meta-Analysis. J. Intensive Care Med. 2022, 37, 857–869. [Google Scholar] [CrossRef]
- Kong, M.; Zhang, H.; Cao, X.; Mao, X.; Lu, Z. Higher Level of Neutrophil-to-Lymphocyte Is Associated with Severe COVID-19. Epidemiol. Infect. 2020, 148, e139. [Google Scholar] [CrossRef]
- Leretter, M.T.; Vulcanescu, D.D.; Horhat, F.G.; Matichescu, A.; Rivis, M.; Rusu, L.-C.; Roi, A.; Racea, R.; Badea, I.; Dehelean, C.A.; et al. COVID-19: Main Findings after a Year and Half of Unease and the Proper Scientific Progress (Review). Exp. Ther. Med. 2022, 23, 424. [Google Scholar] [CrossRef]
- Shi, H.; Wang, W.; Yin, J.; Ouyang, Y.; Pang, L.; Feng, Y.; Qiao, L.; Guo, X.; Shi, H.; Jin, R.; et al. The Inhibition of IL-2/IL-2R Gives Rise to CD8+ T Cell and Lymphocyte Decrease through JAK1-STAT5 in Critical Patients with COVID-19 Pneumonia. Cell Death Dis. 2020, 11, 429. [Google Scholar] [CrossRef]
- De Biasi, S.; Meschiari, M.; Gibellini, L.; Bellinazzi, C.; Borella, R.; Fidanza, L.; Gozzi, L.; Iannone, A.; Lo Tartaro, D.; Mattioli, M.; et al. Marked T Cell Activation, Senescence, Exhaustion and Skewing towards TH17 in Patients with COVID-19 Pneumonia. Nat. Commun. 2020, 11, 3434. [Google Scholar] [CrossRef]
- Xiong, L.; Zang, X.; Feng, G.; Zhao, F.; Wang, S.; Zeng, W.; Yu, K.; Zhai, Y. Clinical Characteristics and Peripheral Immunocyte Subsets Alteration of 85 COVID-19 Deaths. Aging 2021, 13, 6289–6297. [Google Scholar] [CrossRef] [PubMed]
- Kazancioglu, S.; Yilmaz, F.M.; Bastug, A.; Sakallı, A.; Ozbay, B.O.; Buyuktarakci, C.; Bodur, H.; Yilmaz, G. Lymphocyte Subset Alteration and Monocyte CD4 Expression Reduction in Patients with Severe COVID-19. Viral Immunol. 2021, 34, 342–351. [Google Scholar] [CrossRef]
- Ameratunga, R.; Woon, S.-T.; Steele, R.; Lehnert, K.; Leung, E.; Brooks, A.E.S. Severe COVID-19 Is a T Cell Immune Dysregulatory Disorder Triggered by SARS-CoV-2. Expert Rev. Clin. Immunol. 2022, 18, 557–565. [Google Scholar] [CrossRef] [PubMed]
- Khalifehzadeh-Esfahani, Z.; Fattahi, S.; Heidari Haratemeh, Z.; Jafarinia, M. The Role of Immune Regulatory Molecules in COVID-19. Viral Immunol. 2022, 35, 359–364. [Google Scholar] [CrossRef] [PubMed]
- Pan, P.; Du, X.; Zhou, Q.; Cui, Y.; Deng, X.; Liu, C.; Hu, Z.; Chen, J.; Yu, X.; Shi, W. Characteristics of Lymphocyte Subsets and Cytokine Profiles of Patients with COVID-19. Virol. J. 2022, 19, 57. [Google Scholar] [CrossRef]
- Belaid, B.; Lamara Mahammad, L.; Mihi, B.; Rahali, S.Y.; Djidjeli, A.; Larab, Z.; Berkani, L.; Berkane, I.; Sayah, W.; Merah, F.; et al. T Cell Counts and IL-6 Concentration in Blood of North African COVID-19 Patients Are Two Independent Prognostic Factors for Severe Disease and Death. J. Leukoc. Biol. 2022, 111, 269–281. [Google Scholar] [CrossRef] [PubMed]
- Lombardi, A.; Trombetta, E.; Cattaneo, A.; Castelli, V.; Palomba, E.; Tirone, M.; Mangioni, D.; Lamorte, G.; Manunta, M.; Prati, D.; et al. Early Phases of COVID-19 Are Characterized by a Reduction in Lymphocyte Populations and the Presence of Atypical Monocytes. Front. Immunol. 2020, 11, 560330. [Google Scholar] [CrossRef] [PubMed]
- Wang, L.; Chen, J.; Zhao, J.; Li, F.; Lu, S.; Liu, P.; Liu, X.-H.; Huang, Q.; Wang, H.; Xu, Q.N.; et al. The Predictive Role of Lymphocyte Subsets and Laboratory Measurements in COVID-19 Disease: A Retrospective Study. Ther. Adv. Respir. Dis. 2021, 15, 17534666211049740. [Google Scholar] [CrossRef]
- Yin, S.-W.; Zhou, Z.; Wang, J.-L.; Deng, Y.-F.; Jing, H.; Qiu, Y. Viral Loads, Lymphocyte Subsets and Cytokines in Asymptomatic, Mildly and Critical Symptomatic Patients with SARS-CoV-2 Infection: A Retrospective Study. Virol. J. 2021, 18, 126. [Google Scholar] [CrossRef]
- Zheng, F.; Chen, R.; Yao, R.; Huang, Y.; Tan, X.; Liu, J.; Li, N.; Xie, Y. Dynamic Changes in the Immune Response Correlate with Disease Severity and Outcomes During Infection with SARS-CoV-2. Infect. Dis. Ther. 2021, 10, 1391–1405. [Google Scholar] [CrossRef]
- Luo, Y.; Mao, L.; Yuan, X.; Xue, Y.; Lin, Q.; Tang, G.; Song, H.; Wang, F.; Sun, Z. Prediction Model Based on the Combination of Cytokines and Lymphocyte Subsets for Prognosis of SARS-CoV-2 Infection. J. Clin. Immunol. 2020, 40, 960–969. [Google Scholar] [CrossRef] [PubMed]


| All Patients (N = 296) | Survivors (N = 230; 77.7%) | Non-Survivors (N = 66; 22.3%) | p | |
|---|---|---|---|---|
| Age: median [IQR] | 67 [55–76] | 64.5 [53–75.7] | 73 [67–77] | <0.001 |
| Sex: M/F (%) | 210/86 (70.1/29.0) | 156/74 (67.8/32.2) | 54/12 (81.8/18.2) | 0.027 |
| Oxygen supply/ventilation support AA/VMK/NRM/NIV/OTI (%) | 59/74/16/99/48 (20.0/25.0/5.4/33.4/16.2) | 59/72/9/84/6 (25.6/31.3/3.9/36.5/2.6) | 0/2/7/15/42 (0/3/10.6/22.7/63.6) | <0.001 |
| ICU admission (%) | 63 (21.3) | 20 (8.7) | 43 (65.2) | <0.001 |
| Time from symptoms’ onset to 1st NPh-S median days [IQR] | 7 [3–10] | 7 [4–10] | 5 [2–9] | 0.075 |
| Time from symptoms’ onset to 1st TBNK median days [IQR] | 9 [5–12] | 9 [6–12] | 8 [4–11] | 0.089 |
| Comorbidities: | ||||
| N# Comorbidity [IQR] | 2 [1–3] | 2 [1–3] | 2 [2–4] | <0.001 |
| Any (%) | 251 (84.8) | 187 (81.3) | 64 (97.0) | 0.002 |
| Smoke (%) | 27 (9.1) | 20 (8.7) | 7 (10.6) | 0.635 |
| Obesity (%) | 59 (19.9) | 47 (20.4) | 12 (18.2) | 0.686 |
| Cardiovascular (%) | 186 (62.6) | 137 (59.6) | 49 (74.2) | 0.03 |
| Diabetes (%) | 80 (26.9) | 60 (26.1) | 20 (33.3) | 0.497 |
| Endocrinologic (%) | 30 (10.1) | 25 (10.9) | 5 (7.6) | 0.434 |
| Cerebrovascular (%) | 28 (9.4) | 14 (6.1) | 14 (21.2) | <0.001 |
| Hepatitis (%) | 6 (2) | 4 (1.7) | 2 (3) | 0.512 |
| Pulmonary (%) | 47 (15.8) | 28 (12.2) | 19 (28.8) | 0.001 |
| Renal (%) | 23 (7.7) | 12 (5.2) | 11 (16.7) | 0.002 |
| Solid Tumor (%) | 42 (14.1) | 27 (11.7) | 15 (2.7) | 0.024 |
| Hematologic (%) | 20 (6.7) | 12 (5.2) | 8 (12.1) | 0.049 |
| Neurologic/Psychiatric (%) | 36 (12.1) | 26 (11.3) | 10 (15.1) | 0.399 |
| Rheumatologic (%) | 14 (4.7) | 13 (5.6) | 1 (1.5) | 0.163 |
| Other (%) | 49 (16.5) | 36 (15.6) | 13 (19.7) | 0.436 |
| Parameter | All Patients | Survivors | Non-Survivors | p |
|---|---|---|---|---|
| Median [IQR] | Median [IQR] | Median [IQR] | ||
| RBC (106/µL) | 4.46 [4.02–4.92] | 4.51 [4.16–4.92] | 4.26 [3.78–4.96] | 0.061 |
| Hb (g/dL) | 13.00 [11.70–14.27] | 13.00 [11.70–14.22] | 12.70 [11.62–14.22] | 0.605 |
| Plt (/µL) | 226,000 [175,000–304,000] | 225,000 [183,000–315,250] | 229,000 [137,250–276,000] | 0.102 |
| WBC (/µL) | 6920 [5168–9680] | 6755 [4945–9217] | 8530 [5777–11,832] | 0.004 |
| Neut (/µL) | 5680 [3550–8230] | 5035 [3152–7710] | 7540 [4840–10,710] | <0.001 |
| Ly (/µL) | 900 [585–1270] | 1020 [628–1325] | 520 [390–780] | <0.001 |
| N/L ratio | 6.69 [3.32–12.04] | 5.35 [2.44–9.48] | 12.19 [7.74–20.95] | <0.001 |
| CRP (mg/L) | 65.80 [31.85–121.78] | 48.70 [25.05–102.75] | 118.90 [75.70–150.55] | <0.001 |
| LDH (IU/L) | 342.00 [252.00–438.00] | 313.50 [235.25–397.00] | 484.00 [384.00–616.00] | <0.001 |
| CPK (IU/L) | 81.00 [37.00–155.50] | 72.00 [33.00–133.00] | 111.00 [56.00–320.00] | <0.001 |
| AST (IU/L) | 36.00 [26.00–49.00] | 34.00 [25.00–44.00] | 47.00 [36.50–65.00] | <0.001 |
| ALT (IU/L) | 32.00 [17.75–49.00] | 30.00 [18.00–47.00] | 35.00 [16.00–57.25] | 0.437 |
| Conj Bil (mg/dL) | 0.27 [0.21–0.35] | 0.26 [0.20–0.34] | 0.29 [0.23–0.40] | 0.024 |
| Total Bil (mg/dL) | 0.55 [0.44–0.75] | 0.55 [0.43–0.74] | 0.59 [0.45–0.81] | 0.397 |
| Creatinine (mg/dL) | 0.88 [0.73–1.07] | 0.85 [0.73–1.01] | 0.97 [0.80–1.38] | 0.005 |
| IL-6 (pg/mL) | 13.60 [6.77–31.40] | 11.30 [5.59–21.22] | 37.30 [16.20–60.00] | <0.001 |
| TNF alpha (pg/mL) | 11.34 [6.72–18.01] | 11.39 [6.28–17.98] | 11.25 [6.78–17.35] | 0.921 |
| D-Dimers (ng/mL) | 952.00 [541.00–1538.50] | 840.00 [498.00–1466.00] | 1237.50 [924.75–2028.00] | <0.001 |
| Fibrinogen (mg/dL) | 561.00 [429.00–687.00] | 550.00 [412.00–681.00] | 617.50 [486.75–748.00] | 0.044 |
| INR | 1.16 [1.09–1.22] | 1.15 [1.09–1.21] | 1.20 [1.13–1.30] | 0.008 |
| PT (s) | 13.90 [13.00–14.60] | 13.70 [13.00–14.50] | 14.30 [13.50–15.47] | 0.008 |
| PT (%) | 82.00 [75.00–90.00] | 83.00 [76.00–90.00] | 78.00 [69.25–85.00] | 0.009 |
| All Patients | Survivors | Non-Survivors | p | |
|---|---|---|---|---|
| Median [IQR] | Median [IQR] | Median [IQR] | ||
| CD3+ # | 586.50 [334.50–936.25] | 666.50 [393.25–1021.75] | 320.50 [207.75–533.50] | <0.001 |
| CD3+CD4+ # | 340.00 [192.50–563.50] | 397.50 [236.00–627.00] | 199.00 [123.25–340.75] | <0.001 |
| CD3+CD8+ # | 181.50 [104.75–327.50] | 220.00 [128.50–366.25] | 103.00 [67.75–164.00] | <0.001 |
| CD3+CD4+CD8+ # | 7.00 [4.00–13.00] | 8.00 [5.00–14.00] | 3.50 [2.00–7.75] | <0.001 |
| CD3+CD4-CD8- # | 19.00 [9.00–39.25] | 24.50 [11.25–45.00] | 8.00 [4.00–18.75] | <0.001 |
| CD19+ # | 100.50 [55.75–159.25] | 110.00 [62.00–166.00] | 74.50 [36.00–105.50] | <0.001 |
| CD3negCD16+CD56+ # | 128.00 [72.50–211.25] | 131.50 [80.00–214.50] | 112.50 [66.25–183.50] | 0.143 |
| CD4/CD8 RATIO | 1.88 [1.19–2.75] | 1.87 [1.19–2.65] | 1.89 [1.37–2.96] | 0.321 |
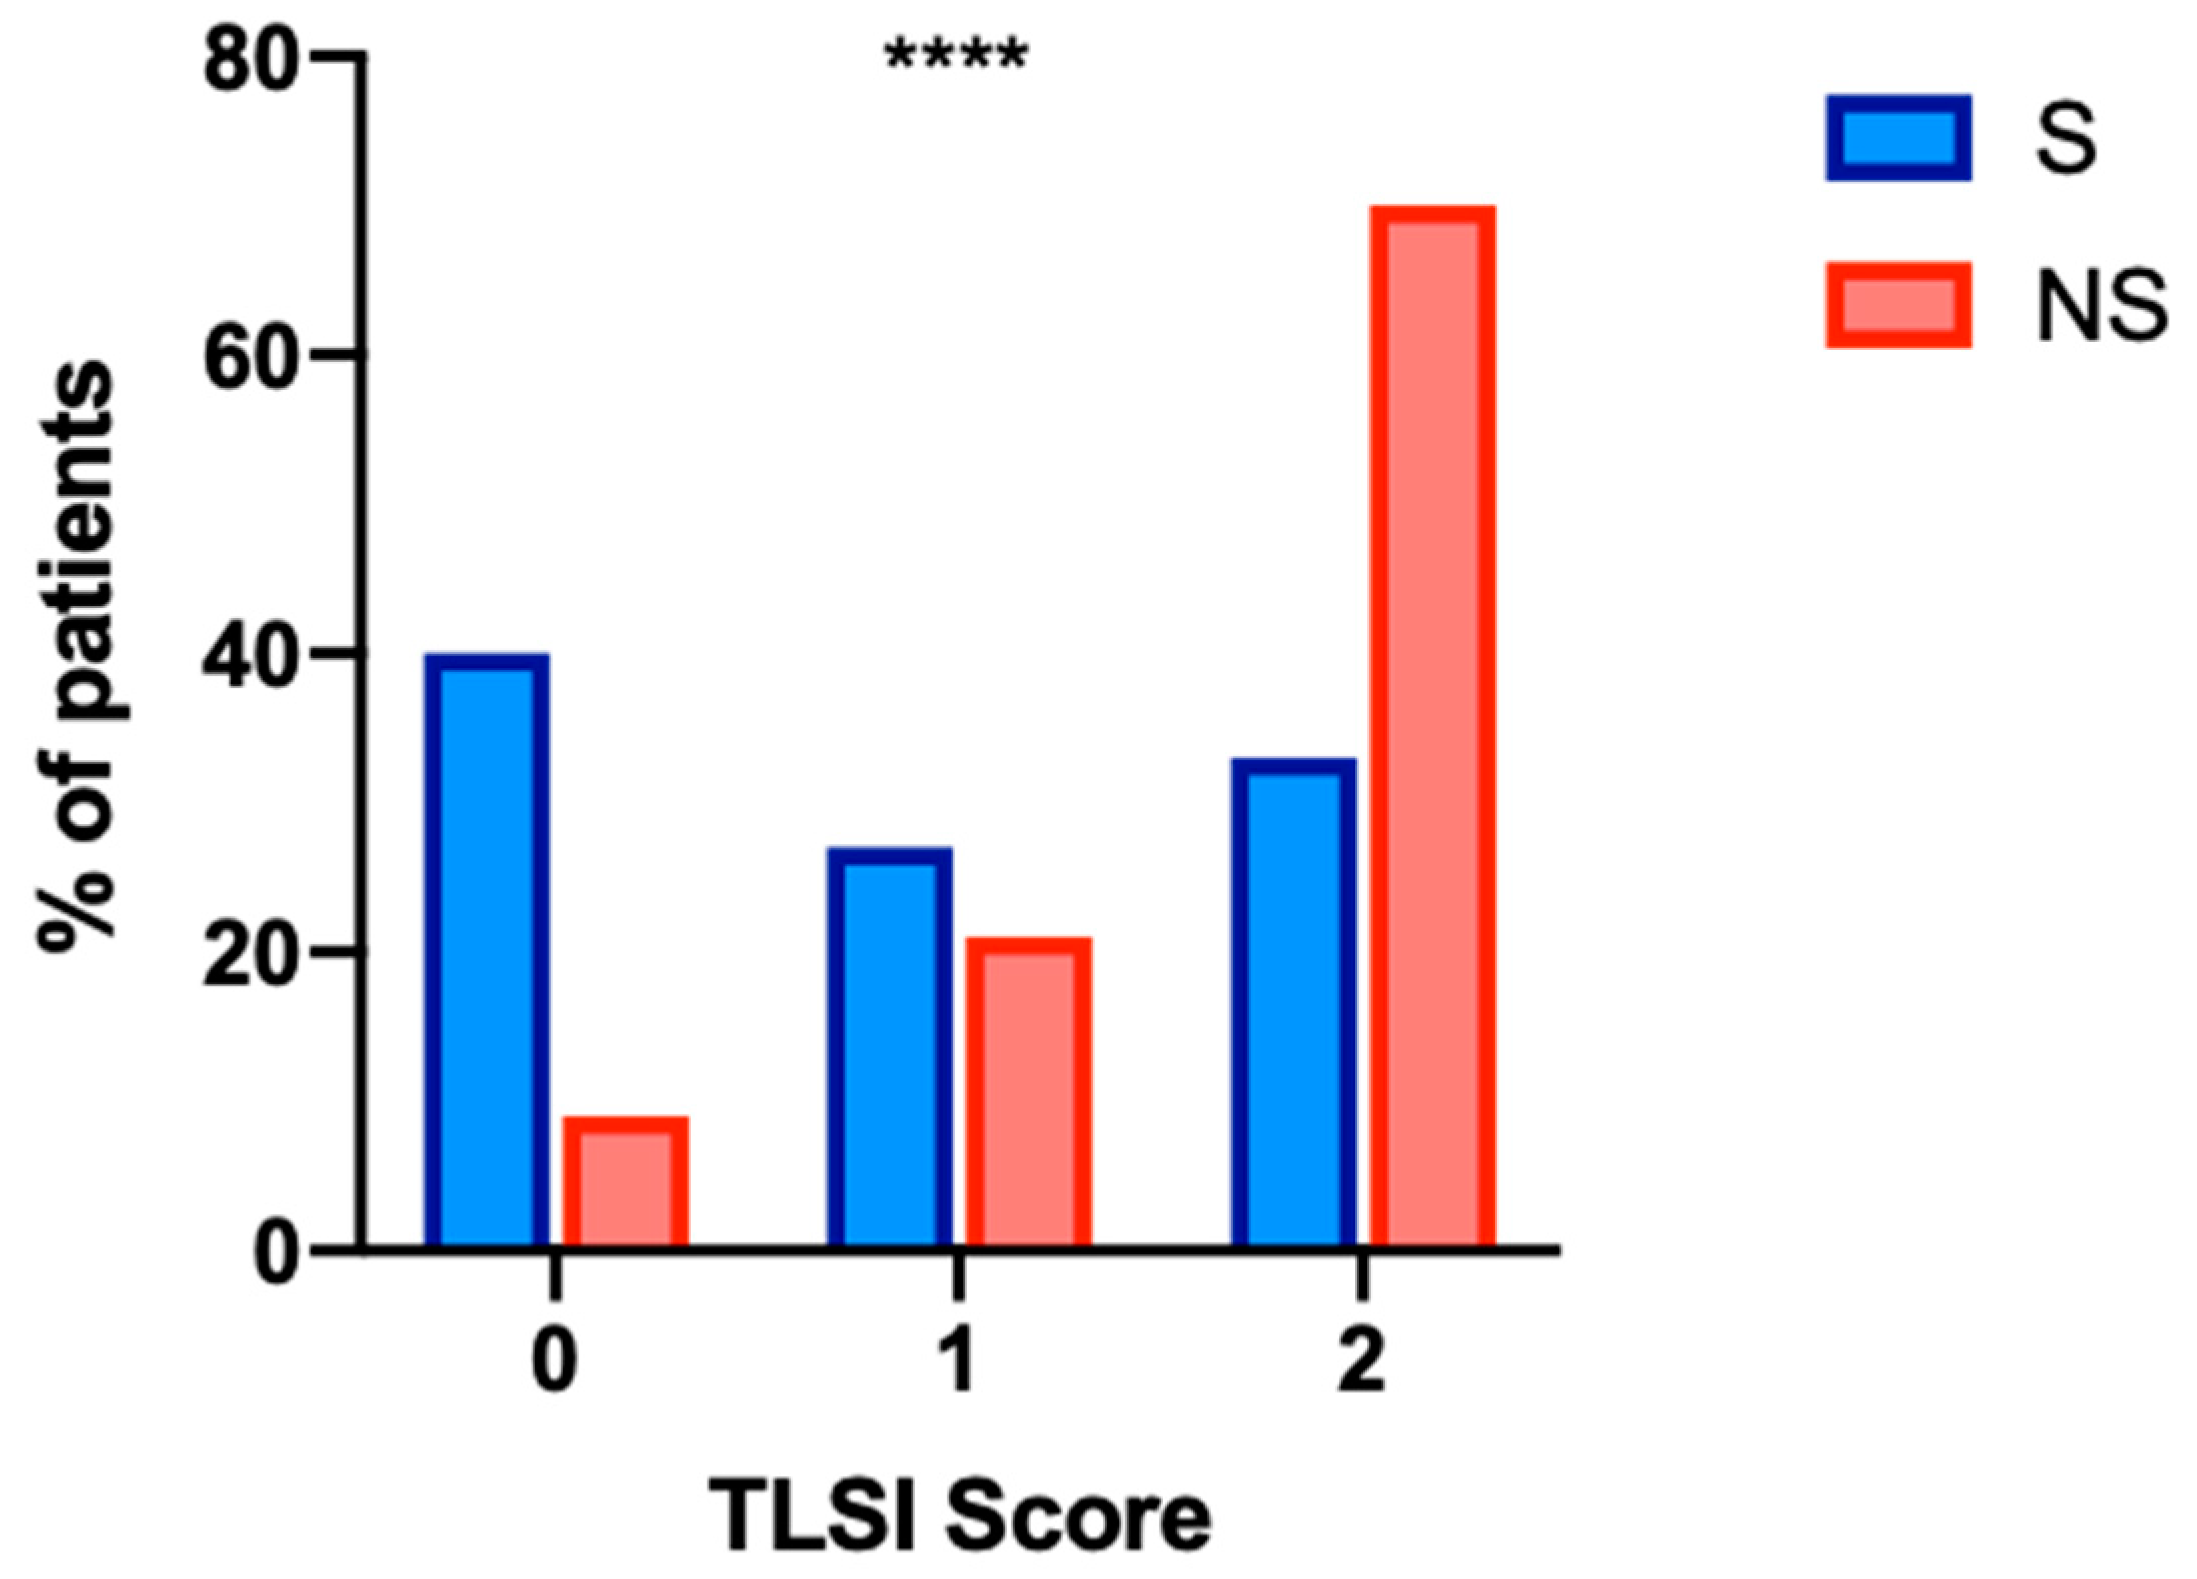
| TLSI | 1.00 [0.00–2.00] | 1.00 [0.00–2.00] | 2.00 [1.00–2.00] | <0.001 |
| Parameter | Odds Ratio | OR 95% Confidence Interval | p | |
|---|---|---|---|---|
| Lower Bound | Upper Bound | |||
| Sex (M) | 1.719 | 0.612 | 4.830 | 0.304 |
| Age | 1.022 | 0.985 | 1.061 | 0.241 |
| N# of comorbidities | 1.622 | 1.179 | 2.232 | 0.003 |
| Delta Symp-TBNK | 0.877 | 0.795 | 0.966 | 0.008 |
| LDH | 1.010 | 1.006 | 1.014 | <0.001 |
| IL-6 | 1.007 | 0.998 | 1.016 | 0.139 |
| TLSI | 1.893 | 1.053 | 3.405 | 0.033 |
Publisher’s Note: MDPI stays neutral with regard to jurisdictional claims in published maps and institutional affiliations. |
© 2022 by the authors. Licensee MDPI, Basel, Switzerland. This article is an open access article distributed under the terms and conditions of the Creative Commons Attribution (CC BY) license (https://creativecommons.org/licenses/by/4.0/).
Share and Cite
Di Lorenzo, A.; Tedde, S.; Pace, P.G.; Campogiani, L.; Ansaldo, L.; Lodi, A.; Zordan, M.; Barreca, F.; Caldara, F.; Rossi, B.; et al. Validation of the T-Lymphocyte Subset Index (TLSI) as a Score to Predict Mortality in Unvaccinated Hospitalized COVID-19 Patients. Biomedicines 2022, 10, 2788. https://doi.org/10.3390/biomedicines10112788
Di Lorenzo A, Tedde S, Pace PG, Campogiani L, Ansaldo L, Lodi A, Zordan M, Barreca F, Caldara F, Rossi B, et al. Validation of the T-Lymphocyte Subset Index (TLSI) as a Score to Predict Mortality in Unvaccinated Hospitalized COVID-19 Patients. Biomedicines. 2022; 10(11):2788. https://doi.org/10.3390/biomedicines10112788
Chicago/Turabian StyleDi Lorenzo, Andrea, Simona Tedde, Pier Giorgio Pace, Laura Campogiani, Lorenzo Ansaldo, Alessandra Lodi, Marta Zordan, Filippo Barreca, Federica Caldara, Benedetta Rossi, and et al. 2022. "Validation of the T-Lymphocyte Subset Index (TLSI) as a Score to Predict Mortality in Unvaccinated Hospitalized COVID-19 Patients" Biomedicines 10, no. 11: 2788. https://doi.org/10.3390/biomedicines10112788