Article

Influence of Meteorological Factors on the COVID-19 Transmission with Season and Geographic Location

1
Department of Geography and Spatial Information Techniques/Center for Land and Marine Spatial Utilization and Governance Research, Ningbo University, Ningbo 315211, China
2
Ningbo Universities Collaborative Innovation Center for Land and Marine Spatial Utilization and Governance Research at Ningbo University, Ningbo 315211, China
3
Institute of East China Sea, Ningbo University, Ningbo 315211, China
4
School of Environmental and Geographical Science, Shanghai Normal University, Shanghai 200234, China
*
Author to whom correspondence should be addressed.
Int. J. Environ. Res. Public Health 2021, 18(2), 484; https://doi.org/10.3390/ijerph18020484
Submission received: 13 December 2020 / Revised: 29 December 2020 / Accepted: 30 December 2020 / Published: 9 January 2021

Abstract

:
The purpose of this study is to investigate whether the relationship between meteorological factors (i.e., daily maximum temperature, minimum temperature, average temperature, temperature range, relative humidity, average wind speed and total precipitation) and COVID-19 transmission is affected by season and geographical location during the period of community-based pandemic prevention and control. COVID-19 infected case records and meteorological data in four cities (Wuhan, Beijing, Urumqi and Dalian) in China were collected. Then, the best-fitting model of COVID-19 infected cases was selected from four statistic models (Gaussian, logistic, lognormal distribution and allometric models), and the relationship between meteorological factors and COVID-19 infected cases was analyzed using multiple stepwise regression and Pearson correlation. The results showed that the lognormal distribution model was well adapted to describing the change of COVID-19 infected cases compared with other models (R2 > 0.78; p-values < 0.001). Under the condition of implementing community-based pandemic prevention and control, relationship between COVID-19 infected cases and meteorological factors differed among the four cities. Temperature and relative humidity were mainly the driving factors on COVID-19 transmission, but their relations obviously varied with season and geographical location. In summer, the increase in relative humidity and the decrease in maximum temperature facilitate COVID-19 transmission in arid inland cities, while at this point the decrease in relative humidity is good for the spread of COVID-19 in coastal cities. For the humid cities, the reduction of relative humidity and the lowest temperature in the winter promote COVID-19 transmission.

Graphical Abstract

1. Introduction

The 2019 coronavirus disease (COVID-19) is ascribed to the severe acute respiratory syndrome coronavirus 2 (SARS-CoV-2), a novel coronavirus. Due to high contagiousness, COVID-19 quickly appeared around the world after the first report in Wuhan of Hubei province, China, in late December 2019. The World Health Organization (WHO) announced COVID-19 as a global public health emergency and one of the major human disasters in the 21st century. Through 11 November, 2020, a total of 59,481,313 confirmed cases and 1,404,542 deaths had been reported around the world [1]. It is estimated that the global impact of COVID-19 may last several years [1]. At present, as temperatures fall and winter arrives, the COVID-19 pandemic in many parts of the Northern Hemisphere, such as France, UK, Spain, Italy and Belgium, have seen a second outbreak [2]. For example, since October, more than 10,000 new positive cases have been confirmed every day in many countries [1]. France and Germany announced a second national lockdown policy on October 28, and parts of Spain and Greece have also implemented pandemic prevention and control [2]. Governments and medical and public health systems in many countries would once again face severe challenges of epidemic prevention.
Meteorological factors affect transmission of COVID-19 [3,4,5,6], but their influence varies greatly among different regions [7,8,9,10]. For example, temperature had a significant positive correlation with COVID-19 transmission in Singapore, Brazil, Indonesia, Japan and Norway [5,11,12,13,14], but significantly negatively correlated in New York City, Iran, Bangladesh and China [6,8,15,16], and not significantly related in the United States, Spain and Mexico [17,18,19]. Relative air humidity was positively correlated with COVID-19 transmission in Singapore and Brazil [11,13], but not directly linked in New York and India [6,9]. Precipitation was most conducive to COVID-19 transmission in Norway [5], whereas not significantly affected by the increase in recorded COVID-19 confirmed cases in Brazil, Mexico and many other countries [11,19]. Wind speeds were not promoted the spread of COVID-19 in Singapore and Iran [8,13]; however, high wind speeds accelerated the increase of COVID-19 confirmed cases in Turkey [20]. These studies have shown that the relationship between COVID-19 transmission and meteorological factors varied among different regions [10,21,22]. However, current research has not clearly revealed reasons for this difference.
The difference in relationship between COVID-19 transmission and meteorological factors may be caused by the changes of season and geographical location [23,24]. For example, in arid regions, an increase in relative humidity might be beneficial for virus survival and spread because it reduces drought stress [25]. Oppositely, it might play a negative influence on COVID-19 transmission as it promotes viruses and droplets to combine into larger drops in humid regions [11,25]. The deposition of massive syncretic droplets will reduce virus abundance in the atmosphere [26,27]. In winter, a slight reducing temperature can prolong survival time of virus in atmosphere, thus facilitating virus transmission [18,28,29]. However, as high temperatures inactivates virus via denaturing the capsid protein and the glycoprotein spike, the increase in maximum temperature would prevent virus attaching to the host cells in summer [24,30].
Difference in relationship between COVID-19 transmission and meteorological factors may also be related to government’s epidemic prevention and control measures [31,32]. The effective implementation of epidemic prevention and control might reduce the impact of meteorological factors on COVID-19 transmission, or even lead to no obvious relationship between them [10,33]. At present, a wide variety of measures have been implemented to prevent and control COVID-19 in different regions [1]. For example, China and Italy imposed community lockdown and home quarantine in COVID-19 outbreak cities. The U.S. states of Oregon, Washington, California and New York limited family gatherings and closed public places (such as bars, restaurants and gyms) after 22:00 to control COVID-19. Germany used curfew, the closure of public places, and forbid celebrations in public and private places to prevent COVID-19 during the outbreak period. However, there is no uniform standard of pandemic prevention and control around the world. It is difficult to accurately reveal the influences of season and geographic location on relationship between COVID-19 transmission and meteorological factors.
After December 2019, successive outbreaks of COVID-19 occurred in Wuhan, Harbin, Beijing, Urumqi, Dalian, Qingdao and Kashgar, China. China’s government implemented a series of community-based prevention and control measures, such as traffic control, home quarantine, and nucleic acid testing of all residents and registering digital QR code, to minimize the danger of the virus to local residents [34]. Since pandemic prevention and control is carried out under the guidance of the National Health Commission of China, all COVID-19 outbreak cities adopted the same community management measures. According to the China government report and the published studies, the implementation of these measures effectively limited the spread of COVID-19 [18,32,34,35]. Until now, R0, the basic reproductive rate indicating the transmissibility of novel coronavirus, is below 1 [36,37]. The death toll is less than 5000 [34]. Because the same community-based pandemic prevention and control measures were adopted in different cities by the Chinese government, the change of relationship between meteorological factors and COVID-19 transmission may be mainly affected by season and geographical location. However, at present there is no study analyzing and testing this speculation.
The aim of this study is to reveal if the influence of meteorological factors on COVID-19 transmission varies with season and geographical location. In order to achieve this scientific aim, we collected the total number of COVID-19 infected people (including the confirmed cases and asymptomatic-infected persons) and meteorological factors in all COVID-19 outbreak cities of China during the period of community-based pandemic prevention and control. Then, we used four statistical models to fit the change of COVID-19 infected cases, and used multiple stepwise regression and Pearson correlation to analyze the relationship between meteorological factors and COVID-19 infected cases. Our study provides a new view for explaining the reasons for COVID-19 transmission while under the implementation of community-based pandemic prevention and control, which is conducive to predicting COVID-19 transmission dynamics, and developing effective prevention and control measures.

2. Data Collection

After December 2019, the Chinese government officially reported COVID-19 outbreaks in seven cities (Wuhan, Harbin, Beijing, Urumqi, Dalian, Qingdao and Kashgar) (Table 1). Among these cities, the number of infected cases reported in Harbin and Qingdao was small, thus we did not include these two cities in the data processing due to low statistical significance. At present (11 November 2020), the epidemic has not ended in Kashgar, so we did not study it. Wuhan, Beijing, Urumqi and Dalian were selected as research objects. The epidemic data of each city, including the number of newly confirmed cases and the number of the asymptomatic infections person, were obtained from the China National Health Commission (NHC) (http://www.nhc.gov.cn). Meteorological data were collected from the China National Meteorological Information Center (http://data.cma.cn), which included daily maximum temperature (Tmax), minimum temperature (Tmin), temperature range (DTR), average temperature (Tm), relative humidity (RH), average wind speed (MWS) and precipitation (TP) (Figure 1).
The aim of this study is to reveal the reason for the change in relationship between COVID-19 transmission and meteorological factors among the four cities after the implementation of community-based epidemic prevention and control. Therefore, the starting time of our study is when epidemic prevention control measures were first imposed, while the end time is when the number of newly confirmed cases returns to zero (Table 1 and Figure 1). Except for the confirmed cases, COVID-19 patients also include those who are asymptomatically infected, which has no clinically identifiable symptoms such as fever, cough and sore throat. Asymptomatically infected persons are difficult to find within the population, but they can spread novel coronavirus to others, or become a confirmed case in the days ahead [2]. Starting on 31 March 2020, the health commissions of Chinese provinces and municipalities began to release data on the asymptomatically infected persons. Therefore, the sum of the confirmed cases and the number of asymptomatically infected persons is defined as the infected cases. However, the occurrence period of the COVID-19 outbreak in Wuhan was earlier than 31 March 2020, so there are no data on asymptomatic infections in Wuhan (Table 1).

3. Method

In this study, four statistic models (i.e., Gaussian, logistic, lognormal distribution and allometric models) were first performed on the change of the infected cases. R2 and p-value were used to select the best-fitting model. The model with larger R2 and the smallest p-value was the best-fitting model. The difference in the fitting parameters was used to determine if COVID-19 transmission patterns varied among the four cities. Since the best-fitting model was presented as an identical equation, different fitting parameters indicated if COVID-19 transmission patterns varied among the four cities. After that, one-way ANOVA was used to compare the differences in meteorological factors among the four cities. Pearson correlation and multiple stepwise regressions were used to analyze if the relationship between meteorological factors and COVID-19 infected cases were different among the four cities, and if the relationship can be affected by the season and geographic location.

4. Results and Discussion

4.1. The Best-Fitting Model of COVID-19 Infected Cases during the Period of Community-Based Epidemic Prevention and Control

Our results found that all p-values of the four models were less than 0.1, while R2 in the lognormal distribution model were higher than other models (Table 2 and Figure 2). These indicated that the lognormal distribution model had a best-fitting effect on COVID-19 infected cases. Except for the statistical model used in this study, some traditional infectious disease dynamics models, like Susceptible-Exposed-Infected-Removed model (SEIR), were often used in previous studies to fit the change of pandemic infected cases [38,39]. The coefficient of determination (R2) of SEIR in these studies fitting the change of COVID-19 confirmed cases ranged from 0.40 to 0.80, which was less than our selected model (R2 ≥ 0.86). Pei et al. [40] demonstrated that the SEIR model was not suitable for fitting the change of the infection cases when implemented for high-intensity community-based epidemic prevention and control, due to high-difficulty collection of spatial distribution for the patients and complex modeling process. Compared with SEIR, only one parameter, infected cases, was used. Spatial distribution data were not involved in the lognormal distribution model, which was very simple and easy to use. The lognormal distribution model might have a good application to fit and predict the change of COVID-19 infected cases for the period of community-based epidemic prevention and control.
The fitting effect of the lognormal distribution model to the infected cases was better in Wuhan (R2 = 0.89, p-value < 0.001) and Beijing (R2 = 0.89, p-value < 0.001) than in Dalian (R2 = 0.86, p-value < 0.001) and Urumqi (R2 = 0.78, p-value < 0.001). This indicated that the fitting accuracy of the lognormal distribution model on COVID-19 infected cases varied among cities. Dalziel et al. [41] and Soebiyanto et al. [42] considered that the fitting accuracy of the pandemic model may be related to virus transmission pattern. Differences in population size and mobility, environmental condition, the quality and quantity of public medical resource, the initial infectious cases and genetic type of virus all affected the variation of COVID-19 spread [23,35,38]. Thus, the transmission pattern would be varied among different cities [35]. This result also can be proven by the difference in model fitting parameters among the four cities. Our result found that the fitting parameters (i.e., y0, xc, w and A) of the lognormal distribution model on COVID-19 infected cases all varied, indicating that the transmission pattern of COVID-19 changed among the four cities (Figure 2).

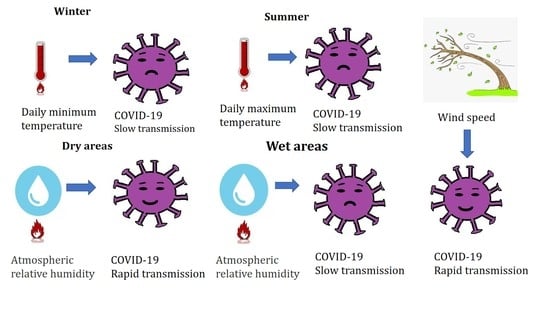
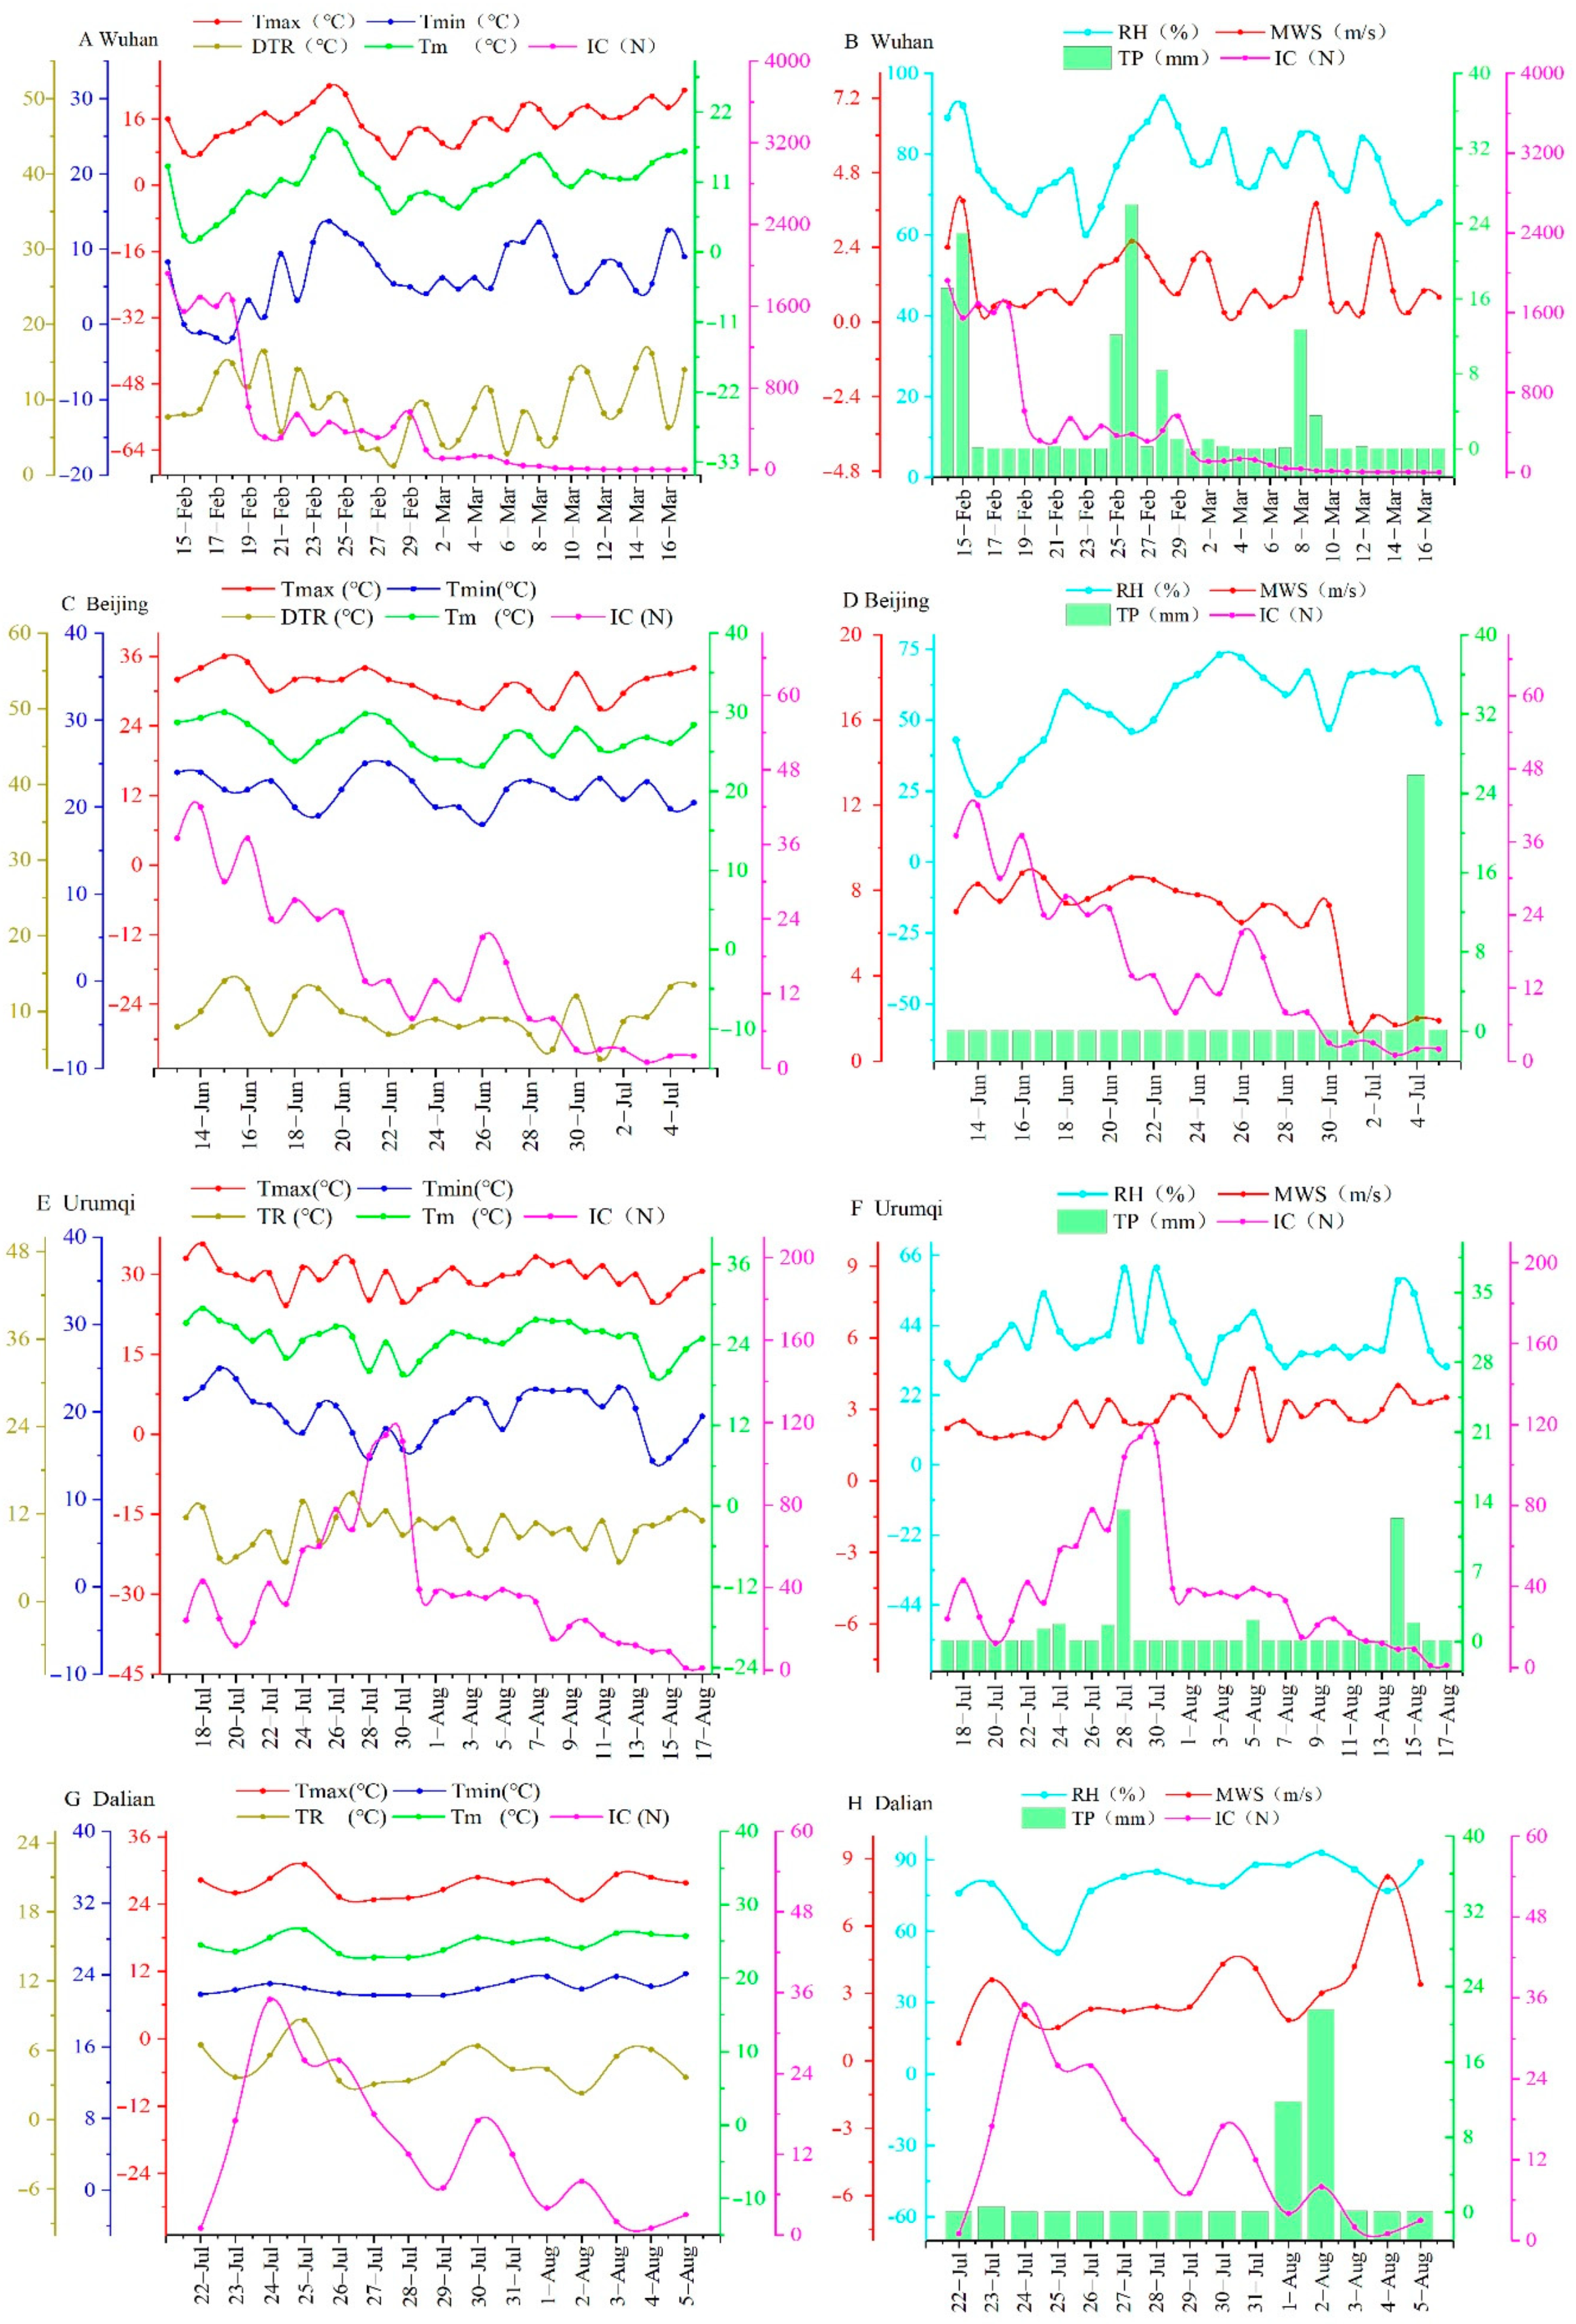
4.2. Influence of Meteorological Factors on COVID-19 Transmission

One-way ANOVA results showed that, except for precipitation (TP), other meteorological factors (Tmax, Tmin, DTR, Tm, RH and MWS) showed significant difference among the four cities (p < 0.05) (Figure 1 and Table 2). Pearson correlation analysis found that TP had no significant relationship with COVID-19 infected cases (p > 0.05) (Table 3). This result was consistent with previous studies that rainfall had no direct effect on host susceptibility, virus transmission and survival [6,14,19,42]. Our results showed that the influence of temperature on COVID-19 infected cases varied with their types. Tmax, Tmin and Tm were significantly correlated with COVID-19 infected cases in most situations (p < 0.05), while DTR was not related in all cities (p > 0.05) (Table 3), suggesting that Tmax, Tmin and Tm had more influence on COVID-19 transmission than DTR. This result was consistent with the temperature–amplitude coupling hypothesis, which implies that virus activity and enzymes necessary to replicate in the host are mainly influenced by the highest, lowest and optimum temperatures, instead of day–night temperature difference [3,6,11,15].
The significant influencing factors of COVID-19 infected cases differed among the four cities. Specifically, COVID-19 infected cases in Wuhan were significantly negatively correlated with Tmax, Tmin and Tm (p < 0.05), but not related with other factors (p > 0.05). RH had a significant negative correlation with COVID-19 infected cases in Beijing (p < 0.05), while MWS showed an opposite pattern (positive; p < 0.05). COVID-19 infection cases in Urumqi were significantly affected by Tmin (negative), Tm (negative) and RH (positive) (p < 0.05), while not correlated with other factors. COVID-19 infection cases in Dalian were only significantly positively associated with RH (p < 0.05) (Table 3). These results indicate that the influences of Tmax, Tmin, Tm, RH and MWS on COVID-19 transmission differed among the four cities. This was probably due to the superadaptability of the novel coronavirus [10,14,15]. The four cities of this study were located in different climatic regions of China, and the seasons of COVID-19 outbreak also varied among them. According to ecological adaptability theory, the major limiting meteorological factors of viruses vary for different seasons and climatic regions [18,21,24,32]. Similar results were found in previous research, which showed that the contribution of meteorological factors to COVID-19 transmission varied between tropical and temperate regions [11,12,13,14]. For example, high relative humidity mitigated the spread of COVID-19 in tropical regions [14,15], whereas it contributed to the increase of COVID-19 infections in temperate regions [32,43].
The result of multiple stepwise regressions (MSR) differed among the four cities (Table 4). Tmin was the only last reserved variable of MSR in Wuhan (R2 = 0.30, p < 0.001). Tm, RH and MWS were the last influencing factors of COVID-19 infected cases in Beijing (R2 = 0.68, p < 0.001). Tmax and RH were the last reserved variables affecting COVID-19 infected cases in Urumqi (R2 = 0.27, p < 0.05), while Tmax, Tmin and RH were final reserved variables of MSR in Dalian (R2 = 0.75, p < 0.001) (Table 4). These results indicate that temperature, humidity and wind speed were most directly related to COVID-19 transmission. This result is consistent with many previous studies [5,11,19,22]. For example, Lowen et al. [28] found that temperature affected the risk of coronavirus infection in humans. Living in a low temperature environment was beneficial for viruses having higher reproductive rate in the upper respiratory tract due to the cooling of mucosa. Novel coronavirus remains active for a long time in the low temperature environment [4,15,16]. A slight rise of temperature will increase spatial distance and exposure risk of the virus due to the increase in the intensity of Brownian motion of atmospheric particulates [27]. Changes in air humidity may injure respiratory epithelial cells and reduce the mucosal ciliary clearance due to the fact that it has an obvious relationship with the moisture conditions of nasal mucosa. The change in air humidity will affect the exposure risk of viruses to humans [11,28]. As wind speed is positively related with the speed and distance of virus transmission in the atmosphere, and the virus is also adsorbed on suspended particles that accumulate near the ground, the increase in wind speed will accelerate the spread of COVID-19 [20,44,45].
The influence of temperature on COVID-19 infected cases varied among cities (Table 4). Tmin was the most determining factor of COVID-19 transmission in Wuhan, but its contribution on the change of COVID-19 infected cases was less than Tmax in Beijing, Urumqi and Dalian (Table 4). This difference may be caused by seasonal change. The COVID-19 outbreak in Wuhan occurred in winter (December–March), in contrast to summer in Beijing, Urumqi and Dalian (June–August) (Table 1). COVID-19 transmission in summer may be highly affected by the maximum temperature [46], whereas in winter it might be associated more with the minimum temperature [43]. In summer, the influence of temperature on organisms is mainly implemented by excessive water loss and the inactivation of physiological metabolic enzymes caused by high temperature [6,28,29]. Compared with other living organisms, viruses are more susceptible to high temperatures due to their simple structure and lack of hardened protective tissues. A rise of maximum temperature will induce the denaturation of viral proteins and nucleic acids, inactivating the virus and making it less infectious [28,47,48]. However, in winter, an obvious drop in temperature is beneficial for virus survival and infection. This is probably because the virus is coated with a protective layer of lipid material [29]. In a warm environment, the virus will quickly expire if not within a person or animal body, due to the fact that the protective layer of lipid material needs to remain liquid. During cold winters, a temperature drop will make this layer change from liquid to solid, which subsequently helps protective tissues lengthen the time that the virus can survive in the atmosphere [28,29]. After entering a person’s respiratory tract, the protective tissues will melt and not affect virus proliferation [29]. Thus, COVID-19 depended more on minimum temperature compared with average and maximum temperature in winter. This result was also proven in many current studies. For example, Cervino et al. [49] showed the persistence of coronavirus is favored by a low temperature (4 °C) and is gradually inactivated by the increase of temperature, a finding they reported after summarizing many published articles. Behnood et al. [50] found that COVID-19 had the lowest infection rates at the peak of higher summer temperatures in the United States. Tobías and Molina [51] indicated that minimum temperatures had negative significant relation with COVID-19 confirmed cases in winter in Barcelona.
The influence of relative humidity on COVID-19 infection cases also differed among the four cities. COVID-19 infected cases had a negative correlation with RH in Beijing and Dalian, while showing a positive relationship in Urumqi. Beijing and Dalian are located in humid areas in eastern China, which are controlled by the oceanic climate and experience abundance air relative humidity (RH > 50%) (Table 5). On the contrary, Urumqi is in an inland desert region with low air relative humidity (RH = 41%) and controlled by the continental climate (Table 5) [52]. This suggests that the influence of relative humidity on COVID-19 infection cases might be associated with geographic location or climate region [6,9,11,13]. The decrease in the relative humidity in humid region might promote COVID-19 transmission, while an opposite pattern occurs in the arid inland region. This conclusion differs from many previous studies showing that a decrease in relative humidity is conducive to coronavirus transmission [53,54,55]. The reason for this difference might be attributed to the relationship between air humidity and the deposition of atmosphere particulates [25,26,27]. Novel coronavirus was mainly transmitted in the atmosphere through droplets exhaled by the virus carrier. These could pass from one person to another through a sneeze, a cough or direct personal contact [49]. Most of it was attached on the surface of a droplet. In humid regions, under the effect of high air humidity, the droplets exhaled by the virus carrier are quickly fused by other droplets into larger drops that quickly sink to the ground when their weight is sufficiently high to overcome the air buoyancy [26,27]. According to the reports from WHO and Cervino et al. [49], the larger droplets (diameter ≥ 5 μm) travel in the air for short distances, generally less than 1 m. The deposition of a large number of massive droplets reduced virus quantity, leading to a negative relationship between air humidity and COVID-19 infected cases [11,38]. However, this explanation does not apply in arid regions such as Urumqi. In drought desert areas, especially in summer, intense evaporation and high temperature pumped more water from the virus and reduced metabolic enzyme activity [56]. Therefore, the increase of air humidity would be conducive to survival and transmission of COVID-19.
Wind speed had a significant positive influence on COVID-19 infected cases in Beijing, but did not affect the other cities. This may be caused by geographic location and season. Beijing is located in the northern part of the North Plains of China, surrounded by the Taihang and Yanshan Mountains, and lies 150 km from the Bohai Sea, which is influenced by both inland and oceanic climate. As the transition from inland to oceanic climates, wind speeds are higher in the period from May and July compared with the other regions studied due to frequently air convection. As Table 1 shows, average wind speed in Beijing was 6.41 m/s, which was significantly higher than the other cities. The advantage of wind speed would be to increase the spread distance and diffusion rate of SARS-CoV-2 coronavirus. Additionally, higher wind speed is also beneficial for the formation of turbulence inside the city, which results in the accumulation of novel coronavirus near the ground, and therefore a higher risk of infection [44,45]. This finding was consistent with previous studies [3,20,57]. For example, Dhruv [3] and Şahin [20] found that wind speed promoted COVID-19 transmission in California and Turkey in spring season, respectively. Yuan et al. [57] indicated that wind speed positively affected the confirmed cases of COVID-19 in Beijing in the spring.

5. Conclusions and Comments

COVID-19 infected case records and meteorological data during implementation of community-based epidemic prevention and control were collected in four Chinese cities, in order to test if their relationship was affected by season and geographic location. Compared with other statistical models, the results showed that the lognormal distribution model had the best fit for the changes of COVID-19 infected cases. This indicated that this model can be used to predict the change of the confirmed cases in COVID-19 outbreak cities, especially in cities where community-based epidemic prevention and control in China were implemented. However, the fitting parameters varied among the four cities, indicating that the factors influencing COVID-19 transmission differed. Wind speed, temperature and relative humidity were most directly related to COVID-19 transmission when compared with other meteorological factors, but their influence varied with season and geographic location. In the warm season, the increase in maximum temperature limited COVID-19 transmission in the arid inland region (Urumqi), while high air relative humidity promoted transmission. However, in the more coastal region (Dalian and Beijing), the increases both in maximum temperature and air relative humidity were not conducive to COVID-19 transmission. In contrast, in the cold season, minimum temperature was linked more closely with the spread of COVID-19 than with other meteorological factors. The decrease in the minimum temperature accelerated COVID-19 transmission (Wuhan). Wind speed had a positive relationship with the spread of COVID-19 because it affected the formation of turbulence, which influenced the spread distance and diffusion rate of virus in the atmosphere. In this study, we established regression models to measure the relationship between COVID-19 infected cases and meteorological factors in different seasons and geographical regions (Table 4). R2 and p-values of all models were greater than 0.27 and less than 0.05, respectively, indicating that our models have certain feasibility in predicting the changes of COVID-19 confirmed cases by using meteorological data. In the future, based on geographic location and season, government and epidemic management agencies can use meteorological forecast data to predict COVID-19 confirmed cases in the short term (such as 15 days) by using our models. This can provide an early warning for reducing the impact of COVID-19 on the lives and health of local residents.
Our results suggest that novel coronavirus is very cunning, can always adapt to adverse circumstances to sustain transmission. The influence of meteorological factors on the propagation and survival of novel coronavirus is complicated and varies with season and geographic location. At present, many studies have proved that meteorological factors, especially temperature, air humidity and wind speed, have significant influence on COVID-19 transmission [7,8,9,10,11,12,13,14,15,16,17,18,19]. However, such studies are mostly drawn on large scales and humid regions [7,8,9,10,11,12,13,14,15]. The design of current pandemic control measures are usually based on the research output of these studies, which may not be applicable for small scales and arid inland cities. In addition, the influence of meteorological factors on COVID-19 transmission changes with season and geographical location. Therefore, the design of community-based COVID-19 prevention and control measures should be conducted for each individual city, and the influence of seasonal changes and difference of geographical location should be accounted for simultaneously. We also found that lower values of both air relative humidity and temperature facilitate the spread of COVID-19 in winter. In the coming months of winter in the northern Hemisphere, increasing indoor temperatures while reducing air relative humidity is an effective way to prevent COVID-19 spread within the community.

Author Contributions

Conceptualization, X.-D.Y. and H.-L.L.; methodology, X.-D.Y. and Y.-E.C.; validation, X.-D.Y., H.-L.L. and Y.-E.C.; formal analysis, X.-D.Y.; writing—original draft preparation, X.-D.Y. and Y.-E.C.; writing—review and editing, H.-L.L. and Y.-E.C.; visualization, H.-L.L.; supervision, Y.-E.C.; project administration, X.-D.Y. All authors have read and agreed to the published version of the manuscript.

Funding

This study was supported by National Natural Science Foundation of China (No. 41871031 and 31860111).

Data Availability Statement

All data used in this study are issued by China’s National Health Commission and China National Meteorological Information Center. This data can be found here: [http://www.nhc.gov.cn; http://data.cma.cn].

Acknowledgments

We thank Pan Yingji at Leiden University and Yan Kaihong at the Newcastle University for their assistance with English language and grammatical editing.

Conflicts of Interest

The authors declare no conflict of interest.

References

  1. WHO Coronavirus Disease (COVID-19) Outbreak Situation. Available online: https://www.who.int/ (accessed on 11 November 2020).
  2. CNR Many Countries in Europe “Closed City”! Why is the Second Outbreak More Serious than the First. Available online: http://www.cnr.cn/ (accessed on 29 October 2020).
  3. Dhruv, G. Effect of ambient temperature on COVID-19 infection rate. SSRN 2020, 7. [Google Scholar] [CrossRef]
  4. Qi, H.; Xiao, S.; Shi, R.; Ward, M.P.; Chen, Y.; Tu, W.; Su, Q.; Wang, W.; Wang, X.; Zhang, Z. COVID-19 transmission in Mainland China is associated with temperature and humidity: A time-series analysis. Sci. Total Environ. 2020, 728, 138778. [Google Scholar] [CrossRef] [PubMed]
  5. Menebo, M.M. Temperature and precipitation associate with Covid-19 new daily cases: A correlation study between weather and Covid-19 pandemic in Oslo, Norway. Sci. Total Environ. 2020, 737, 139659. [Google Scholar] [CrossRef] [PubMed]
  6. Bashir, M.F.; Ma, B.; Komal, B.; Bashir, M.A.; Tan, D.; Bashir, M. Correlation between climate indicators and COVID-19 pandemic in New York, USA. Sci. Total Environ. 2020, 728, 138835. [Google Scholar] [CrossRef]
  7. Yao, M.; Zhang, L.; Ma, J.; Zhou, L. On airborne transmission and control of SARS-Cov-2. Sci. Total Environ. 2020, 731, 139178. [Google Scholar] [CrossRef] [PubMed]
  8. Ahmadi, M.; Sharifi, A.; Dorosti, S.; Ghoushchi, S.J.; Ghanbari, N. Investigation of effective climatology parameters on COVID-19 outbreak in Iran. Sci. Total Environ. 2020, 729, 138705. [Google Scholar] [CrossRef] [PubMed]
  9. Kumar, S. Effect of meteorological parameters on spread of COVID-19 in India and air quality during lockdown. Sci. Total Environ. 2020, 745, 141021. [Google Scholar] [CrossRef] [PubMed]
  10. He, Z.; Chin, Y.; Huang, J.; He, Y.; Akinwunmi, B.O.; Yu, S.; Zhang, C.J.P.; Ming, W.-K. Meteorological factors and domestic new cases of coronavirus disease (COVID-19) in nine Asian cities: A time-series analysis. medRxiv 2020. [Google Scholar] [CrossRef]
  11. Auler, A.C.; Cássaro, F.A.M.; Silva, V.O.D.; Pires, L.F. Evidence that high temperatures and intermediate relative humidity might favor the spread of COVID-19 in tropical climate: A case study for the most affected Brazilian cities. Sci. Total Environ. 2020, 729, 139090. [Google Scholar] [CrossRef]
  12. Azuma, K.; Kagi, N.; Kim, H.; Hayashi, M. Impact of climate and ambient air pollution on the epidemic growth during COVID-19 outbreak in Japan. Environ. Res. 2020, 190, 110042. [Google Scholar] [CrossRef]
  13. Pani, S.K.; Lin, N.-H.; RavindraBabu, S. Association of COVID-19 pandemic with meteorological parameters over Singapore. Sci. Total Environ. 2020, 740, 140112. [Google Scholar] [CrossRef] [PubMed]
  14. Tosepu, R.; Gunawan, J.; Effendy, D.S.; Ahmad, L.O.A.I.; Lestari, H.; Bahar, H.; Asfian, P. Correlation between weather and Covid-19 pandemic in Jakarta, Indonesia. Sci. Total Environ. 2020, 725, 138436. [Google Scholar] [CrossRef] [PubMed]
  15. Haque, S.E.; Rahman, M. Association between temperature, humidity, and COVID-19 outbreaks in Bangladesh. Environ. Sci. Policy 2020, 114, 253–255. [Google Scholar] [CrossRef]
  16. Shi, P.; Dong, Y.; Yan, H.; Zhao, C.; Li, X.; Liu, W.; He, M.; Tang, S.; Xi, S. Impact of temperature on the dynamics of the COVID-19 outbreak in China. Sci. Total Environ. 2020, 728, 138890. [Google Scholar] [CrossRef] [PubMed]
  17. Chang, C.L.; Wen, C.L. Meteorological impacts on the incidence of COVID-19 in the U.S. Stoch. Environ. Res. Risk Assess. 2020, 34, 1675–1680. [Google Scholar]
  18. Guo, X.-J.; Zhang, H.; Zeng, Y.-P. Transmissibility of COVID-19 in 11 major cities in China and its association with temperature and humidity in Beijing, Shanghai, Guangzhou, and Chengdu. Infect. Dis. Poverty 2020, 9, 1–13. [Google Scholar] [CrossRef]
  19. Méndez-Arriaga, F. The temperature and regional climate effects on communitarian COVID-19 contagion in Mexico throughout phase 1. Sci. Total Environ. 2020, 735, 139560. [Google Scholar] [CrossRef]
  20. Şahin, M. Impact of weather on COVID-19 pandemic in Turkey. Sci. Total Environ. 2020, 728, 138810. [Google Scholar] [CrossRef]
  21. Bolaño-Ortiz, T.R.; Camargo-Caicedo, Y.; Puliafito, S.E.; Ruggeri, M.F.; Bolaño-Diaz, S.; Pascual-Flores, R.; Saturno, J.; Ibarra-Espinosa, S.; Mayol-Bracero, O.L.; Torres-Delgado, E.; et al. Spread of SARS-CoV-2 through Latin America and the Caribbean region: A look from its economic conditions, climate and air pollution indicators. Environ. Res. 2020, 191, 109938. [Google Scholar] [CrossRef]
  22. Lolli, S.; Chen, Y.-C.; Wang, S.-H.; Vivone, G. Impact of meteorological conditions and air pollution on COVID-19 pandemic transmission in Italy. Sci.Rep. 2020, 10, 16213. [Google Scholar] [CrossRef]
  23. Ali, K. Coronavirus Infectious Disease (COVID-19) Modeling: Evidence of Geographical Signals. SSRN 2020, 7, 3568425. [Google Scholar] [CrossRef]
  24. Wang, M.; Jiang, A.; Gong, L.; Luo, L.; Guo, W.; Li, C.; Zheng, J.; Li, C.; Yang, B.; Zeng, J.; et al. Temperature Significant Change COVID19 Transmission in 429 Cities. medRxiv 2020. [Google Scholar] [CrossRef] [Green Version]
  25. Ahlawat, A.; Wiedensohler, A.; Mishra, S.K. An Overview on the Role of Relative Humidity in Airborne Transmission of SARS-CoV-2 in Indoor Environments. Aerosol. Air Qual. Res. 2020, 20, 1856–1861. [Google Scholar] [CrossRef]
  26. Yang, W.; Marr, L.C. Dynamics of Airborne Influenza A Viruses Indoors and Dependence on Humidity. PLoS ONE 2011, 6, e21481. [Google Scholar] [CrossRef] [PubMed] [Green Version]
  27. Bhardwaj, R.; Agrawal, A. Likelihood of survival of coronavirus in a respiratory droplet deposited on a solid surface. Phys. Fluids 2020, 32, 061704. [Google Scholar] [CrossRef] [PubMed]
  28. Lowen, A.C.; Mubareka, S.; Steel, J.; Palese, P. Influenza virus transmission is dependent on relative humidity and temperature. PLoS Pathog. 2007, 3, e151. [Google Scholar] [CrossRef] [PubMed]
  29. Polozov, I.V.; Bezrukov, L.; Gawrisch, K.; Zimmerberg, J. Progressive ordering with decreasing temperature of the phospholipids of influenza virus. Nat. Chem. Biol. 2008, 4, 248–255. [Google Scholar] [CrossRef] [Green Version]
  30. Kumar, M.; Mazumder, P.; Mohapatra, S.; Thakur, A.K.; Dhangar, K.; Taki, K.; Mukherjee, S.; Patel, A.K.; Bhattacharya, P.; Mohapatra, P. A chronicle of SARS-CoV-2: Seasonality, environmental fate, transport, inactivation, and antiviral drug resistance. J. Hazard. Mater. 2020, 124043. [Google Scholar] [CrossRef]
  31. Audi, A.; AlIbrahim, M.; Kaddoura, M.; Hijazi, G.; Yassine, H.M.; Zaraket, H. Seasonality of Respiratory Viral Infections: Will COVID-19 Follow Suit? Front. Public Health 2020, 8, 576184. [Google Scholar] [CrossRef]
  32. Bu, J.; Peng, D.-D.; Xiao, H.; Yue, Q.; Han, Y.; Lin, Y.; Hu, G.; Chen, J. Analysis of meteorological conditions and prediction of epidemic trend of 2019-nCoV infection in 2020. medRxiv 2020. [Google Scholar] [CrossRef] [Green Version]
  33. Luo, W.; Majumder, M.; Liu, D.; Poirier, C.; Mandl, K.; Lipsitch, M.; Santillana, M. The role of absolute humidity on transmission rates of the COVID-19 outbreak. SSRN 2020. [Google Scholar] [CrossRef]
  34. NHC November 11: Daily Briefing on Novel Coronavirus Cases in China. Available online: http://en.nhc.gov.cn/index.html (accessed on 11 November 2020).
  35. Chen, D.; Yang, Y.; Zhang, Y.; Yu, W. Prediction of COVID-19 spread by sliding mSEIR observer. Inf. Sci. 2020, 63, 222203. [Google Scholar] [CrossRef]
  36. Delamater, P.L.; Street, E.J.; Leslie, T.F.; Yang, Y.T.; Jacobsen, K.H. Complexity of the basic reproduction number (R0). Emerg. Infect. Dis. 2019, 25, 1. [Google Scholar] [CrossRef] [PubMed] [Green Version]
  37. Peng, Z.; Song, W.; Ding, Z.; Guan, Q.; Yang, X.; Xu, Q.; Wang, X.; Xia, Y. Linking key intervention timings to rapid declining effective reproduction number to quantify lessons against COVID-19. Front. Med. 2020, 14, 623–629. [Google Scholar] [CrossRef] [PubMed]
  38. Al-Khani, A.M.; Khalifa, M.A.; Almazrou, A.; Saquib, N. The SARS-CoV-2 pandemic course in Saudi Arabia: A dynamic epidemiological model. Infect. Dis. Model. 2020, 5, 766–771. [Google Scholar]
  39. Postavaru, O.; Anton, S.; Toma, A. COVID-19 pandemic and chaos theory. Math. Comput. Simul. 2020, 181, 138–149. [Google Scholar] [CrossRef]
  40. Pei, T.; Wang, X.; Song, C.; Liu, Y.; Huang, Q.; Shu, H.; Chen, X.; Guo, S.; Zhou, C. Review on spatiotemporal analysis and modeling of COVID-19 pandemic. J. Geo-Inform. Sci. 2021, 23. [Google Scholar] [CrossRef]
  41. Dalziel, B.D.; Pourbohloul, B.; Ellner, S.P. Human mobility patterns predict divergent epidemic dynamics among cities. Proc. R. Soc. B Biol. Sci. 2013, 280, 20130763. [Google Scholar] [CrossRef]
  42. Soebiyanto, R.P.; Adimi, F.; Kiang, R.K. Modeling and predicting seasonal influenza transmission in warm regions using climatological parameters. PLoS ONE 2010, 5, 0009450. [Google Scholar] [CrossRef] [Green Version]
  43. Liu, J.; Zhou, J.; Yao, J.; Zhang, X.; Li, L.; Xu, X.; He, X.; Wang, B.; Fu, S.; Niu, T. Impact of meteorological factors on the COVID-19 transmission: A multi-city study in China. Sci. Total Environ. 2020, 726, 138513. [Google Scholar] [CrossRef]
  44. Eames, I.; Tang, J.; Li, Y.; Wilson, P. Airborne transmission of disease in hospitals. R. Soc. 2009, 6, 691–702. [Google Scholar] [CrossRef] [PubMed] [Green Version]
  45. Yu, I.T.S.; Li, Y.; Wong, T.W.; Tam, W.; Chan, A.T.; Lee, J.H.W.; Leung, D.Y.C.; Ho, T. Evidence of Airborne Transmission of the Severe Acute Respiratory Syndrome Virus. N. Engl. J. Med. 2004, 350, 1731–1739. [Google Scholar] [CrossRef] [PubMed] [Green Version]
  46. Zoran, M.A.; Savastru, R.S.; Savastru, D.M.; Tautan, M.N. Assessing the relationship between surface levels of PM2. 5 and PM10 particulate matter impact on COVID-19 in Milan, Italy. Sci. Total Environ. 2020, 738, 139825. [Google Scholar] [CrossRef] [PubMed]
  47. Woese, C. Thermal inactivation of animal viruses. Ann. N. Y. Acad. Sci. 1960, 83, 741–751. [Google Scholar] [CrossRef]
  48. Nielsen, J.; Mazick, A.; Glismann, S.; Mølbak, K. Excess mortality related to seasonal influenza and extreme temperatures in Denmark, 1994-2010. BMC Infect. Dis. 2011, 11, 350. [Google Scholar] [CrossRef] [Green Version]
  49. Cervino, G.; Fiorillo, L.; Surace, G.; Paduano, V.; Fiorillo, M.T.; De Stefano, R.; Laudicella, R.; Baldari, S.; Gaeta, M.; Cicciù, M. SARS-CoV-2 Persistence: Data Summary up to Q2 2020. Data 2020, 5, 81. [Google Scholar] [CrossRef]
  50. Behnood, A.; Golafshani, E.M.; Hosseini, S.M. Determinants of the infection rate of the COVID-19 in the US using ANFIS and virus optimization algorithm (VOA). Chaos Solitons Fractals 2020, 139, 110051. [Google Scholar] [CrossRef]
  51. Tobías, A.; Molina, T. Is temperature reducing the transmission of COVID-19? Environ. Res. 2020, 186, 109553. [Google Scholar] [CrossRef]
  52. Liu, X.; Dong, B. Influence of the Tibetan Plateau uplift on the Asian monsoon-arid environment evolution. Chin. Sci. Bull. 2013, 58, 4277–4291. [Google Scholar] [CrossRef] [Green Version]
  53. Casanova, L.M.; Jeon, S.; Rutala, W.A.; Weber, D.J.; Sobsey, M.D. Effects of air temperature and relative humidity on coronavirus survival on surfaces. Appl. Environ. Microbiol. 2010, 76, 2712–2717. [Google Scholar] [CrossRef] [Green Version]
  54. Chan, K.-H.; Peiris, J.M.; Lam, S.; Poon, L.L.; Yuen, K.-Y.; Seto, W.H. The effects of temperature and relative humidity on the viability of the SARS coronavirus. Adv. Virol. 2011, 2011. [Google Scholar] [CrossRef] [PubMed]
  55. Van Doremalen, N.; Bushmaker, T.; Munster, V. Stability of Middle East respiratory syndrome coronavirus (MERS-CoV) under different environmental conditions. Eurosurveillance 2013, 18, 20590. [Google Scholar] [CrossRef] [PubMed] [Green Version]
  56. Moeller, P.W.; Fields, P.A.; Dutson, T.R.; Landmann, W.A.; Carpenter, Z.L. Effect of high temperature conditioning on subcellular distribution and level of lysosomal enzymes. J. Food Sci. 1976, 41, 216–217. [Google Scholar] [CrossRef]
  57. Yuan, J.; Yun, H.; Lan, W.; Wang, W.; Sullivan, S.G.; Jia, S.; Bittles, A.H. A climatologic investigation of the SARS-CoV outbreak in Beijing, China. Am. J. Infect. Control 2006, 34, 234–236. [Google Scholar] [CrossRef] [PubMed]
Figure 1. Changes in COVID-19 infected cases and meteorological factors during the period of community-based epidemic prevention and control in four cities. Tmax, Tmin, DTR, Tm, RH, MWS and TP represent daily maximum temperature, minimum temperature, temperature range, average daily temperature, air relative humidity, average wind speed and precipitation, respectively. IC refers to COVID-19 infected cases.
Ijerph 18 00484 g001
Figure 2. The fitting curve of COVID-19 infected cases using the lognormal distribution model in four Chinese cities (AD).
Ijerph 18 00484 g002
Table 1. Summary of COVID-19 outbreak information for selected cities in China (after December 2019).
CitesSeasonDuration of COVID-19 OutbreaksDuration of Community ControlCumulative Number of the Confirmed Cases (N) Cumulative Number of the Asymptomatic Infected Persons (N)
WuhanWinter8 December 2019–23 March 202011 February 2020–27 March 202068,100NA
HarbinSpring10 April 2020–21 May 202012 April 2020–10 June 20206626
BeijingSummer11 June 2020–6 August 202013 June 2020–6 July 202033553
UrumqiSummer15 July 2020–7 September 202013 July 2020–23 August 2020828390
DalianSummer22 July 2020–23 August 202022 July 2020–20 August 20209297
QingdaoAutumn11 October 2020–12 November 202012 October 2020–26 October 2020138
KashgarAutumn24 October 2020–at present24 October 2020–at present81423
Table 2. The fitting models of COVID-19 infected cases during the period of community-based epidemic prevention and control. NA indicates no appropriate model to fit the change of COVID-19 infected cases because R2 is less than 0.
ModelsEquationsWuhanBeijingUrumqiDalian
R2pR2pR2pR2p
Gaussian model y = y 0 + A w π / 2 e 2 ( x x c ) 2 x 2 0.88<0.010.74<0.010.78<0.010.48<0.01
Logistic model y = A 2 + A 1 A 2 1 + ( x x 0 ) p NANA0.67<0.01NANANANA
Lognormal distribution model y = y 0 + A 2 π w x e ( l n x x c ) 2 2 w 2 0.89<0.010.89<0.010.79<0.010.86<0.01
Allometric model y = a x b 0.02<0.010.21<0.012.27 × 10−5<0.010.11<0.01
Table 3. Pearson correlation between meteorological factors and COVID-19 infected cases in four cities. Definitions of Tmax, Tmin, DTR, Tm, RH, MWS and TP are presented in Figure 1; * p < 0.05; ** p < 0.01; *** p < 0.001.
CityTmax (°C)Tmin (°C)DTR (°C)Tm (°C)RH (%)MWS (m·s−1)TP (mm)
Wuhan (January–March)−0.42 *−0.55 **0.12−0.53 **0.150.130.34
Beijing (June–July)0.360.140.240.31−0.67 **0.65 **−0.25
Urumqi (July–August)−0.22−0.47 **0.29−0.39 **0.42 *−0.040.21
Dalian (July–August)−0.27−0.020.11−0.11−0.65 **−0.330.22
Table 4. The result of multiple stepwise regressions used to analyze the influence of meteorological factors on COVID-19 infected cases (Y) in four cities.
CityRegression EquationR2p-Values
Wuhan (January–March)Y = 897.06 − 73.24XTmin0.30<0.001
Beijing (June–July)Y = 142.10 − 3.32XTm − 0.87XRH + 1.65XMWS0.68<0.001
Urumqi (July–August)Y = -293.62 + 7.19XTmax + 2.94XRH0.27<0.05
Dalian (July–August)Y = 121.01 − 5.72XTmax + 6.72XTmin − 1.30XRH0.75<0.001
Table 5. Differences in meteorological factors between four cities during the period of community-based epidemic prevention and control, which was tested using one-way ANOVA. Definitions of Tmax, Tmin, DTR, Tm, RH, MWS and TP are presented in Figure 1. The different lowercase letters after the Mean values indicate a significant difference (p < 0.05) in meteorological factors among the four cities, whereas same lowercase letters show no significant differences (p > 0.05).
Meteorological FactorCitesStatistical Parameter
Wuhan (January–March)Beijing (June–July)Urumqi (July–August)Dalian (July–August)Fp-Value
Tmax (°C)15.52 ± 4.40c31.34 ± 2.57a29.67 ± 2.76a27.41 ± 1.90b144.39<0.001
Tmin (°C)6.47 ± 4.30c21.84 ± 1.87a19.95 ± 2.84b22.61 ± 0.83a173.34<0.001
DTR (°C)9.05 ± 4.15c9.50 ± 2.77b9.72 ± 2.45a4.80 ± 1.66d9.64<0.001
Tm (°C)10.87 ± 3.93d26.73 ± 2.01a24.83 ± 2.59b24.69 ± 1.24c193.43<0.001
RH (%)76.49 ± 8.82a54.91 ± 13.87b40.60 ± 9.34c79.67 ± 10.85a78.52<0.001
MWS (m·s−1)1.29 ± 0.97d6.41 ± 2.51a2.73 ± 0.72c3.08 ± 1.76b51.89<0.001
TP (mm)3.21 ± 6.96a1.13 ± 5.38a1.13 ± 3.23a2.25 ± 6.11a0.960.42
Publisher’s Note: MDPI stays neutral with regard to jurisdictional claims in published maps and institutional affiliations.

