
Are Vaccinations Alone Enough to Curb the Dynamics of the COVID-19 Pandemic in the European Union?


Department of Econometrics, University of Gdańsk, ul. Armii Krajowej 101, 81-824 Sopot, Poland
Econometrics 2022, 10(2), 25; https://doi.org/10.3390/econometrics10020025
Submission received: 28 February 2022
/
Revised: 25 April 2022
/
Accepted: 23 May 2022
/
Published: 26 May 2022
(This article belongs to the Special Issue Health Econometrics)
Abstract
:I use the data on the COVID-19 pandemic maintained by Our Word in Data to estimate a nonstationary dynamic panel exhibiting the dynamics of confirmed deaths, infections and vaccinations per million population in the European Union countries in the period of January–July 2021. Having the data aggregated on a weekly basis I demonstrate that a model which allows for heterogeneous short-run dynamics and common long-run marginal effects is superior to that allowing only for either homogeneous or heterogeneous responses. The analysis shows that the long-run marginal death effects with respect to confirmed infections and vaccinations are positive and negative, respectively, as expected. Since the estimate of the former effect compared to the latter one is about 71.67 times greater, only mass vaccinations can prevent the number of deaths from being large in the long-run. The success in achieving this is easier for countries with the estimated large negative individual death effect (Cyprus, Denmark, Ireland, Portugal, Estonia, Lithuania) than for those with the large but positive death effect (Bulgaria, Hungary, Slovakia). The speed of convergence to the long-run equilibrium relationship estimates for individual countries are all negative. For some countries (Bulgaria, Denmark, Estonia, Greece, Hungary, Slovakia) they differ in the magnitude from that averaged for the whole EU, while for others (Croatia, Ireland, Lithuania, Poland, Portugal, Romania, Spain), they do not.
1. Introduction
The COVID-19 pandemic painfully hit individuals and nations around the world. By the time of writing it had infected over 235 million people, out of which nearly 5 million had died from infection and related diseases (Worldometer 2021). In response to increasing viral transmission, governments have implemented many nonpharmaceutical interventions including the use of masks, social distancing, restrictions on movement, tests, contact tracking, quarantine, business and school closures, and country-wide lockdowns (Hale et al. 2021). Despite them, the intensity of the pandemic, as reflected in the number of confirmed infections and deaths, has alternately increased and decreased depending on the severity of restrictions, their extent, duration, and occasional mitigation, but still remains high, particularly in non-peripheral countries (Rossman et al. 2021). Even though the mass vaccinations started in early 2021 have elicited the immune response and reduced deaths in many high-income countries, the fourth wave of infection is either under way or is expected by this fall.1 Thus, the research into the dynamics of the pandemic and its causes remains of vital importance.
Most attempts in this regard undertaken to this point have been based on the epidemiological models matched to the COVID-19 data in which the trajectory of the pandemic is assumed to be caused by a mix of factors related to pathogen contagiousness, human behaviour and government intervention (Bhouri et al. 2021; Gumel et al. 2021; Liu et al. 2021; Moore et al. 2021; Musa et al. 2021; Shayak et al. 2021; Xu et al. 2021; Zhong 2021). Since the solution to these models hinges on an extensive set of parameters and initial conditions, predictions made on them lead to a wide spectra of outcomes ranging from sustained epidemics to near elimination (Saad-Roy et al. 2020).2 More interestingly, the performed simulations suggest that vaccinations alone are not enough to curb the current and the next waves of infection (Cot et al. 2021), especially in the presence of peoples’ resistance to vaccination (Burke et al. 2021; Kessels et al. 2021; Hyland et al. 2021; Mondal et al. 2021; Schmelz and Bowles 2021; Wang et al. 2021).
This paper aims to validate the above claim about the role of vaccinations in breaking the pandemic in the European Union countries on a purely empirical basis. In what follows, the dynamics of the pandemic is solely exhibited by variables related to the number of con-firmed deaths, infections and vaccinations. The data on those variables are extracted from the Data on COVID-19 (coronavirus) by Our World in Data, available at GitHub. They are then aggregated on a weekly basis to overcome the weekend effects and missing data points resulting from differences in the data collection systems at the country’s level. To circumvent the problem of epidemiological model choice and its calibration on the available data and include a large number of countries at the same time, the analysis is nested within an autoregressive distributive lag (ARDL) dynamic panel setup. Since the variables of interest are found to be nonstationary and cointegrated, a relevant error correction representation is estimated, as in Pesaran et al. (1999), by applying the mean group (MG), pooled mean group (PMG) and dynamic fixed effect (DFE) estimators, which enables us to infer about the long and the short-run nature of the pandemic. Next, based on the Hausman test, it is determined whether the long-run and the short-run death responses to the infections and vaccinations are country specific or not. Finally, the intensity of vaccinations to prevent the number of fatal cases from being large in the long-run is computed. To the best of the author’s knowledge, such a panel approach to modelling the COVID-19 pandemic dynamics is a new one.3
2. Model
Assume that the long-run ”deaths” function is
where , and stand for the number of confirmed new deaths, infections (cases) and vaccinations per million population, respectively, and are marginal death effects with respect to confirmed infections and vaccinations such that and , is a random error, and characterize the number of countries and time periods (weeks) in question. The ARDL(, , ) dynamic panel specification of (1) reads
where , and are coefficients pertaining the right hand side variables and is the country specific effect. In the case , and are integrated of order one variables and cointegrated making a stationary process for all , the relevant panel error correction representation becomes
where exhibits the speed of convergence to the long-run equilibrium relationship, , , , , , .
Equation (3) allows to address explicitly four research questions (RQ) about the nature of the COVID-19 pandemic and the role of vaccinations in breaking it in the European Union countries:
- RQ1—Is the pandemic dynamics homogeneous , for all ) or heterogeneous (, for at least some ?
- RQ2—Is the speed of convergence to the long-run equilibrium relationship the same in the whole EU ( for all ) or it is country specific ( for at least some )?
- RQ3—Whether the same applies to the long-run marginal death effects with respect to the number of new infections and vaccinations (equal marginal effects: , for all ; country specific marginal effects: , for at least some )?
- RQ4—What the intensity of vaccination shall be () to prevent the number of fatal cases from being large () in the case the number of infections reaches a level (?
Its estimation is performed in Stata 16 using xtpmg2 command, which enables the application of the MG, PMG and DFE estimators to nonstationary panels (Blackburne and Frank 2007). The PMG estimator constrains the long-run coefficients across all panels and averages their short-run panel counterparts, while the DFE estimator constrains all coefficients except for a country specific effect . If, however, the true model is heterogeneous, they both are inconsistent. The MG estimator which averages both the long-run and the short-run panel coefficients is consistent regardless of the model heterogeneity. Thus the choice of a proper model specification resulting in answering research questions RQ1–RQ3 is made upon the Hausman test in which the significance of a distance between the MG estimator and one of the PMG and DFE pair is tested for.
The estimation of Equation (3) is preceded by testing for the nature of variables of interest using the heteroskedasticity-robust panel unit-root tests suggested in Herwartz and Siedenburg (2008), Demetrescu and Hanck (2012), and Herwartz et al. (2019), as time-varying volatility may be a characteristic of the series exhibiting the pandemic. In case the panel unit-root null hypothesis is not rejected, the error-correction-based cointegration tests for panel data invented by Westerlund (2007) are applied (Persyn and Westerlund 2008). The lags , and are set upon the Akaike information criterion computed for the least restricted model given by Equation (3), i.e., the full MG model consisted from equations.
3. Results
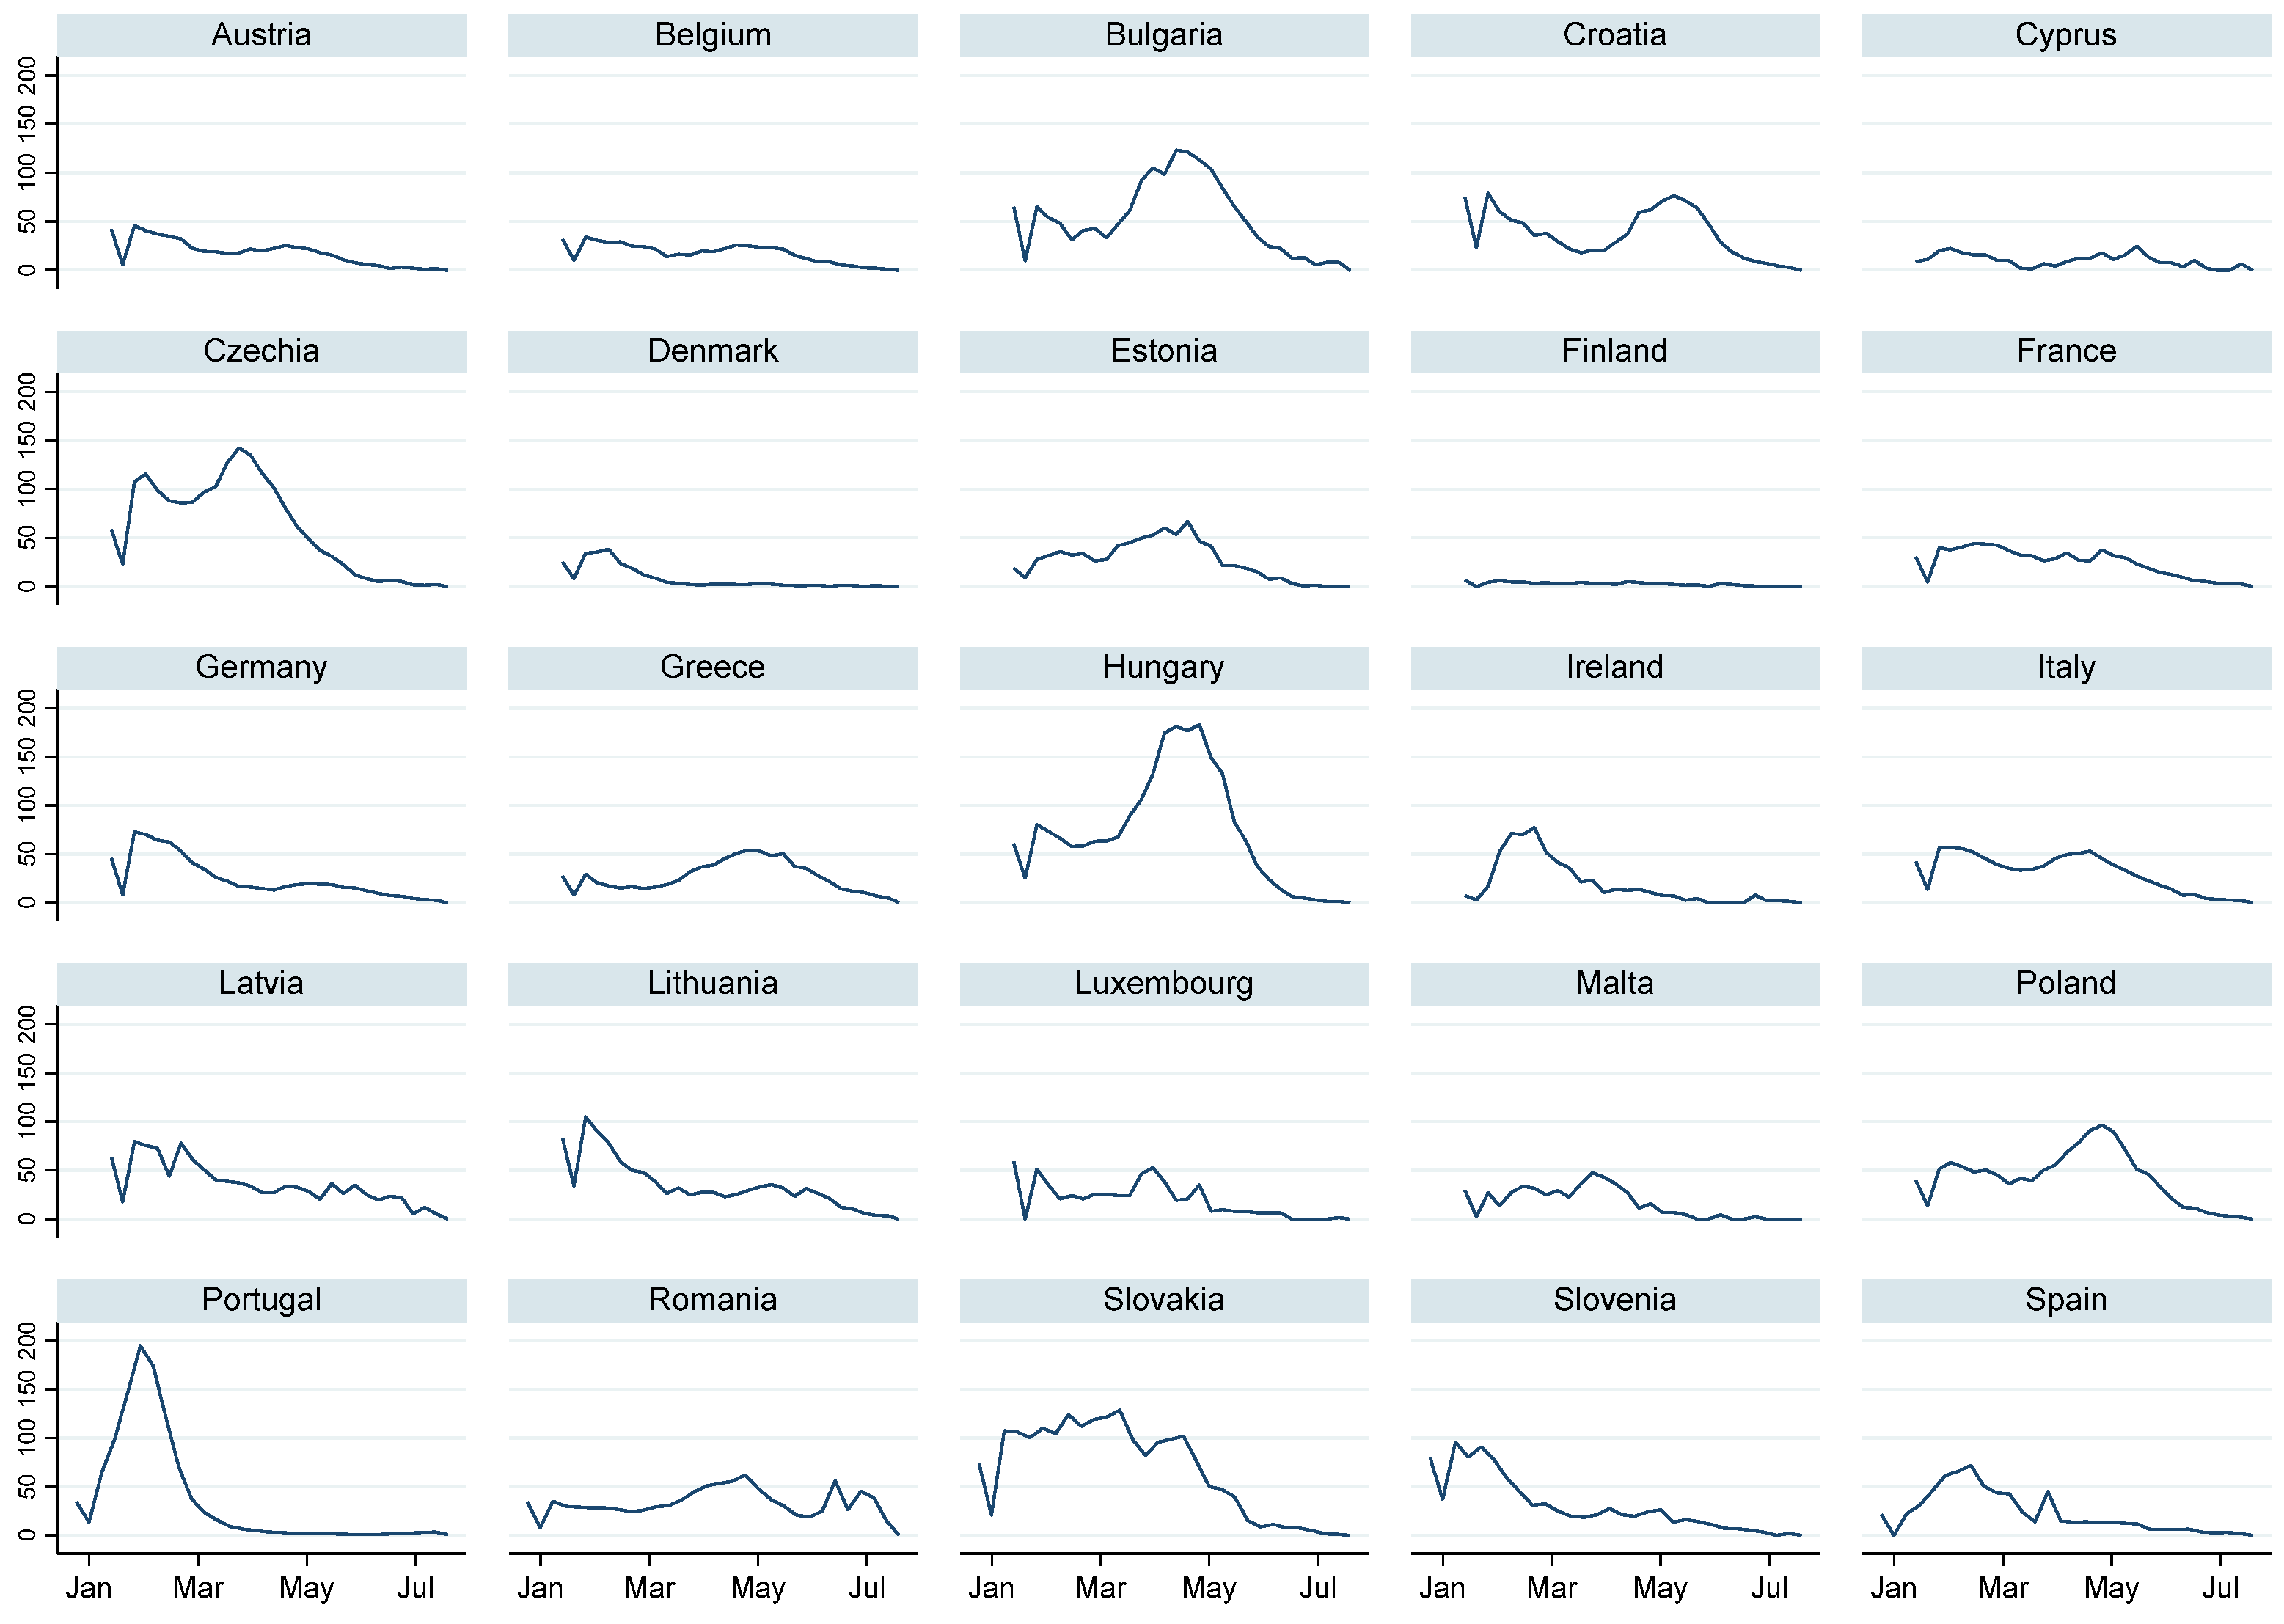
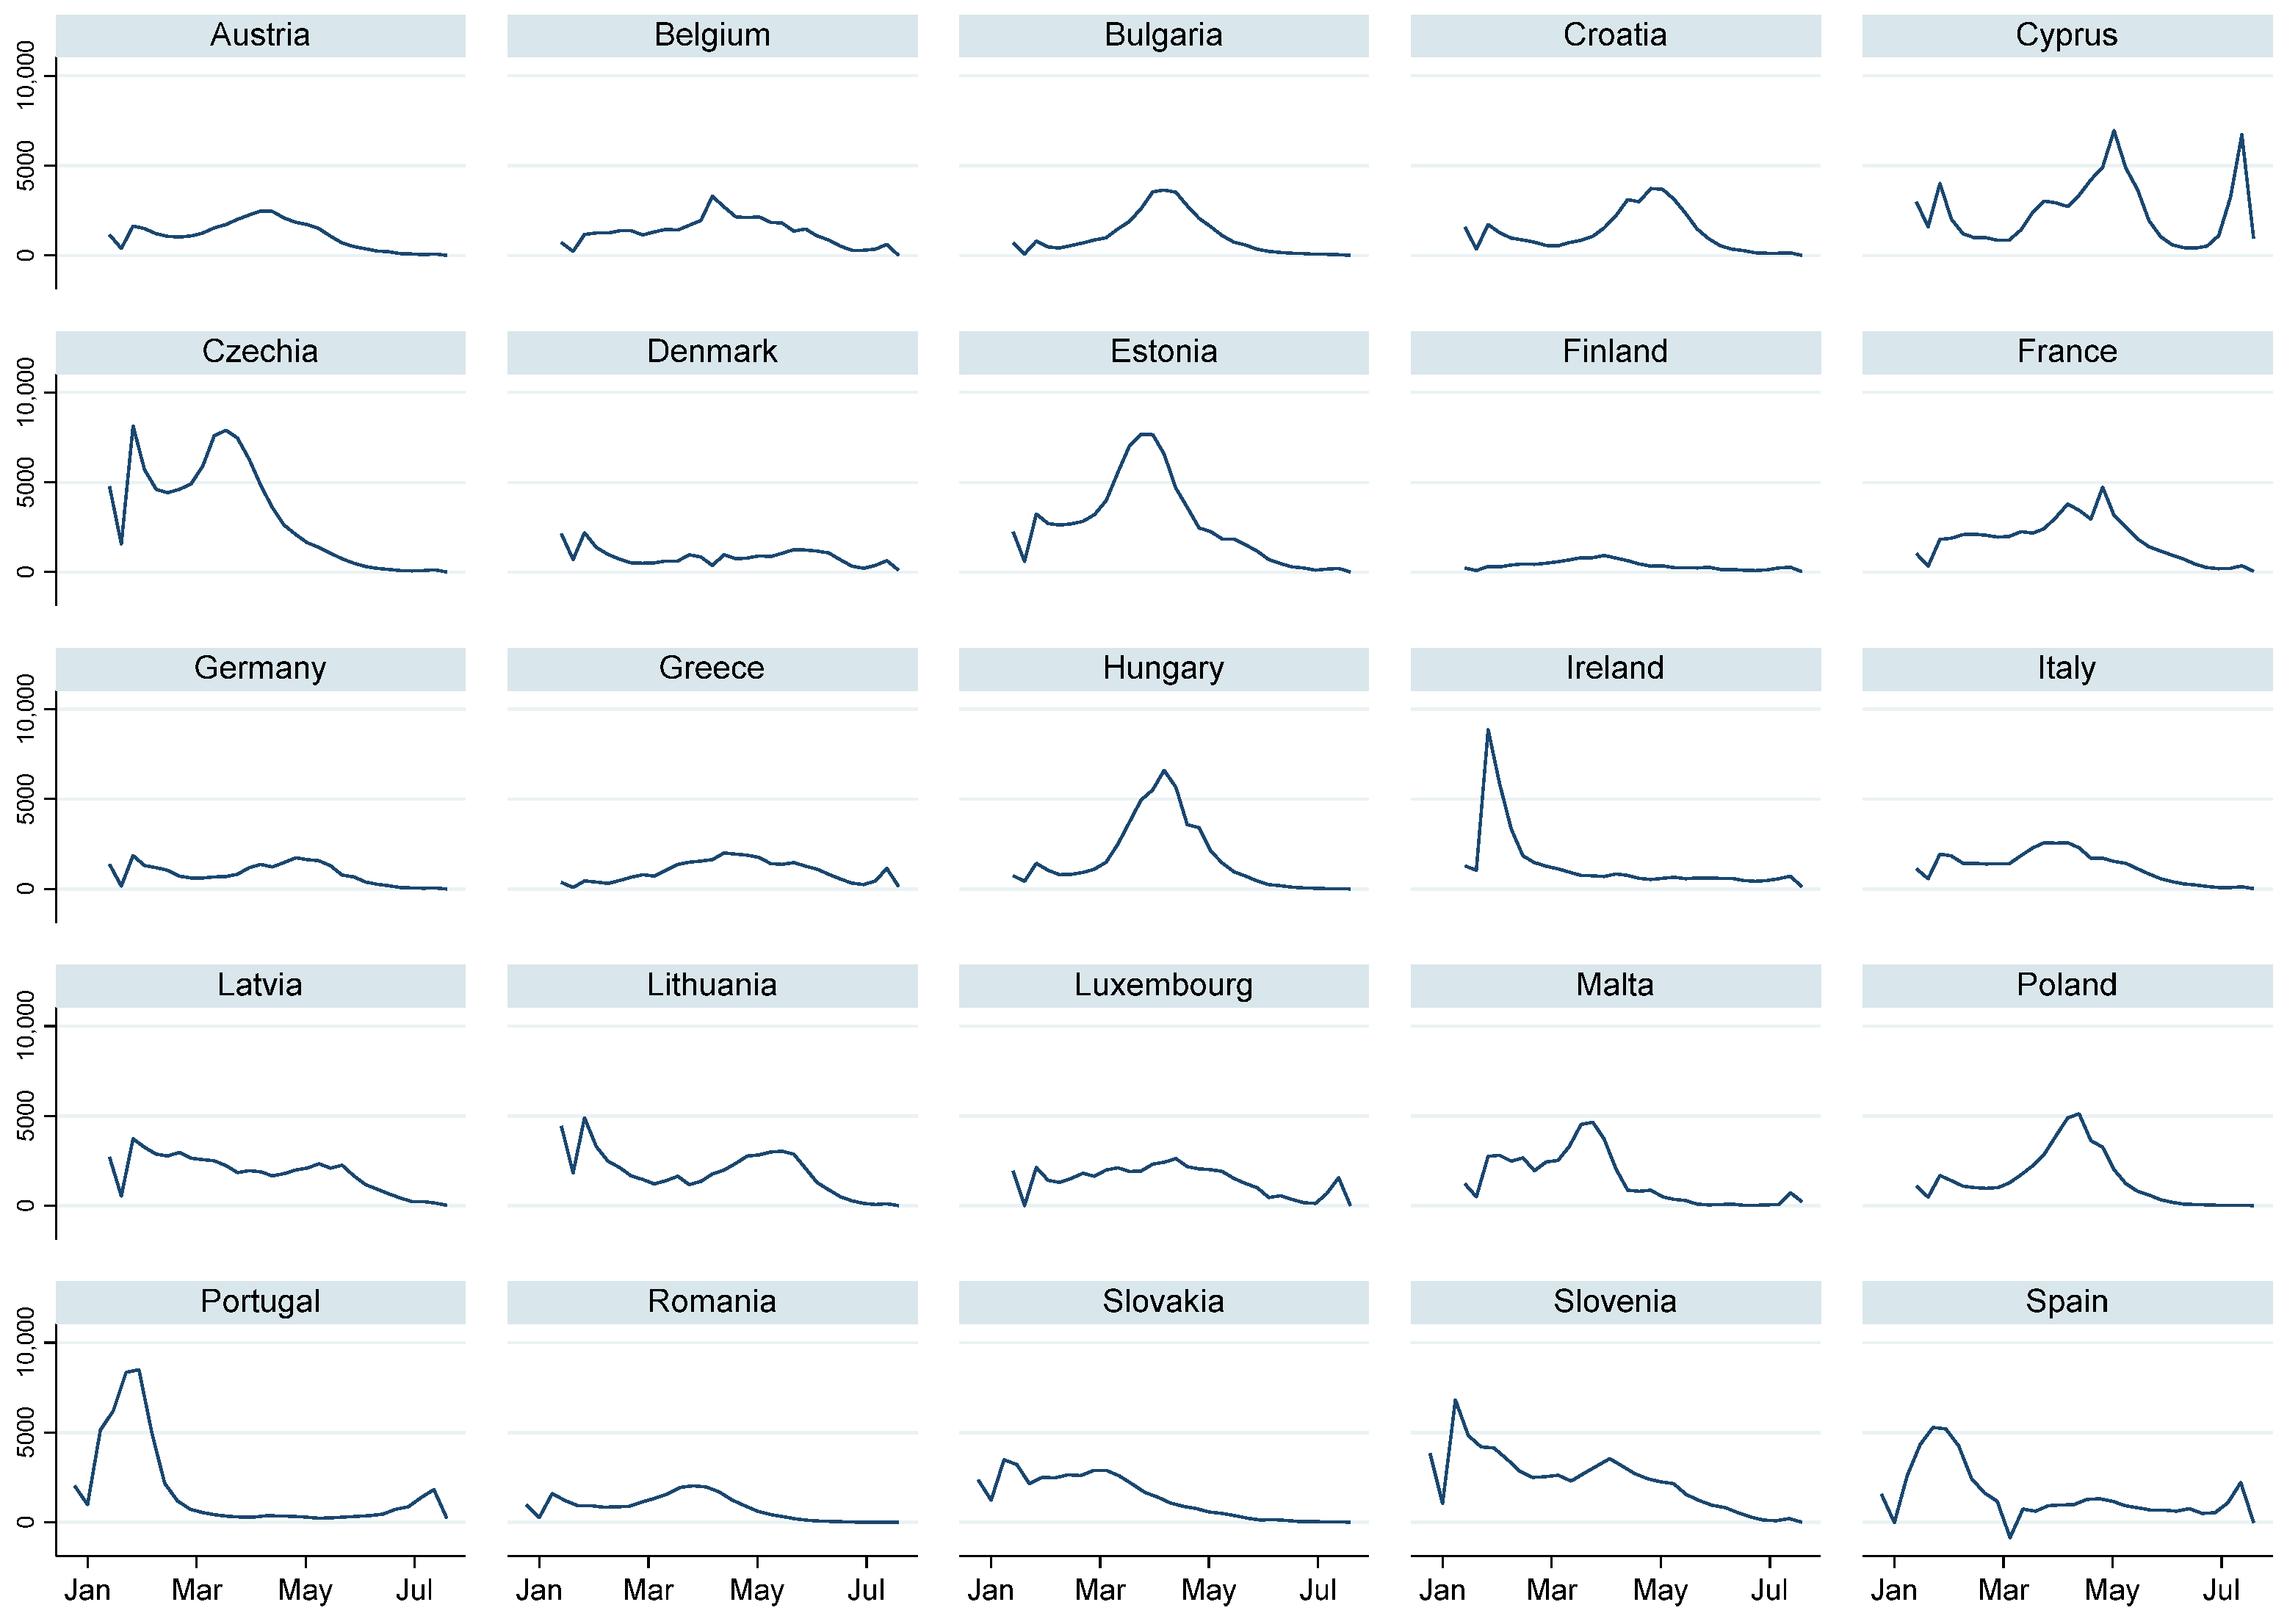
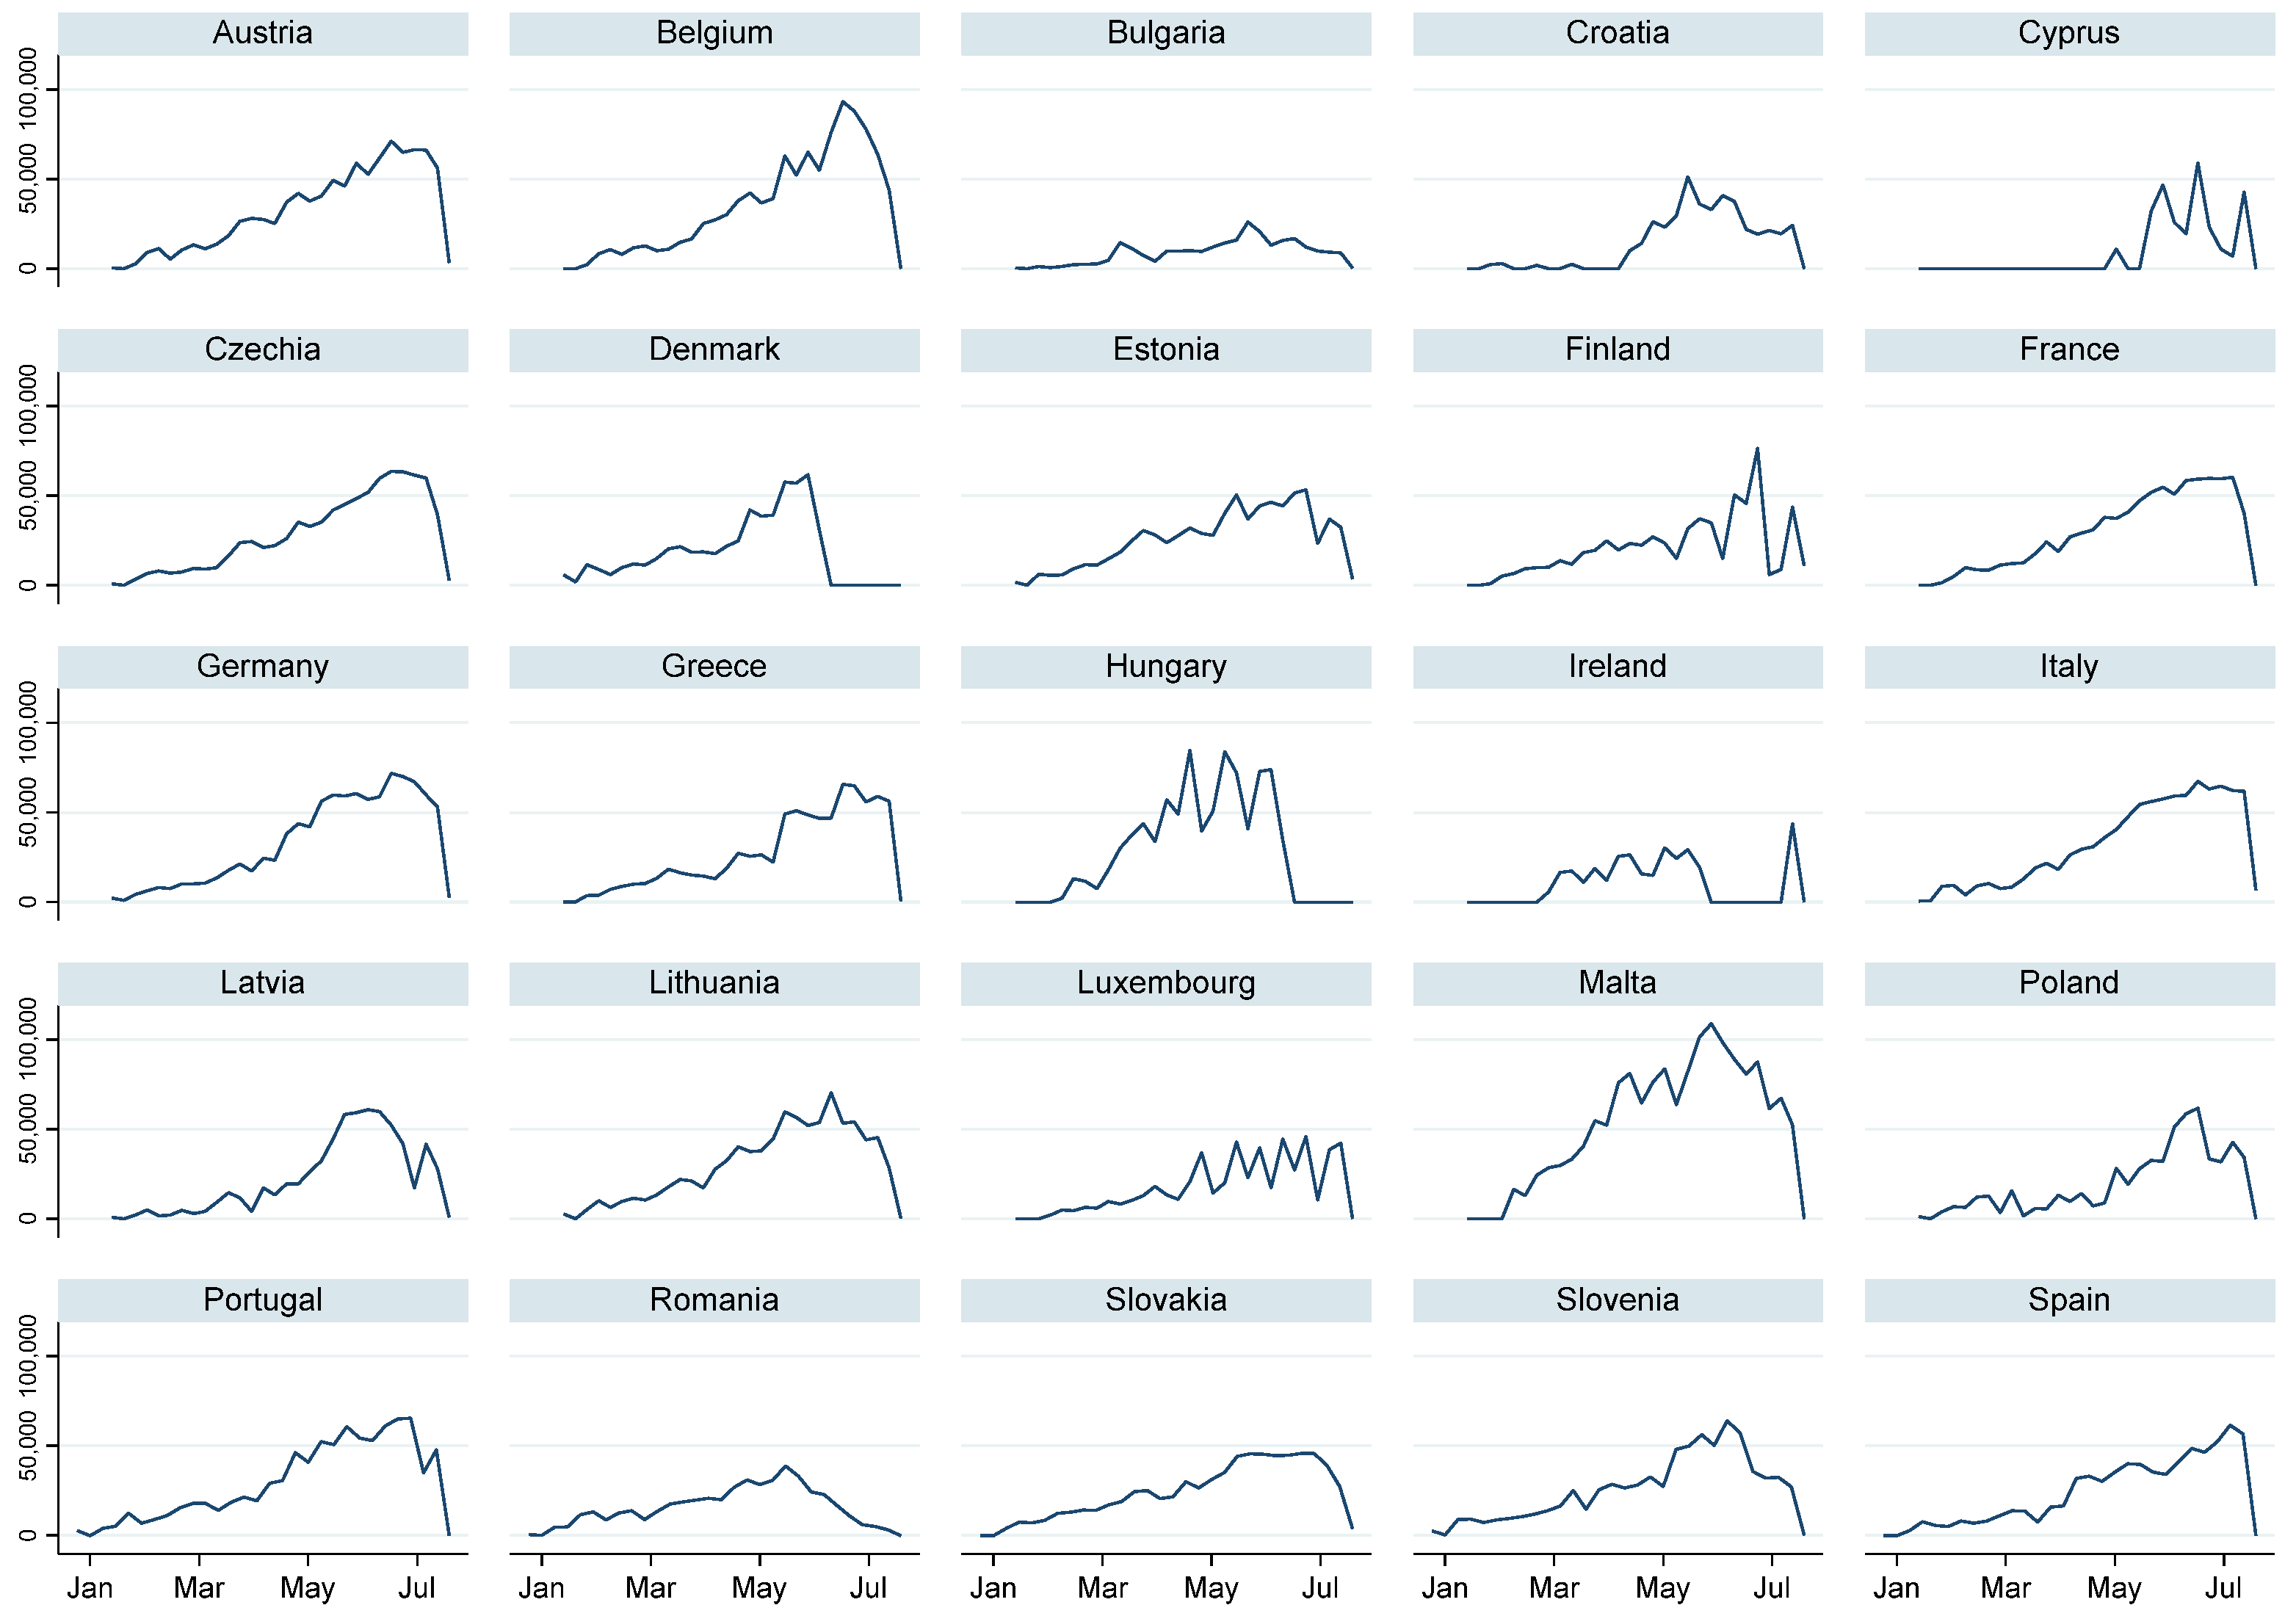
The series of weekly new deaths, infections and vaccinations per million population in the European Union countries, except for Sweden and the Netherlands, are depicted in Figure 1, Figure 2 and Figure 3.4 They cover the period 31 December 2020–11 July 2021. The first time point exhibits the week at which the vaccinations in many EU countries either begun or had been just initiated. With (number of countries) and (number of time points), each panel is strongly balanced. The visual inspection of the new deaths and infections series for particular countries shows that they peak at different time points as the consecutive waves of the pandemic have spread across the EU countries at a little different pace, partly due to the diversity of locally undertaken interventions. For many countries the new vaccinations series dramatically decrease at the end of the period in question exhibiting a halt and a failure of the intended mass vaccinations. Lastly, all three series rarely pass through their mean levels, indicating that they are very likely nonstationary.
The results of testing for non-stationarity of the new deaths, infections and vaccinations per million population series are gathered in Table 1. In two tests, namely those of Herwartz and Siedenburg (HS), and Demetrescu and Hanck (DH), the panel unit root null hypothesis of driftless random walk against the alternative hypothesis of a stationary process with individual specific intercept terms is tested for, while in the third one, that of Herwartz, Maxand and Walle (HMW), the same is done for the random walk with drift null against the trend stationarity alternative (Herwartz et al. 2018). Thus the tests are left-sided. Under the null of a panel unit root, each test statistic is asymptotically distributed as . The results for levels suggest that a panel unit root in , and cannot be rejected at 5% significance level. The results for the first differences, except for the HMW test, indicate its rejection. Consequently, all variables of interest may be treated as being .
Next, the tests of Westerlund (2007) are applied to , and to decide upon whether they are cointegrated and may be included in the error correction form given by Equation (3). In the first two out of four tests—the group mean tests (, )—the null hypothesis of no cointegration in all panels against the alternative of cointegration in at least one panel is tested for, while in the remaining two tests—the panel tests (, )—the same null is accompanied by the alternative of cointegration in all panels. In what follows, the bootstrapped versions of those tests are employed to account for any possible dependence between the cross-sectional units. The null of no cointegration is rejected if the calculated sample value of the relevant test statistic is smaller than the lower 5% quantile of its bootstrapped distribution. The results gathered in Table 2 indicate that the null of no cointegration of , and is to be rejected in favour of the alternative of cointegration in at least one panel as well as in all panels regardless of whether a constant is or is not included in the cointegration relationship.
The Akaike information criterion, when computed for the least restricted version of the panel error correction model given by Equation (3), consisted from equations, i.e., the MG version suggests the choice of and (see Table 3). Thus, the further inference on the dynamics of the COVID-19 pandemic is based on the ARDL(1, 2, 2) nonstationary panel.
The estimation results for the corresponding error correction form using the MG, PMG and DFE estimators are stacked in Table 4. The long-run marginal death effect with respect to the number of new infections is estimated at 0.0198, 0.0371 and 0.0228, while that with respect to the number of new vaccinations is , and , respectively. The signs of the first and the second effect are positive and negative, as expected. All effects are found different from zero to at least a 10% significance level. Out of all short run estimates, those for the coefficient exhibiting the speed of convergence to the long run equilibrium relationship differ the most. That obtained on the MG estimator ( is in absolute terms almost two and three times as large as those obtained on its DFE () and PMG () counterparts. The calculated Hausman statistic for the MG and PMG pair (, ) indicates that the PMG estimator, the efficient estimator under the null hypothesis, is preferred. When the same procedure is repeated for the MG and DFE pair, the result (, ) favours the MG estimator. Thus, the PMG model allowing for homogenous long-run and heterogenous short-run death responses to the infections and vaccinations is preferred over the MG and DFE models in which either both the long-run and the short-run responses are heterogeneous or so is a constant term exhibiting the country specific effect . The homogeneity of the long-run death effects with respect to the infections and vaccinations provides strong evidence of the commonality in the COVID-19 dynamics in the European Union (EU) countries regardless of the diversity of locally undertaken nonpharmaceutical interventions and the social responses to the restrictions.
Since the long-run marginal death effect with respect to confirmed infections () is in absolute terms about 71.62 times greater than that with respect to confirmed vaccinations (−0.000518), only mass vaccinations can prevent the number of deaths from being large in the long-run. Figures exhibiting the intensity of recommended vaccinations are given in Table 5. Particular entries show a minimal weekly number of new vaccinations per million population × 1000 in a EU country to keep the number of new deaths per million population at in the case where the number of new infections per million population reaches the level (. For instance, in the case of and , which for a 10-million population country indicates 100 weekly deaths and 50,000 infections, the weekly minimal number of vaccinations shall be 3,390,000 (10 × 339,000). If the weekly number of infections increases to 100,000 (), the weekly minimal number of vaccinations shall be 6,970,000 (10 × 697,000). In the same circumstances, the number of vaccinations for a country with a population of 25 million shall be 8,475,000 (25 × 339,000) and 17,425,000 (25 × 697,000), respectively.5 Since the vaccination of such large parts of the country’s population in the consecutive weeks given the limited resources of the health system is very unlikely, figures from Table 5 must be interpreted with care. Those from its upper rows give a more plausible explanation of the long-run dependence between the number of deaths and vaccinations suggesting that the mass vaccinations can curb the COVID-19 pandemic only when they are initiated before the infections climb to a high level. For instance, when the weekly number of new infections in a 10-million population country reaches 10,000 (), only as many as 520,000 people have to be vaccinated per week to keep the number of weekly deaths at 100 (). Such an intensity of vaccinations is fairly achievable.
Keeping the number of vaccinations at the recommended level may be easier for countries with a large negative individual death effect estimated from the full PMG model (Cyprus, Denmark, Ireland, Portugal, Estonia, Lithuania) than for those with a large but positive such effect (Bulgaria, Hungary, Slovakia). The required corrections for (, ) entries from Table 5, equal to , are given in Table 6. For instance, the correction in the number of vaccinations for the 1.3 million people in Estonia is , while the correction for the 10 million people of Hungary is 431,720 .
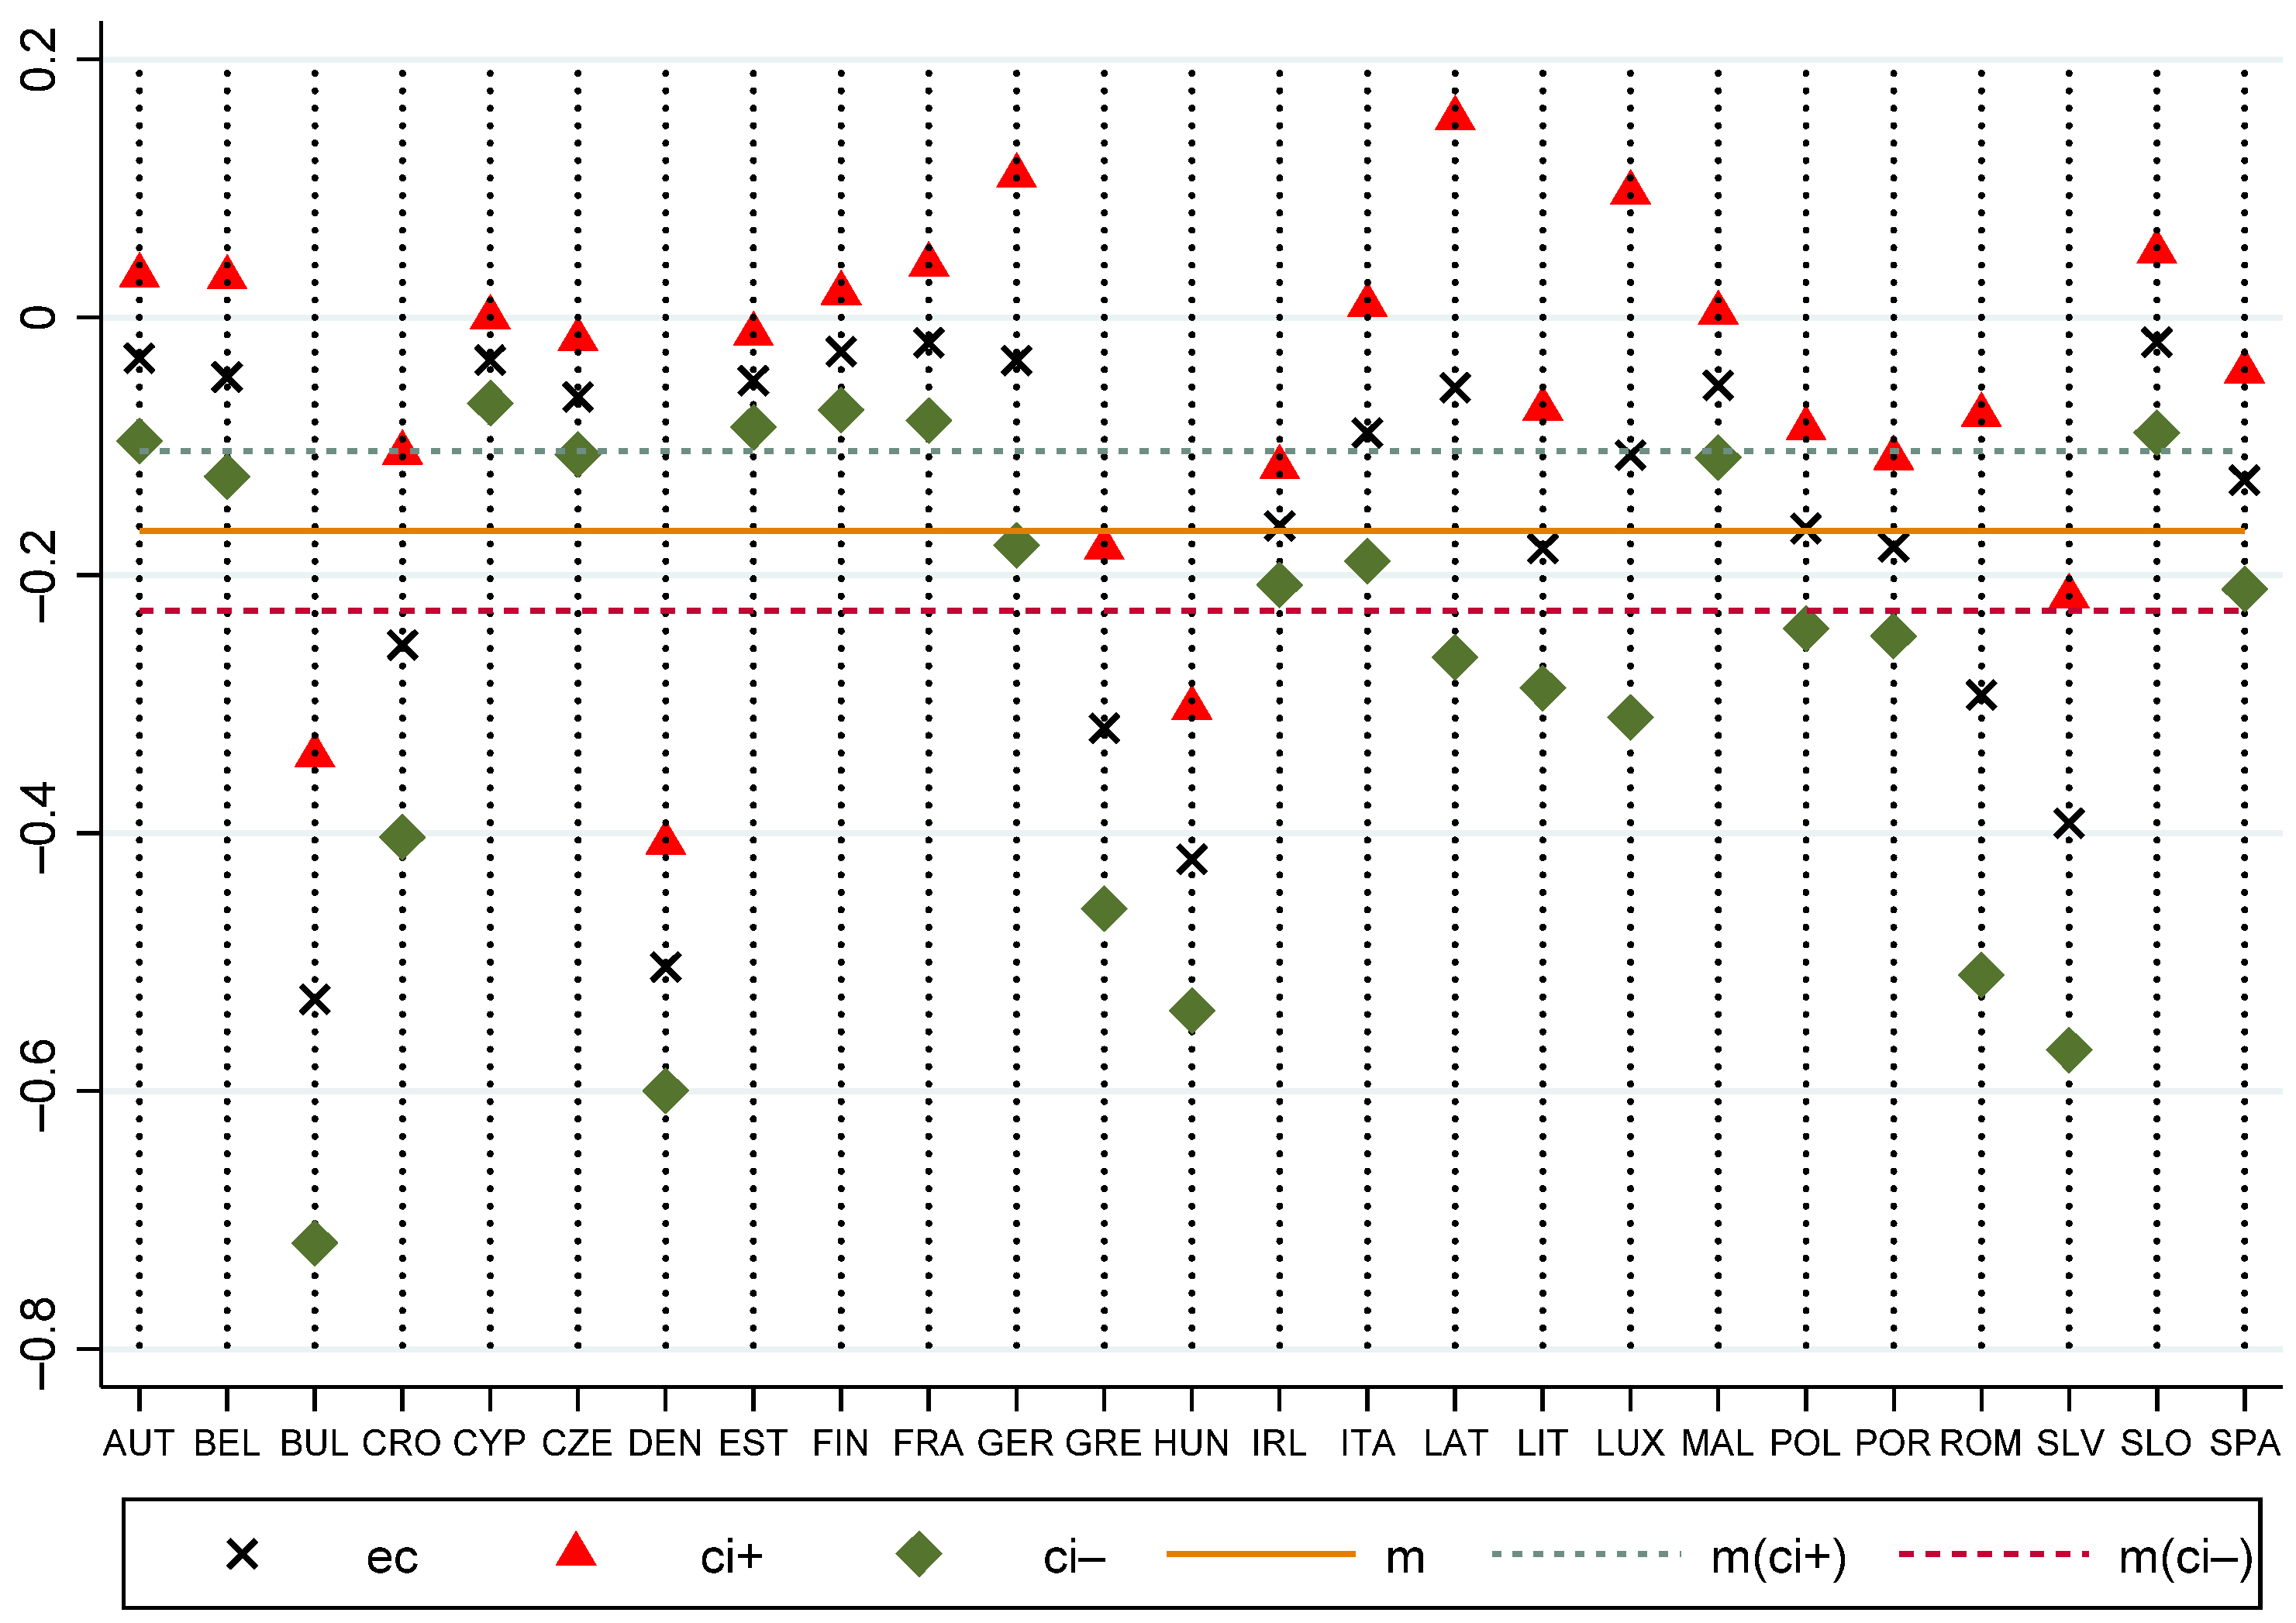
Although the long-run equilibrium relationship among the deaths, cases and vaccinations per million population is the same for all EU countries included in the sample, the speed of convergence to this pattern is country specific. The estimates of relevant convergence coefficients with 95% confidence intervals for the whole EU and its particular countries are depicted in Figure 4. The estimate of the convergence coefficient for the whole EU, , is marked with a dark orange horizontal line, while those for its upper, , and its lower bound, —have teal and cranberry dashed horizontal lines. The relevant estimates for particular EU countries are marked with the dark crosses (convergence coefficients), red triangles (upper confidence bands) and green diamonds (lower confidence bands). The visual inspection reveals that the speed of convergence estimates for individual countries are all negative. For some countries (Bulgaria, Denmark, Estonia, Greece, Hungary, Slovakia) they differ significantly in the magnitude from that averaged for the whole EU, while for others (Croatia, Ireland, Lithuania, Poland, Portugal, Romania, Spain) they do not. More interestingly, testing for the equality of coefficients exhibiting the speed of convergence to the long-run equilibrium relationship in particular EU countries using the Wald test shows that the null of their equality cannot be rejected for Austria, Germany, Belgium, Luxembourg, France, Italy and Spain (, , as well as for the Baltic States (Estonia, Latvia, Lithuania—, ). The same conclusion for the whole EU (, ), its old (Austria, Belgium, Cyprus, Denmark, Finland, France, Germany, Greece, Ireland, Italy, Luxembourg, Malta, Portugal, Spain—, and new member states (Bulgaria, Croatia, Czechia, Estonia, Hungary, Latvia, Lithuania, Poland, Romania, Slovakia, Slovenia—, ), and the Visegrad group (Czechia, Hungary, Poland, Slovakia—, ) does not apply, however.
In what has followed so far, nonpharmaceutical interventions, a potentially important factor to curb the dynamics of the COVID-19 pandemic, have been absent. For a robustness check, the right-hand side of Equation (1) was appended by the stringency index, , a composite measure of nine of the response metrics exhibiting the strictness of government policies (school closures, workplace closures, cancellation of public events, restrictions on public gatherings, closures of public transport, stay-at-home requirements, public information campaigns, restrictions on internal movements, international travel controls), and next the relevant model estimation and validation procedures were repeated with the ultimate goal being to determine the intensity of recommended vaccinations. The results of the heteroskedasticity-robust panel unit-root tests (HS, DH, HMW) showed that is integrated of order one.6 The results of three out of four error-correction-based cointegration tests (, , ) indicated that , , and did not cointegrate, so that the stringency index must not be included in the extended ”deaths” function given by Equation (1). What is more, feedback from the index to deaths was not found present in the case and its lags were included in the short-run part of the panel ARDL model given by Equation (3) regardless of its final specification and the employed estimation method (MG, PMG, DFE). On the other hand, since and alone were found to be cointegrated, a two variable panel error correction model may be suitable for testing for the direction of causality and assessing the effectiveness of interventions. The COVID-19 surveillance system may be of enough high quality for incoming information on the pandemic to be processed without delay into various restrictions. Checking that all, however, is left for future research.
4. Conclusions
In this paper I validated the claim that vaccinations alone would be hardly enough to curb the current and the next waves of the COVID-19 pandemic in the EU countries. Based on the panel exhibiting the weekly number of confirmed deaths, infections and vaccinations per million population in the period 31 December 2020–11 July 2021, I showed that the variables in question were integrated of order one and cointegrated, which allowed for the modelling of the COVID-19 pandemic dynamics within the ARDL nonstationary panel setup. Having estimated the relevant error correction form, I demonstrated that the PMG model allowing for homogenous long-run and heterogenous short-run death responses to the infections and vaccinations was superior over the MG and DFE models in which either both the long-run and the short-run responses were heterogeneous or so was a constant term exhibiting the country specific effect. The inclusion of the stringency index into the model to control for the nonpharmaceutical interventions was not supported by the data. That suggests that the long-run COVID-19 pandemic dynamics was the same across the EU countries no matter that they belonged to the Union’s core or its periphery, and presumably what type of interventions they undertook, as well as what the timing of interventions was. Since and alone were found cointegrated the last two conjectures, however, require further checking.
In particular, the analysis showed that the long-run marginal death effects with respect to confirmed infections and vaccinations were positive and negative, respectively, as expected. Since the estimate of the former effect compared to the latter one was found to be about 71.67 times greater, only the mass vaccinations could prevent the number of deaths from being large in the long-run provided they are initiated before the infections climb to a high level. The success in so achieving would be easier, if only possible, for countries with the estimated large negative individual death effect (Cyprus, Denmark, Ireland, Portugal, Estonia, Lithuania) than for those with the large but positive such effect (Bulgaria, Hungary, Slovakia). The speed of convergence to the long-run equilibrium relationship estimates for all countries was negative. For some of them (Bulgaria, Denmark, Estonia, Greece, Hungary, Slovakia), they differed in the magnitude from the average for the whole EU while for others (Croatia, Ireland, Lithuania, Poland, Portugal, Romania, Spain), they did not. More interestingly, for Austria, Germany, Belgium, Luxembourg, France, Italy and Spain, as well as for the Baltic States (Estonia, Latvia, Lithuania), the hypothesis stating that the convergence coefficients were equal could not be rejected, which allowed for the conjecture that the interventions undertaken in those countries in response to the growing number of active and critical cases, deaths, and the pessimistic hospital resource use projections were similar in type and equally effective.
Funding
This research received no external funding.
Institutional Review Board Statement
Not applicable.
Informed Consent Statement
Not applicable.
Data Availability Statement
The data were extracted from the Data on COVID-19 (coronavirus) by Our World in Data available at GitHub (https://github.com/owid/covid-19-data/blob/master/public/data/README.md, accessed on 12 July 2021).
Acknowledgments
I am grateful for valuable comments on earlier version of the paper from two anonymous referees.
Conflicts of Interest
The author declares no conflict of interest.
| 1 | The middle- and lower-income countries have a limited access to vaccine (da Fonseca et al. 2021; OECD 2021). |
| 2 | Fiscon et al. (2021) demonstrated that increasing the complexity of the models in order to find how the infection dynamics depended on specific factors was useless if not supported by a high-quality data used to calibrate them. |
| 3 | Post et al. (2021) used the panel approach to modelling the surveillance of the Second Wave of COVID-19 in Europe but as-summed that variables in question were stationary. |
| 4 | Sweden was excluded from the analysis due to a different from the remaining EU countries attitude to combating the COVID-19 pandemic. In the case of the Netherlands the exclusion resulted from missing data points in the number of daily new vac-cinations. |
| 5 | Please note that the averaged country specific effect in the PMG model is found insignificant at 5% level. |
| 6 | The results of that and the next procedures are available on request. |
References
- Bhouri, Mohamed A., Francisco S. Costabal, Hanwen Wang, Kevin Linka, Mathias Peirlinck, Ellen Kuhl, and Paris Perdikaris. 2021. COVID-19 dynamics across the US: A deep learning study of human mobility and social behavior. Computer Methods in Applied Mechanics and Engineering 382: 113891. [Google Scholar] [CrossRef]
- Blackburne, Edward F., III, and Mark W. Frank. 2007. Estimation of nonstationary heterogeneous panels. Stata Journal 7: 197–208. [Google Scholar] [CrossRef]
- Burke, Paul F., Daniel Masters, and Graham Massey. 2021. Enablers and barriers to COVID-19 vaccine uptake: An international study of perceptions and intentions. Vaccine 39: 5116–28. [Google Scholar] [CrossRef] [PubMed]
- Cot, Correntin, Giacomo Cacciapaglia, Anna Sigridur Islind, Maria Óskarsdóttir, and Francesco Sannino. 2021. Impact of US vaccination strategy on COVID-19 wave dynamics. Scientific Reports 11: 10960. [Google Scholar] [CrossRef]
- da Fonseca, Elize Massard, Kenneth C. Shadlen, and Francisco I. Bastos. 2021. The politics of COVID-19 vaccination in middle-income countries: Lessons from Brazil. Social Science & Medicine 281: 114093. [Google Scholar] [CrossRef]
- Demetrescu, Matei, and Christoph Hanck. 2012. A simple nonstationary-volatility robust panel unit root test. Economics Letters 117: 10–13. [Google Scholar] [CrossRef]
- Fiscon, Giulia, Francesco Salvadore, Valerio Guarrasi, Anna Rosa Garbuglia, and Paola Paci. 2021. Assessing the impact of data-driven limitations on tracing and forecasting the outbreak dynamics of COVID-19. Computers in Biology and Medicine 135: 104657. [Google Scholar] [CrossRef]
- Gumel, Abba B., Enahoro A. Iboi, Calistus N. Ngonghala, and Elamin H. Elbasha. 2021. A primer on using mathematics to understand COVID-19 dynamics: Modeling, analysis and simulations. Infectious Disease Modelling 6: 148–68. [Google Scholar] [CrossRef]
- Hale, Thomas, Jessica Anania, Noam Angrist, Thomas Boby, Emily Cameron-Blake, Martina Di Folco, Lucy Ellen, Rafael Goldszmidt, Laura Hallas, Beatriz Kira, and et al. 2021. Variation in government responses to COVID-19. Version 12.0. Blavatnik School of Government Working Paper. June 11. Available online: https://www.bsg.ox.ac.uk/sites/default/files/2021-06/BSG-WP-2020-032-v12_0.pdf (accessed on 20 July 2021).
- Herwartz, Helmut, and Florian Siedenburg. 2008. Homogenous panel unit root tests under cross sectional dependence: Finite sample modifications and the wild bootstrap. Computational Statistics and Data Analysis 53: 137–50. [Google Scholar] [CrossRef]
- Herwartz, Helmut, Simone Maxand, Fabian H. C. Raters, and Yabibal M. Walle. 2018. Panel unit-root tests for heteroskedastic panels. Stata Journal 18: 184–96. [Google Scholar] [CrossRef]
- Herwartz, Helmut, Simone Maxand, and Yabibal M. Walle. 2019. Heteroskedasticity-robust unit root testing for trending panels. Journal of Time Series Analysis 40: 649–64. [Google Scholar] [CrossRef]
- Hyland, Philip, Frédérique Vallières, Mark Shevlin, Richard P. Bentall, Ryan McKay, Todd K. Hartman, Orla McBride, and Jamie Murphy. 2021. Resistance to COVID-19 vaccination has increased in Ireland and the United Kingdom during the pandemic. Public Health 195: 54–56. [Google Scholar] [CrossRef] [PubMed]
- Kessels, Roselinde, Jeroen Luyten, and Sandy Tubeuf. 2021. Willingness to get vaccinated against COVID-19 and attitudes toward vaccination in general. Vaccine 39: 4716–22. [Google Scholar] [CrossRef]
- Liu, Yang, Julian W. Tang, and Tommy T. Y. Lam. 2021. Transmission dynamics of the COVID-19 epidemic in England. International Journal of Infectious Diseases 104: 132–38. [Google Scholar] [CrossRef] [PubMed]
- Mondal, Pritish, Ankita Sinharoy, and Lilly Su. 2021. Sociodemographic predictors of COVID-19 vaccine acceptance: A nationwide US-based survey study. Public Health 198: 252–59. [Google Scholar] [CrossRef]
- Moore, Sam, Edward M. Hill, Michael J. Tildesley, Louise Dyson, and Matt J. Keeling. 2021. Vaccination and nonpharmaceutical interventions for COVID-19: A mathematical modelling study. Lancet Infectious Diseases 21: 793–802. [Google Scholar] [CrossRef]
- Musa, Salihu Sabiu, Sania Qureshi, Shi Zhao, Abdullahi Yusuf, Umar Tasiu Mustapha, and Daihai He. 2021. Mathematical modeling of COVID-19 epidemic with effect of awareness programs. Infectious Disease Modelling 6: 448–60. [Google Scholar] [CrossRef]
- OECD. 2021. Access to COVID-19 Vaccines: Global Approaches in a Global Crisis. March 18. Available online: https://www.oecd.org/coronavirus/policy-responses/access-to-covid-19-vaccines-global-approaches-in-a-global-crisis-c6a18370/ (accessed on 20 July 2021).
- Persyn, Damiaan, and Joakim Westerlund. 2008. Error-correction–based cointegration tests for panel data. Stata Journal 8: 232–41. [Google Scholar] [CrossRef] [Green Version]
- Pesaran, M. Hashem, Yongcheol Shin, and Ron P. Smith. 1999. Pooled Mean Group Estimation of Dynamic Heterogeneous Panels. Journal of the American Statistical Association 94: 621–34. [Google Scholar] [CrossRef]
- Post, Lori, Kasen Culler, Charles B. Moss, Robert L. Murphy, Chad J. Achenbach, Michael G. Ison, Danielle Resnick, Lauren Nadya Singh, Janine White, Michael J. Boctor, and et al. 2021. Surveillance of the Second Wave of COVID-19 in Europe: Longitudinal Trend Analyses. JMIR Public Health and Surveillance 7: e25695. [Google Scholar] [CrossRef]
- Rossman, Hagai, Smadar Shilo, Tomer Meir, Malka Gorfine, Uri Shalit, and Eran Segal. 2021. COVID-19 dynamics after a national immunization program in Israel. Nature Medicine 27: 1055–61. [Google Scholar] [CrossRef] [PubMed]
- Saad-Roy, Chadi M., Caroline E. Wagner, Rachel E. Baker, Sinead E. Morris, Jeremy Farrar, Andrea L. Graham, Simon A. Levin, Michael J. Mina, C. Jessica E. Metcalf, and Bryan T. Grenfell. 2020. Immune life history, vaccination, and the dynamics of SARS-CoV-2 over the next 5 years. Science 370: 811–18. [Google Scholar] [CrossRef] [PubMed]
- Schmelz, Katrin, and Samuel Bowles. 2021. Overcoming COVID-19 vaccination resistance when alternative policies affect the dynamics of conformism, social norms, and crowding out. Proceedings of the National Academy of Sciences of the United States of America 118: e2104912118. [Google Scholar] [CrossRef] [PubMed]
- Shayak, B., Mohit M. Sharma, Manas Gaur, and Anand Kumar Mishra. 2021. Impact of reproduction number on the multiwave spreading dynamics of COVID-19 with temporary immunity: A mathematical model. International Journal of Infectious Diseases 104: 649–54. [Google Scholar] [CrossRef] [PubMed]
- Wang, Chao, Bingfeng Han, Tianshuo Zhao, Hanyu Liu, Bei Liu, Linyi Chen, Mingzhu Xie, Jiang Liu, Hui Zheng, Sihui Zhang, and et al. 2021. Vaccination willingness, vaccine hesitancy, and estimated coverage at the first round of COVID-19 vaccination in China: A national crosssectional study. Vaccine 39: 2833–42. [Google Scholar] [CrossRef]
- Westerlund, Joakim. 2007. Testing for error correction in panel data. Oxford Bulletin of Economics and Statistics 69: 709–48. [Google Scholar] [CrossRef] [Green Version]
- Worldometer. 2021. COVID-19 Coronavirus Pandemic. Available online: https://www.worldometers.info/coronavirus/ (accessed on 20 October 2021).
- Xu, Zhe, Bo Wu, and Ufuk Topcu. 2021. Control strategies for COVID-19 epidemic with vaccination, shield immunity and quarantine: A metric temporal logic approach. PLoS ONE 16: e0247660. [Google Scholar] [CrossRef]
- Zhong, Ling. 2021. A dynamic pandemic model evaluating reopening strategies amid COVID-19. PLoS ONE 16: e0248302. Available online: https://journals.plos.org/plosone/article?id=10.1371/journal.pone.0248302 (accessed on 20 October 2021). [CrossRef]
Figure 1.
Weekly new deaths per million population in the EU countries.

Figure 2.
Weekly new cases per million population in the EU countries.

Figure 3.
Weekly new vaccinations per million population in the EU countries.

Figure 4.
Estimates of the convergence coefficients with 95% confidence intervals.


Table 1.
Results of the heteroskedasticity-robust panel unit-root tests.
| Variable | Test | |||||
|---|---|---|---|---|---|---|
| HS | DH | HMW | ||||
| 2.2015 | 0.9862 | 1.8514 | 0.9679 | 4.9722 | 1.0000 | |
| −0.4447 | 0.3283 | 0.7841 | 0.7835 | 0.9002 | 0.8160 | |
| −1.2598 | 0.1039 | −0.4875 | 0.3129 | 1.8952 | 0.9710 | |
| −2.8223 | 0.0024 | −2.4767 | 0.0066 | −0.4312 | 0.3332 | |
| −1.8154 | 0.0347 | −2.1283 | 0.0167 | −1.5431 | 0.0614 | |
| −1.7507 | 0.0400 | −2.2255 | 0.0130 | −1.0741 | 0.1414 |
Table 2.
Results of the Westerlund tests for panel cointegration.
| Variable | Group Mean Tests | Panel Tests | ||||||
|---|---|---|---|---|---|---|---|---|
| a | a | a | a | |||||
| No constant in the cointegration relationship | ||||||||
| −3.097 | 0.000 | −10.699 | 0.000 | −14.915 | 0.000 | −9.259 | 0.000 | |
| With constant in the cointegration relationship | ||||||||
| −2.514 | 0.000 | −9.474 | 0.040 | −12.198 | 0.000 | −9.168 | 0.010 | |
a The p-values are for a one-sided test based on the bootstrapped distribution with 100 bootstrap replications.
Table 3.
Estimates of the Akaike information criterion for the full MG model given by Equation (3).
| AIC | AIC | AIC | ||||||
|---|---|---|---|---|---|---|---|---|
| 1, 0, 0 | 5132.936 | 100 | 1, 2, 0 | 4686.905 | 150 | 2, 1, 0 | 4708.890 | 150 |
| 1, 0, 1 | 5142.862 | 125 | 1, 2, 1 | 4647.197 | 175 | 2, 1, 1 | 4683.162 | 175 |
| 1, 1, 0 | 5009.580 | 125 | 1, 2, 2 | 4641.517 | 200 | 2, 1, 2 | 4696.016 | 200 |
| 1, 1, 1 | 5020.774 | 150 | 2, 0, 0 | 4773.425 | 125 | 2, 2, 1 | 4649.488 | 200 |
| 1, 1, 2 | 4741.771 | 175 | 2, 0, 1 | 4749.394 | 150 | 2, 2, 2 | 4644.836 | 225 |
Table 4.
Estimation results for Equation (3).
| Regressor | Estimator | ||
|---|---|---|---|
| MG | PMG | DFE | |
| Long-run | |||
| 0.0198 *** | 0.0371 *** | 0.0228 *** | |
| (4.78) | (23.48) | (6.19) | |
| −0.000368 ** | −0.000518 *** | −0.000266 * | |
| (−3.81) | (−10.58) | (−2.16) | |
| Short-run | |||
| −0.4914 *** | −0.1657 *** | −0.275 *** | |
| (−8.72) | (−5.24) | (−7.49) | |
| 0.002 | 0.00603 *** | 0.00179 | |
| (1.00) | (3.58) | (0.95) | |
| −0.00572 *** | −0.00462 *** | −0.00205 * | |
| (−5.14) | (−3.81) | (−2.32) | |
| 0.000133 * | 0.0000202 | 0.0000227 | |
| (2.10) | (0.63) | (0.61) | |
| 0.0000526 | −0.0000182 | 0.0000135 | |
| (1.11) | (−0.38) | (0.47) | |
| const. | 5.024 * | −0.165 | 0.426 |
| (1.98) | (−0.20) | (0.19) | |
Figures in brackets under the parameter estimates refer to statistics; * (**, ***)—significant at 10% (5%, 1%) level.
Table 5.
Figures exhibiting the intensity of recommended vaccinations, .
| Infections | ||||||||||||
|---|---|---|---|---|---|---|---|---|---|---|---|---|
| 1 | 2 | 5 | 10 | 20 | 30 | 40 | 50 | 100 | 150 | 200 | 250 | |
| 20 | ||||||||||||
| 50 | 2 | |||||||||||
| 100 | 5 | 3 | ||||||||||
| 200 | 12 | 10 | 5 | |||||||||
| 500 | 36 | 32 | 26 | 17 | 3 | |||||||
| 1000 | 72 | 68 | 62 | 52 | 33 | 14 | ||||||
| 2000 | 143 | 139 | 134 | 124 | 105 | 85 | 66 | 47 | ||||
| 5000 | 358 | 354 | 348 | 339 | 319 | 300 | 281 | 262 | 165 | 69 | ||
| 10,000 | 716 | 712 | 707 | 697 | 678 | 658 | 639 | 620 | 523 | 427 | 330 | 234 |
| 20,000 | 1432 | 1429 | 1423 | 1413 | 1394 | 1374 | 1355 | 1336 | 1239 | 1143 | 1046 | 950 |
| 50,000 | 3581 | 3577 | 3571 | 3562 | 3542 | 3523 | 3504 | 3484 | 3388 | 3291 | 3195 | 3098 |
Table 6.
Corrections for the intensity of recommended vaccinations, .
| Country | Estimate | Correction | |
|---|---|---|---|
| Bulgaria | 8.2068 | 0.5288 | 29,961 |
| Cyprus | −2.7628 | 0.0332 | −160,650 |
| Denmark | −7.0520 | 0.5036 | −27,033 |
| Estonia | −3.2903 | 0.0490 | −129,631 |
| Hungary | 9.3993 | 0.4203 | 43,172 |
| Ireland | −3.9769 | 0.1618 | −47,450 |
| Lithuania | −3.1295 | 0.1792 | −33,714 |
| Portugal | −2.5767 | 0.1781 | −27,930 |
| Slovakia | 11.5474 | 0.3922 | 56,839 |
Publisher’s Note: MDPI stays neutral with regard to jurisdictional claims in published maps and institutional affiliations. |
© 2022 by the author. Licensee MDPI, Basel, Switzerland. This article is an open access article distributed under the terms and conditions of the Creative Commons Attribution (CC BY) license (https://creativecommons.org/licenses/by/4.0/).
Share and Cite
MDPI and ACS Style
Miłobędzki, P. Are Vaccinations Alone Enough to Curb the Dynamics of the COVID-19 Pandemic in the European Union? Econometrics 2022, 10, 25. https://doi.org/10.3390/econometrics10020025
AMA Style
Miłobędzki P. Are Vaccinations Alone Enough to Curb the Dynamics of the COVID-19 Pandemic in the European Union? Econometrics. 2022; 10(2):25. https://doi.org/10.3390/econometrics10020025
Chicago/Turabian StyleMiłobędzki, Paweł. 2022. "Are Vaccinations Alone Enough to Curb the Dynamics of the COVID-19 Pandemic in the European Union?" Econometrics 10, no. 2: 25. https://doi.org/10.3390/econometrics10020025
Note that from the first issue of 2016, this journal uses article numbers instead of page numbers. See further details here.