
Evolution of CT Findings and Lung Residue in Patients with COVID-19 Pneumonia: Quantitative Analysis of the Disease with a Computer Automatic Tool

 , , ,
, , ,
Abstract
:1. Introduction
2. Methods
2.1. Patient Characteristics
2.2. CT Technique
2.3. CT Post Processing
2.4. Statistical Analysis
3. Results
4. Discussion
5. Conclusions
Author Contributions
Funding
Institutional Review Board Statement
Informed Consent Statement
Data Availability Statement
Conflicts of Interest
References
- World Health Organization. Naming the Coronavirus Disease (COVID-2019) and the Virus that Causes It. Available online: www.who.int/emergencies/diseases/ (accessed on 21 March 2020).
- Wuhan Coronavirus (2019-nCoV) Global Cases (by Johns Hopkins CSSE). Case Dashboard. Available online: https://gisanddata.maps.arcgis.com/apps/opsdashboard/index.html#/bda7594740fd40299423467b48e9ecf6 (accessed on 21 March 2020).
- Xu, Y.-H.; Dong, J.-H.; An, W.-M.; Lv, X.-Y.; Yin, X.-P.; Zhang, J.-Z.; Dong, L.; Ma, X.; Zhang, H.-J.; Gao, B.-L. Clinical and computed tomographic imaging features of novel coronavirus pneumonia caused by SARS-CoV-2. J. Infect. 2020, 80, 394–400. [Google Scholar] [CrossRef] [Green Version]
- Yang, W.; Cao, Q.; Qin, L.; Wang, X.; Cheng, Z.; Pan, A.; Dai, J.; Sun, Q.; Zhao, F.; Qu, J.; et al. Clinical characteristics and imaging manifestations of the 2019 novel coronavirus disease (COVID-19): A multi-center study in Wenzhou city, Zhejiang, China. J. Infect. 2020, 80, 388–393. [Google Scholar] [CrossRef] [Green Version]
- Pan, F.; Ye, T.; Sun, P.; Gui, S.; Liang, B.; Li, L.; Zheng, D.; Wang, J.; Hesketh, R.L.; Yang, L.; et al. Time course of lung changes on chest CT during recovery from 2019 novel coronavirus (COVID-19) pneumonia. Radiology 2020, 295, 715–721. [Google Scholar] [CrossRef] [Green Version]
- Shi, H.; Han, X.; Jiang, N.; Cao, Y.; Alwalid, O.; Gu, J.; Fan, Y.; Zheng, C. Radiological findings from 81 patients with COVID-19 pneumonia in Wuhan, China: A descriptive study. Lancet Infect. Dis. 2020, 20, 425–434. [Google Scholar] [CrossRef]
- Yoon, S.H.; Lee, K.H.; Kim, J.Y.; Lee, Y.K.; Ko, H.; Kim, K.H.; Park, K.M.; Kim, Y.-H. Chest radiographic and CT findings of the 2019 novel coronavirus disease (COVID-19): Analysis of nine patients treated in Korea. Korean J. Radiol. 2020, 21, 1144173. [Google Scholar] [CrossRef]
- Agostini, A.; Floridi, C.; Borgheresi, A.; Badaloni, M.; Pirani, P.E.; Terilli, F.; Ottaviani, L.; Giovagnoni, A. Proposal of a low-dose, long-pitch, dual-source chest CT protocol on third-generation dual-source CT using a tin filter for spectral shaping at 100 kVp for CoronaVirus Disease 2019 (COVID-19) patients: A feasibility study. Radiol. Med. 2020, 125, 365–373. [Google Scholar] [CrossRef] [PubMed] [Green Version]
- Borghesi, A.; Maroldi, R. COVID-19 outbreak in Italy: Experimental chest X-ray scoring system for quantifying and monitoring disease progression. Radiol. Med. 2020, 125, 509–513. [Google Scholar] [CrossRef] [PubMed]
- Fichera, G.; Stramare, R.; De Conti, G.; Motta, R.; Giraudo, C. It’s not over until it’s over: The chame-leonic behavior of COVID-19 over a six-day period. Radiol. Med. 2020, 125, 514–516. [Google Scholar] [CrossRef] [PubMed]
- Gaia, C.; Chiara, C.M.; Silvia, L.; Chiara, A.; Luisa, D.C.M.; Giulia, B.; Silvia, P.; Lucia, C.; Alessandra, T.; Annarita, S.; et al. Chest CT for early detection and management of coronavirus disease (COVID-19): A report of 314 patients admitted to Emergency Department with suspected pneumonia. Radiol. Med. 2020, 125, 931–942. [Google Scholar] [CrossRef] [PubMed]
- Giannitto, C.; Sposta, F.M.; Repici, A.; Vatteroni, G.; Casiraghi, E.; Casari, E.; Ferraroli, G.M.; Fugazza, A.; Sandri, M.T.; Chiti, A.; et al. Chest CT in patients with a moderate or high pretest probability of COVID-19 and negative swab. Radiol. Med. 2020, 125, 1260–1270. [Google Scholar] [CrossRef]
- Ierardi, A.M.; Wood, B.J.; Arrichiello, A.; Bottino, N.; Bracchi, L.; Forzenigo, L.; Andrisani, M.C.; Vespro, V.; Bonelli, C.; Amalou, A.; et al. Preparation of a radiology department in an Italian hospital dedicated to COVID-19 patients. Radiol. Med. 2020, 125, 894–901. [Google Scholar] [CrossRef] [PubMed]
- Cappabianca, S.; Fusco, R.; de Lisio, A.; Paura, C.; Clemente, A.; Gagliardi, G.; Lombardi, G.; Giacobbe, G.; Russo, G.M.; Belfiore, M.P.; et al. Correction to: Clinical and laboratory data, radiological structured report findings and quantitative evaluation of lung involvement on baseline chest CT in COVID-19 patients to predict prognosis. Radiol. Med. 2021, 126, 643. [Google Scholar] [CrossRef]
- Huang, C.; Wang, Y.; Li, X.; Ren, L.; Zhao, J.; Hu, Y.; Zhang, P.L.; Fan, G.; Xu, J.; Gu, X.; et al. Clinical features of patients infected with 2019 novel coronavirus in Wuhan, China. Lancet 2020, 15, 497–506. [Google Scholar] [CrossRef] [Green Version]
- Lei, J.; Li, J.; Li, X.; Qi, X. CT Imaging of the 2019 Novel Coronavirus (2019-nCoV) Pneumonia. Radiology 2020, 295, 18. [Google Scholar] [CrossRef] [PubMed] [Green Version]
- Belfiore, M.P.; Urraro, F.; Grassi, R.; Giacobbe, G.; Patelli, G.; Cappabianca, S.; Reginelli, A. Artificial intelligence to codify lung CT in Covid-19 patients. Radiol. Med. 2020, 125, 500–504. [Google Scholar] [CrossRef] [PubMed]
- Neri, E.; Miele, V.; Coppola, F.; Grassi, R. Use of CT and artificial intelligence in suspected or COVID-19 positive patients: Statement of the Italian Society of Medical and Interventional Radiology. Radiol. Med. 2020, 125, 505–508. [Google Scholar] [CrossRef]
- Laghi, A.; Grassi, R. Italian Radiology’s Response to the COVID-19 Outbreak. J. Am. Coll. Radiol. 2020, 17, 699–700. [Google Scholar] [CrossRef] [PubMed]
- Neri, E.; Coppola, F.; Miele, V.; Bibbolino, C.; Grassi, R. Artificial intelligence: Who is responsible for the diagnosis? Radiol. Med. 2020, 31. [Google Scholar] [CrossRef] [Green Version]
- Li, L.; Qin, L.; Xu, Z.; Yin, Y.; Wang, X.; Kong, B.; Bai, J.; Lu, Y.; Fang, Z.; Song, Q.; et al. Artificial Intelligence Distinguishes COVID-19 from Community Acquired Pneumonia on Chest CT. Radiology 2020, 19, 200905. [Google Scholar] [CrossRef]
- Tárnok, A. Machine Learning, COVID-19 (2019-nCoV), and multi-OMICS. Cytometry A 2020, 97, 215–216. [Google Scholar] [CrossRef] [PubMed]
- Gozes, O.; Frid-Adar, M.; Greenspan, H.; Browning, P.; Zhang, H.; Ji, W.; Bernheim, A.; Siegel, E. Rapid AI Development Cycle for the Coronavirus (COVID-19) Pandemic: Initial Results for Automated Detection & Patient Monitoring using Deep Learning CT Image Analysis. arXiv 2020, arXiv:2003.05037. [Google Scholar]
- Wang, Z.; Gu, S.; Leader, J.K.; Kundu, S.; Tedrow, J.R.; Sciurba, F.; Gur, D.; Siegfried, J.M.; Pu, J. Optimal threshold in CT quantification of emphysema. Eur. Radiol. 2013, 23, 975–984. [Google Scholar] [CrossRef] [PubMed] [Green Version]
- Gattinoni, L.; Caironi, P.; Cressoni, M.; Chiumello, D.; Ranieri, V.M.; Quiten, M.; Russo, S.; Patroniti, N.; Cornejo, R.; Bugedo, G. Lung recruitment in patients with the acute espiratory distress syndrome. N. Engl. J. Med. 2006, 354, 1775–1786. [Google Scholar] [CrossRef]
- Ohkubom, H.; Kanemitsu, Y.; Uemura, T.; Takakuwa, O.; Takemura, M.; Maeno, K.; Ito, Y.; Ogury, T.; Kazawa, N.; Mikami, R.; et al. Normal Lung Quanti-fication in Usual Interstitial Pneumonia Pattern: The Impact of Threshold-based Volumetric CT Analysis for the Staging of Idiopathic Pulmonary Fibrosis. PLoS ONE 2016, 11, e0152505. [Google Scholar]
- Çinkooğlu, A.; Bayraktaroğlu, S.; Savaş, R. Lung Changes on Chest CT During 2019 Novel Coronavirus (COVID-19) Pneumonia. Eur. J. Breast Health 2020, 16, 89–90. [Google Scholar] [CrossRef] [PubMed]
- Albarello, F.; Pianura, E.; Di Stefano, F.; Cristofaro, M.; Petrone, A.; Marchioni, L.; Palazzolo, C.; Schinina, J.; Nicastri, E.; Petrosillo, N.; et al. COVID 19 INMI Study Group. 2019-novel Coronavirus severe adult respiratory distress syndrome in two cases in Italy: An un-common radiological presentation. Int. J. Infect. Dis. 2020, 93, 192–197. [Google Scholar] [CrossRef]
- Rorat, M.; Jurek, T.; Simon, K.; Guziński, M. Value of quantitative analysis in lung computed tomography in patients severely ill with COVID-19. PLoS ONE 2021, 16, e0251946. [Google Scholar] [CrossRef] [PubMed]
- Grassi, R.; Cappabianca, S.; Urraro, F.; Feragalli, B.; Montanelli, A.; Patelli, G.; Granata, V.; Giacobbe, G.; Russo, G.M.; Grillo, A.; et al. Chest CT Computerized Aided Quantification of PNEUMONIA Lesions in COVID-19 Infection: A Comparison among Three Commercial Software. Int. J. Environ. Res. Public Health 2020, 17, 6914. [Google Scholar] [CrossRef]
- Allam, Z.; Jones, D.S. On the Coronavirus (COVID-19) Outbreak and the Smart City Network: Universal Data Sharing Standards Coupled with Artificial Intelligence (AI) to Benefit Urban Health Monitoring and Management. Healthcare 2020, 8, 46. [Google Scholar] [CrossRef] [PubMed] [Green Version]
- Meng, Y.; Liu, C.L.; Cai, Q.; Shen, Y.Y.; Chen, S.Q. Contrast analysis of the relationship between the HRCT sign and new pathologic classification in small ground glass nodule-like lung adenocarcinoma. Radiol. Med. 2019, 124, 8–13. [Google Scholar] [CrossRef]
- Hoesein, M.F.A.; de Hoop, B.; Zanen, P.; Gietema, H.; Kruitwagen, C.L.; van Ginneken, B.; Isgum, I.; Mol, C.; van Klaveren, R.J.; Dijkstra, A.E.; et al. CT-quantified emphysema in male heavy smokers: Association with lung function decline. Thorax 2011, 66, 782–787. [Google Scholar] [CrossRef] [Green Version]
- Maldonado, F.; Moua, T.; Rajagopalan, S.; Karwoski, R.A.; Raghunath, S.; Decker, P.A.; Hartman, T.E.; Bartholmai, B.J.; Robb, R.A.; Ryu, J.H. Automated quantification of radiological patterns predicts survival in idiopathic pulmonary fibrosis. Eur. Respir. J. 2014, 43, 204–212. [Google Scholar] [CrossRef] [PubMed] [Green Version]
- Yang, R.; Li, X.; Liu, H.; Zhen, Y.; Zhang, X.; Xiong, Q.; Luo, Y.; Gao, C.; Zeng, W. Chest CT Severity Score: An Imaging Tool for Assessing Severe COVID-19. Radiol. Cardiothorac. Imaging 2020, 2, e200047. [Google Scholar] [CrossRef] [Green Version]
- Zhou, S.; Zhu, T.; Wang, Y.; Xia, L. Imaging features and evolution on CT in 100 COVID-19 pneumonia patients in Wuhan, China. Eur. Radiol. 2020, 30, 5446–5454. [Google Scholar] [CrossRef]
- Carotti, M.; Salaffi, F.; Sarzi-Puttini, P.; Agostini, A.; Borgheresi, A.; Minorati, D.; Galli, M.; Marotto, D.; Giovagnoni, A. Chest CT features of coronavirus disease 2019 (COVID-19) pneumonia: Key points for radiologists. Radiol. Med. 2020, 125, 636–646. [Google Scholar] [CrossRef]
- Shaw, B.; Daskareh, M.; Gholamrezanezhad, A. The lingering manifestations of COVID-19 during and after convalescence: Update on long-term pulmonary consequences of coronavirus disease 2019 (COVID-19). Radiol. Med. 2021, 126, 40–46. [Google Scholar] [CrossRef] [PubMed]
- Di Serafino, M.; Notaro, M.; Rea, G.; Iacobellis, F.; Paoli, D.V.; Acampora, C.; Ianniello, S.; Brunese, L.; Romano, L.; Vallone, G. The lung ultrasound: Facts or artifacts? In the era of COVID-19 outbreak. Radiol. Med. 2020, 125, 738–753. [Google Scholar] [CrossRef] [PubMed]
- Cozzi, D.; Albanesi, M.; Cavigli, E.; Moroni, C.; Bindi, A.; Luvarà, S.; Lucarini, S.; Busoni, S.; Mazzoni, L.N.; Miele, V. Chest X-ray in new Coronavirus Disease 2019 (COVID-19) infection: Findings and correlation with clinical outcome. Radiol. Med. 2020, 125, 730–737. [Google Scholar] [CrossRef]
- Pediconi, F.; Galati, F.; Bernardi, D.; Belli, P.; Brancato, B.; Calabrese, M.; Camera, L.; Carbonaro, L.A.; Caumo, F.; Clauser, P.; et al. Breast imaging and cancer diagnosis during the COVID-19 pandemic: Recommendations from the Italian College of Breast Radiologists by SIRM. Radiol. Med. 2020, 125, 926–930. [Google Scholar] [CrossRef] [PubMed]
- Borghesi, A.; Zigliani, A.; Masciullo, R.; Golemi, S.; Maculotti, P.; Farina, D.; Maroldi, R. Radiographic severity index in COVID-19 pneumonia: Relationship to age and sex in 783 Italian patients. Radiol. Med. 2020, 125, 461–464. [Google Scholar] [CrossRef]
- Gatti, M.; Calandri, M.; Barba, M.; Biondo, A.; Geninatti, C.; Gentile, S.; Greco, M.; Morrone, V.; Piatti, C.; Santonocito, A.; et al. Baseline chest X-ray in coronavirus disease 19 (COVID-19) patients: Association with clinical and laboratory data. Radiol. Med. 2020, 125, 1271–1279. [Google Scholar] [CrossRef]
- Caruso, D.; Polici, M.; Zerunian, M.; Pucciarelli, F.; Polidori, T.; Guido, G.; Rucci, C.; Bracci, B.; Muscogiuri, E.; De Dominicis, C.; et al. Quantitative Chest CT analysis in discriminating COVID-19 from non-COVID-19 patients. Radiol. Med. 2021, 126, 243–249. [Google Scholar] [CrossRef]
- Grassi, R.; Belfiore, M.P.; Montanelli, A.; Patelli, G.; Urraro, F.; Giacobbe, G.; Fusco, R.; Granata, V.; Petrillo, A.; Sacco, P.; et al. COVID-19 pneumonia: Computer-aided quantification of healthy lung parenchyma, emphysema, ground glass and consolidation on chest computed tomography (CT). Radiol. Med. 2021, 126, 553–560. [Google Scholar] [CrossRef] [PubMed]
- Grassi, R.; Fusco, R.; Belfiore, M.P.; Montanelli, A.; Patelli, G.; Urraro, F.; Petrillo, A.; Granata, V.; Sacco, P.; Mazzei, M.A.; et al. Coronavirus disease 2019 (COVID-19) in Italy: Features on chest computed tomography using a structured report system. Sci. Rep. 2020, 10, 17236. [Google Scholar] [CrossRef] [PubMed]
- Reginelli, A.; Grassi, R.; Feragalli, B.; Belfiore, M.; Montanelli, A.; Patelli, G.; La Porta, M.; Urraro, F.; Fusco, R.; Granata, V.; et al. Coronavirus Disease 2019 (COVID-19) in Italy: Double Reading of Chest CT Examination. Biology 2021, 10, 89. [Google Scholar] [CrossRef]
- Granata, V.; Fusco, R.; Izzo, F.; Setola, S.V.; Coppola, M.; Grassi, R.; Reginelli, A.; Cappabianca, S.; Petrillo, A. COVID-19 infection in cancer patients: The management in a diagnostic unit. Radiol. Oncol. 2021, 55, 121–129. [Google Scholar] [CrossRef]
- Granata, V.; Fusco, R.; Setola, S.; Galdiero, R.; Picone, C.; Izzo, F.; D’Aniello, R.; Miele, V.; Grassi, R.; Grassi, R.; et al. Lymphadenopathy after BNT162b2 COVID-19 Vaccine: Preliminary Ultrasound Findings. Biology 2021, 10, 214. [Google Scholar] [CrossRef]
- Wang, Y.; Dong, C.; Hu, Y.; Li, C.; Ren, Q.; Zhang, X.; Shi, H.; Zhou, M. Temporal Changes of CT Findings in 90 Patients with COVID-19 Pneumonia: A Longitudinal Study. Radiology 2020, 296, E55–E64. [Google Scholar] [CrossRef] [PubMed] [Green Version]
- Maio, F.; Tari, D.U.; Granata, V.; Fusco, R.; Grassi, R.; Petrillo, A.; Pinto, F. Breast Cancer Screening during COVID-19 Emergency: Patients and Department Management in a Local Experience. J. Pers. Med. 2021, 11, 380. [Google Scholar] [CrossRef] [PubMed]
- Li, J.; Yu, X.; Hu, S.; Lin, Z.; Xiong, N.; Gao, Y. COVID-19 targets the right lung. Crit. Care 2020, 24, 339. [Google Scholar] [CrossRef] [PubMed]
- Nagra, D.; Russell, M.; Yates, M.; Galloway, J.; Barker, R.; Desai, S.R.; Norton, S. COVID-19: Opacification score is higher in the right lung and right lung involvement is a better predictor of ICU admission. Eur. Respir. J. 2020, 56, 2002340. [Google Scholar] [CrossRef] [PubMed]


| H. PAR. R (%) | H. PAR. L (%) | TOTAL H. PAR. (%) | GGO R (%) | GGO L (%) | TOTAL GGO (%) | OTHER R (%) | OTHER L (%) | TOTAL OTHER (%) | CONSOL. R (%) | CONSOL. L (%) | TOTAL CONSOLID. (%) | TOTAL LUNG VOL. R (%) | TOTAL LUNG VOL. L (%) | TOTAL LUNG VOL (%) | ||
|---|---|---|---|---|---|---|---|---|---|---|---|---|---|---|---|---|
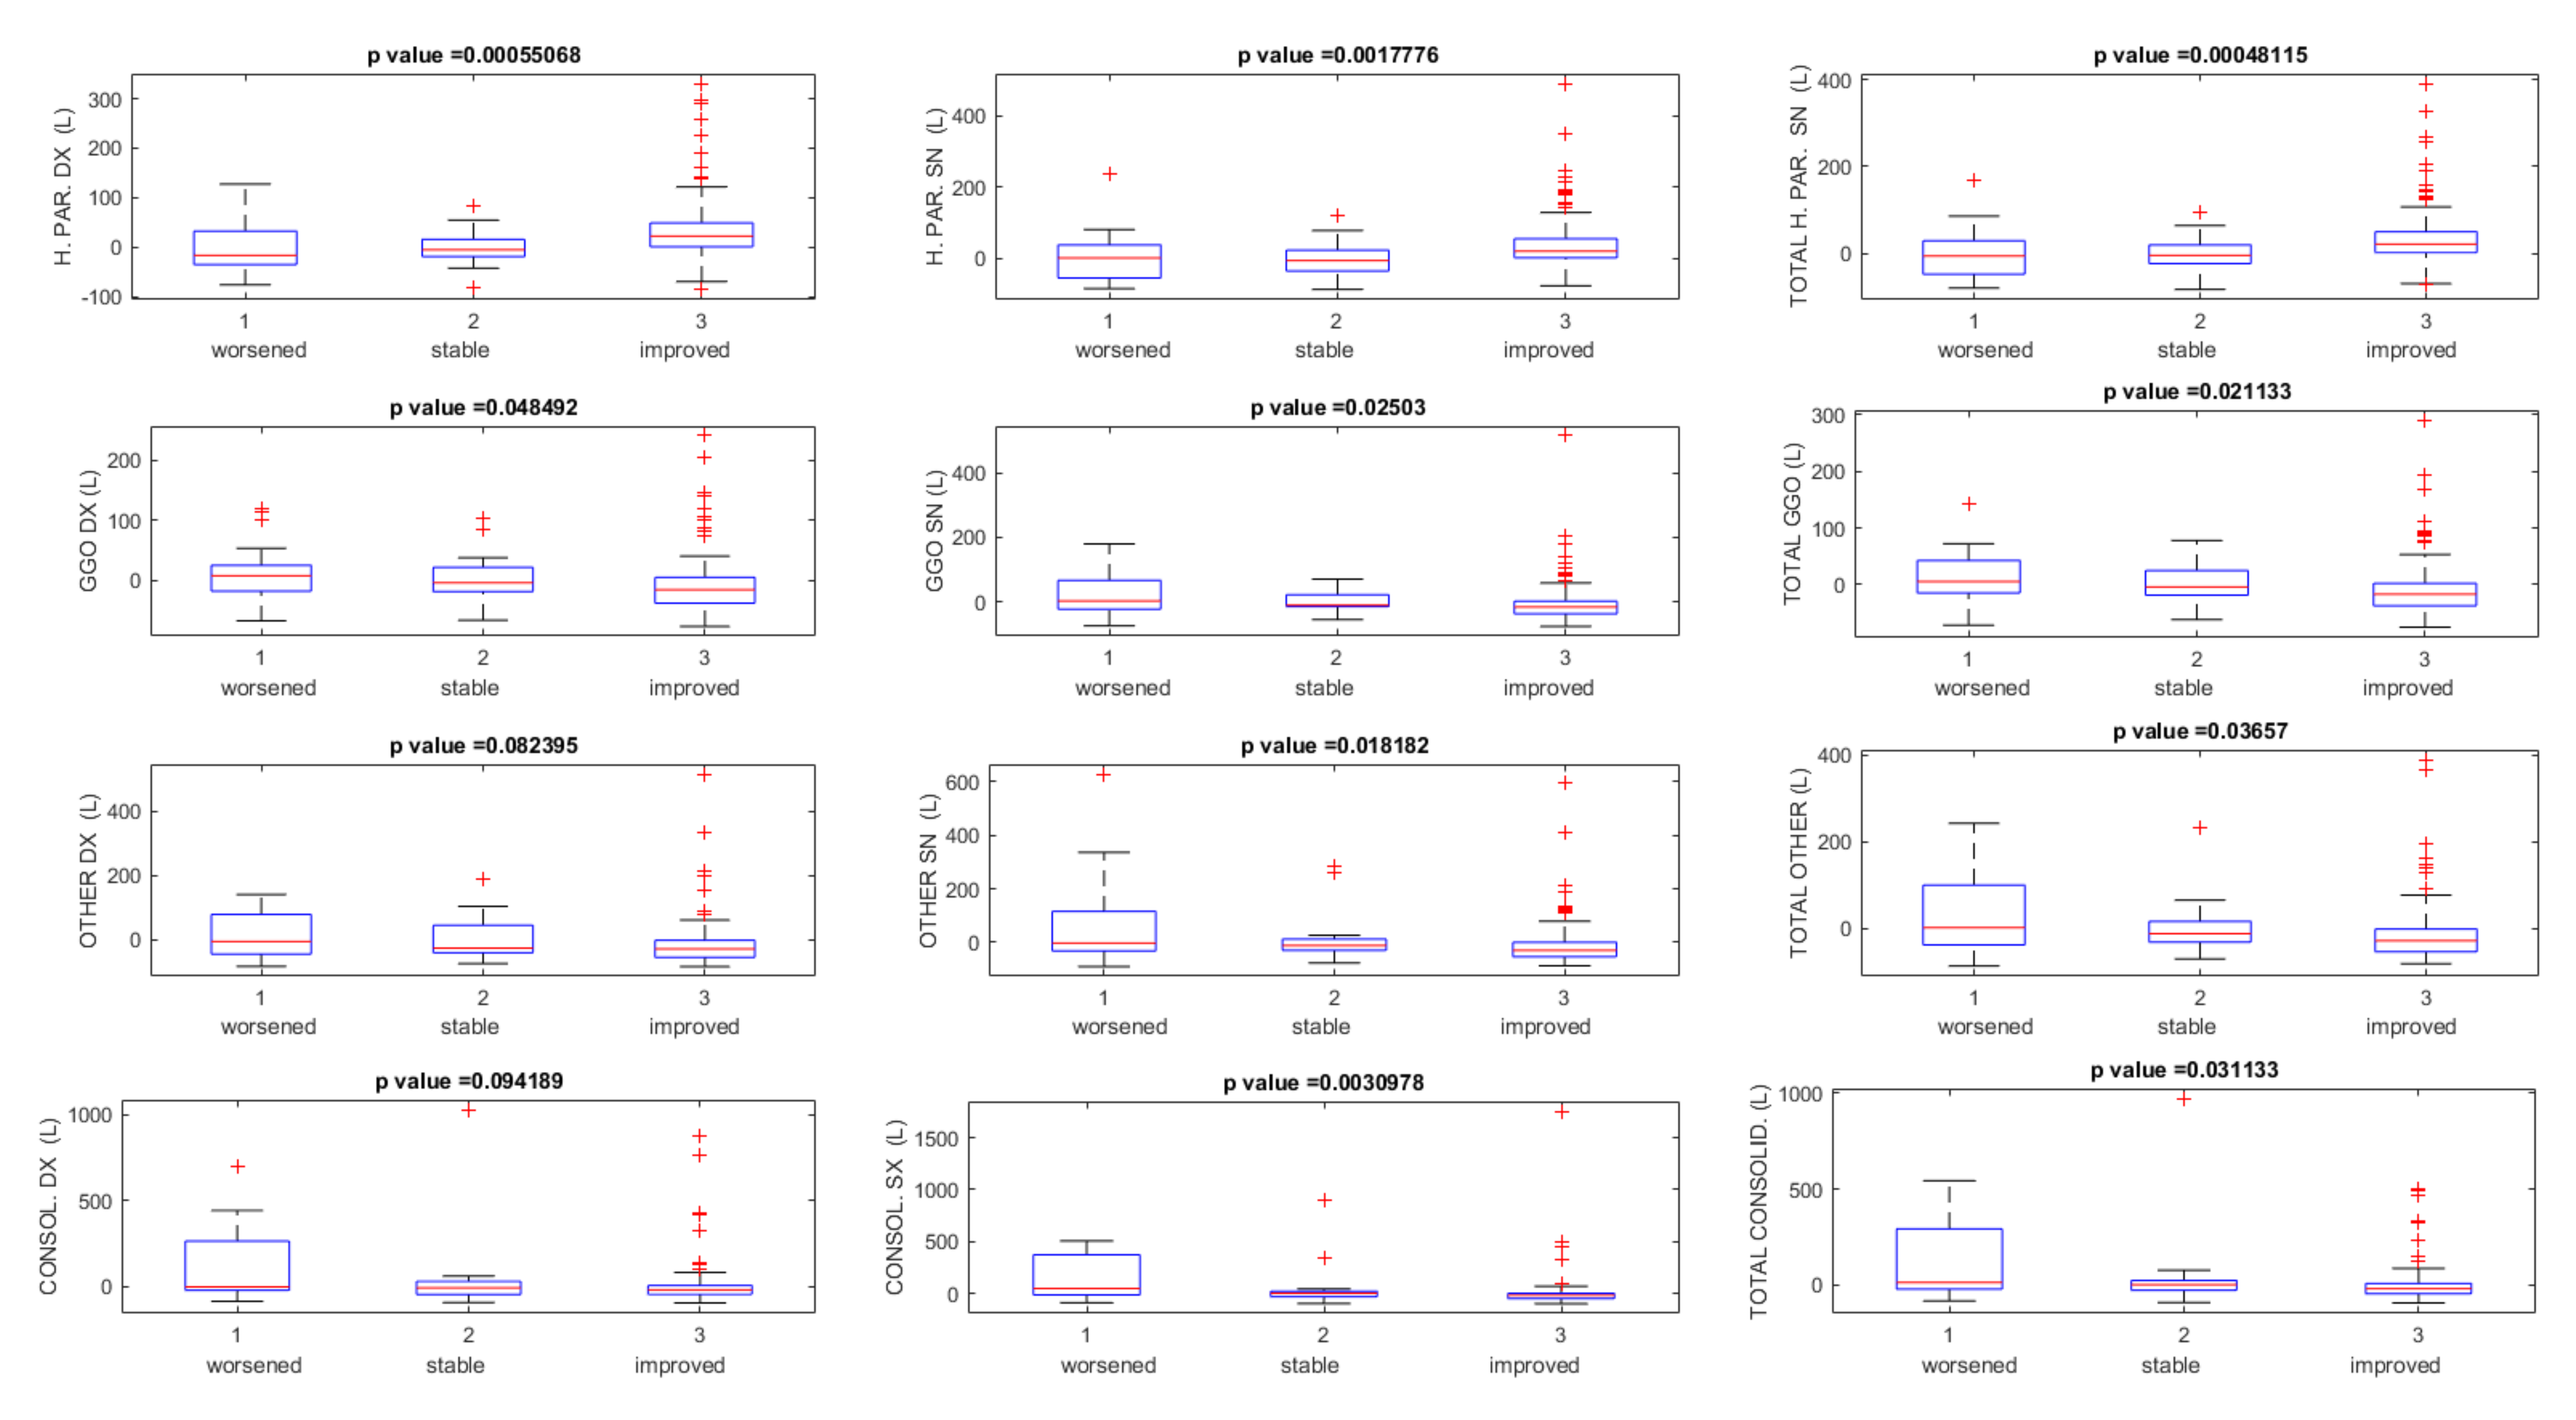
| Worsened (N. 10) | Median value | −23.32 | −11.87 | −18.32 | 21.19 | 50.23 | 42.29 | 32.42 | 12.59 | 22.90 | 45.88 | 54.41 | 37.61 | −6.70 | −5.56 | −3.50 |
| Minimum value | −76.59 | −83.42 | −79.78 | −67.78 | −68.76 | −68.21 | −71.78 | −74.55 | −71.02 | −86.73 | −83.40 | −82.67 | −49.03 | −60.31 | −54.36 | |
| Maximum value | 101.71 | 81.72 | 85.30 | 139.50 | 207.06 | 168.57 | 200.23 | 628.14 | 242.41 | 694.60 | 507.97 | 543.48 | 43.43 | 41.13 | 41.64 | |
| Stable (N. 11) | Median value | −15.10 | −11.11 | −12.87 | 5.92 | −2.52 | 2.20 | −12.24 | −5.45 | −7.25 | −9.78 | −0.94 | 3.34 | −5.34 | −5.85 | −8.06 |
| Minimum value | −85.69 | −85.58 | −82.97 | −66.78 | −56.24 | −62.03 | −74.14 | −76.63 | −71.11 | −93.67 | −93.98 | −93.84 | −47.81 | −46.60 | −47.26 | |
| Maximum value | 115.23 | 185.07 | 95.99 | 203.05 | 517.48 | 289.99 | 334.34 | 412.35 | 365.69 | 1030.43 | 900.34 | 971.51 | 69.84 | 397.22 | 142.59 | |
| Improved (N. 119) | Median value | 23.99 | 22.26 | 23.17 | −19.21 | −17.66 | −17.78 | −32.71 | −29.74 | −31.09 | −20.80 | −18.31 | −21.63 | 10.00 | 13.20 | 13.32 |
| Minimum value | −45.43 | −72.40 | −52.02 | −77.15 | −77.58 | −75.48 | −83.24 | −89.89 | −87.02 | −96.29 | −96.07 | −96.22 | −33.14 | −66.22 | −38.05 | |
| Maximum value | 329.90 | 488.56 | 389.44 | 240.24 | 180.80 | 192.19 | 516.14 | 592.85 | 388.46 | 872.45 | 1756.37 | 500.33 | 147.37 | 192.86 | 165.33 | |
| Total (N. 140) | Median value | 15.21 | 18.93 | 17.01 | −10.11 | −15.02 | −13.97 | −26.81 | −23.56 | −26.12 | −18.99 | −11.82 | −14.10 | 7.25 | 10.81 | 8.56 |
| Minimum value | −85.69 | −85.58 | −82.97 | −77.15 | −77.58 | −75.48 | −83.24 | −89.89 | −87.02 | −96.29 | −96.07 | −96.22 | −49.03 | −66.22 | −54.36 | |
| Maximum value | 329.90 | 488.56 | 389.44 | 240.24 | 517.48 | 289.99 | 516.14 | 628.14 | 388.46 | 1030.43 | 1756.37 | 971.51 | 147.37 | 397.22 | 165.33 | |
| H. PAR. R (%) | H. PAR. L (%) | TOTAL H. PAR. L (%) | GGO R (%) | GGO L (%) | TOTAL GGO (%) | OTHER R (%) | OTHER L (%) | TOTAL OTHER (%) | CONSOL. R (%) | CONSOL. L (%) | TOTAL CONSOLID. (%) | ||
|---|---|---|---|---|---|---|---|---|---|---|---|---|---|
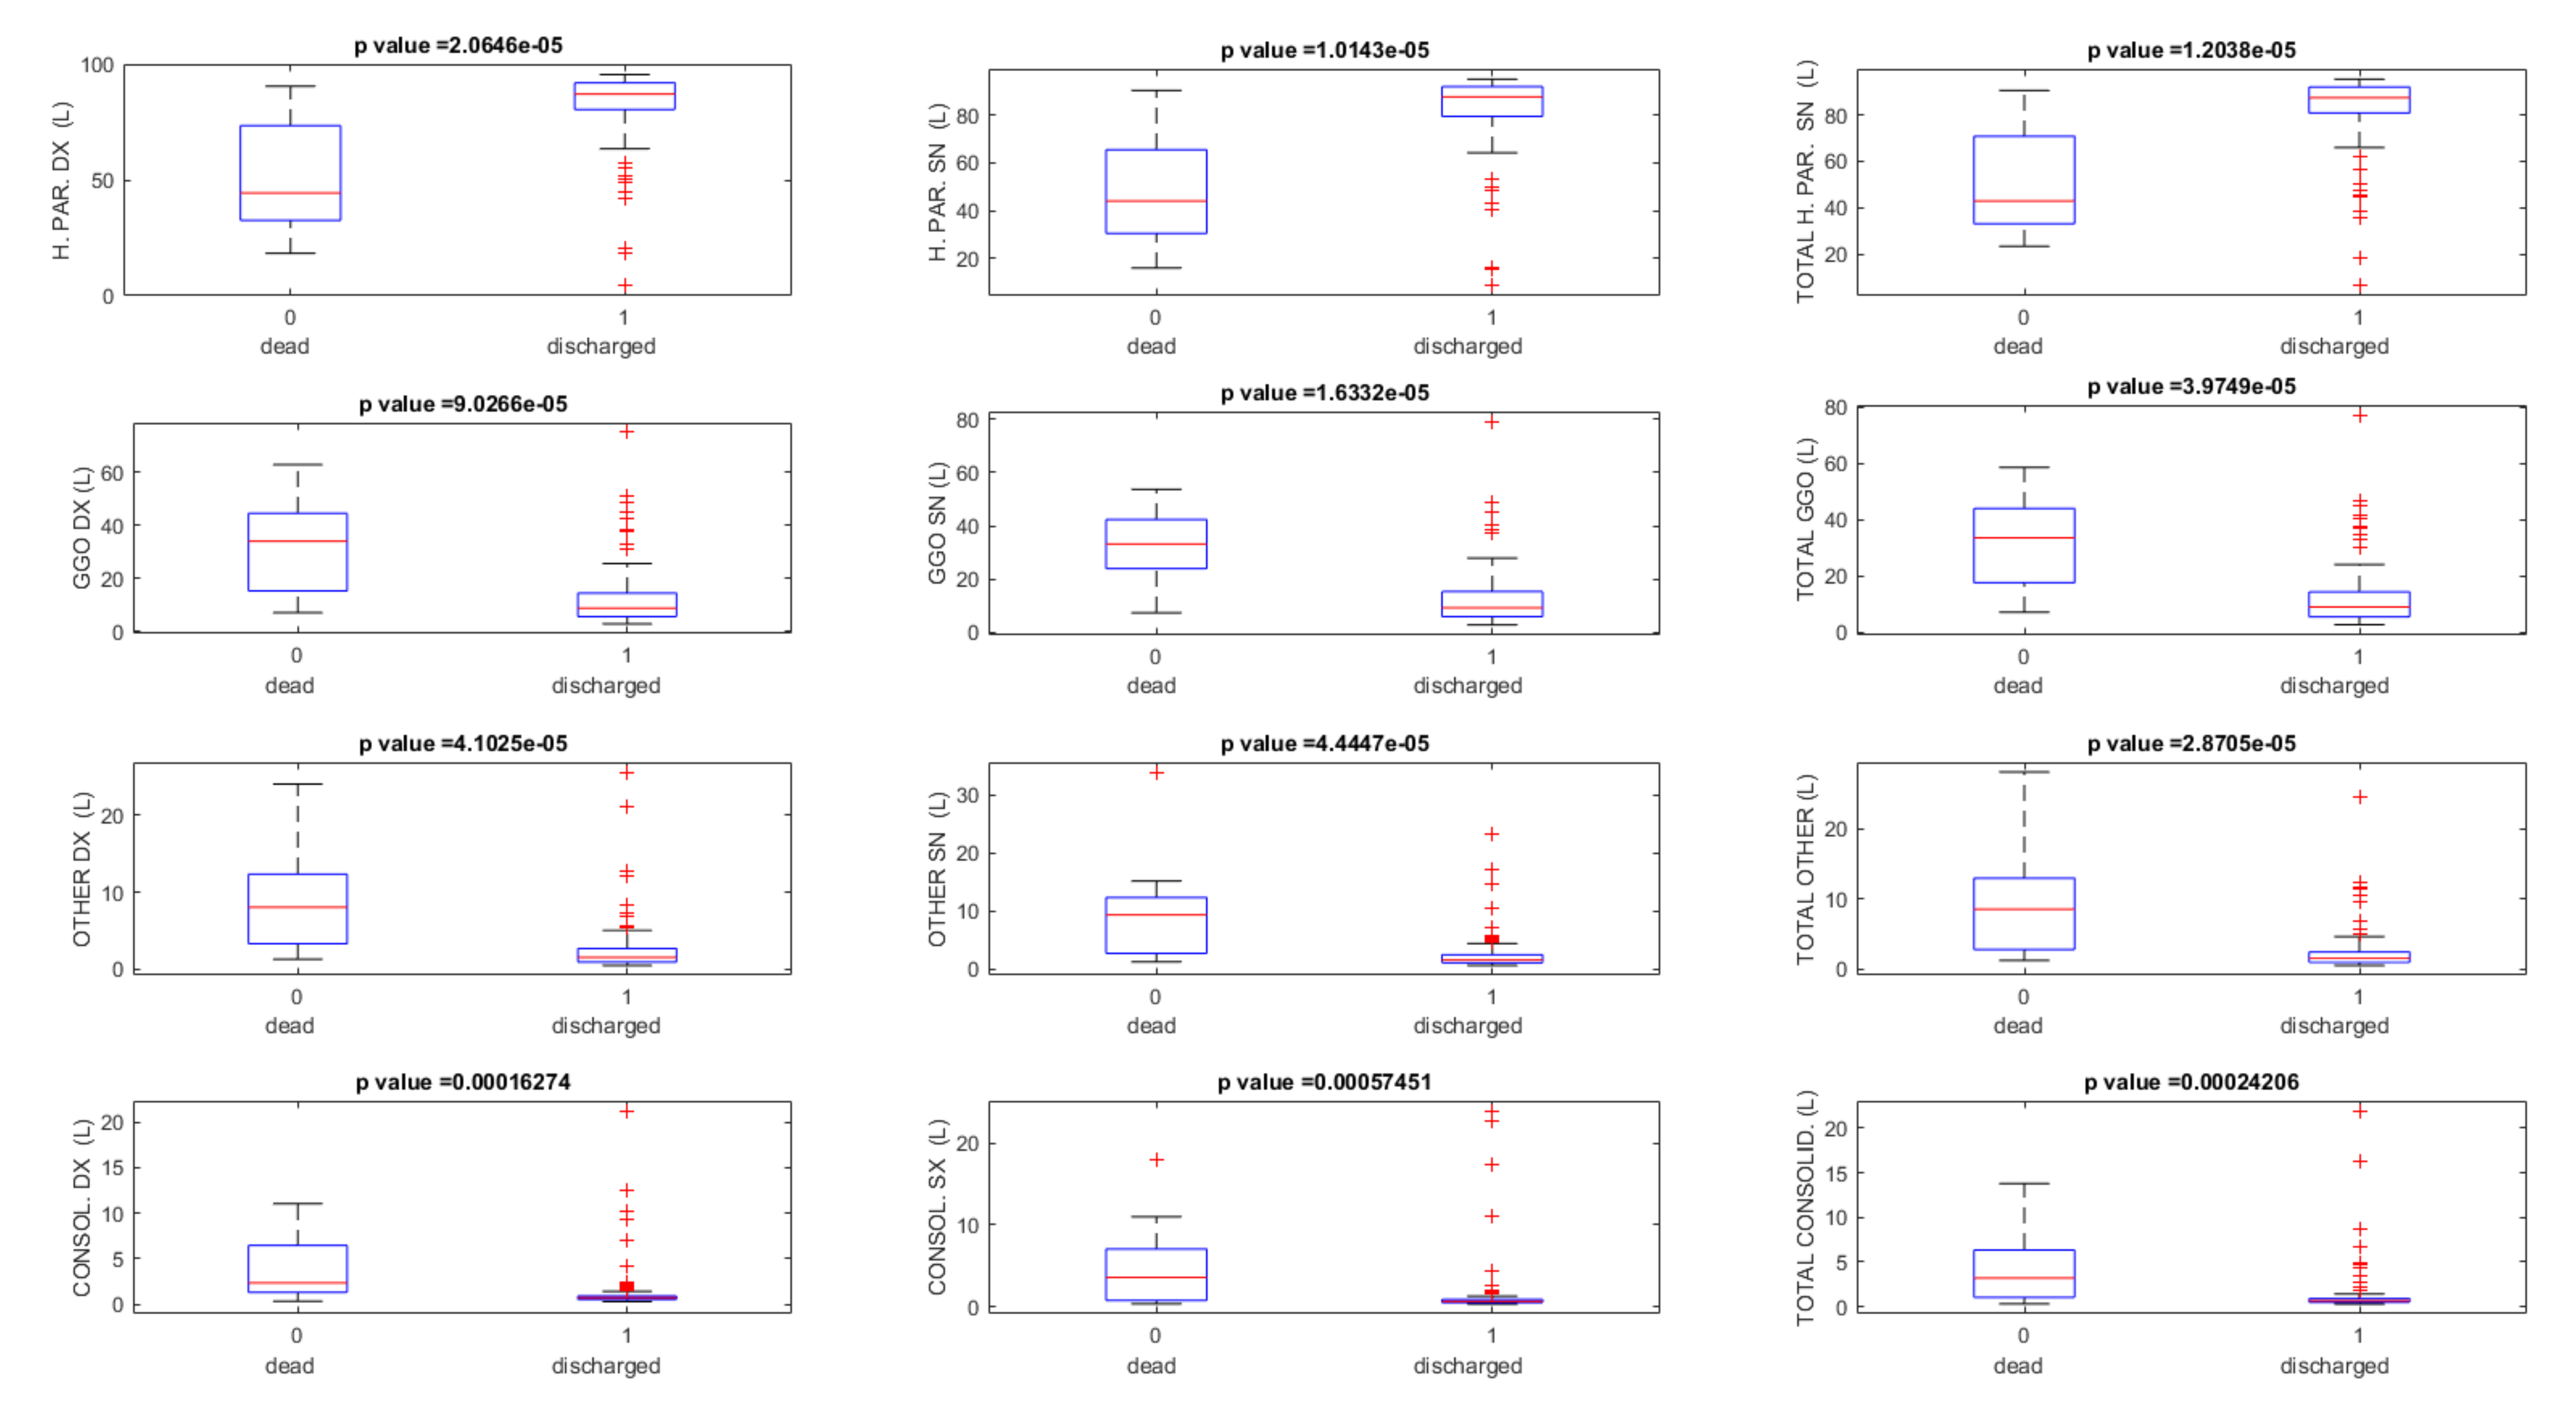
| Dead (N. 11) | Median value | 44.46 | 44.06 | 42.89 | 34.01 | 33.12 | 33.58 | 8.09 | 9.30 | 8.55 | 2.34 | 3.55 | 3.21 |
| Minimum value | 18.34 | 15.94 | 23.36 | 7.03 | 7.30 | 7.15 | 1.31 | 1.20 | 1.26 | 0.32 | 0.33 | 0.32 | |
| Maximum value | 90.72 | 90.40 | 90.58 | 63.00 | 53.70 | 58.55 | 24.08 | 34.00 | 28.12 | 11.05 | 17.92 | 13.78 | |
| Discharged (N. 129) | Median value | 87.36 | 87.71 | 87.48 | 8.67 | 9.19 | 9.02 | 1.57 | 1.51 | 1.56 | 0.69 | 0.61 | 0.65 |
| Minimum value | 4.55 | 8.64 | 6.41 | 2.73 | 2.71 | 2.72 | 0.51 | 0.56 | 0.54 | 0.27 | 0.30 | 0.29 | |
| Maximum value | 95.76 | 95.14 | 95.45 | 75.17 | 79.12 | 76.99 | 25.65 | 23.37 | 24.61 | 21.28 | 23.94 | 21.95 | |
| Total (N. 140) | Median value | 86.67 | 87.10 | 86.31 | 9.77 | 9.96 | 9.96 | 1.61 | 1.61 | 1.69 | 0.72 | 0.65 | 0.69 |
| Minimum value | 4.55 | 8.64 | 6.41 | 2.73 | 2.71 | 2.72 | 0.51 | 0.56 | 0.54 | 0.27 | 0.30 | 0.29 | |
| Maximum value | 95.76 | 95.14 | 95.45 | 75.17 | 79.12 | 76.99 | 25.65 | 34.00 | 28.12 | 21.28 | 23.94 | 21.95 | |
Publisher’s Note: MDPI stays neutral with regard to jurisdictional claims in published maps and institutional affiliations. |
© 2021 by the authors. Licensee MDPI, Basel, Switzerland. This article is an open access article distributed under the terms and conditions of the Creative Commons Attribution (CC BY) license (https://creativecommons.org/licenses/by/4.0/).
Share and Cite
Grassi, R.; Cappabianca, S.; Urraro, F.; Granata, V.; Giacobbe, G.; Magliocchetti, S.; Cozzi, D.; Fusco, R.; Galdiero, R.; Picone, C.; et al. Evolution of CT Findings and Lung Residue in Patients with COVID-19 Pneumonia: Quantitative Analysis of the Disease with a Computer Automatic Tool. J. Pers. Med. 2021, 11, 641. https://doi.org/10.3390/jpm11070641
Grassi R, Cappabianca S, Urraro F, Granata V, Giacobbe G, Magliocchetti S, Cozzi D, Fusco R, Galdiero R, Picone C, et al. Evolution of CT Findings and Lung Residue in Patients with COVID-19 Pneumonia: Quantitative Analysis of the Disease with a Computer Automatic Tool. Journal of Personalized Medicine. 2021; 11(7):641. https://doi.org/10.3390/jpm11070641
Chicago/Turabian StyleGrassi, Roberto, Salvatore Cappabianca, Fabrizio Urraro, Vincenza Granata, Giuliana Giacobbe, Simona Magliocchetti, Diletta Cozzi, Roberta Fusco, Roberta Galdiero, Carmine Picone, and et al. 2021. "Evolution of CT Findings and Lung Residue in Patients with COVID-19 Pneumonia: Quantitative Analysis of the Disease with a Computer Automatic Tool" Journal of Personalized Medicine 11, no. 7: 641. https://doi.org/10.3390/jpm11070641