Spread and Impact of COVID-19 in China: A Systematic Review and Synthesis of Predictions From Transmission-Dynamic Models
 Yi-Fan Lin1†
  Qibin Duan2,3†
  Yiguo Zhou1† Tanwei Yuan1†
  Peiyang Li4†
  Thomas Fitzpatrick5
  Leiwen Fu1 Anping Feng1 Ganfeng Luo1 Yuewei Zhan1 Bowen Liang1 Song Fan4 Yong Lu4
  Bingyi Wang1,6,7 Zhenyu Wang4
  Heping Zhao1 Yanxiao Gao1 Meijuan Li1 Dahui Chen1
  Xiaoting Chen8 Yunlong Ao8
  Linghua Li8 Weiping Cai8 Xiangjun Du1 Yuelong Shu1*
  Huachun Zou1,3,9,10*
- 1School of Public Health (Shenzhen), Sun Yat-sen University, Shenzhen, China
- 2School of Mathematical Sciences, Queensland University of Technology, Brisbane, QLD, Australia
- 3Kirby Institute, University of New South Wales, Sydney, NSW, Australia
- 4School of Public Health, Sun Yat-sen University, Guangzhou, China
- 5Department of Internal Medicine, University of Washington, Seattle, WA, United States
- 6State Key Laboratory of Food Nutrition and Safety, Tianjin University of Science and Technology, Tianjin, China
- 7College of Food Science and Technology, Tianjin University of Science and Technology, Tianjin, China
- 8Guangzhou Eighth People's Hospital, Guangzhou Medical University, Guangzhou, China
- 9Shenzhen Center for Disease Control and Prevention, Shenzhen, China
- 10School of Public Health, Shanghai Jiao Tong University, Shanghai, China
Background: Coronavirus disease 2019 (COVID-19) was first identified in Wuhan, China, in December 2019 and quickly spread throughout China and the rest of the world. Many mathematical models have been developed to understand and predict the infectiousness of COVID-19. We aim to summarize these models to inform efforts to manage the current outbreak.
Methods: We searched PubMed, Web of science, EMBASE, bioRxiv, medRxiv, arXiv, Preprints, and National Knowledge Infrastructure (Chinese database) for relevant studies published between 1 December 2019 and 21 February 2020. References were screened for additional publications. Crucial indicators were extracted and analysed. We also built a mathematical model for the evolution of the epidemic in Wuhan that synthesised extracted indicators.
Results: Fifty-two articles involving 75 mathematical or statistical models were included in our systematic review. The overall median basic reproduction number (R0) was 3.77 [interquartile range (IQR) 2.78–5.13], which dropped to a controlled reproduction number (Rc) of 1.88 (IQR 1.41–2.24) after city lockdown. The median incubation and infectious periods were 5.90 (IQR 4.78–6.25) and 9.94 (IQR 3.93–13.50) days, respectively. The median case-fatality rate (CFR) was 2.9% (IQR 2.3–5.4%). Our mathematical model showed that, in Wuhan, the peak time of infection is likely to be March 2020 with a median size of 98,333 infected cases (range 55,225–188,284). The earliest elimination of ongoing transmission is likely to be achieved around 7 May 2020.
Conclusions: Our analysis found a sustained Rc and prolonged incubation/ infectious periods, suggesting COVID-19 is highly infectious. Although interventions in China have been effective in controlling secondary transmission, sustained global efforts are needed to contain an emerging pandemic. Alternative interventions can be explored using modelling studies to better inform policymaking as the outbreak continues.
Introduction
An outbreak of atypical pneumonia (Coronavirus Disease 2019, COVID-19) caused by the novel coronavirus (2019-nCoV) emerged in Wuhan, China, at the end of 2019. The virus rapidly spread across China and the rest of the world. As of 9 May, 83,976 confirmed infections and 4,639 deaths had been reported within China1,2. The majority of cases in China have been identified in Hubei Province, especially within Wuhan. The Wuhan Municipal Government began a citywide lockdown on 23 January 2020 to slow the spread of the disease, and other cities in Hubei Province soon followed suit3. The lockdown effectively curbed further exportation of the epidemic from Hubei to the other provinces of China (1–4). Within China, the outbreak has been effectively under control and the main effort was put in identifying the imported cases from overseas1. However, the WHO declared COVID-19 a global pandemic on 11 March due to its spread and severity worldwide, with 2,361,998 confirmed infections and 272,094 deaths outsides China as of 9 May.
Mathematical modelling, including statistical modelling, is a useful tool to understand the dynamics of new diseases. Since COVID-19 was first identified, many mathematical models have been developed to simulate the transmission across populations and assess the potential impact of public health interventions. Crucial parameters of new diseases can be derived from models, including the basic reproduction number (R0), peak time, peak size, incubation period, infectious period, case-fatality rate (CFR), and elimination time. By definition, R0 measures the average number of secondary cases that are expected to be generated from a single case of a disease entering a completely susceptible population (5). R0 decreases if intervention measures are implemented or the susceptible population size decreases. The controlled reproduction number (Rc) denotes R0 after interventional measures are undertaken. If R0 < 1, then one infectious person will infect fewer than one person, and an epidemic will ultimately resolve (6). Thus, R0 is an important parameter to assess potential control strategies during an outbreak. Peak time refers to the time when a disease infects the largest number of people (peak size) and is an inflection point during an outbreak.
Published models of COVID-19 have reported a huge range of estimated R0 and peak times. For example, Zhang et al. (7) estimated an R0 of 1.44 while Mizumoto et al. (8) reported an R0 of 7.05. To better inform efforts to control the current outbreak, we systematically reviewed existing mathematical and statistical models and built our own mathematical model to estimate the transmission capacity, epidemiological characteristics, potential peak time and size, and elimination time of COVID-19.
Methods
Search Strategy and Selection Criteria
Our systematic review was conducted according to PRISMA guidelines (9). We searched PubMed, Web of Science, EMBASE, bioRxiv, medRxiv, arXiv, Preprints, and National Knowledge Infrastructure (CNKI) for studies published between 1 December 2019 and 21 February 2020. We used the search terms “Coronavirus Disease 2019,” “COVID-19,” “SARS-CoV-2,” “2019-nCoV,” “coronavirus,” OR “pneumonia” AND “model,” “modelling,” “modeling,” “dynamic,” “estimation,” “prediction,” OR “transmission.” Search terms were translated into Chinese when searching Chinese database. The database search was supplemented by screening references of retrieved articles.
Studies were included if they presented a mathematical/statistical model of COVID-19 and reported any of the following—R0, incubation period, infectious period, fatality, peak time, peak size, total infection number, or elimination time. Studies were excluded if they were purely methodological and did not report the aforementioned parameters. If one study was concurrently published in a journal and preprint website, only the journal version was included. Two reviewers (YL and YZ) independently performed the literature search and screened titles and abstracts. Disagreements were resolved by discussion among all authors.
Data Analysis
Data extraction was performed by QD, Y-FL, and YZho independently, and results were summarised by Y-FL. Abstracted variables included the first author, model type, type and period of data used for model fitting, setting, region of interest, estimated R0, estimated incubation period, estimated CFR, estimated peak time and peak size, and impact of outbreak response if available. Assumed values of the incubation period based on other studies were excluded. Quality of mathematical models was assessed according to a quality-appraisal tool developed upon the recommendations by the International Society for Pharmacoeconomics and Outcomes Research and Society for Medical Decision Making (ISPOR-SMDM) Modelling Good Research Practices Task Force (10, 11). Such a tool brings up questions regarding 14 criteria, e.g., model setting and population, modelling methodology and structure, and fitting methodology (see Appendix in Supplementary Material). Each criterion of a paper was scored zero, one, or two. If a criterion was not relevant for a paper, then a score of one was assigned. QD, Y-FL, and YZho assessed the quality of mathematical models, and discrepancies were resolved through discussion with a senior investigator (HZo).
A comprehensive meta-analysis of extracted data was not performed due to the high level of heterogeneity between the studies in terms of model type, model setting, type and period of data used for model calibration, and region of interest. However, some key parameters were analysed, including estimated parameters (R0/Rc, incubation period, infectious period, and CFR) and model predictions (peak size and peak time, total infections, and elimination time). R0/Rc was analysed by stratifying regions, namely “Wuhan,” “Hubei (including Wuhan),” “mainland China (excluding Taiwan, Hong Kong and Macau),” and “regions other than Hubei in mainland China.”
We reported distributions of point estimates and reported medians and interquartile ranges (IQR). We did not pool point estimates from various mathematical models. Categorical variables were presented as frequencies or proportions. Data were combined by interval segments and/or grouped by the same characteristics according to the sparsity of data. Some statistical methods, mainly non-parametric methods, including the Wilcoxon rank sum test (R0/Rc), Kruskal-Wallis H test (regions), and Quade test (R0/Rc and regions), were used to analyze differences between segments/groups.
We modelled COVID-19 transmission using a classic susceptible (S)-exposed (E)-infectious (I)-recovery (R) (SEIR) structure model (see Appendix in Supplementary Material) to predict future trends and expected peak time in Wuhan. Two assumptions were separately considered in this SEIR model: (1) individuals in the incubation period are infectious and (2) individuals in the incubation period are not infectious. We used the parameter values that were obtained from our review of previous models for our model simulations. When calibrating the model, the top 20 of 256 best-fit simulations, selected by least square error, were used to obtain estimates of epidemic trends. We calculated peak times and eliminations (total infections <100) based on normal (median), optimistic, and pessimistic scenarios. All analyses were conducted with R software version 3.6.2 (R Foundation for Statistical Computing). Confirmed reported cases between 12 February 2020 and 21 February 2020 were downloaded from the China National Health Commission website 1.
Results
We identified 1,451 studies; 269 were duplicates, which left us with 1,182 unique studies (Figure 1). After screening titles and abstracts, 90 studies underwent a full-text review. Of these, 38 were excluded because they did not report necessary parameters or were not models specifically targeting COVID-19. Fifty-two publications were eligible for inclusion. Details of each included study is summarised in the Appendix (Supplementary Material) (4, 7, 8, 12–36).
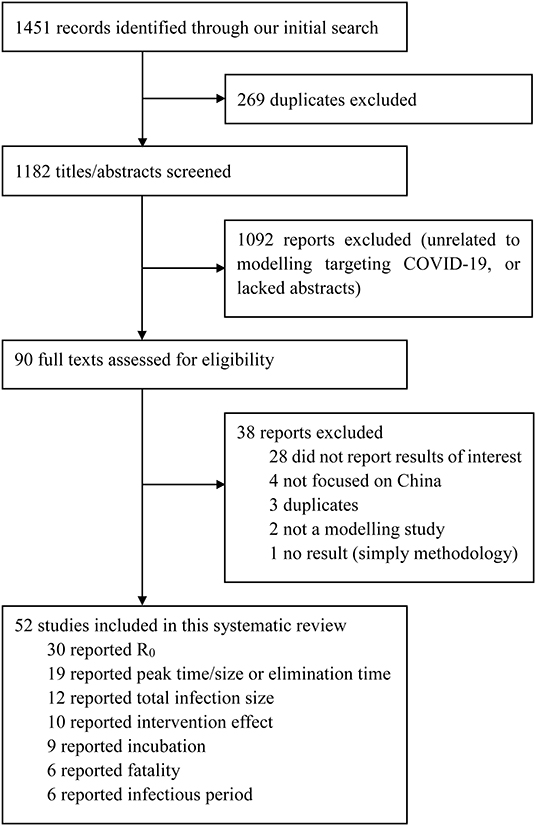
Figure 1. Selection of reports for inclusion in systematic review. Coronavirus Disease 2019, COVID-19; R0, the basic reproduction number.
The 52 included studies reported a total of 75 unique models, including 88% (66/75) of articles calibrated models using original data (i.e., reported cases), 7% (5/75) used adjusted data modified by reported rates prior to model fitting, and 5% (4/75) articles used simulations. 35% (26/75), 16% (12/75), 37% (28/75), and 12% (9/75) of models refer to Wuhan, Hubei, mainland China, and regions other than Hubei in mainland China. The other regions mentioned in these nine articles were too wide, such as Guangdong Province, Beijing, and Chongqing, so we decided to focus on the first three regions only. The usage frequency of different models is summarised in the Appendix (Supplementary Material).
Thirty studies reported estimated R0 and/or Rc. Models used to generate R0/Rc varied in terms of model type, model structure, model setting, and data used for model fitting (see Appendix in Supplementary Material). R0 differed significantly before and after the citywide lockdown in Wuhan (Figures 2, 3, p < 0.001). The median R0 was 3.77 (IQR, 2.78–5.13), and median Rc was 1.88 (IQR, 1.41–2.24). After aggregating data by regions, median R0 for Wuhan, Hubei, and mainland China over the whole outbreak period were 3.16 (IQR, 2.36–4.40), 4.39 (IQR, 3.18–5.15), and 3.03 (IQR, 2.30–4.19), respectively. Differences between these estimated R0 were not statistically significant (p = 0.180).
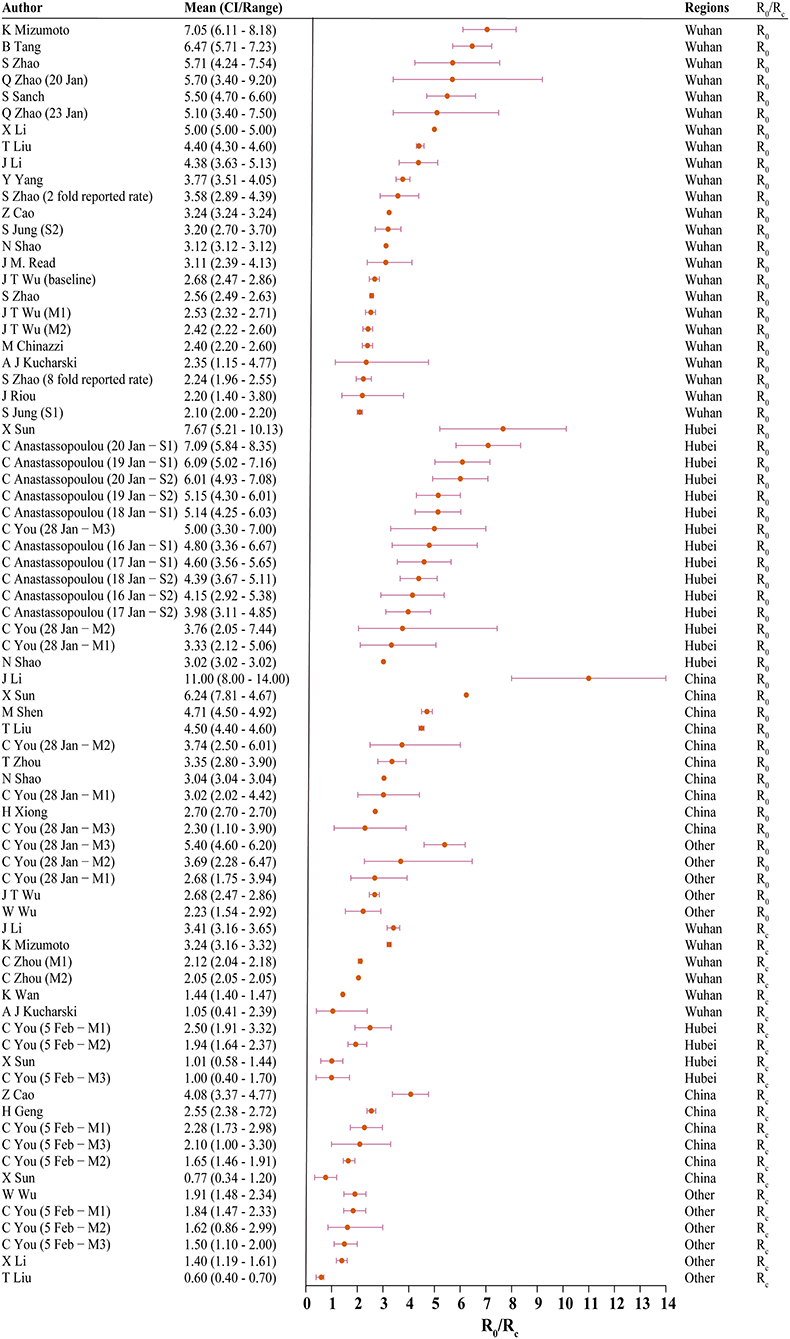
Figure 2. The basic reproduction number (R0) and controlled reproduction number (Rc) estimated among models. CI, confidence interval; M1, model 1; M2, model 2; S1, scenario 1; S2, scenario 2; Other, regions other than Hubei in China.
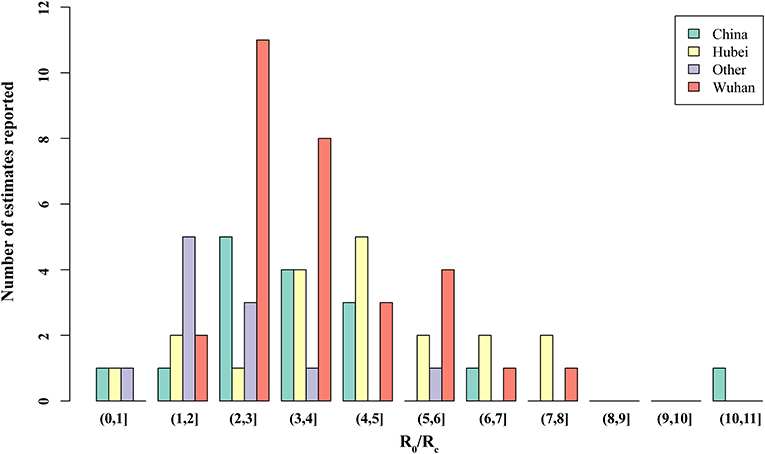
Figure 3. Distribution of the basic reproduction number (R0) and controlled reproduction number (Rc) estimated among models. Other, regions other than Hubei in China.
When R0 and Rc were stratified by region, differences in R0 and Rc remained statistically significant across all four regions. In Wuhan, the median of R0 was 3.22 (IQR, 2.50–5.03) and Rc was 2.09 (IQR, 1.95–2.96). In Hubei, the median R0 and Rc were 4.80 (IQR, 4.07–5.58) and 1.48 (IQR, 1.01–2.08), respectively. Across mainland China, R0 was 3.55 (IQR, 3.03–4.66), and the median Rc was 2.19 (IQR, 1.76–2.48).
Nineteen studies predicted peak time and peak size of infections. Estimates varied from late January to late March with peak size ranging from 7,000 to 90,000 (Table 1). Elimination time was predicted in five studies, with estimates ranging from March to August 2020 (7, 37–40).
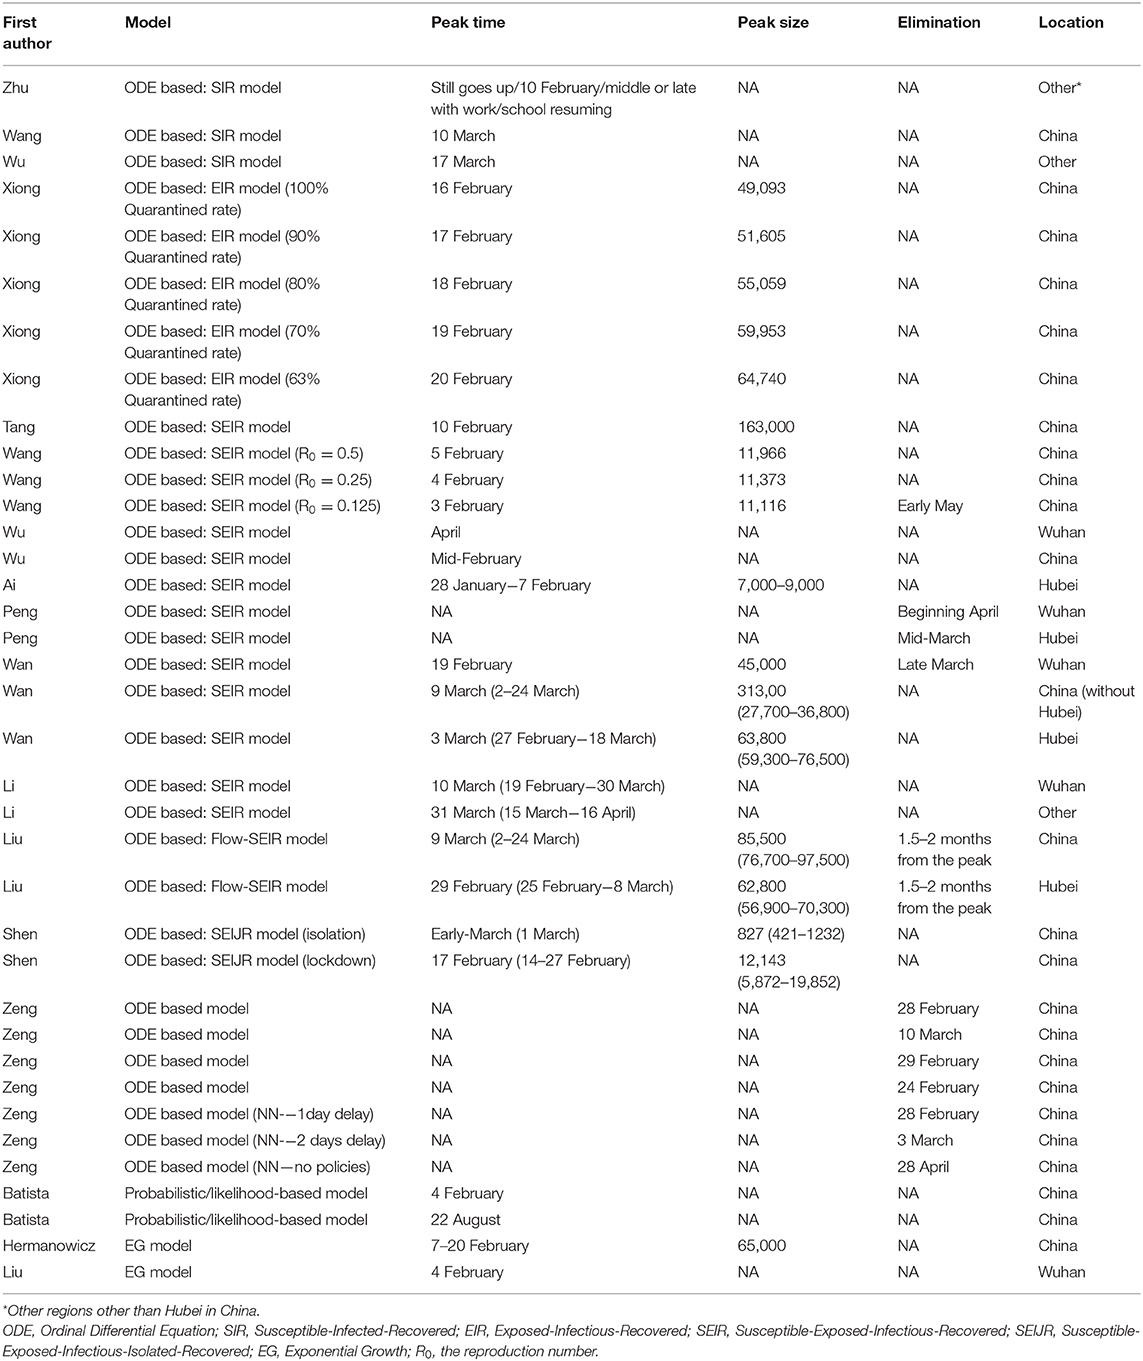
Table 1. Peak time/size and elimination time predicted in models.
Incubation period was estimated in 9 studies, with the median estimate being 5.90 days (IQR 4.78–6.25) (3, 7, 20, 22, 28, 41–44). Among the six studies reporting infection period, the median estimate was 9.94 days (IQR, 3.93–13.50) [Figure 4; (7, 14, 15, 17, 25)]. Six studies reported CFR, and median estimated CFR was 2.94% (IQR, 2.25%−5.40%) (3, 8, 15, 20, 22, 31).
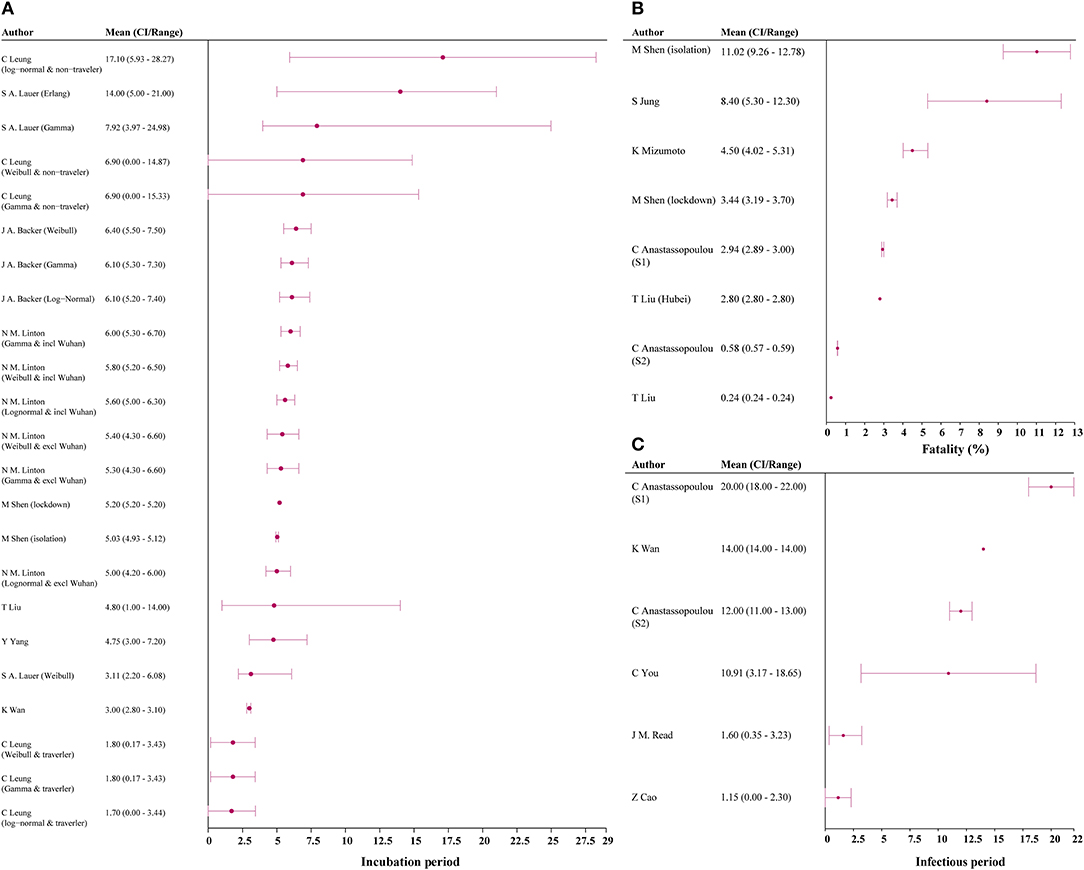
Figure 4. Incubation, case-fatality rate, and infectious period estimates among models. (A) incubation period; (B) fatality; (C) infectious period. CI, confidence interval; S1, scenario 1; S2, scenario 2.
The estimated number of total infections varied by region (see Appendix in Supplementary Material). Median estimated number of total infections in Wuhan, Hubei, and mainland China were 56,565 (IQR, 49,795–280,255), 61,028 (IQR, 43,750–111,682), and 87,525 (IQR, 59,784–461,652), respectively (3, 8, 15, 17, 20, 38, 39, 45–48). Most studies used data from 23 January 2020 or earlier when building models. Two thirds of studies that predicted abnormally high totals came from Probabilistic/likelihood-based models that used data from after 23 January 2020 (15, 46, 48).
The estimated impact of interventions is summarised in the Appendix (Supplementary Material). Four of 10 studies found that after implementing citywide lockdown in Wuhan, R0 would be reduced by 87–95%, peak size would be reduced by 21.06–22.38%, and deaths would be reduced by 56.87–62.95% (1–4). Three studies predicted delay of lockdown measures by 1 or 7 days would increase the number of infections at peak size by 722–6,351 and 8,618–28,274, respectively (3, 16, 49). Increasing diagnosis efficacy to 70% was predicted to reduce infections by 90% as of 10 February 2020 (50).
We generated models under two separate assumptions: (A1) individuals are infectious during the incubation period and (A2) individuals are not infectious during the incubation period. In the A1 model, mean Rc was 2.15 (SD, 0.15); mean incubation period was 5.19 days (SD, 0.53); mean infectious period was 11.87 days (SD, 1.35); and CFR was 2.68% (SD, 0.67%). In the A2 model, mean Rc was 2.14 (SD, 0.16); mean incubation period was 5.17 days (SD, 0.50); mean infectious period was 12.00 days (SD, 1.51); and CFR was 2.43% (SD, 0.39%). Mean of least square error in the top 20 best-fit simulations was 17,944 (SD, 1,140) and 27,750 (SD, 1,754) in the A1 and A2 models, respectively (see Appendix in Supplementary Material).
The top 20 best-fit simulations with best- and worst-case scenarios are presented in Figure 5. In the A1 model, Rc, peak size was 55,225 and 188,284 in the best- and worst-case scenarios, respectively. In the A2 model, peak size was 28,237 and 36,248 in the best- and worst-case scenarios, respectively. In Wuhan, the A1 model predicted peak time would be 17 March (Range, 12–22 March 2020), and elimination time would be 7 May (25 April−21 May 2020). In the A2 model, peak time was estimated to be 2 March (Range, 13 February−5 March 2020) and elimination time to be 17 May (8–27 May 2020).
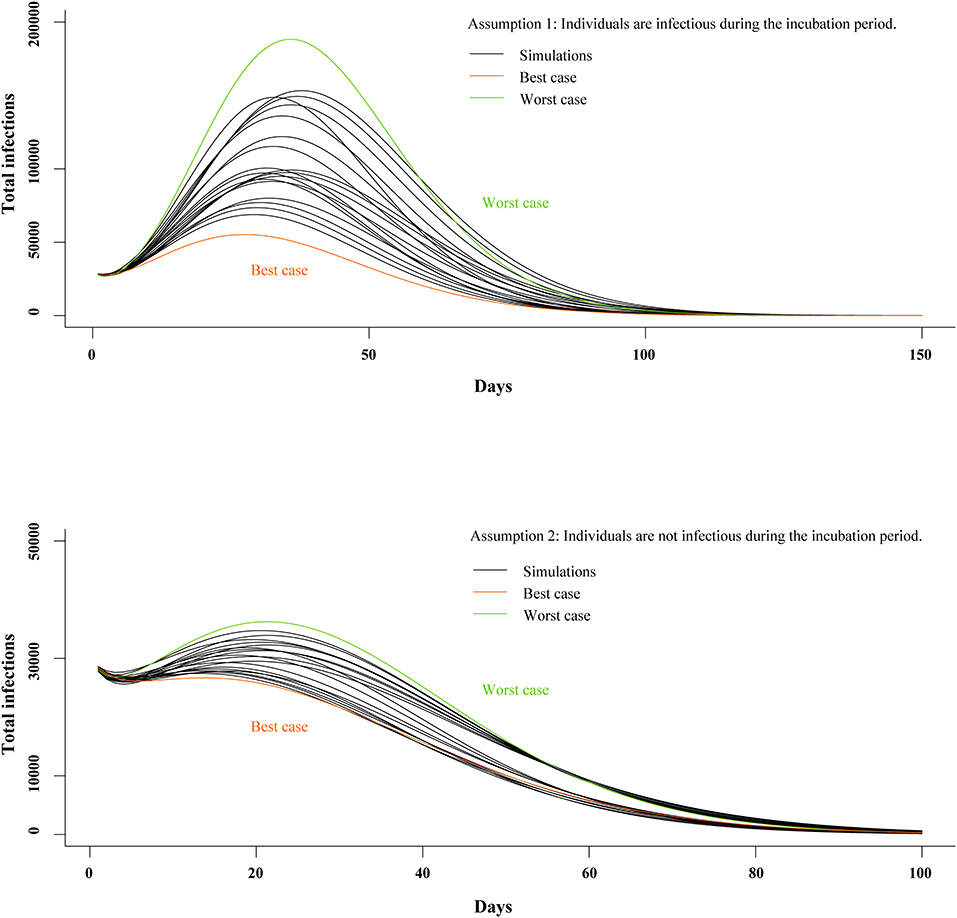
Figure 5. Estimates of peak time and elimination time in SEIR model. SEIR, susceptible-exposed-infectious-recovered.
Discussion
Our systematic review and data synthesis is the first study to synthesize mathematical models on the transmission of COVID-19. The estimated values of R0, incubation period, infectious period, peak time, and peak size for COVID-19 were consistently higher than that of SARS or MERS, suggesting this novel coronavirus is highly infectious. We also found that the citywide lockdown of Wuhan resulted in significantly reduced R0, with the earliest elimination time in China now estimated to be late April, though the complex dynamics of an evolving global pandemic were not incorporated into included models.
In this systematic review of transmission-dynamic models predicting the spread of COVID-19, we found the median estimated R0 to be 3.77, suggesting this novel virus is highly infectious. Estimated R0 of COVID-19 was higher than that of middle east respiratory syndrome coronavirus (MERS-CoV, <1) and severe acute respiratory syndrome (SARS, 2–4) (51, 52). This corresponds to the difference between the total number of infections seen in the current COVID-19 and 2003–2004 SARS outbreaks in China (>80,000 vs. ~5,327)1.
After a citywide lockdown began in Wuhan, the median estimated Rc dropped to 1.88, suggesting a large drop in infections coincided with the implementation of this outbreak control intervention. By limiting interactions and preventing travel, the lockdown effort has dramatically reduced contact rates between infected and non-infected persons. However, an Rc>1 suggests that COVID-19 would continue to spread, which is at odds with recently published epidemiological reports, suggesting the outbreak in China is slowing down1. This discrepancy may suggest that other recently implemented public health measures beyond citywide lockdowns, including contact tracing, intensification of screening, quarantine of infected individuals, and mask utilisation, may also be contributing to the containment of COVID-19. Future models should attempt to capture the impact of these additional interventions on COVID-19 transmission.
We found median estimated incubation period, infectious period, and fatality were 5.90 days, 9.94 days, and 2.94%, respectively. If these estimations are accurate, a 14-day quarantine period would be long enough to assess for infection in an asymptomatic person exposed to COVID-19. It should be noted that the maximum incubation period reported for COVID-19 was 24 days, and additional research is needed to confirm these estimations. However, this estimated incubation period is similar to that of SARS and MERS (51, 52). Estimated CFR of COVID-19 (2.94%) was substantially lower than that of SARS (14–15%) and MERS (34.4%), suggesting COVID-19 may be a less virulent strain in the coronavirus family (20, 22, 51, 53). As of 9 May, the epidemic in China has almost come to end and local asymptomatic infected cases have been captured by the surveillance system, with the death toll come to 4,643 and fatality rate about 5.5%.
We found significant variation in estimated R0 and Rc in our review of the published literature. These variations may be due to the wide variety of modelling methods used and different assumptions used to build each model. Additionally, limited healthcare resources and immature diagnostic algorithms resulted in under-diagnosis and delayed treatment at the beginning of the outbreak in Wuhan. Consequently, models calibrated using only the official number of confirmed infections may be impacted by a systematic underreporting of infections, leading to a higher estimated R0 compared to models that adjusted for potential underreporting. Several studies included in this review concluded that underreported infections may have had an significant impact on estimated R0 (15, 21, 54), and five studies attempted to approximate the number of unreported cases (13, 18, 21, 22, 24).
Our mathematical model predicts peak time for COVID-19 will be in March 2020 and elimination is likely to be achieved by late April 2020 at the earliest, assuming the current intervention level is maintained. This estimate of peak time is close to the reality that there are few locally infected cases after 31 March, which indicates that the peak size of local transmission has been reached in March. Elimination of local transmission has been achieved in April as most of newly infected cases are imported from overseas. COVID-19 continues to spread worldwide2 (55), and the influx of overseas cases may introduce new transmission dynamics that are not possible to predict using current models. Studies have reported that the epidemic of some viruses (e.g., SARS-CoV) or bacteria (e.g., Clostridioides difficile) can be affected by geographical climatic factors such as temperature, humidity, and latitude (56–58), and COVID-19 infections may consequently be impacted by seasonality and latitude in unpredictable ways. However, we were not able to add additional results and analysis of temperature for COVID-19 due to lack of available data. In addition, the difference in social mixing pattern between rural and urban areas may lead to different transmission models. These data are essential to a thorough understanding of the spread of SARS-CoV-2 and formulating appropriate intervention strategies. Through comparing the two scenarios of our mathematical model, scenarios with an infectious incubation period resulted in much better goodness-of-fit. This to some extent support that incubation period is infectious. Finally, the potential impact of new treatment or vaccines for COVID-19 are not represented in the predictions of our models.
Our study has limitations. First, some studies included multiple models, and, as a result, models developed with certain underlying assumptions and validation methods were overrepresented in our results. Second, none of the included models considered age-related contact rates. Immunity to and fatality from COVID-19 likely differ across age cohorts. Without accounting for this key difference, results of all included models should be interpreted with caution. Third, our synthesis model did not take into account rates of underreported infections, additional quarantine efforts, mask usage, or changes in mass transportation, which may change our predictions. Without readily available data effects of these factors are hard to account for.
Findings from our systematic review and mathematical model suggest high infectiousness of COVID-19, and the lockdown of Wuhan significantly reduced R0. If current modelling is accurate, a 14-day quarantine is sufficient for asymptomatic persons exposed to the virus. The effect of age on infection and fatality should be incorporated into future models to more accurately predict transmission dynamics. Interventions besides citywide lockdowns, including mask utilisation and travel restrictions, should be further evaluated through modelling in order to better inform ongoing efforts to contact outbreaks inside and outside China.
Data Availability Statement
All datasets generated for this study are included in the article/Supplementary Material.
Author Contributions
HZo and YS conceived the study. Y-FL, QD, and YZho designed the protocol and conducted study selection and data extraction. Y-FL, QD, and YZho contributed to statistical analysis and interpretation of data. Y-FL, QD, YZho, TY, and PL drafted the manuscript. All authors critically revising the manuscript.
Funding
This study was supported by the Natural Science Foundation of China Young Scientist Fund (81703278), the Australian National Health and Medical Research Commission (NHMRC) Early Career Fellowship (Grant No. APP1092621), the Precision Targeted Intervention Studies among High Risk Groups for HIV Prevention in China, National Science and Technology Major Project of China (2018ZX10721102), the Sanming Project of Medicine in Shenzhen (SZSM201811071), the Australian Research Council Centre of Excellence for Mathematical and Statistical Frontiers (CE140100049), and Infectious Disease Specialty of Guangzhou High-level Clinical Key Specialty (2019–2021).
Conflict of Interest
The authors declare that the research was conducted in the absence of any commercial or financial relationships that could be construed as a potential conflict of interest.
Acknowledgments
The authors are grateful to the professors and students of School of Public Health (Shenzhen), Sun Yat-sen University for their support.
Supplementary Material
The Supplementary Material for this article can be found online at: https://www.frontiersin.org/articles/10.3389/fmed.2020.00321/full#supplementary-material
Footnotes
1. ^National Health Commission of the People's Republic of China. Update on the Outbreak of Novel Coronavirus Pneumonia. Available online at: www.nhc.gov.cn/ (accessed March 16, 2020).
2. ^World Health Organization. Coronavirus Disease (COVID-2019) Situation Reports. Available online at: https://www.who.int/emergencies/diseases/novel-coronavirus-2019/situation-reports/ (accessed March 16, 2020).
3. ^Tencent News. Thirteen Cities in Hubei Implement “Lockdown” and Are Short of Medical Supplies. Available online at: https://news.qq.com/a/20200124/013418.htm (accessed February 21, 2020).
References
1. Yuan HY, Hossain MP, Tsegaye MM, Zhu X, Jia P, Wen TH, et al. Estimating the risk on outbreak spreading of 2019-nCoV in China using transportation data. medRxiv [preprint]. (2020). doi: 10.1101/2020.02.01.20019984
2. Li D, Liu Q, Liu Z, Gao Z, Zhu J, Yang J, et al. Estimating the efficacy of traffic blockage and quarantine for the epidemic caused by 2019-nCoV (COVID-19). medRxiv [preprint]. (2020). doi: 10.1101/2020.02.14.20022913
3. Shen M, Peng Z, Guo Y, Xiao Y, Zhang L. Lockdown may partially halt the spread of 2019 novel coronavirus in Hubei province, China. medRxiv [preprint]. (2020). doi: 10.1101/2020.02.11.20022236
4. Hui G, Anding X, Xiaoyan W, Yong Z, Xiaomei Y, Mao M, et al. Analysis of the role of current prevention and control measures in the epidemic of new coronavirus based on SEIR model. In: Sun S, Wang J, Liu W, Zhu Y, Chen Y, Wang H, editors. Journal of Jinan University (Natural Science & Medicine Edition), Guangzhou (2020). p. 1–7.
5. Adnerson RM, May RM. Infectious Diseases of Humans. Oxford: Oxford University Press (1991). p. 768.
6. Guerra FM, Bolotin S, Lim G, Heffernan J, Deeks SL, Li Y, et al. The basic reproduction number (R) of measles: a systematic review. Lancet Infect Dis. (2017) 17:e420–8. doi: 10.1016/S1473-3099(17)30307-9
7. Wan K, Chen J, Lu C, Dong L, Wu Z, Zhang L. When will the battle against novel coronavirus end in Wuhan: A SEIR modeling analysis. J Glob Health. (2020) 10:011002. doi: 10.7189/jogh.10.011002
8. Mizumoto K, Kagaya K, Chowell G. Early epidemiological assessment of the transmission potential and virulence of 2019 Novel Coronavirus in Wuhan City: China, 2019-2020. medRxiv [preprint]. (2020). doi: 10.1101/2020.02.12.20022434
9. Moher D, Liberati A, Tetzlaff J, Altman DG, Grp P. Preferred reporting items for systematic reviews and meta-analyses: the PRISMA statement. PLoS Med. (2009) 6:6. doi: 10.1371/journal.pmed.1000097
10. Weinstein MC, O'Brien B, Hornberger J, Jackson J, Johannesson M, McCabe C, et al. Principles of good practice for decision analytic modeling in health-care evaluation: report of the ISPOR task force on good research practices—modeling studies. Val Health. (2003) 6:9–17. doi: 10.1046/j.1524-4733.2003.00234.x
11. Harris RC, Sumner T, Knight GM, White RG. Systematic review of mathematical models exploring the epidemiological impact of future TB vaccines. Hum Vaccines Immunother. (2016) 12:2813–32. doi: 10.1080/21645515.2016.1205769
12. Kucharski AJ, Russell TW, Diamond C, Funk S, Eggo RM. Early dynamics of transmission and control of 2019-nCoV: a mathematical modelling study. medRxiv [preprint]. (2020). doi: 10.1101/2020.01.31.20019901
13. Tang B, Wang X, Li Q, Bragazzi NL, Tang S, Xiao Y, et al. Estimation of the Transmission Risk of the 2019-nCoV and Its Implication for Public Health Interventions. J Clin Med. (2020) 9:E462. doi: 10.3390/jcm9020462.PubMedPMID:32046137
14. You C, Deng Y, Hu W, Sun J, Lin Q, Zhou F, et al. Estimation of the time-varying reproduction Number of 2019-nCoV outbreak in China. medRxiv [preprint]. (2020). doi: 10.1101/2020.02.08.20021253
15. Anastassopoulou C, Russo L, Tsakris A, Siettos C. Data-based analysis, modelling and forecasting of the COVID-19 outbreak. PLoS One. (2020) 15:e0230405. doi: 10.1371/journal.pone.0230405
16. Xiong H, Yan H. Simulating the infected population and spread trend of 2019-nCov under different policy by EIR model. medRxiv [preprint]. (2020). doi: 10.1101/2020.02.10.20021519
17. Read JM, Bridgen JRE, Cummings DAT, Ho A, Jewell CP. Novel coronavirus 2019-nCoV: early estimation of epidemiological parameters and epidemic predictions. medRxiv [preprint]. (2020). doi: 10.1101/2020.01.23.20018549
18. Wu JT, Leung K, Leung GM. Nowcasting and forecasting the potential domestic and international spread of the 2019-nCoV outbreak originating in Wuhan, China: a modelling study. Lancet. (2020) 395:689–97. doi: 10.1016/S0140-6736(20)30260-9
19. Riou J, Althaus CL. Pattern of early human-to-human transmission of Wuhan 2019 novel coronavirus (2019-nCoV), December 2019 to January 2020. Euro Surveill. (2020) 25:2000058. doi: 10.2807/1560-7917.ES.2020.25.4.2000058
20. Shen M, Peng Z, Xiao Y, Zhang L. Modelling the epidemic trend of the 2019 novel coronavirus outbreak in China. bioRxiv [preprint]. (2020) doi: 10.1101/2020.01.23.916726
21. Zhao S, Lin Q, Ran J, Musa SS, Yang G, Wang W, et al. Preliminary estimation of the basic reproduction number of novel coronavirus (2019-nCoV) in China, from 2019 to 2020: A data-driven analysis in the early phase of the outbreak. Int J Infect Dis. (2020) 92:214–7. doi: 10.1016/j.ijid.2020.01.050
22. Liu T, Hu J, Xiao J, He G, Kang M, Rong Z, et al. Time-varying transmission dynamics of Novel Coronavirus Pneumonia in China. bioRxiv [preprint]. (2020). doi: 10.1101/2020.01.25.919787
23. Zhou T, Liu Q, Yang Z, Liao J, Yang K, Bai W, et al. Preliminary prediction of the basic reproduction number of the Wuhan novel coronavirus 2019-nCoV. J Evid Based Med. (2020) 13:3–7. doi: 10.1111/jebm.12376
24. Li X, Zhao X, Sun Y. The lockdown of Hubei Province causing different transmission dynamics of the novel coronavirus (2019-nCoV) in Wuhan and Beijing. medRxiv [preprint]. (2020). doi: 10.1101/2020.02.09.20021477
25. Cao Z, Zhang Q, Lu X, Pfeiffer D, Jia Z, Song H, et al. Estimating the effective reproduction number of the 2019-nCoV in China. medRxiv [preprint]. (2020). doi: 10.1101/2020.01.27.20018952
26. Wentao W, Ruhai B, Da'ning L, Aozi F, Anding X, Jun L. Preliminary prediction of the epidemic trend of 2019 novel coronavirus (2019-nCoV) pneumonia in Guangdong province. In: Sun S, Wang J, Liu W, Zhu Y, Chen Y, Wang H, editors. Journal of Jinan University (Natural Science & Medicine Edition), Guangzhou (2020). p. 1–6
27. Zhao Q, Chen Y, Small DS. Analysis of the epidemic growth of the early 2019-nCoV outbreak using internationally confirmed cases. medRxiv [preprint]. (2020). doi: 10.1101/2020.02.06.20020941
28. Yang Y, Lu Q, Liu M, Wang Y, Zhang A, Jalali N, et al. Epidemiological and clinical features of the 2019 novel coronavirus outbreak in China. medRxiv [preprint]. (2020). doi: 10.1101/2020.02.10.20021675
29. Sanche S, Lin YT, Xu C, Romero-Severson E, Hengartner N, Ke R. The novel coronavirus, 2019-nCoV, is highly contagious and more infectious than initially estimated. medRxiv [preprint]. (2020). doi: 10.1101/2020.02.07.20021154
30. Li J. A robust stochastic method of estimating the transmission potential of 2019-nCoV. arXiv [preprint]. (2020). Available online at: https://ui.adsabs.harvard.edu/abs/2020arXiv200203828L (accessed February 1, 2020).
31. Jung SM, Akhmetzhanov AR, Hayashi K, Linton NM, Yang Y, Yuan B, et al. Real-time estimation of the risk of death from novel coronavirus (COVID-19) infection: inference using exported cases. J Clin Med. (2020) 9:523. doi: 10.3390/jcm9020523
32. Cao Z, Zhang Q, Lu X, Pfeiffer D, Wang L, Song H, et al. Incorporating human movement data to improve epidemiological estimates for 2019-nCoV. medRxiv [preprint]. (2020). doi: 10.1101/2020.02.07.20021071
33. Zhou C. Evaluating new evidence in the early dynamics of the novel coronavirus COVID-19 outbreak in Wuhan, China with real time domestic traffic and potential asymptomatic transmissions. medRxiv [preprint]. (2020). doi: 10.1101/2020.02.15.20023440
34. Li J, Wang Y, Gilmour S, Wang M, Yoneoka D, Wang Y, et al. Estimation of the epidemic properties of the 2019 novel coronavirus: a mathematical modeling study. medRxiv [preprint]. (2020). doi: 10.1101/2020.02.18.20024315
35. Shao N, Cheng J, Chen W. The reproductive number of COVID-19 based on estimate of a statistical time delay dynamical system. medRxiv [preprint]. (2020). doi: 10.1101/2020.02.17.20023747
36. Sun H, Qiu Y, Yan H, Huang Y, Zhu Y, Chen SX. Tracking and predicting COVID-19 epidemic in China Mainland. medRxiv [preprint]. (2020). doi: 10.1101/2020.02.17.20024257
37. Wang H, Wang Z, Dong Y, Chang R, Xu C, Yu X, et al. Estimating the number of 2019 novel Coronavirus cases in Chinese Mainland. Lancet. (2020). doi: 10.2139/ssrn.3529449
38. Zeng T, Zhang Y, Li Z, Liu X, Qiu B. Predictions of 2019-nCoV transmission ending via comprehensive methods. arXiv [preprint]. (2020). Available online at: https://ui.adsabs.harvard.edu/abs/2020arXiv200204945Z (accessed February 01, 2020).
39. Peng L, Yang W, Zhang D, Zhuge C, Hong L. Epidemic analysis of COVID-19 in China by dynamical modeling. arXiv [preprint]. (2020). Available online at: https://ui.adsabs.harvard.edu/abs/2020arXiv200206563P (accessed February 01, 2020).
40. Liu Q, Li D, Liu Z, Gao Z, Zhu J, Yang J, et al. Epidemic trends analysis and risk estimation of 2019-nCoV outbreak. medRxiv [preprint]. (2020). doi: 10.1101/2020.02.09.20021444
41. Backer JA, Klinkenberg D, Wallinga J. Incubation period of 2019 novel coronavirus (2019-nCoV) infections among travellers from Wuhan, China, 20-28 January 2020. Euro Surveill. (2020) 25. doi: 10.2807/1560-7917.Es.2020.25.5.2000062
42. Lauer SA, Grantz KH, Bi Q, Jones FK, Zheng Q, Meredith HR, et al. The incubation period of coronavirus disease 2019 (COVID-19) from publicly reported confirmed cases: estimation and application. Ann Intern Med. (2020) 172:577–82. doi: 10.7326/m20-0504
43. Leung C. Estimating the distribution of the incubation period of 2019 novel coronavirus (COVID-19) infection between travelers to Hubei, China and non-travelers. medRxiv [preprint]. (2020). doi: 10.1101/2020.02.13.20022822
44. Linton NM, Kobayashi T, Yang Y, Hayashi K, Akhmetzhanov AR, Jung SM, et al. Epidemiological characteristics of novel coronavirus infection: a statistical analysis of publicly available case data. medRxiv [preprint]. (2020). doi: 10.1101/2020.01.26.20018754
45. Zhu X, Zhang A, Xu S, Jia P, Tan X, Tian J, et al. Spatially explicit modeling of 2019-ncov epidemic trend based on mobile phone data in Mainland China. medRxiv [preprint]. (2020). doi: 10.1101/2020.02.09.20021360
46. Zhou G, Chi C. A model simulation study on effects of intervention measures in Wuhan COVID-19 epidemic. medRxiv [preprint]. (2020). doi: 10.1101/2020.02.14.20023168
47. Batista M. Estimation of the final size of the coronavirus epidemic by the logistic model. medRxiv [preprint]. (2020). doi: 10.1101/2020.02.16.20023606
48. Fu X, Ying Q, Zeng T, Long T, Wang Y. Simulating and forecasting the cumulative confirmed cases of SARS-CoV-2 in China by Boltzmann function-based regression analyses. J Infect. (2020) 80:578–606. doi: 10.1016/j.jinf.2020.02.019
49. Ai S, Zhu G, Tian F, Li H, Gao Y, Wu Y, et al. Population movement, city closure and spatial transmission of the 2019-nCoV infection in China. medRxiv [preprint]. (2020). doi: 10.1101/2020.02.04.20020339
50. Ming WK, Huang J, Zhang CJP. Breaking down of healthcare system: Mathematical modelling for controlling the novel coronavirus (2019-nCoV) outbreak in Wuhan, China. bioRxiv [preprint]. (2020). doi: 10.1101/2020.01.27.922443
51. World Health Organization. Consensus Document on the Epidemiology of Severe Acute Respiratory Syndrome (SARS). Geneva: World Health Organization (2003).
52. World Health Organization. WHO MERS Global Summary and Assessment of Risk. Geneva: World Health Organization. Report No. WHO/MERS/RA/19.1 (2019).
53. Majumder MS, Rivers C, Lofgren E, Fisman D. Estimation of MERS-Coronavirus reproductive number and case fatality rate for the spring 2014 Saudi Arabia outbreak: insights from publicly available data. PLOS Currents Outbreaks. (2014). doi: 10.1371/currents.outbreaks.98d2f8f3382d84f390736cd5f5fe133c
54. Zhao S, Musa SS, Lin Q, Ran J, Yang G, Wang W, et al. Estimating the unreported number of novel coronavirus (2019-ncov) cases in China in the first half of January 2020: a data-driven modelling analysis of the early outbreak. J Clin Med. (2020) 9:388. doi: 10.3390/jcm9020388
55. Johns Hopkins University. COVID-19 Resource Center: Expertise and Basic Information. (2020). Available online at: https://coronavirus.jhu.edu/map.html (accessed May 9, 2020).
56. Chan KH, Peiris JSM, Lam SY, Poon LLM, Yuen KY, Seto WH. The effects of temperature and relative humidity on the viability of the SARS coronavirus. Adv Virol. (2011) 2011:734690. doi: 10.1155/2011/734690
57. Lin K, Yee-Tak Fong D, Zhu B, Karlberg J. Environmental factors on the SARS epidemic: air temperature, passage of time and multiplicative effect of hospital infection. Epidemiol Infect. (2006) 134:223–30. doi: 10.1017/S0950268805005054
58. Rodriguez-Palacios A, Mo KQ, Shah BU, Msuya J, Bijedic N, Deshpande A, et al. Global and historical distribution of in the human diet (1981-2019): systematic review and meta-analysis of 21886 samples reveal sources of heterogeneity, high-risk foods, and unexpected higher prevalence toward the tropic. Front Med. (2020) 7:9. doi: 10.3389/fmed.2020.00009
Keywords: the reproduction number, incubation, infectious period, fatality, mathematical model
Citation: Lin Y-F, Duan Q, Zhou Y, Yuan T, Li P, Fitzpatrick T, Fu L, Feng A, Luo G, Zhan Y, Liang B, Fan S, Lu Y, Wang B, Wang Z, Zhao H, Gao Y, Li M, Chen D, Chen X, Ao Y, Li L, Cai W, Du X, Shu Y and Zou H (2020) Spread and Impact of COVID-19 in China: A Systematic Review and Synthesis of Predictions From Transmission-Dynamic Models. Front. Med. 7:321. doi: 10.3389/fmed.2020.00321
Received: 26 March 2020; Accepted: 02 June 2020;
Published: 18 June 2020.
Edited by:
Alexander Rodriguez-Palacios, School of Medicine, Case Western Reserve University, United StatesReviewed by:
Shi Zhao, The Chinese University of Hong Kong, ChinaSanja Ilic, The Ohio State University, United States
Copyright © 2020 Lin, Duan, Zhou, Yuan, Li, Fitzpatrick, Fu, Feng, Luo, Zhan, Liang, Fan, Lu, Wang, Wang, Zhao, Gao, Li, Chen, Chen, Ao, Li, Cai, Du, Shu and Zou. This is an open-access article distributed under the terms of the Creative Commons Attribution License (CC BY). The use, distribution or reproduction in other forums is permitted, provided the original author(s) and the copyright owner(s) are credited and that the original publication in this journal is cited, in accordance with accepted academic practice. No use, distribution or reproduction is permitted which does not comply with these terms.
*Correspondence: Huachun Zou, zouhuachun@mail.sysu.edu.cn; Yuelong Shu, shuylong@mail.sysu.edu.cn
†These authors have contributed equally to this work