
Associations between Food Preferences, Food Approach, and Food Avoidance in a Polish Adolescents’ COVID-19 Experience (PLACE-19) Study Population


Abstract
:1. Introduction
2. Materials and Methods
2.1. Ethical Statement
2.2. Studied Population
- −
- Students of the sampled school,
- −
- Aged 15–20 years,
- −
- Providing informed consent to participate in the PLACE-19 Study, as well as informed consent of parents/legal guardians.
- −
- The exclusion criteria were formulated as follows:
- −
- Any missing or unreliable data in the questionnaire,
- −
- For the participants of the second phase of the PLACE-19 Study (assessment of nutritional behaviors): not participating in the first phase of the PLACE-19 Study (assessment of hygienic and personal protective behaviors).
2.3. Applied Questionnaires
2.4. Statistical Analysis
3. Results
4. Discussion
5. Conclusions
Author Contributions
Funding
Institutional Review Board Statement
Informed Consent Statement
Conflicts of Interest
References
- World Health Organization (WHO). Nutrition in Adolescence—Issues and Challenges for the Health Sector Issues in Adolescent Health and Development. Available online: https://apps.who.int/iris/bitstream/handle/10665/43342/9241593660_eng.pdf?sequence=1&isAllowed=y (accessed on 18 May 2021).
- Azar, K.M.J.; Halley, M.; Lv, N.; Wulfovich, S.; Gillespie, K.; Liang, L.; Goldman Rosas, L. Differing views regarding diet and physical activity: Adolescents versus parents’ perspectives. BMC Pediatr. 2020, 20, 137. [Google Scholar] [CrossRef] [PubMed]
- Story, M.; Neumark-Sztainer, D.; French, S. Individual and Environmental Influences on Adolescent Eating Behaviors. J. Am. Diet. Assoc. 2002, 102, 40–51. [Google Scholar] [CrossRef]
- Qiu, C.; Hou, M. Association between Food Preferences, Eating Behaviors and Socio-Demographic Factors, Physical Activity among Children and Adolescents: A Cross-Sectional Study. Nutrients 2020, 12, 640. [Google Scholar] [CrossRef] [Green Version]
- Lanfer, A.; Knof, K.; Barba, G.; Veidebaum, T.; Papoutsou, S.; de Henauw, S.; Soós, T.; Moreno, L.A.; Ahrens, W.; Lissner, L. Taste preferences in association with dietary habits and weight status in European children: Results from the IDEFICS study. Int. J. Obes. 2012, 36, 27–34. [Google Scholar] [CrossRef] [PubMed] [Green Version]
- Beckerman, J.P.; Alike, Q.; Lovin, E.; Tamez, M.; Mattei, J. The Development and Public Health Implications of Food Preferences in Children. Front. Nutr. 2017, 4, 66. [Google Scholar] [CrossRef] [Green Version]
- Meiselman, H.L.; Bell, R. Eating Habits. In Encyclopedia of Food Sciences and Nutrition, 2nd ed.; 2003; Available online: https://www.sciencedirect.com/referencework/9780122270550/encyclopedia-of-food-sciences-and-nutrition#book-description (accessed on 18 May 2021).
- Mennella, J.A. Development of food preferences: Lessons learned from longitudinal and experimental studies. Food Qual. Prefer. 2006, 17, 635–637. [Google Scholar] [CrossRef] [Green Version]
- Nicklaus, S.; Boggio, V.; Chabanet, C.; Issanchou, S. A prospective study of food preferences in childhood. Food Qual. Prefer. 2004, 15, 805–818. [Google Scholar] [CrossRef]
- Laviano, A.; Di Lazzaro, L.; Koverech, A. Changes in eating behavior, taste and food preferences and the effects of gastrointestinal hormones. Clin. Nutr. Exp. 2018, 20, 65–70. [Google Scholar] [CrossRef]
- Syrad, H.; Johnson, L.; Wardle, J.; Llewellyn, C.H. Appetitive traits and food intake patterns in early life. Am. J. Clin. Nutr. 2016, 103, 231–235. [Google Scholar] [CrossRef] [Green Version]
- Carnell, S.; Benson, L.; Pryor, K.; Driggin, E. Appetitive traits from infancy to adolescence: Using behavioral and neural measures to investigate obesity risk. Physiol. Behav. 2013, 121, 79–88. [Google Scholar] [CrossRef] [Green Version]
- Hunot, C.; Fildes, A.; Croker, H.; Llewellyn, C.H.; Wardle, J.; Beeken, R.J. Appetitive traits and relationships with BMI in adults: Development of the Adult Eating Behaviour Questionnaire. Appetite 2016, 105, 356–363. [Google Scholar] [CrossRef] [Green Version]
- Fildes, A.; Mallan, K.M.; Cooke, L.; Van Jaarsveld, C.H.M.; Llewellyn, C.H.; Fisher, A.; Daniels, L. The relationship between appetite and food preferences in British and Australian children. Int. J. Behav. Nutr. Phys. Act. 2015, 12, 116. [Google Scholar] [CrossRef] [PubMed] [Green Version]
- Russell, C.G.; Worsley, T. Associations between appetitive traits and food preferences in preschool children. Food Qual. Prefer. 2016, 52, 172–178. [Google Scholar] [CrossRef]
- Laguna, L.; Fiszman, S.; Puerta, P.; Chaya, C.; Tárrega, A. The impact of COVID-19 lockdown on food priorities. Results from a preliminary study using social media and an online survey with Spanish consumers. Food Qual. Prefer. 2020, 86, 104028. [Google Scholar] [CrossRef]
- Coakley, K.E.; Le, H.; Silva, S.R.; Wilks, A. Anxiety is associated with appetitive traits in university students during the COVID-19 pandemic. Nutr. J. 2021, 20, 45. [Google Scholar] [CrossRef] [PubMed]
- Ioannidis, J.P.A. Global perspective of COVID-19 epidemiology for a full-cycle pandemic. Eur. J. Clin. Investig. 2020, 50, 13423. [Google Scholar] [CrossRef]
- Zeng, X. Conducting Research during the COVID-19 Pandemic: How Scientific Community Should be Prepared? Neurospine 2020, 17, 351–353. [Google Scholar] [CrossRef]
- Głąbska, D.; Skolmowska, D.; Guzek, D. Population-Based Study of the Influence of the COVID-19 Pandemic on Hand Hygiene Behaviors—Polish Adolescents’ COVID-19 Experience (PLACE-19) Study. Sustainability 2020, 12, 4930. [Google Scholar] [CrossRef]
- Guzek, D.; Skolmowska, D.; Głąbska, D. Analysis of Gender-Dependent Personal Protective Behaviors in a National Sample: Polish Adolescents’ COVID-19 Experience (PLACE-19) Study. Int. J. Environ. Res. Public Health 2020, 17, 5770. [Google Scholar] [CrossRef]
- Skolmowska, D.; Głąbska, D.; Guzek, D. Hand Hygiene Behaviors in a Representative Sample of Polish Adolescents in Regions Stratified by COVID-19 Morbidity and by Confounding Variables (PLACE-19 Study): Is There Any Association? Pathogens 2020, 9, 1011. [Google Scholar] [CrossRef]
- Głąbska, D.; Skolmowska, D.; Guzek, D. Population-Based Study of the Changes in the Food Choice Determinants of Secondary School Students: Polish Adolescents’ COVID-19 Experience (PLACE-19) Study. Nutrients 2020, 12, 2640. [Google Scholar] [CrossRef]
- Guzek, D.; Skolmowska, D.; Głąbska, D. Appetitive Traits in a Population-Based Study of Polish Adolescents within the PLACE-19 Study: Validation of the Adult Eating Behavior Questionnaire. Nutrients 2020, 12, 3889. [Google Scholar] [CrossRef] [PubMed]
- Skolmowska, D.; Głąbska, D.; Guzek, D. Differences in Adolescents’ Food Habits Checklist (AFHC) Scores before and during Pandemic in a Population-Based Sample: Polish Adolescents’ COVID-19 Experience (PLACE-19) Study. Nutrients 2021, 13, 1663. [Google Scholar] [CrossRef] [PubMed]
- Polish Ministry of National Education. Suspension of Classes in Schools. Available online: https://www.gov.pl/web/edukacja/zawieszenie-zajec-w-szkolach (accessed on 15 May 2021).
- Smith, A.D.; Fildes, A.; Cooke, L.; Herle, M.; Shakeshaft, N.; Plomin, R.; Llewellyn, C. Genetic and environmental influences on food preferences in adolescence. Am. J. Clin. Nutr. 2016, 104, 446–453. [Google Scholar] [CrossRef] [Green Version]
- Wardle, J.; Sanderson, S.; Gibson, E.L.; Rapoport, L. Factor-analytic structure of food preferences in four-year-old children in the UK. Appetite 2001, 37, 217–223. [Google Scholar] [CrossRef] [PubMed]
- Food Preference Questionnaire for Adolescents and Adults. Available online: https://www.ucl.ac.uk/epidemiology-health-care/sites/epidemiology-health-care/files/FPQ.pdf (accessed on 18 May 2021).
- Grabusts, P. The Choice of Metrics for Clustering Algorithms. Proceedings of the 8th International Scientific and Practical Conference. Available online: http://zdb.ru.lv/conferences/3/VTR8_II_70.pdf (accessed on 20 June 2021).
- Hunot-Alexander, C.; Beeken, R.J.; Goodman, W.; Fildes, A.; Croker, H.; Llewellyn, C.; Steinsbekk, S. Confirmation of the Factor Structure and Reliability of the ‘Adult Eating Behavior Questionnaire’ in an Adolescent Sample. Front. Psychol. 2019, 10, 1991. [Google Scholar] [CrossRef] [Green Version]
- Carnell, S.; Wardle, J. Measuring behavioural susceptibility to obesity: Validation of the child eating behaviour questionnaire. Appetite 2007, 48, 104–113. [Google Scholar] [CrossRef]
- Mallan, K.M.; Fildes, A.; de la Piedad Garcia, X.; Drzezdzon, J.; Sampson, M.; Llewellyn, C. Appetitive traits associated with higher and lower body mass index: Evaluating the validity of the adult eating behaviour questionnaire in an Australian sample. Int. J. Behav. Nutr. Phys. Act. 2017, 14, 130. [Google Scholar] [CrossRef] [Green Version]
- Ashcroft, J.; Semmler, C.; Carnell, S.; Van Jaarsveld, C.H.; Wardle, J. Continuity and stability of eating behaviour traits in children. Eur. J. Clin. Nutr. 2008, 62, 985–990. [Google Scholar] [CrossRef] [PubMed] [Green Version]
- Dovey, T.M.; Staples, P.A.; Gibson, E.L.; Halford, J.C. Food neophobia and ‘picky/fussy’ eating in children: A review. Appetite 2008, 50, 181–193. [Google Scholar] [CrossRef]
- Cooke, L.J.; Wardle, J.; Gibson, E.L.; Sapochnik, M.; Sheiham, A.; Lawson, M. Demographic, familial and trait predictors of fruit and vegetable consumption by pre-school children. Public Health Nutr. 2004, 7, 295–302. [Google Scholar] [CrossRef] [PubMed]
- Taylor, C.M.; Emmett, P.M. Picky eating in children: Causes and consequences. Proc. Nutr. Soc. 2019, 78, 161–169. [Google Scholar] [CrossRef] [Green Version]
- World Health Organization (WHO). Increasing Fruit and Vegetable Consumption to Reduce the Risk of Noncommunicable Diseases. Available online: https://www.who.int/elena/titles/fruit_vegetables_ncds/en/ (accessed on 18 May 2021).
- World Health Organization (WHO). Guideline: Implementing Effective Actions. For Improving Adolescent Nutrition. Available online: https://apps.who.int/iris/bitstream/handle/10665/260297/9789241513708-eng.pdf (accessed on 18 May 2021).
- Bawajeeh, A.O.; Albar, S.A.; Zhang, H.; Zulyniak, M.A.; Evans, C.E.L.; Cade, J.E. Impact of Taste on Food Choices in Adolescence-Systematic Review and Meta-Analysis. Nutrients 2020, 12, 1985. [Google Scholar] [CrossRef] [PubMed]


| Variable | Number of Participants | % of the Studied Population | |
|---|---|---|---|
| Sex | Female | 1552 | 63.4 |
| Male | 896 | 36.6 | |
| Age (years) | 15 | 297 | 12.1 |
| 16 | 755 | 30.8 | |
| 17 | 799 | 32.6 | |
| 18 | 445 | 18.2 | |
| 19 | 139 | 5.7 | |
| 20 | 13 | 0.5 | |
| Food Category | Mean ± SD | Median | 25th Quartile | 75th Quartile |
|---|---|---|---|---|
| Vegetable | 3.7 ± 0.7 | 3.8 | 3.2 | 4.3 |
| Fruit | 4.3 ± 0.8 | 4.6 | 4.0 | 5.0 |
| Meat/fish | 3.4 ± 0.8 | 3.5 | 2.9 | 4.0 |
| Dairy | 3.7 ± 0.7 | 3.8 | 3.2 | 4.2 |
| Snacks | 4.2 ± 0.8 | 4.3 | 3.8 | 4.8 |
| Starches | 4.0 ± 0.8 | 4.2 | 3.7 | 4.7 |
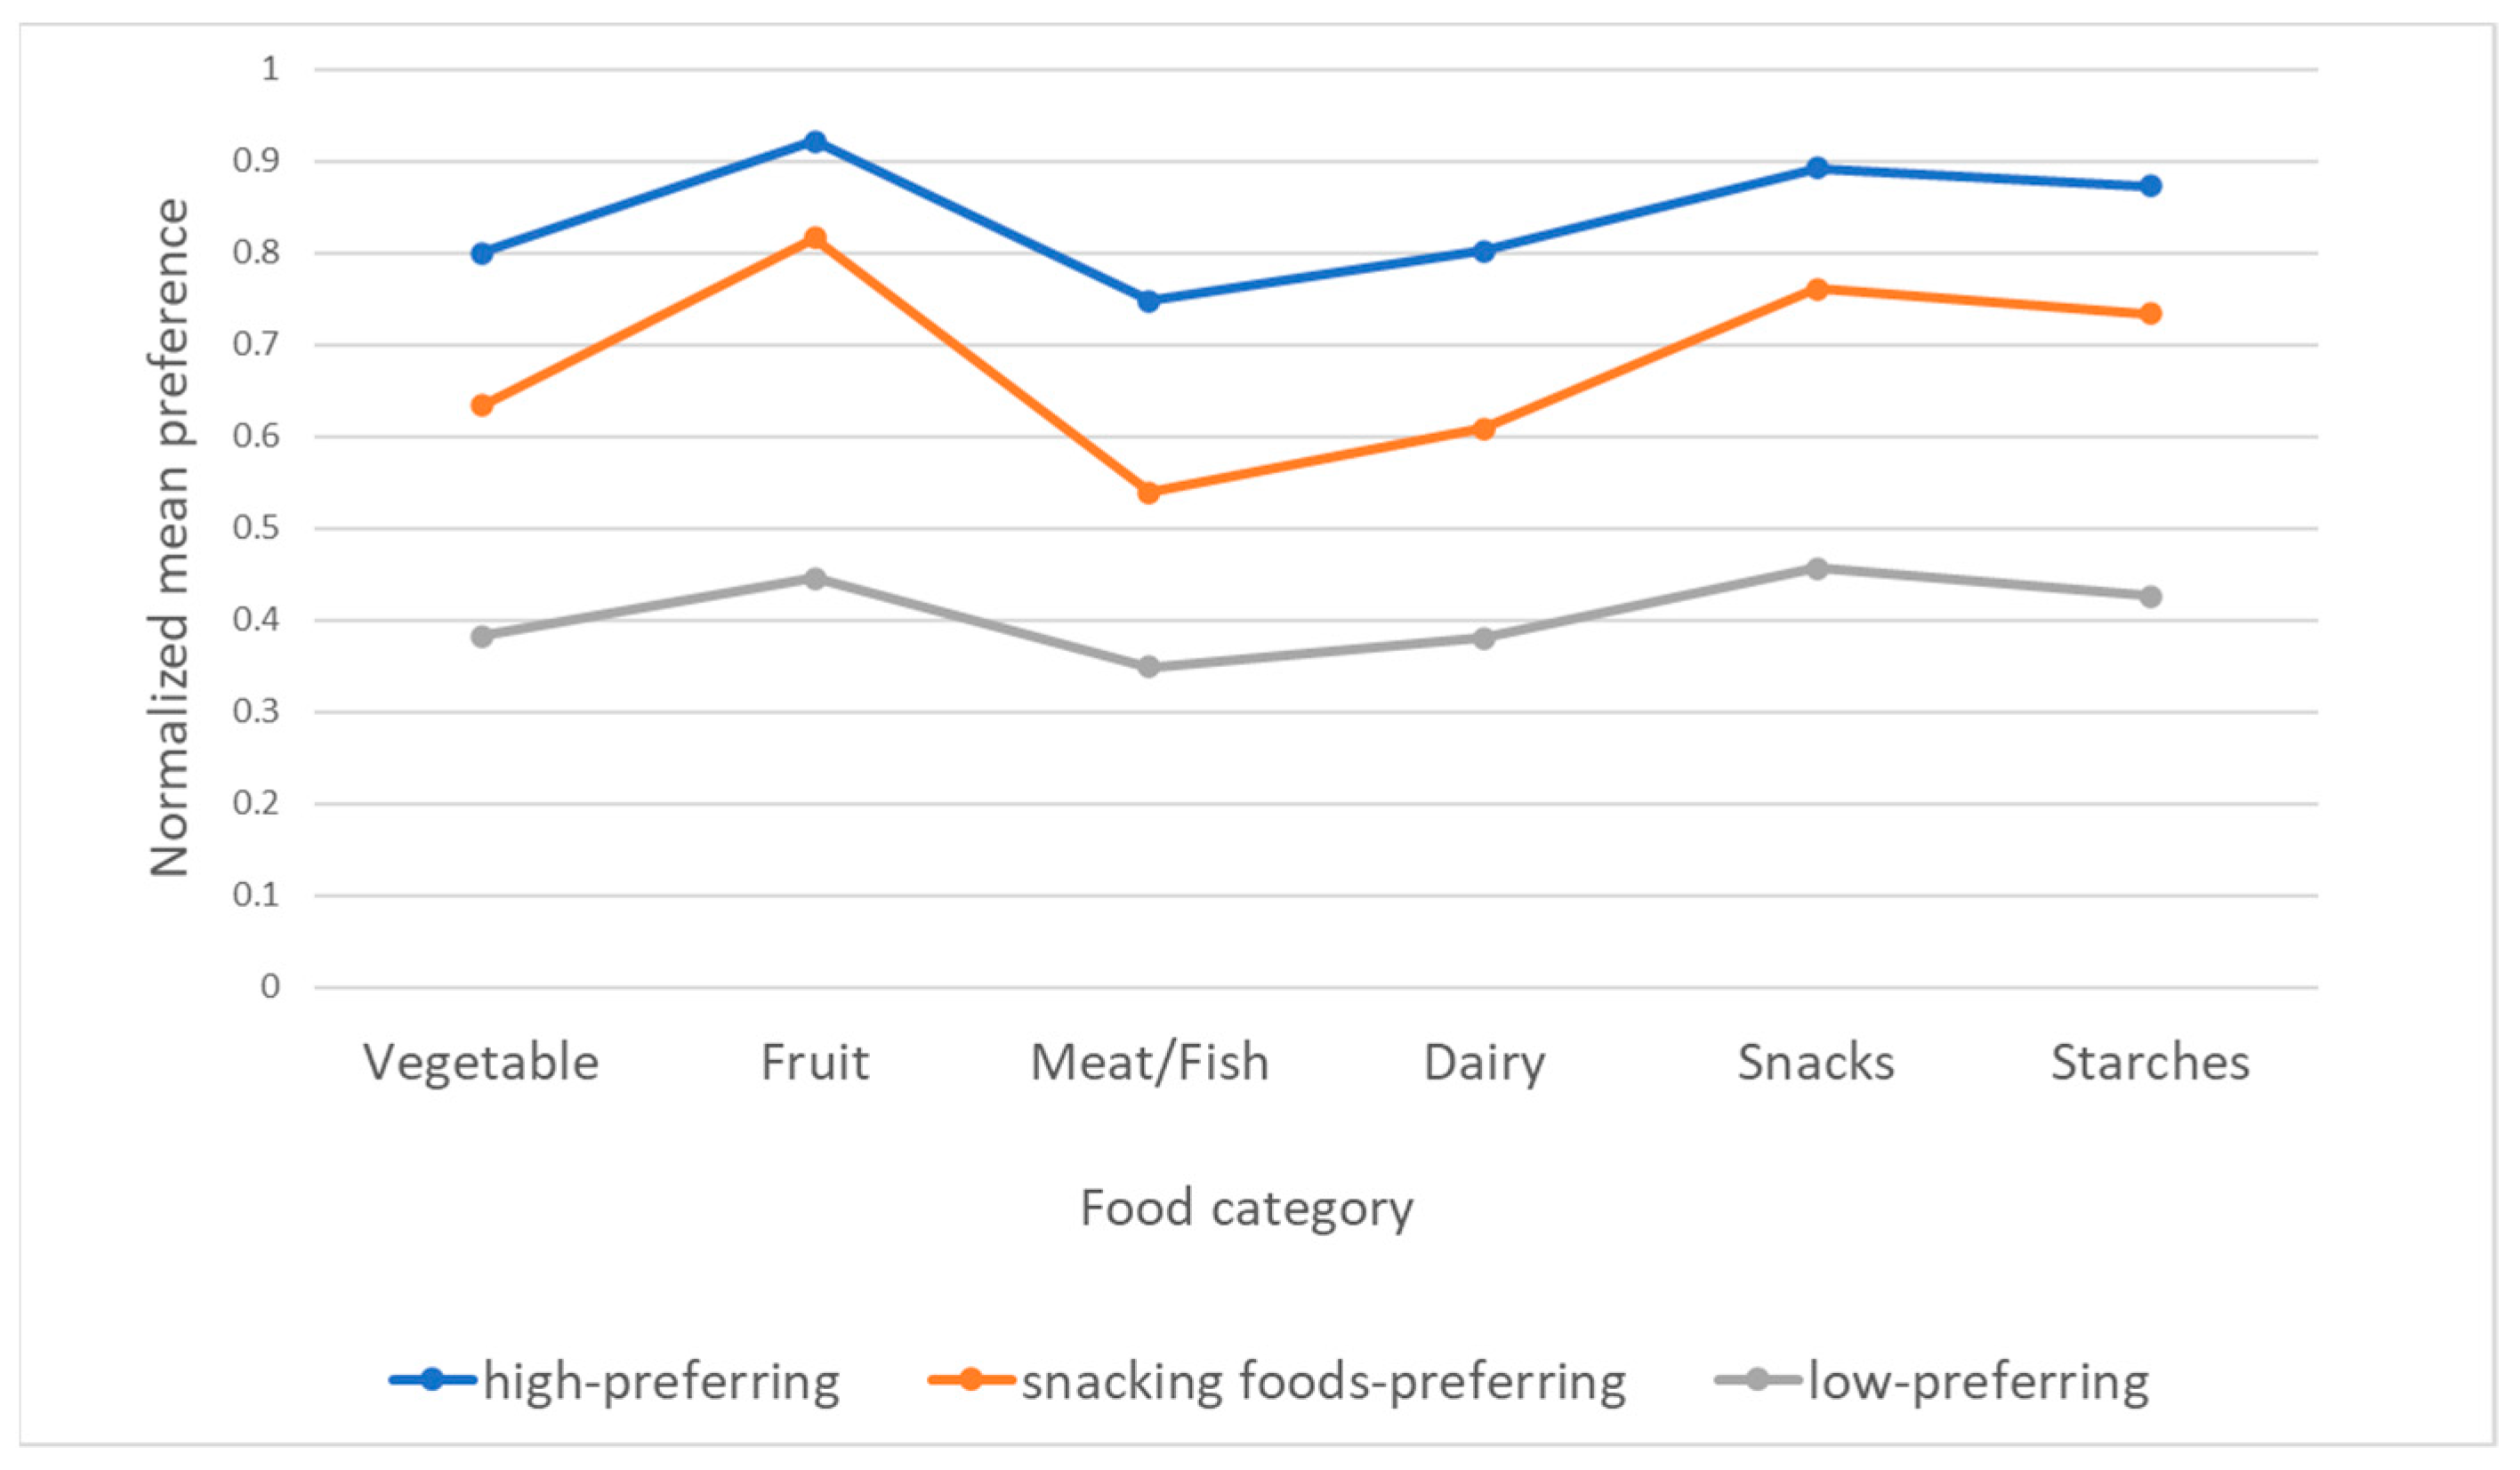
| Food Category | Cluster 1 (Low-Preferring) (n = 270) | Cluster 2 (Snacking Foods-Preferring) (n = 1109) | Cluster 3 (High-Preferring) (n = 1040) | |||
|---|---|---|---|---|---|---|
| Vegetable | 2.5 ± 0.6 | 2.5 (2.1–2.9) | 3.5 ± 0.6 | 3.6 (3.2–3.9) | 4.2 ± 0.5 | 4.2 (3.9–4.6) |
| Fruit | 2.8 ± 0.8 | 3.0 (2.1–3.0) | 4.3 ± 0.6 | 4.3 (4.0–4.8) | 4.7 ± 0.4 | 4.9 (4.6–5.0) |
| Meat/fish | 2.4 ± 0.7 | 2.3 (1.9–2.9) | 3.2 ± 0.7 | 3.3 (2.8–3.6) | 4.0 ± 0.6 | 4.0 (3.6–4.4) |
| Dairy | 2.5 ± 0.6 | 2.6 (2.1–2.9) | 3.4 ± 0.5 | 3.4 (3.1–3.8) | 4.2 ± 0.5 | 4.2 (3.9–4.6) |
| Snacks | 2.8 ± 0.7 | 2.9 (2.4–3.1) | 4.1 ± 0.6 | 4.1 (3.8–4.6) | 4.6 ± 0.5 | 4.8 (4.3–5.0) |
| Starches | 2.7 ± 0.7 | 2.8 (2.2–3.0) | 3.9 ± 0.6 | 4.0 (3.7–4.3) | 4.5 ± 0.5 | 4.5 (4.2–4.8) |
| Appetitive Traits | Cluster 1 (Low-Preferring) (n = 270) | Cluster 2 (Snacking Foods-Preferring) (n = 1109) | Cluster 3 (High-Preferring) (n = 1040) | p | |||
|---|---|---|---|---|---|---|---|
| Food approach subscales | |||||||
| Hunger (H) | 2.3 ± 0.5 | 2.0 (2.0–2.4) a | 2.5 ± 0.6 | 2.4 (2.0–2.8) b | 2.5 ± 0.6 | 2.4 (2.0–2.8) b | 0.0008 |
| Food responsiveness (FR) | 2.3 ± 0.6 | 2.0 (2.0–2.5) a | 2.8 ± 0.6 | 2.8 (2.5–3.3) b | 3.0 ± 0.7 | 3.0 (2.5–3.3) c | 0.0008 |
| Emotional over-eating (EOE) | 2.6 ± 0.3 | 2.6 (2.4–2.6) a | 2.8 ± 0.6 | 2.6 (2.4–3.0) b | 2.8 ± 0.6 | 2.6 (2.4–3.0) b | 0.0008 |
| Enjoyment of food (EF) | 2.5 ± 0.8 | 2.0 (2.0–3.0) a | 3.6 ± 0.8 | 3.7 (3.0–4.0) b | 3.9 ± 0.8 | 4.0 (3.3–4.3) c | 0.0008 |
| Food avoidance subscales | |||||||
| Satiety responsiveness (SR) | 2.5 ± 0.8 | 2.0 (2.0–3.0) a | 3.0 ± 0.7 | 3.0 (2.5–3.5) b | 2.8 ± 0.7 | 2.8 (2.3–3.3) c | 0.0008 |
| Emotional under-eating (EUE) | 2.5 ± 0.8 | 2.0 (2.0–2.8) a | 2.9 ± 0.8 | 2.6 (2.0–3.4) b | 2.8 ± 0.8 | 2.6 (2.0–3.2) c | 0.0008 |
| Food fussiness (FF) | 3.2 ± 0.5 | 3.2 (3.2–3.2) a | 2.8 ± 0.8 | 2.8 (2.2–3.4) b | 2.4 ± 0.7 | 2.2 (1.8–2.8) c | 0.0008 |
| Slowness in eating (SE) | 2.8 ± 0.6 | 2.5 (2.5–3.0) a | 3.0 ± 0.8 | 3.0 (2.5–3.5) b | 2.9 ± 0.8 | 2.8 (2.3–3.5) c | 0.0008 |
| Total | 2.6 ± 0.4 | 2.3 (2.3–2.9) a | 2.9 ± 0.3 | 2.9 (2.7–3.1) b | 2.8 ± 0.3 | 2.8 (2.6–3.0) c | 0.0001 |
| Appetitive Traits | Unstandardized Coefficients | Standardized Coefficients β | p | R | R2 | |
|---|---|---|---|---|---|---|
| β | SE | |||||
| Hunger (H) | 0.108 | 0.025 | 0.087 | 0.008 | 0.132 | 0.017 |
| Food responsiveness (FR) | 0.201 | 0.022 | 0.185 | 0.008 | 0.210 | 0.044 |
| Emotional over-eating (EOE) | 0.118 | 0.026 | 0.092 | 0.008 | 0.135 | 0.018 |
| Enjoyment of food (EF) | 0.258 | 0.015 | 0.321 | 0.008 | 0.336 | 0.113 |
| Satiety responsiveness (SR) | 0.014 | 0.021 | 0.014 | 1.000 | 0.101 | 0.010 |
| Emotional under-eating (EUE) | 0.060 | 0.018 | 0.070 | 0.008 | 0.121 | 0.015 |
| Food fussiness (FF) | −0.427 | 0.017 | −0.459 | 0.008 | 0.469 | 0.220 |
| Slowness in eating (SE) | 0.058 | 0.019 | 0.062 | 0.024 | 0.117 | 0.014 |
| Appetitive Traits | Unstandardized Coefficients | Standardized Coefficients β | p | R | R2 | |
|---|---|---|---|---|---|---|
| β | SE | |||||
| Hunger (H) | 0.082 | 0.023 | 0.075 | 0.008 | 0.096 | 0.009 |
| Food responsiveness (FR) | 0.183 | 0.020 | 0.189 | 0.008 | 0.197 | 0.039 |
| Emotional over-eating (EOE) | 0.031 | 0.024 | 0.027 | 1.000 | 0.065 | 0.004 |
| Enjoyment of food (EF) | 0.197 | 0.015 | 0.269 | 0.008 | 0.275 | 0.076 |
| Satiety responsiveness (SR) | 0.102 | 0.019 | 0.112 | 0.008 | 0.125 | 0.016 |
| Emotional under-eating (EUE) | 0.056 | 0.016 | 0.073 | 0.008 | 0.093 | 0.009 |
| Food fussiness (FF) | −0.226 | 0.017 | −0.272 | 0.008 | 0.278 | 0.077 |
| Slowness in eating (SE) | 0.027 | 0.017 | 0.033 | 0.960 | 0.068 | 0.005 |
| Appetitive Traits | Unstandardized Coefficients | Standardized Coefficients β | p | R | R2 | |
|---|---|---|---|---|---|---|
| β | SE | |||||
| Hunger (H) | 0.126 | 0.028 | 0.088 | 0.008 | 0.278 | 0.077 |
| Food responsiveness (FR) | 0.250 | 0.024 | 0.201 | 0.008 | 0.332 | 0.110 |
| Emotional over-eating (EOE) | 0.038 | 0.029 | 0.026 | 1.000 | 0.265 | 0.070 |
| Enjoyment of food (EF) | 0.331 | 0.017 | 0.361 | 0.008 | 0.446 | 0.199 |
| Satiety responsiveness (SR) | 0.032 | 0.024 | 0.027 | 1.000 | 0.265 | 0.070 |
| Emotional under-eating (EUE) | 0.058 | 0.020 | 0.059 | 0.032 | 0.270 | 0.073 |
| Food fussiness (FF) | −0.373 | 0.020 | −0.349 | 0.008 | 0.437 | 0.191 |
| Slowness in eating (SE) | 0.040 | 0.021 | 0.038 | 0.472 | 0.267 | 0.071 |
| Appetitive Traits | Unstandardized Coefficients | Standardized Coefficients β | p | R | R2 | |
|---|---|---|---|---|---|---|
| β | SE | |||||
| Hunger (H) | 0.190 | 0.025 | 0.152 | 0.008 | 0.209 | 0.044 |
| Food responsiveness (FR) | 0.278 | 0.021 | 0.254 | 0.008 | 0.291 | 0.085 |
| Emotional over-eating (EOE) | 0.098 | 0.026 | 0.076 | 0.008 | 0.162 | 0.026 |
| Enjoyment of food (EF) | 0.287 | 0.015 | 0.354 | 0.008 | 0.382 | 0.146 |
| Satiety responsiveness (SR) | 0.036 | 0.021 | 0.035 | 0.720 | 0.148 | 0.022 |
| Emotional under-eating (EUE) | 0.059 | 0.018 | 0.069 | 0.008 | 0.158 | 0.025 |
| Food fussiness (FF) | −0.249 | 0.018 | −0.264 | 0.008 | 0.300 | 0.090 |
| Slowness in eating (SE) | 0.031 | 0.019 | 0.033 | 0.832 | 0.147 | 0.022 |
| Appetitive Traits | Unstandardized Coefficients | Standardized Coefficients β | p | R | R2 | |
|---|---|---|---|---|---|---|
| β | SE | |||||
| Hunger (H) | 0.182 | 0.023 | 0.164 | 0.008 | 0.172 | 0.030 |
| Food responsiveness (FR) | 0.312 | 0.019 | 0.318 | 0.008 | 0.322 | 0.103 |
| Emotional over-eating (EOE) | 0.084 | 0.024 | 0.074 | 0.008 | 0.092 | 0.009 |
| Enjoyment of food (EF) | 0.296 | 0.014 | 0.399 | 0.008 | 0.403 | 0.162 |
| Satiety responsiveness (SR) | 0.070 | 0.020 | 0.075 | 0.008 | 0.093 | 0.009 |
| Emotional under-eating (EUE) | 0.034 | 0.016 | 0.044 | 0.328 | 0.070 | 0.005 |
| Food fussiness (FF) | −0.075 | 0.017 | −0.089 | 0.008 | 0.105 | 0.011 |
| Slowness in eating (SE) | 0.012 | 0.018 | 0.014 | 1.000 | 0.058 | 0.003 |
| Appetitive Traits | Unstandardized Coefficients | Standardized Coefficients β | p | R | R2 | |
|---|---|---|---|---|---|---|
| β | SE | |||||
| Hunger (H) | 0.112 | 0.025 | 0.093 | 0.008 | 0.099 | 0.010 |
| Food responsiveness (FR) | 0.199 | 0.021 | 0.189 | 0.008 | 0.191 | 0.036 |
| Emotional over-eating (EOE) | 0.122 | 0.025 | 0.099 | 0.008 | 0.103 | 0.011 |
| Enjoyment of food (EF) | 0.233 | 0.015 | 0.297 | 0.008 | 0.298 | 0.089 |
| Satiety responsiveness (SR) | 0.076 | 0.021 | 0.077 | 0.008 | 0.082 | 0.007 |
| Emotional under-eating (EUE) | 0.080 | 0.017 | 0.098 | 0.008 | 0.100 | 0.010 |
| Food fussiness (FF) | −0.191 | 0.018 | −0.213 | 0.008 | 0.215 | 0.046 |
| Slowness in eating (SE) | 0.022 | 0.019 | 0.025 | 1.000 | 0.041 | 0.002 |
Publisher’s Note: MDPI stays neutral with regard to jurisdictional claims in published maps and institutional affiliations. |
© 2021 by the authors. Licensee MDPI, Basel, Switzerland. This article is an open access article distributed under the terms and conditions of the Creative Commons Attribution (CC BY) license (https://creativecommons.org/licenses/by/4.0/).
Share and Cite
Guzek, D.; Skolmowska, D.; Głąbska, D. Associations between Food Preferences, Food Approach, and Food Avoidance in a Polish Adolescents’ COVID-19 Experience (PLACE-19) Study Population. Nutrients 2021, 13, 2427. https://doi.org/10.3390/nu13072427
Guzek D, Skolmowska D, Głąbska D. Associations between Food Preferences, Food Approach, and Food Avoidance in a Polish Adolescents’ COVID-19 Experience (PLACE-19) Study Population. Nutrients. 2021; 13(7):2427. https://doi.org/10.3390/nu13072427
Chicago/Turabian StyleGuzek, Dominika, Dominika Skolmowska, and Dominika Głąbska. 2021. "Associations between Food Preferences, Food Approach, and Food Avoidance in a Polish Adolescents’ COVID-19 Experience (PLACE-19) Study Population" Nutrients 13, no. 7: 2427. https://doi.org/10.3390/nu13072427